precursory activity and evolution of the 2011 eruption of ... · shinmoe-dake is one volcano in the...
TRANSCRIPT

Earth Planets Space, 65, 591–607, 2013
Precursory activity and evolution of the 2011 eruption of Shinmoe-dakein Kirishima volcano—insights from ash samples
Yuki Suzuki1, Masashi Nagai2, Fukashi Maeno1, Atsushi Yasuda1, Natsumi Hokanishi1, Taketo Shimano3,Mie Ichihara1, Takayuki Kaneko1, and Setsuya Nakada1
1Earthquake Research Institute, University of Tokyo, 1-1-1, Yayoi, Bunkyo-ku, Tokyo 113-0032, Japan2National Research Institute for Earth Science and Disaster Prevention, 3-1, Tennodai, Tsukuba, Ibaraki 305-0006, Japan
3Graduate School of Environment and Disaster Research, Fuji Tokoha University, 325, Obuchi, Fuji, Shizuoka 417-0801, Japan
(Received October 30, 2012; Revised February 13, 2013; Accepted February 17, 2013; Online published July 8, 2013)
After a precursory phreatic stage (2008 to 2010), the 2011 Shinmoe-dake eruption entered a phreatomagmaticstage on January 19, a sub-Plinian and lava accumulation stage at the end of January, a vulcanian stage inFebruary–April, and a second phreatomagmatic stage in June–August. Component ratio, bulk composition, andparticle size of the samples helped us define the eruptive stages. The juvenile particles were first found in theJanuary 19 sample as pumice (8 vol%) and were consistently present as scoria and pumice particles thereafter(generally ∼50 vol%, decreasing in weaker events). The January 19 pumice has water-quench texture. Afterthe lava accumulation, particles of that lava origin came to account for 30∼70 vol% of the ash. The secondphreatomagmatic stage is proposed because of fine ash and long eruption period. The SiO2 contents of bulk ashare lower in post-January 19, 2011 eruptions, reflecting lower average SiO2 contents in 2011 ejecta than in pastejecta. The free-crystal assemblages were two pyroxenes + plagioclase + Fe-Ti oxides until 2010; olivine joinedthe assemblage in 2011, when juvenile ash was erupted. This change is consistent with the absence or smallersizes of olivine phenocrysts in past ejecta.Key words: Volcanic ash, Shinmoe-dake, bulk ash composition, component ratio, particle size distribution.
1. IntroductionAsh characterization is an important method for mon-
itoring ongoing eruptive activity and forecasting activitychange (Nakada et al., 1995 for Unzen volcano; Hataeet al., 1997 for Kuju volcano; Taddeucci et al., 2002 forMt. Etna; Ikebe et al., 2008 and Miyabuchi et al., 2008for Nakadake, Aso volcano; Rowe et al., 2008 for MountSt. Helens). The main characteristic to be investigated forthis purpose is the abundance and nature of juvenile mate-rial. In a situation where magmatic eruption has not be-gun after onset of an eruptive activity the first detectionof juvenile material means that magma is rising to shal-low depth. One successful example was the 1991 Unzeneruption, when juvenile material was detected in a seriesof ash samples before lava appeared (Nakada et al., 1995).Once a large-scale magmatic eruption takes place, proxi-mal zones at the volcano often have restricted access evenif eruptive activity becomes less intensive than before. Atsuch a time, ash could be continuously sampled in safer dis-tal zones, allowing the tracking of eruptive activity. At thesame time, juvenile material helps us judge the involvementof external water in eruptions, as magma-water interactionis recorded in surface morphology and texture of juvenilematerial (Miyabuchi and Ikebe, 2008; Austin-Erickson et
Copyright c© The Society of Geomagnetism and Earth, Planetary and Space Sci-ences (SGEPSS); The Seismological Society of Japan; The Volcanological Societyof Japan; The Geodetic Society of Japan; The Japanese Society for Planetary Sci-ences; TERRAPUB.
doi:10.5047/eps.2013.02.004
al., 2008).Aside from examining juvenile material and related
petrological and textural investigations (Taddeucci et al.,2004), another benefit of monitoring ash production comesfrom study of the accessory material, i.e., the ash parti-cles derived from the volcanic edifice. Such material givesinsights into the crater-conduit system, including the hy-drothermal system (Ohba and Kitade, 2005). Taking Showacrater of Sakurajima volcano as an example, Miyagi et al.(2010) showed growth and disappearance of a shallow alter-ation zone whose growth was promoted by fluids associatedwith newly intruded magma. Also, lava emplacement canbe recognized as a kind of volcanic edifice modification. Inthe 2004–2005 eruption of Mount St. Helens, ash sampleswere found to include fragments of lava newly emplaced inthat eruptive activity (Rowe et al., 2008). Because of abovedevelopments in ash studies, it is increasingly important forall volcanologists to realize the importance and potentialsof studying ash samples as described above.
We studied a series of Shinmoe-dake ash samples fromthe 2011 eruptive activity (January to August) and its pre-cursory period (August 2008 to June 2010). Our focus hereis not chemical characterization of juvenile material, whichis separately reported in Suzuki et al. (2013). The data setspresented are component ratio, bulk ash composition, andparticle size distribution. Bulk ash composition changesdepend on proportions of ash constituents (Shimano et al.,2001), while particle size distribution sometimes can bean indicator of magma-water interaction (Morrissey et al.,
591

592 Y. SUZUKI et al.: 2008 TO 2011 ERUPTIONS—INSIGHTS FROM ASH
Fig. 1. Shinmoe-dake volcano in Kirishima volcano group and sampling sites. (a) Kirishima volcano group in Kyushu island, Japan, together withanother Quaternary volcanoes. (b) Shinmoe-dake and another representative volcanoes in Kirishima volcano group including maars and crater lakes,along with major roads. Black squares with numbers indicate sampling sites (Site No. 1–26; also shown Table 1). Sites No. 10 and 11 are shown in(a). For isopleth maps of each event, see Nakada et al. (2013).
2000). The data sets, such as presence and absence of juve-nile material, morphology of juvenile material and particlesize distribution, partly constrain some eruptive stages pro-posed in Nakada et al. (2013). Furthermore, we show thatthe bulk ash composition and free-crystal ash componentchange at the onset of magmatic eruption in January 2011,because of the contrast between newly erupting magma andpast ejecta supplying accessory material. Although datasets presented in this paper are basic and partly preliminary(e.g. particle size distribution), the summary will be use-ful if Shinmoe-dake becomes active again. These data setsalso form a basis for future advanced studies, as describedabove. At the end of this paper, we again emphasize the im-portance of continuous observation of ash samples, takingsuccessful Shinmoe-dake case as an example.
2. Shinmoe-dake 2011 Eruption and Its Back-ground
Shinmoe-dake is one volcano in the Kirishima VolcanoGroup, southern Kyushu, Japan (Fig. 1). Eruptive activ-ity of Shinmoe-dake is reported in Imura and Kobayashi(1991), but partly modified in Tsutsui et al. (2005). Itsactivity started at an unknown time before eruption of theKobayashi pumice (16.7 cal ka BP) from Karakuni-dake(Fig. 1(b)). The present volcanic edifice of Shinmoe-dakeconsists of andesitic pyroclastic material interlayered withlava flows. Historical eruptions before 2008 occurred in1716–1717, 1822, 1959 and 1991. Eruptions other than thatin 1716–1717 were all phreatic. During the eruptive activityin 1716–1717 (Kyoho-eruption), multiple events repeatedwith pumice fall, base surge, pyroclastic flow and mud flow.The crater lava before the 2011 activity is believed to haveemplaced at the end of the Kyoho-eruption.
The following descriptions of the 2011 eruptive activityare based on JMA (Japan Meteorological Agency) reportsand Nakada et al. (2013), except where indicated. Time isin Japan standard time (JST). Here, we define phreatomag-
matic eruptions as including activities caused by weaklyenergetic interaction of magma and external water. Pre-cursory, small-scale phreatic eruptions occurred in August2008 and March to June 2010. In December 2009, infla-tion of the volcanic edifice began to accelerate, accompa-nying activation of seismicity (Oikawa et al., 2011; Yaki-wara et al., 2011). GPS data analyses by different groups,which were carried out after the January 2011 eruptions,commonly attributed the inflation to a spherical source 7.5km deep (GIAJ, 2012) or 9.2 km deep (Nakao et al., 2013)and 7–8 km NW of Shinmoe-dake.
The next phase of activity started on 19 January 2011with a phreatomagmatic eruption. Then, a series of mag-matic eruptions started on January 26, 2011. Activity in thisperiod was most intensive and most voluminous. Three sub-Plinian events occurred, starting at 14:49 on the 26th, about2:00 on the 27th, and 15:41 on the 27th. Each event lasted acouple of hours (Ichihara et al., 2012, http://outreach.eri.u-tokyo.ac.jp/eqvolc/201101 shinmoe/eng/#MTSAT). Thetotal tephra mass for the three events is 16–30 × 106 ton(DRE, 6.4–12×106 m3) (Maeno et al., 2012). Doppler radaranalyses showed echo heights of plumes reached 8.5 kma.s.l. in all of the three events (Shimbori and Fukui, 2012).The borehole tilt measurements recorded three synerup-tive step-wise deflations corresponding to each sub-Plinianevent (Ueda et al., 2013; source depth of 9.8 km located7–8 km NW of Shinmoe-dake). New lava dome was dis-covered in the crater in the morning of 28 January, but latersatellite-image analyses (e.g. Ando, 2012; Ozawa and Ko-zono, 2013) determined that lava emplacement had alreadystarted at 22:53 on the 27th. The lava dome grew rapidlyto have a diameter of 500 m by the evening of the 29th,filling the original crater (we thus call it accumulated lava).The lava volume stayed almost unchanged thereafter, reach-ing a final value of 14–18 × 106 m3 (Sasaki et al., 2011;GIAJ, 2012; Kozono et al., 2013). The lava emplacementwas accompanied by explosions, one of which occurred at

Y. SUZUKI et al.: 2008 TO 2011 ERUPTIONS—INSIGHTS FROM ASH 593
Table 1. Sampling conditions and purpose of use for ash samples.
12:47 on 28 January. Along with the borehole tilt measure-ment, the GPS network recorded rapid deflation during thesub-Plinian events and the lava accumulation. The defla-tion could be explained by almost the same sources as thepre-eruptive period but at a slightly shallower depth; 6.2km (GIAJ, 2012) and 8.4 km (Nakao et al., 2013). The to-tal volume of deflation is 11.7–15.2 × 10⁶ m3 (Nakao et al.,2013) or 10–11.8×10⁶ m3 (GIAJ, 2012). Inflation resurgedsoon after the end of January 2011.
The lava emplacement was followed by vulcanian explo-sions that ejected blocks of “the lava accumulated in Jan-uary” from the crater, along with ash. An explosion at 7:54on 1 February brought a lava block of 70 cm long (calcu-lated to be 1–3 ton; Maeno et al., 2013) to a location of3.2 km SW from the crater. The eruption after 9 Febru-ary became less frequent and discontinuous (5 times for therest of February, 7 times in March, 3 times in April). Aftertwo months repose, five phreatomagmatic eruptions wererecorded between the middle of June and early September.Inclusion of longer time events between June and Septem-ber compared with the previous stage (Table 1) is a rea-son not to recognize this period as vulcanian stage. At thetime of writing, no eruption has been noted since September2011. According to GPS data, inflation continued until De-cember 2011 at a similar rate to that during the pre-eruption
period (December 2009 to January 2011). Magma accumu-lation in the reservoir seems to have recovered to a similarlevel as was reached in January 2011.
3. SamplesThe samples and sampling conditions are summarized in
Table 1, and sampling sites are shown in Fig. 1. The exam-ined eruptions cover the entire 2011 eruptive activity (Jan-uary to August 2011) and its precursory stage (August 2008to June 2010). Plume heights in corresponding events arealso summarized in Table 1. We indicate each sample byeruption date, together with eruption time and site number,if necessary. Most samples were collected at the time ofdeposition or by the next day. Sampling sites are within10 km of Shinmoe-dake crater (Fig. 1(b)), except for twosites about 25 km from the crater (Fig. 1(a)). For erup-tions with multiple samples for ash distribution and totalvolume of ejecta (Nakada et al., 2013), samples from thesites closest to the crater and the dispersal axis were used.Ash samples were collected by the following means: a)placing plates or paper on a flat surface for some period(e.g. 18:30–19:00 January 26, February 2, February 7–8,all 2011 eruptions); b) from surface of artificial materialincluding monitoring device and edge of low-traffic road;and c) together with snow, leaves and grass on which ash

594 Y. SUZUKI et al.: 2008 TO 2011 ERUPTIONS—INSIGHTS FROM ASH
particles were deposited (Table 1, condition). The originalweights of samples in this study varied approximately be-tween 1 g and 100 g, depending on scales of the eruptions.
4. Methods4.1 Collecting all ash particles from a plastic sample
bagWet samples and samples collected with plants and snow
(see Table 1) required this preparation step. At first, allash particles in the bag were emptied into beakers usingdeionized water. Ash particles adhering to leaves and grasswere removed using a new toothbrush. Next, deionizedwater with ash particles was filtered to remove water, andthe filter paper and remaining ash particles were completelydried in an oven at 110◦C. Ash particles were separatedfrom the filter paper using a new toothbrush. Finally, the ashparticles were homogenized by mixing well, and remainingfragments of plants were removed with a pincette under abinocular microscope.4.2 Analytical methods
Component analyses were conducted for almost all sam-ples, and a reduced number was examined for bulk ashcomposition and particle size distribution (Table 1), usu-ally due to limitation in sample amount. Bulk ash com-positions were determined by X-ray fluorescence (XRF)(RIGAKU ZSX Primus II) at Earthquake Research Insti-tute (ERI), University of Tokyo, using glass beads with fiveparts flux to one part sample.
The characterization of both ash component and particle-size distribution commonly required two preparation pro-cesses, 1) ultrasonic cleaning, and 2) sieving. Typicallya few grams were extracted from the original sample andweighed. The precision of weighting was 0.001 g. Then thesample was poured into deionized water in a beaker. Sub-merging the beaker in an ultrasonic bath, the upper portionof water including only fine ash particles (<several tens ofμm) was removed. The ultrasonic cleaning and removalwere repeated until the upper portion was transparent evenduring ultrasonic cleaning. The coarse part of the sampleremaining in the beaker was dried completely at 110◦C andwas weighed to yield the weight, by difference, of the re-moved fine part (<several tens μm). The weight of the finepart was later used to yield a particle size distribution (inwt%). The removal of the fine part also aids the observa-tion of coarser particles under the binocular microscope forcomponent analyses.
For particle size analyses, the coarse part (>several tensof μm) collected during the previous procedure was sepa-rated into five size fractions by hand sieving; several tens–125 μm, 125–250 μm, 250–500 μm, 500–1000 μm and>1000 μm fractions. Each size fraction was weighed toobtain the final particle size distribution in wt%.
Ash component analyses were carried out for 24 sam-ples (Table 1). Depending on the amount of the originalsample and the resultant number of classified particles, theuse of the ash component data differs. We yielded theash-component percentage (in number, thus data shown invol%) of 22 samples for which classified particles num-bered several hundred or more (Table 2; Fig. 2), while wejust calculated a rough ash-component ratio for the two oth-
ers (May 27 and June 27–28, 2010; Table 1) to compare theMay 27 and June 27–28 samples with other samples of sim-ilar eruption dates. Size fractions of 250 to 500 μm werethe target of component analyses in most samples (Table 1),because the particles of that size range are easy to classifywith pincette and additionally the size range has relativelyabundant particles. In each sample, no clear difference ofash component was found among different size fractions.
5. Analytical Results5.1 Results of component analysis
5.1.1 Classification of ash particles and overall re-sults All ash samples contain one or more of the followingcomponents: 1) pumice, 2) scoria, 3) lava, 4) altered mate-rial, 5) free-crystal (Fig. 2 and Table 2). Not only pumiceand scoria particles, but also some of the lava particles areglassy regardless of the eruption stage (e.g. Figs. 3, 5(b), 6,7(a)–(c), 8). Accordingly, pumice+scoria particles and lavaparticles were distinguished by vesicularity. Lava particlestypically have fracture planes forming the surface, differ-ent from most scoria and pumice particles (one exception isJanuary 19, 2011 pumice explained below). We use coloras the difference between pumice and scoria: white, lightgray and light brown for pumice (Figs. 3, 5(a), 6, and 10);black and dark brown for scoria (Figs. 3, 4, 6, 9). Gener-ally, pumice particles have higher vesicularities than sco-ria particles. We further define ash components other than“free-crystal” as follows.
1) “Altered material” comprises the particles with thehighest degree of alteration of all ash components. Surfacesof typical “altered material” are mostly or completely al-tered and have an orange or white color (e.g. Fig. 3). Thewhite ones probably resulted from silicification and are of-ten accompanied by small sulfides (Fig. 3). When the originof “altered material” can be identified and it is either pumiceor scoria; vesicles are completely filled with the orange orwhite alteration product.
2) “Pumice” and “scoria” particles were further classifiedinto “fresh” and “partly altered” sub-types (Fig. 2 and Ta-ble 2), according to the degree of freshness. We regard only“fresh” ones as “juvenile material”. The degree of freshnessis judged high, 1) if vitreous luster is recognized on the par-ticle surface, and 2) if abrasion on the particle surface isfree or slight, and 3) if the particle surface and vesicles arefree from adhering alteration product. Most “pumice” and“scoria” particles in the 2011 ash samples are the “fresh”sub-type (Fig. 2, Table 2).
3) Lava particles were further classified into “fresh” and“partly altered” sub-types (Fig. 2 and Table 2). The degreeof freshness is judged using the same criteria as for scoriaand pumice. Particle shape is angular in the “fresh” sub-type but subangular in the “partly altered” sub-type (e.g.Fig. 7), because of an increasing degree of surface abrasion.We regard “partly altered” lava particles as accessary or ac-cidental. But, the origin of “fresh lava” requires some dis-cussion (Subsection 6.2). Examples of “partly altered” par-ticles are in Figs. 3 and 7(d), while those of “fresh” particlesare in Figs. 5(b), 6, 7(a)–(c), and 8. Only “partly altered”lava particles are recognized in ash samples issued between2008 and 2010, and “fresh” lava particles first appear on

Y. SUZUKI et al.: 2008 TO 2011 ERUPTIONS—INSIGHTS FROM ASH 595
Table 2. Component analysis data for ash samples.
January 19, 2011 (Fig. 2 and Table 2). As seen in the fig-ures, the “fresh” and “partly altered” lava particles have dif-ferent color variations, and the “fresh” sub-type has a higherratio of glassy particles. Binocular microscope observationrevealed different phenocryst assemblages for the two lavasub-types; olivine + two pyroxenes + plagioclase + Fe-Tioxides in “fresh lava”, and two pyroxene+plagioclase+Fe-Ti oxides in “partly altered lava”. This was also confirmedby thin section observations.
The assemblages of the free-crystal component shift fromtwo pyroxenes + plagioclase + Fe-Ti oxides before June2010 to olivine+two pyroxenes+plagioclase+Fe-Ti oxidesin the 2011 eruptions.
5.1.2 Ash component characteristics in each erup-tive stage
August 2008 to June 2010 (phreatic stage).Figure 3 shows the typical variety of ash components.
“Altered material” is the dominant component (65–30vol%), “partly altered lava” is next (25–50 vol%), and“partly altered pumice + scoria”occurs in small amounts(Table 2 and Fig. 2). The percentage of “altered mate-rial” in this stage is the highest through the whole activity.Furthermore, most particles in the “altered material” classhave a completely altered surface. Most of “pumice” and“scoria” particles are “partly altered” sub-types, i.e. non-juvenile (e.g. pale yellow pumice, in Fig. 3-1). “Fresh sco-ria” particles (possibly juvenile), with a vitreous surfaceluster (Figs. 3-2 and 4) are found in ash samples of March2010 and afterward, but they account for only <1 vol% ofwhole ash (Table 2 and Fig. 2). All lava particles are the“partly-altered” sub-type.
January 19, 2011 (phreatomagmatic stage).The clear differences from the previous stage are the ap-
pearances of considerable amounts of “fresh pumice (juve-nile)” (7.7 vol%) and glassy “fresh lava” (4.3 vol%) (Ta-ble 2 and Fig. 2). Free-crystals of olivine appeared for thefirst time since August 2008. Other components are un-changed: 1) a slight amount of “fresh scoria” (<1 vol%)can be judged juvenile, 2) the presence of “partly altered”lava particles of similar appearance to those of the previousstage (Fig. 3(a)). The “fresh pumice” particles (Figs. 5(a)and (c)) are free from alteration and adhering fine alterationproducts in vesicles. The “fresh pumice” particles are white(Fig. 5(a)) and have relatively-low vesicularity and blockyshape (Fig. 5(c)).
January 26–28, 2011 (sub-Plinian events and followingexplosion).
The five analyzed samples may be classified into twogroups; January 26, 14:30 (just prior to the first sub-Plinianevent) ash and the remainder (Fig. 2; Table 2). The first ashsample resembles those of August 2008–June 2010 ratherthan that of January 19, 2011. “Altered material” againdominates, and most of the “pumice”, “scoria”, and “lava”particles are partly altered and non-juvenile.
The other January 26–28 samples also differ from thatof January 19. Most “scoria” and “pumice” are fresh (i.e.juvenile). The amounts of “fresh pumice”, “fresh sco-ria” and “fresh lava” are greater than on January 19, andthe amounts of “partly altered lava” and “altered mate-rial” smaller (Fig. 2 and Table 2). The total of juvenilepumice and scoria is the highest in the two sub-Plinianevents (∼50 vol%) of January 26 and 27. The amount of

596 Y. SUZUKI et al.: 2008 TO 2011 ERUPTIONS—INSIGHTS FROM ASH
Fig. 2. Temporal change of ash components during 2011 eruption (January 19–August 31) and its precursory stage (August 2008–May 2010). Fordefinition of each component, see Subsection 5.1.1. Original percentage data and total number of particles counted are listed in Table 2. Target sizewas either 250–500 μm or 350–500 μm (two samples of August 22, 2008), except for 6 samples with star (*); January 26, 14:30, 125–500 μm;January 26, ca. 19:00, 500–1000 μm; April 18, 500–1000 μm; June 16, ca. 100 μm; June 23, 125–250 μm; August 6, 125–250 μm (Table 1). Twosamples of August 22, 2008 can be distinguished by Site No. (also shown in Fig. 1 and Table 1). Rose-colored bars represent particles that camedirectly from 2011 magma (6.2; Table 2). Unlike the vulcanian stage, lava particles from the second phreatomagmatic stage (June 16 to August 31,2011) were not classified further, because of possible alteration of lava accumulated in the crater (second phreatomagmatic stage in 5.1.2). Colorversion available online.
“fresh lava” is almost constant (about 20–30 vol%). The“fresh lava” particles are mostly glassy with a vitreous sur-face luster and are olive, pale-brown, gray, black and pale-green. The color variation resembles that of the “scoria”and “pumice”(Fig. 6). The vesicularities of the “fresh lava”particles range continuously to those of “fresh scoria” and“fresh pumice”.
February to mid-April, 2011 (vulcanian stage).Noteworthy characteristics of this period are the high
percentage of the “lava” component (65–85 vol%) and thehigh ratio (60–80 vol%) of fresh lava (Fig. 2 and Table 2).The amount of “altered material” is generally smaller thanin previous periods. The maximum total of “fresh pumice”and “fresh scoria” in this stage (15.4 vol% on February 24)is smaller than on January 28 (20.9 vol%) and January 26–27 (43.8 and 48.3 vol%).
“Fresh lava” particles have similar color variations tothose in the sub-Plinian stage (e.g. Figs. 6 and 7(a)–(b)).But, oxidized lava particles appear for the first time in thisstage (Fig. 7(c)) and are observed on most eruption dates.
The oxidized ones are categorized into “fresh lava” particlesbecause unoxidized parts in each grain have similar appear-ance as fresh lava particles; the oxidation occurred synerup-tively. In most samples, the occurrence of oxidized “freshlava” correlates with that of oxidized “fresh scoria” (e.g.Fig. 9(a)), which also appears for the first time in this stage.“Fresh lava” particles in ash erupted on and after February24 have patches of slight alteration (e.g. Fig. 8). The “freshpumice” particles account for <3 vol%, highest on March13 and April 3. The amount of “fresh scoria” increases untilFebruary 24 and then decreases, in the range of <15 vol%.In eruptions for which plume heights are available (Table 1),the “fresh scoria” abundance (Table 2) decreases with de-crease in height; 8 vol% and 4000 m (March 13), 6 vol%and 3000 m (February 18), 2.5 vol% and 3000 m (April 3)and 1.7 vol% and 2000 m (April 18). The “fresh scoria” par-ticles erupted on April 18 might have been recycled from ju-venile scoria particles erupted previously, as follows. Theyare tentatively classified as “fresh scoria” because of the vit-reous luster of vesicle walls, but their surfaces are abraded

Y. SUZUKI et al.: 2008 TO 2011 ERUPTIONS—INSIGHTS FROM ASH 597
Fig. 3. 250–500 μm fraction of May 27, 2010 ash (collected at Site No. 5; Fig. 1 and Table 1). For definition of each ash component, see Subsection5.1.1. All photographs were taken under binocular microscope at the same magnification. “Partly altered pumice” particles having pale-yellow colorare not juvenile. In “scoria”, only “fresh” ones can be recognized as juvenile. A higher magnification photograph of the “fresh scoria” is shownin Fig. 4. “Partly altered lava” particles (accessory) are less altered and more angular in comparison with “altered material”. In “altered material”,white-colored particles were probably generated by silicification and are charged with small sulfides (red arrow). Orthopyroxene, clinopyroxene andplagioclase are recognized as the “free-crystal” component. Color version available online.
Fig. 4. A juvenile “fresh scoria” particle from 250–500 μm fraction of May 27, 2010 ash (collected in Site No. 5; Fig. 1 and Table 1). Photograph takenunder binocular microscope. For criteria to discriminate between juvenile and non-juvenile, see Subsection 5.1.1. Color version available online.
Fig. 5. Juvenile “fresh pumice” ((a) and (c)) and “fresh lava” (b) in January 19, 2011 ash (collected at Site No. 8; Fig. 1 and Table 1). (a) and (b) arefrom 250–500 μm fraction, while (c) is from 500–1000 μm fraction. (a) and (b) are photographs taken under binocular microscope, while (c) is BSEimage of thin section. For definition of each ash component, see Subsection 5.1.1. Note denser “fresh lava” particles have darker color than freshpumice particles ((a) and (b)). As shown in (c), the “fresh pumice” has low vesicularity and blocky shape, implying magma interaction with aquifer.In (c), pyroxene and Fe-Ti oxide phenocrysts are present. Like the “fresh pumice” particles, “fresh lava” particles in (b) are glassy. Color versionavailable online.

598 Y. SUZUKI et al.: 2008 TO 2011 ERUPTIONS—INSIGHTS FROM ASH
Fig. 6. Fresh scoria, pumice and lava particles (500–1000 μm fraction) in ash from the first sub-Plinian event (deposited at Site No. 10 between 18:30and 19:00 on January 26, 2011; Fig. 1 and Table 1). All are photographs taken under binocular microscope at the same magnification. For definitionof each ash component, see Subsection 5.1.1. Both the “fresh pumice” and “fresh scoria” are juvenile. The “fresh lava” particles are glassy andhave similar color variation as “fresh pumice” and “fresh scoria”. The “fresh lava” particles have similar petrographical characteristics as pumice andscoria, so these are judged as a part of the erupting magma (Subsection 6.2). Color version available online.
Fig. 7. Typical variation of “lava” particles in early phase of vulcanian stage (February to mid-April). 250–500 μm fraction of February 18, 2011ash (Table 1). All are photographs taken under binocular microscope at the same magnification. For definition of “lava” particles and its sub-types(“fresh” and “partly-altered”), see Subsection 5.1.1. (a)–(c) are “fresh lava” (corresponding to either lava accumulated in the crater during the 2011eruptive activity (Section 2) or vesicle-poor part of erupted magma), while (d) is “partly altered lava”. Note the different appearance between “freshlava” and “partly altered lava”; “fresh lava” particles are more angular and have luster on particle surface. Oxidized particles are identified in (c).“Fresh lava” particles commonly include olivine phenocrysts (Subsection 5.1.1), and one example is seen in (a) (red arrow). Color version availableonline.

Y. SUZUKI et al.: 2008 TO 2011 ERUPTIONS—INSIGHTS FROM ASH 599
Fig. 8. Lava particles in April 3, 2011 ash (250–500 μm fraction)which were classified into “fresh lava” because of similar appearanceto “fresh lava” particles in February to March vulcanian ash samples(e.g. Figs. 7(a)–(b)). However, “fresh lava” particles in April 3 ash arepartly altered (red arrows). The photograph was taken under binocularmicroscope. For definition of lava particles and its sub-types (“fresh”and “partly-altered”), see Subsection 5.1.1. Color version availableonline.
(Fig. 9(b)). In any case, two months dormancy started whenthe juvenile content became low (1.7 vol% on April 18; Ta-ble 2 and Fig. 2).
Mid-June to August 2011 (second phreatomagmaticstage).
Lava particles erupted during this time are not classifiedinto sub-types, because the following observations make usconsider sub-types as no longer meaningful. “Fresh lava”particles in the late vulcanian stage have slight alteration(Fig. 8), and the mid-June eruption occurred after a two-month repose (Section 2) during which progressive alter-ation of crater lava is plausible. Otherwise, ash compo-nent ratios in this stage are similar to those in the vulca-nian stage (Fig. 2, Table 2). The total of “fresh pumice” and“fresh scoria” particles shows a pattern characterized by in-crease and later decrease, peaking at ca. 15 vol% on June29. The “fresh pumice” and “fresh scoria” particles early inthis period have fluidal shapes as if a splash of magma wasquenched instantly at ejection (Fig. 10, example of June 23).The shapes are quite different from those of the April 18“fresh scoria”, with significant surface abrasion (previoussection; Fig. 9(b)). This strongly suggests that the June 23“fresh pumice” and “fresh scoria” are juvenile. The amountof “altered material” in this stage is slightly higher than inthe vulcanian stage (especially until August 6), regardlessof the observed ash size fraction (Fig. 2).5.2 Bulk ash composition
Figure 11 shows bulk ash SiO2 contents as a function oferuption date. Ash samples from the August 22, 2010 erup-tion have maximum SiO2 contents (64.4–66.3 wt%). Thereis a gap in the data between the August 22 ash samples andthe remainder. Samples of March 30, 2010 and January 19,2011 have the highest SiO2 contents after August 22, 2008(60.3–60.5 wt%).
In the SiO2 variation diagrams (Fig. 12), the bulk ash
Fig. 9. Examples of juvenile “fresh scoria” particles in vulcanian ash.Both photographs were taken under binocular microscope. For defini-tion of “scoria” particles and its sub-types (“fresh” and “partly-altered”),see Subsection 5.1.1. (a) shows “fresh scoria (juvenile)” particles inFebruary 18 ash (250–500 μm fraction). Some of the “fresh sco-ria” particles are oxidized, similar to coexisting “fresh lava” particles(Fig. 7(c)). Degree of surface luster of unoxidized particles is variable.(b) shows “scoria” particles in April 18 ash (500–1000 μm fraction).These were classified into “fresh scoria” (Table 2; Fig. 2) because of lus-ter inside vesicles (e.g. particles with arrow) and resemblance to “freshscoria particles” in previous eruptions (e.g. Fig. 9(a)), although surfacesof particles in (b) are abraded. Color version available online.
Fig. 10. “Fresh pumice (juvenile)” particles in 125–250 μm fractionof June 23, 2011 ash. The photograph was taken with digital micro-scope. For definition of “pumice” particles and its sub-types (“fresh”and “partly-altered”), see Subsection 5.1.1. The particles look white(left) or light brown (right) under binocular microscope. Color versionavailable online.

600 Y. SUZUKI et al.: 2008 TO 2011 ERUPTIONS—INSIGHTS FROM ASH
Fig. 11. Temporal change in bulk ash SiO2 content. Different symbols indicate the total percentage (in number) of juvenile material and fresh lava inthe analyzed sample (Fig. 2 and Table 2). See “second phreatomagmatic stage” in Subsection 5.1.2 for the reason why the total ratios could not bedetermined in and after June 2011.
compositions are plotted together with bulk rock compo-sitions of 2011 rock samples (Suzuki et al., 2013) and pastejecta (data originally reported in Tajima et al., 2013, lim-ited to data analyzed in ERI, as in the present ash studyand Suzuki et al., 2013). Figure 12 was made, becausethe ash samples can be mixtures of freshly erupted magmaand fragments of past ejecta. An averaged SiO2 content of57–58 wt% is estimated for the erupted magma, as follows.Suzuki et al. (2013) showed that gray- and brown-coloredpumice samples and lava samples in the 2011 eruption (57–58 wt% SiO2; Fig. 12) are products of syneruptive mix-ing. White pumice blocks (62–63 wt% SiO2), which areequivalent to the low-temperature endmember of the mix-ing, account for only several percent of pumice blocks insub-Plinian phase (Suzuki et al., 2013). 1716–1717 pumicedata (SiO2 = 57.2 wt%) shown in Fig. 12 matches the1716–1717 gray pumice composition (57–58 wt%) deter-mined by Miyamoto (2012), who comprehensively exam-ined eight explosive eruption phases. Miyamoto (2012)also showed that gray pumice blocks are dominant relativeto yellow (originally white) pumice blocks, as in the 2011eruption. For the 1716–1717 lava and older ejecta, Tajimaet al. (2013) showed that the majority has SiO2 = 59–63,as plotted in Fig. 12.
In Fig. 12, most ash samples form linear trends (57.3–60.5 wt% SiO2) within compositional ranges of most rocksamples of Shinmoe-dake. In the Na2O and K2O diagrams,however, the high SiO2 ends of the ash trends (59 wt% ormore) depart from the compositional ranges of rock sam-ples. The characteristics of ash samples as noted aboveare not applicable to August 2008 ash samples because;they have higher SiO2 contents (64.4–66.3 wt%) than mostof Shinmoe-dake rock samples, and they are not on lineartrends formed by other ash and rock samples from presentand past eruptions.5.3 Particle size distribution
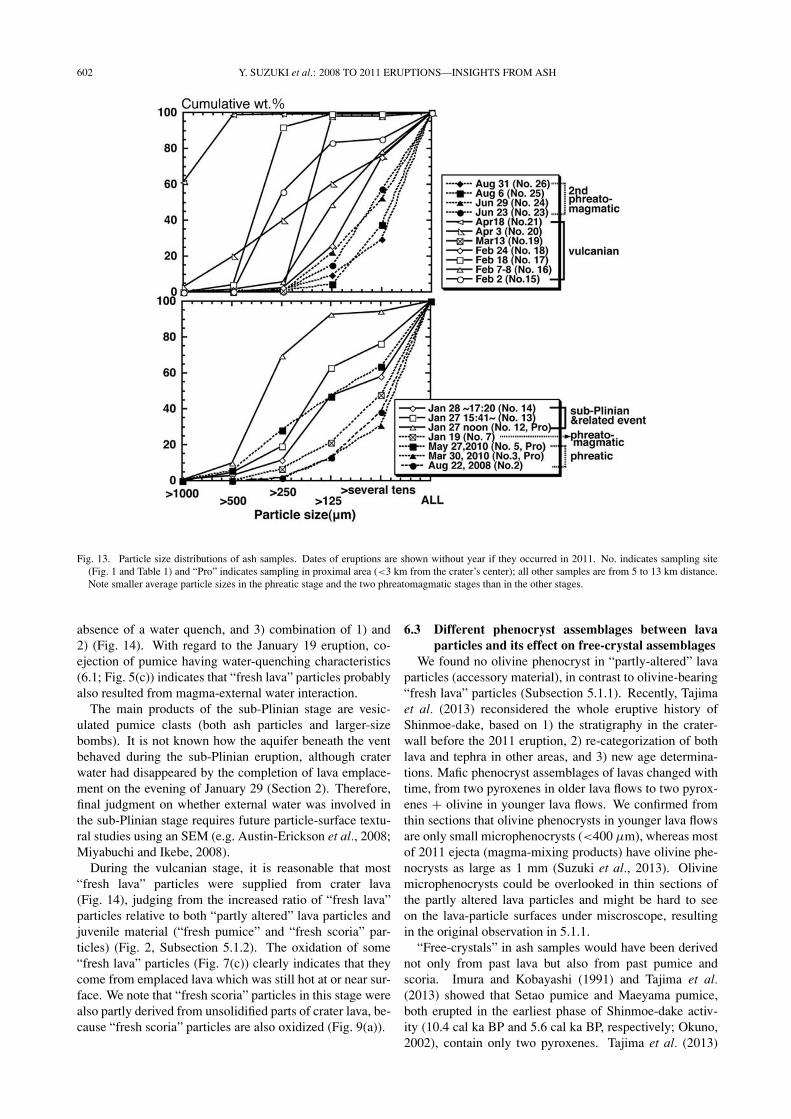
The size distribution data are shown in cumulative stylein Fig. 13. There are systematic differences in the cumula-tive curves among the eruption stages, although each stagehas variation. Data for the phreatic stage (2008 to 2010), thephreatomagmatic eruption (January 19, 2011) and the sec-ond phreatomagmatic stage (June to August 2011) resem-
ble one another and are characterized by concave-upwardcurves. Sub-Plinian events and related eruptions (January27–28, 2011), and the vulcanian stage (February and April2011), are characterized by convex-upward curves. It isclear that the former group has smaller averaged particlesizes than the latter.
6. Discussion6.1 Characteristics and temporal change of juvenile
materialTo confirm the identification of juvenile material based
on its appearance under the microscope (as described inSubsection 5.1.1), Suzuki et al. (2013) determined compo-sitions of phenocrysts in juvenile material (“fresh pumice”and “fresh scoria”) and found them to resemble those ofphenocrysts in 2011 lava and pumice blocks. But, analy-ses in Suzuki et al. (2013) were limited to ash samples withabundant juvenile material, and to abundant particle types(pumice particles on January 19 and scoria particles onFebruary 18 and 24 and March 13, 2011). “Fresh pumice”and “fresh scoria” ash particles between August 2008 andJune 2010 have not been analyzed. However, our conclu-sion that the eruption style for this period was phreatic willprobably not be affected by future chemical analyses, be-cause of 1) the lower abundance of juvenile material (<1vol%) than in the following periods (Fig. 2, Table 2), and 2)the presence of a crater lake in this period (Fig. 14).
We next focus on other characteristics of the juvenile ma-terial that helped us define an eruptive stage. The pumicein the January 19, 2011 eruption has low vesicularity anda blocky or platy shape (Subsection 5.1.2, Figs. 5(a) and(c)). Such particle shapes can be formed when magma isquenched by external water (e.g. Suzuki and Nakada, 2002;Suzuki et al., 2007). Pre-eruption investigation of the elec-trical resistivity structure beneath Shinmoe-dake revealedan aquifer at a depth of 100–1400 m (around sea level) be-low the summit (Kagiyama et al., 1996). If the presenceof a crater lake even after the January 19, 2011 eruption(Fig. 14) is considered, magma-water interaction during theJanuary 19 event seems possible and even likely. We thusinterpret the January 19 eruption to have been phreatomag-matic (Fig. 14).

Y. SUZUKI et al.: 2008 TO 2011 ERUPTIONS—INSIGHTS FROM ASH 601
Fig. 12. SiO2 variation diagrams for bulk ash compositions (2008–2011), and bulk rock compositions of Shinmoe-dake ejecta in 2011 eruption (Suzukiet al., 2013) and past eruptions (Tajima et al., 2013; blue plots). Compositions of ash erupted in early phase of 2010–2011 activity are enclosed byblack ovals. For the 2011 eruption, data for pumice blocks (white, and gray- and brown-colored) are from the three sub-Plinian eruptions and laterexplosion (January 28), while lava data are from February 1 vulcanian eruption (Suzuki et al., 2013). Data for past ejecta excluding the 1716–1717pumice include the Maeyama pumice (5.6 cal ka BP; Okuno, 2002) and lavas erupted in and prior to 1716–1717 eruption. For the 1716–1717eruption, there is uncertainty about the timing of lava emplacement that took place after the explosive phases (Tajima et al., 2013). The lines withnumbers (0, 10, 20) in the SiO2-K2O diagram show the compositional changes of representative ejecta (2011 lava and white pumice), when up to20 wt% of their groundmass (63.9 wt% SiO2 and 2.4 wt% K2O in lava; 76.6 wt% SiO2 and 4.5 wt% K2O in white pumice; Suzuki et al., 2013) isseparated from the bulk rock composition. Also see Subsections 5.2 and 6.4. Color version available online.
6.2 Origin of “fresh lava” particlesAlthough “fresh lava” particles have a range of colors
(e.g. Figs. 5(b), 6, 7(a)–(c), 8), they are consistent in theirphenocryst assemblage and freshness relative to “partly al-tered” lava particles (accessory and accidental). We havenot yet conducted detailed chemical analyses of “freshlava” particles (e.g. phenocryst composition), but their pet-rographic features, including the phenocryst assemblage(olivine+ two pyroxenes+plagioclase+Fe-Ti oxides), co-incide with those of most of the 2011 ejecta, including lavaejected ballistically from the crater (Suzuki et al., 2013;most ejecta are products of syneruptive magma mixing).Accordingly, we judge that the “fresh lava” particles areeither 1) dense parts of magma erupting at the time, or 2)
fragments of lava that earlier accumulated in the crater (butonly after its first appearance during the night of January27, 2011; Section 2).
The “fresh lava” particles erupted between January 19and January 27 are probably dense parts of erupting magma.Indeed, there are continuities in color and vesicularity be-tween the juvenile material (“fresh pumice” and “fresh sco-ria”) and the “fresh lava” for this period (Figs. 5(a)–(b) forJanuary 19, 2011; Fig. 6 for the first sub-Plinian event). Inmore detail, the range in vesicularities of erupting magmacould be due to processes such as 1) different degree ofgas-phase separation from magma during syneruptive as-cent, and 2) heterogeneity in magma-external water inter-action, including variable quench depths and presence and
602 Y. SUZUKI et al.: 2008 TO 2011 ERUPTIONS—INSIGHTS FROM ASH
Fig. 13. Particle size distributions of ash samples. Dates of eruptions are shown without year if they occurred in 2011. No. indicates sampling site(Fig. 1 and Table 1) and “Pro” indicates sampling in proximal area (<3 km from the crater’s center); all other samples are from 5 to 13 km distance.Note smaller average particle sizes in the phreatic stage and the two phreatomagmatic stages than in the other stages.
absence of a water quench, and 3) combination of 1) and2) (Fig. 14). With regard to the January 19 eruption, co-ejection of pumice having water-quenching characteristics(6.1; Fig. 5(c)) indicates that “fresh lava” particles probablyalso resulted from magma-external water interaction.
The main products of the sub-Plinian stage are vesic-ulated pumice clasts (both ash particles and larger-sizebombs). It is not known how the aquifer beneath the ventbehaved during the sub-Plinian eruption, although craterwater had disappeared by the completion of lava emplace-ment on the evening of January 29 (Section 2). Therefore,final judgment on whether external water was involved inthe sub-Plinian stage requires future particle-surface textu-ral studies using an SEM (e.g. Austin-Erickson et al., 2008;Miyabuchi and Ikebe, 2008).
During the vulcanian stage, it is reasonable that most“fresh lava” particles were supplied from crater lava(Fig. 14), judging from the increased ratio of “fresh lava”particles relative to both “partly altered” lava particles andjuvenile material (“fresh pumice” and “fresh scoria” par-ticles) (Fig. 2, Subsection 5.1.2). The oxidation of some“fresh lava” particles (Fig. 7(c)) clearly indicates that theycome from emplaced lava which was still hot at or near sur-face. We note that “fresh scoria” particles in this stage werealso partly derived from unsolidified parts of crater lava, be-cause “fresh scoria” particles are also oxidized (Fig. 9(a)).
6.3 Different phenocryst assemblages between lavaparticles and its effect on free-crystal assemblages
We found no olivine phenocryst in “partly-altered” lavaparticles (accessory material), in contrast to olivine-bearing“fresh lava” particles (Subsection 5.1.1). Recently, Tajimaet al. (2013) reconsidered the whole eruptive history ofShinmoe-dake, based on 1) the stratigraphy in the crater-wall before the 2011 eruption, 2) re-categorization of bothlava and tephra in other areas, and 3) new age determina-tions. Mafic phenocryst assemblages of lavas changed withtime, from two pyroxenes in older lava flows to two pyrox-enes + olivine in younger lava flows. We confirmed fromthin sections that olivine phenocrysts in younger lava flowsare only small microphenocrysts (<400 μm), whereas mostof 2011 ejecta (magma-mixing products) have olivine phe-nocrysts as large as 1 mm (Suzuki et al., 2013). Olivinemicrophenocrysts could be overlooked in thin sections ofthe partly altered lava particles and might be hard to seeon the lava-particle surfaces under miscroscope, resultingin the original observation in 5.1.1.
“Free-crystals” in ash samples would have been derivednot only from past lava but also from past pumice andscoria. Imura and Kobayashi (1991) and Tajima et al.(2013) showed that Setao pumice and Maeyama pumice,both erupted in the earliest phase of Shinmoe-dake activ-ity (10.4 cal ka BP and 5.6 cal ka BP, respectively; Okuno,2002), contain only two pyroxenes. Tajima et al. (2013)

Y. SUZUKI et al.: 2008 TO 2011 ERUPTIONS—INSIGHTS FROM ASH 603
Fig.
14.
Prec
urso
ryph
ases
and
evol
utio
nof
the
2011
erup
tion
ofSh
inm
oe-d
ake
atK
iris
him
avo
lcan
o,in
ferr
edfr
omob
serv
atio
nof
ash
sam
ples
.Fo
rde
taile
dex
plan
atio
n,se
ere
late
ddi
scus
sion
and
conc
lusi
on.
The
follo
win
gsar
eda
tes
and
sour
ceof
each
phot
o;1)
phre
atic
(May
28,2
010;
Bul
letin
onV
olca
nic
Act
ivity
(May
2010
)is
sued
from
Japa
nM
eteo
rolo
gica
lAge
ncy
(JM
A))
,2)
phre
atom
agm
atic
(mor
ning
ofJa
nuar
y21
,201
1;co
urte
syof
JMA
),3)
sub-
Plin
ian
(Jan
uary
2617
:00,
2011
;M
t.K
iris
him
aliv
eca
mer
alo
cate
din
Ohn
ami-
ike)
,4)
vulc
ania
n(F
ebru
ary
4,20
11;
T.K
anek
o),6
)se
cond
phre
atom
agm
atic
peri
od(A
ugus
t13
,201
1;co
urte
syof
K.S
him
ousu
ki,W
orth
Plan
ning
Ltd
.).

604 Y. SUZUKI et al.: 2008 TO 2011 ERUPTIONS—INSIGHTS FROM ASH
showed, for later-stage tephras excluding Kyoho Pumice(1716–1717), that mafic phenocryst assemblages change ina similar manner to those in lavas of similar age. For the Ky-oho eruption (1716–1717), which consists of seven phases(Sm-KP1 to -KP7; Imura and Kobayashi, 1991), Miyamoto(2012) showed that pumice samples have the same phe-nocryst assemblage as do products of the 2011 eruption,but pumice samples with isolated olivine phenocrysts (i.e.free from a thick reaction rim) are limited to Sm-KP4 (200μm in average olivine size). The above summary indi-cates that most pumices of past eruptions also lack largeolivine phenocrysts. We thus conclude that the shift in free-crystal assemblage from olivine-free (2008 to 2010 erup-tions) to olivine bearing (on and after January 19, 2011)resulted from input of 2011 magma bearing large olivinephenocrysts (∼1000 μm) (Fig. 14).6.4 Temporal change of bulk ash composition
The August 2008 ash samples have higher SiO2 con-tents than do most of the 2011 rock samples (equivalent toerupted magma) and past ejecta (Fig. 12). This indicatesthat the 2008 samples are not simple mixtures of 2011 ejectaand past ejecta. The compositional variation of the 2010and 2011 ash samples can be approximated by a mixtureof the above two major ash constituents (Fig. 12). The ashcomponents derived from the past ejecta are “partly alteredpumice + scoria”, “partly altered lava” and “altered mate-rial”, while those derived from the erupted magma in 2011are “juvenile material” and “fresh lava”. Ash samples ofpost-January 19, 2011 eruptions have lower bulk SiO2 con-tents than those of earlier eruptions (Fig. 11). Total ratios of“juvenile material” and “fresh lava” particles are higher inthe post-January 19, 2011 eruptions (19.2–72.7 vol%), thanin the earlier eruptions (0.4–12.6 vol%). The relationshipcan be explained by compositional differences between theerupted magma and past ejecta. As summarized in Subsec-tion 5.2, the averaged composition of the erupted magma is57–58 wt% SiO2 (Suzuki et al., 2013), whereas most pastejecta have 59–63 wt% SiO2 (Tajima et al., 2013) (Fig. 12).The contribution of 1716–1717 pumice fragments (57–58wt% SiO2; Miyamoto, 2012) to 2010 to 2011 ash sam-ples seems small, because particle ratios of “partly alteredscoria and pumice” are much lower than that of “partly al-tered lava” (Fig. 2). We thus conclude that the decrease inbulk ash SiO2 content at the start of the sub-Plinian erup-tion (Fig. 11) was produced by an increased contribution of2011 magma to the ash (Fig. 14). This model is consistentwith the bulk ash compositions of March 2010 and January19, 2011, which are comparable to the most frequent com-positions of past ejecta (59–63 wt% SiO2) excluding the1716–1717 pumice (Fig. 12). We infer that the uncatego-rized “lava” particles in the second phreatomagmatic stage(June to August 2011; Subsection 5.1.2) consist of the sameconstituents as are in the vulcanian stage (i.e. “fresh lava”and “partly altered lava”), because of similar bulk ash com-positions (Figs. 11 and 12) and similar juvenile material ra-tios (Fig. 2) between the two stages.
We infer that both the high SiO2 contents of the 2008 ashsamples and their deviation from the bulk trends of other ashsamples (Fig. 12; Subsection 5.2) are due to the inclusionof abundant altered material (Fig. 2) in the analyzed bulk
samples (Table 1). The silicification common in “alteredmaterial” (e.g. Fig. 3) would lead to an increase in SiO2 con-tent. The deviation of the 2008 ash from other bulk trends ismost significant in Na2O and K2O (Fig. 12). A similar de-viation was reported in the 2003 to 2004 eruption of Anata-han volcano; ash samples from its phreatomagmatic stageare depleted in alkali elements compared with rock samplesof the volcano (Nakada et al., 2005). Rock-fluid interactionmay lead to alkali element depletion. Hamilton et al. (2000)showed that alkali elements have relatively high dissolutionrates in glass that is immersed in a solution of high tem-perature and acidity. Ohba (2011) pointed out in his reviewthat the existence of an acidic high temperature hydrother-mal system is the most plausible condition that can producealtered mineral found in volcanic ejecta. At present, we arenot certain how the rock-fluid interaction is related to thesilicification process.
Na2O and K2O in the 2010–2011 ash samples devi-ate more from rock-sample trends at higher SiO2 values(Fig. 12). Inclusion of silicified altered material may ex-plain the deviation (e.g. March 2010 and January 19, 2011,and June to August, 2011; Fig. 2). To support this idea, weshow that lowering the K2O trend by separation of K2O-rich groundmass (i.e. groundmass separation model) is notpossible (Fig. 12). The groundmass would be prone to beseparated, because it can be fine particles due to synerup-tive vesiculation. The two lines in the SiO2 vs. K2O dia-gram (Fig. 12) show trends that can be formed by differ-ent degrees of groundmass separation from representativeerupted magma (2011 lava and white pumice). The twotrends remain parallel to the original whole rock trends ofother ejecta; therefore, the groundmass separation modelcan be rejected.6.5 Variation of particle size distribution
The grain size distribution of ejecta just after dischargefrom the crater reflects syn-eruptive fragmentation condi-tions. Accordingly, the size distribution helps us judgethe eruption style, including possible involvement of ex-ternal water (Morrissey et al., 2000). However, interpre-tation of samples collected at a distance from the crater re-quires careful considerations of the sorting process, whichis influenced by plume height, distance from crater anddispersal axis, and meteorological conditions. To evalu-ate possible differences in particle size distribution at thetime of ejection, we here take both plume height and dis-tance from crater into consideration. At first place, mostsampling distances from the center of the crater are similar,except for the phreatic stage (August 2008 to June 2010)(sites 3, 4, 5, and 6 in Fig. 1). The samples, excludingthe phreatic stage, have differences in average particle size,coarser in the sub-Plinian and vulcanian stages and finerin the two phreatomagmatic stages (Fig. 13). The differ-ence may have been influenced by different eruption plumeheights; heights of >1000 m characterize the sub-Plinianand vulcanian stages, while heights mostly <1000 m typifyother stages (Table 1).
In the phreatic stage (August 2008 to June 2010), ashsamples are generally fine regardless of the sampling sites,including sites 3 and 5 close to the crater (Pro in Fig. 13), in-dicating the overall fineness and thereby implying involve-

Y. SUZUKI et al.: 2008 TO 2011 ERUPTIONS—INSIGHTS FROM ASH 605
ment of external water. This inference is consistent with thepresence of a crater lake at this stage (Fig. 14) and the oc-currence of a cock’s tail explosive jet during the May 27,2011 eruption (Bulletin on Volcanic Activity (May 2010)issued from JMA).
For the January 19, 2011 eruption, we have informationabout neither grain-size variation with distance from craternor the conditions of the crater at the time of eruption. Theparticle size data for this event are only from one place (site7; Fig. 1). But, the presence of juvenile pumice with water-quenched texture (Subsection 6.1) indicates involvement ofexternal water. Therefore, we believe that the fine grain sizeof the ash in this eruption (Fig. 13) also resulted from theinteraction with external water. JMA reported that a smallcrater lake existed just after the eruption (Fig. 14).
In the second phreatomagmatic stage (June to August2011), no sample was collected from proximal sites (<3km from the crater center; Fig. 13). The ash is proba-bly fine regardless of distance from the crater, however,to judge from the 5-km sample (August 6, 2011; site 25in Fig. 13) and the 6–7-km samples (sites 23, 24, 26 inFig. 13). Phreatomagmatic eruptions are seen to continuelonger than other eruptions (Nakada et al., 2013), and erup-tions in this stage lasted longer (e.g. June 29 to July 1 andAugust 31 to September 6; Table 1) than those during thevulcanian stage. The evidence thus suggests that the finegrain size of the ash resulted from interaction of magmawith external water (Fig. 14). Vesicularities of juvenile par-ticles in this stage seem relatively high (Fig. 10), but vesic-ularity during magma-water interaction could vary depend-ing on the degree of gas-phase separation from magma be-fore the time of the interaction.
The ash samples from the second phreatomagmatic stage(June to August 2011) have larger amounts of altered mate-rial than do samples from the vulcanian stage (Fig. 2). Atpresent, we infer that the increase is related to either 1) pro-gressive alteration in the conduit-crater system due to sup-ply of fluid from intruded magma (Fig. 14), or 2) change oferuption style. We deny effect of changing vent locations,as they were almost the same as previous vulcanian stage(e.g. Nakada et al., 2013). Progressive alteration is sup-ported by the crater photo (Fig. 14) and direct observationof lava particles in ash (Subsection 5.1.2 and Fig. 8). Tofurther test our interpretation of magma-water interactionin the first phreatomagmatic stage (January 19, 2011) andthe second phreatomagmatic stage (June to August, 2011),future study should focus on detailed observations of par-ticle surface texture with an SEM (e.g. Austin-Erickson etal., 2008; Miyabuchi and Ikebe, 2008).6.6 Successful detection of juvenile material before the
January 26, 2011 sub-Plinian eruption and task forfuture studies
Since the August 2008 eruption, researchers at the vol-cano research center of ERI (Y.S. and F.M.) have been mak-ing ash-sample reports for every eruption, in response torequests from JMA. Experience and knowledge acquiredfrom these precursory events helped Y.S. to find juvenilematerial (pumice; Fig. 5) quickly, just after receiving theJanuary 19, 2011 ash samples from JMA. Regrettably, thetime between sending a report to JMA (noon of January 26)
and the start of the first sub-Plinian event was too short toinform all of Japan’s volcanologists that magma had risen toshallow depth. But, as far as we know, ash characterizationwas the only method which detected the change of erup-tive activity before the sub-Plinian event itself. Althoughash samples cannot predict the scale of an eruption, weagain emphasize the importance of continuous ash sampleobservation starting from a period of low activity. We alsonote the necessity of one-by-one ash particle examination—time-consuming work—for the correct characterization ofash samples and early detection of juvenile material.
As a task for future eruptions, we here note difficulty ofjuvenile material identification in continuous eruptive ac-tivity (e.g. vulcanian stage in the 2011 eruption). The diffi-culty arises from that ash erupted in later stage of a continu-ous eruptive activity can include juvenile particles that oncedeposited inside the crater, i.e. recycled particles. If long-term dormancy takes place, the deposit inside the craterwould be altered, resulting in an ease of juvenile materialidentification in next magmatic eruption (e.g. the first andsecond phreatomagmatic stages in the 2011 eruption). Formore sophisticated identification of juvenile material, intro-duction of another objective indexes is preferable.
7. ConclusionWe studied a series of ash samples from the 2011
Shinmoe-dake eruption and its precursory eruptions in 2008to 2010 to 1) define eruption stages, including informationon magma-water interaction, and 2) infer changes in thevolcanic edifice as eruptive activity progressed (Fig. 14).The 2011 eruption followed a course of a phreatomagmaticstage (January 19), a sub-Plinian and lava accumulationstage (end of January), a vulcanian stage (February–April),and second phreatomagmatic stage (June–August).
1) Judging from the smaller amount of fresh pumice andscoria (<1 vol%) than in the following stages, eruptionsbetween August 2008 and June 2010 can be defined asphreatic. The fine ash samples also support the involvementof external water in the eruptions. The amount of alteredmaterial is the highest through the whole activity, probablybecause altered parts of the volcanic edifice were destroyedby the early eruptions.
2) The January 19, 2011 eruption can be classed asphreatomagmatic, based on a) the obvious appearance ofjuvenile material (8 vol% pumice) with water-quench tex-tures, and b) the fineness of the ash. The presence of thejuvenile material was reported to JMA before the start ofthe sub-Plinian event.
3) On January 26–28, 2011, the amount of juvenile scoriaand pumice changed according to eruption intensity, reach-ing a maximum (50 vol%) in sub-Plinian events. The originof fresh lava particles having continuities of color and vesic-ularity between the juvenile particles is not solved (proba-bly either relativley dense parts of the erupted magma orwater-quench products).
4) After lava accumulated in the crater at the end ofJanuary 2011, the particles from the lava accounted for 30–70 vol% of ash samples.
5) In the vulcanian stage, the total content of juvenilepumice and scoria first increased and then decreased over

606 Y. SUZUKI et al.: 2008 TO 2011 ERUPTIONS—INSIGHTS FROM ASH
a range of <15 vol%. The amount correlates weakly witheruption plume height.
6) We tentatively defined a period between June and Au-gust, 2011 as a second phreatomagmatic stage, based onfiner ash and longer eruptive events than in the vulcanianstage. Juvenile pumice and scoria particles were still asabundant as during the vulcanian stage. The ratio of al-tered material is higher than in the vulcanian stage, becauseof progressive alteration of the volcanic edifice or a changein eruption style.
7) Bulk ash SiO2 contents are lower in post-January 19,2011 eruptions. The systematic change was caused by thehigher average SiO2 content of past ejecta than that of the2011 erupted magma. An exception is that bulk ash compo-sitions of the August 2008 ash samples were influenced byabundant altered material.
8) The free-crystal assemblages of ash samples are twopyroxenes + plagioclase + Fe-Ti oxides until 2010; olivinejoins the assemblage in the January 19, 2011 eruption. Dif-ferent assemblages and sizes of phenocrysts between thepast ejecta (derived from the volcanic edifice) and the 2011magma caused this change.
Acknowledgments. We are indebted to Japan MeteorologicalAgency for supplying us with ash samples and information oneruptive activity. Dr. K. Aizawa, Dr. J. Hirabayashi, Dr. R. Imura,Kirishima Geopark, Dr. T. Kobayashi, Mr. M. Sakagami, Dr. H.Sato, Mr. Y. Tajima, Takaharu-cho, Dr. M. Ukawa (in alphabeticalorder) are thanked for the ash samples. Also, Mr. Y. Tajima kindlytaught us the eruptive history of Shinmoe-dake and petrographicaland geochemical characteristics of past ejecta. Dr. T. Miyamotokindly taught us petrographical and geochemical characteristics of1716–1717 pumice samples. We express our thanks to membersof the volcano research center of Earthquake Research Institutefor discussions and assistance throughout this research. Finally,the manuscript was greatly improved by insightful comments fromDr. Donald Swanson (USGS), Dr. Jacopo Taddeucci (The IstitutoNazionale di Geofisica e Vulcanologia) and Dr. Thomas Wright(Johns Hopkins University). Also, they kindly improved the En-glish manuscript. This work was partly supported by Grant-in-Aidfrom MEXT to S. Nakada (No. 22900001).
ReferencesAndo, S., The geomorphic change of the summit crater and the ground de-
formation around Shinmoe-dake, Kirishima volcano, revealed by ALOSdata, Rep. Coord. Comm. Predict. Volcan. Erup., 109, 179–191, 2012 (inJapanese).
Austin-Erickson, A., R. Buttner, P. Dellino, M. H. Ort, and B. Zi-manowski, Phreatomagmatic explosions of rhyolitic magma: Ex-perimental and field evidence, J. Geophys. Res., 113, B11201,doi:10.1029/2008JB005731, 2008.
GIAJ (Geospatial Information Authority of Japan), Crustal deformationsaround Kirishima Volcano, Rep. Coord. Comm. Predict. Volcan. Erup.,108, 197–220, 2012 (in Japanese).
Hamilton, J. P., C. G. Pantano, and S. L. Brantley, Dissolution of albiteglass and crystal, Geochim. Cosmochim. Acta, 64, 2603–2615, 2000.
Hatae, K., K. Watanabe, K. Watanabe, T. Tsutsui, and Y. Motomura, Varia-tion in content of vesiculated glasses in volcanic ash errupted from KujuVolcano in 1995–96, Japan, Bull. Volcanol. Soc. Jpn., 42, 345–353, 1997(in Japanese with English abstract).
Ichihara, M., M. Takeo, A. Yokoo, J. Oikawa, and T. Ohminato,Monitoring volcanic activity using correlation patterns between in-frasound and ground motion, Geophys. Res. Lett., 39, L04304,doi:10.1029/2011GL050542, 2012.
Ikebe, S., K. Watanabe, and Y. Miyabuchi, The sequence and style of the1988–1995 eruptions of Nakadake Aso Volcano, Kyushu, Japan, Bull.Volcanol. Soc. Jpn., 53, 15–33, 2008 (in Japanese with English abstract).
Imura, R. and T. Kobayashi, Eruptions of Shinmoedake Volcano,
Kirishima Volcano Group, in the last 300 year, Bull. Volcanol. Soc. Jpn.,36, 135–148, 1991 (in Japanese with English abstract).
Kagiyama, T., H. Utada, M. Uyeshima, F. Masutani, W. Kanda, Y. Tanaka,H. Masuda, H. Murakami, I. Shiozaki, M. Ichiki, T. Yukutake, T. Mogi,K. Amita, N. Oshiman, and M. Mishima, Resistivity structure of thecentral and the southeastern part of Kirishima volcanoes, Bull. Volcanol.Soc. Jpn., 41, 215–225, 1996 (in Japanese with English abstract).
Kozono, T., H. Ueda, T. Ozawa, T. Koyaguchi, E. Fujita, A. Tomiya, andY. J. Suzuki, Magma discharge variations during the 2011 eruptionsof Shinmoe-dake volcano, Japan, revealed by geodetic and satelliteobservations, Bull. Volcanol., 75, 695, 2013.
Maeno, F., M. Nagai, S. Nakada, R. Burden, S. Engwell, Y. Suzuki, andT. Kaneko, Constraining tephra dispersion and deposition from cyclicsubplinian explosions at Shinmoedake volcano, Kyushu, Japan, JapanGeoscience Union Meeting 2012, SVC50-07, 2012.
Maeno, F., S. Nakada, M. Nagai, and T. Kozono, Ballistic ejecta anderuption condition of the vulcanian explosion of Shinmoedake volcano,Kyushu, Japan on 1 February, 2011, Earth Planets Space, 65, this issue,609–621, doi:10.5047/eps.2013.03.004, 2013.
Miyabuchi, Y. and S. Ikebe, The February 2008 ash deposit from theNakadake crater, Aso volcano, Japan, Bull. Volcanol. Soc. Jpn., 53, 201–206, 2008 (in Japanese with English abstract).
Miyabuchi, Y., S. Ikebe, and K.Watanabe, Geological constraints on the2003–2005 ash emissions from the Nakadake crater lake, Aso Volcano,Japan, J. Volcanol. Geotherm. Res., 178, 169–183, 2008.
Miyagi, I., J. Itoh, H. Shinohara, and Kagoshima Observatory, Japan mete-orological agency, re-activation process of Showa volcanic vent at Saku-rajima volcano in 2008: Evidence from volcanic ash. Japan, Bull. Vol-canol. Soc. Jpn., 55, 21–39, 2010 (in Japanese with English abstract).
Miyamoto, T., Magma systems of the Kyoho eruption in Shinmoe-dakevolcano, Kirishima volcanoes: 2, Japan Geoscience Union Meeting2012, SVC50-P43, 2012.
Morrissey, M., B. Zimanowski, K. Wohletz, and R. Buettner, Phreatomag-matic fragmentation, in Encyclopedia of Volcanoes, edited by H. Sig-urdsson, 431–445, Academic Press, New York, 2000.
Nakada, S., Y. Motomura, and H. Shimizu, Manner of magma ascent atUnzen Volcano (Japan), Geophys. Res. Lett., 22, 567–570, 1995.
Nakada, S., T. Matsushima, M. Yoshimoto, T. Sugimoto, T. Kato, T.Watanabe, R. Chong, and J. T. Camacho, Geological aspects of the2003–2004 eruption of Anatahan Volcano, Northern Mariana Islands,J. Volcanol. Geotherm. Res., 146, 226–240, 2005.
Nakada, S., M. Nagai, T. Kaneko, Y. Suzuki, and F. Maeno, The outline ofthe 2011 eruption at Shinmoe-dake (Kirishima), Japan, Earth PlanetsSpace, 65, this issue, 475–488, doi:10.5047/eps.2013.03.016, 2013.
Nakao, S., Y. Morita, H. Yakiwara, J. Oikawa, H. Ueda, H. Taka-hashi, Y. Ohta, T. Matsushima, and M. Iguchi, Volume change ofthe magma reservoir relating to the 2011 Kirishima Shinmoe-dakeeruption—Charging, discharging and recharging process inferred fromGPS measurements, Earth Planets Space, 65, this issue, 505–515,doi:10.5047/eps.2013.05.017, 2013.
Ohba, T., Hydrothermal mineral-bearing volcanic products: Relationshipswith subvolcanic hydrothermal systems, and styles and patterns of theirformation, J. Geol. Soc. Jpn., 117, 344–356, 2011 (in Japanese withEnglish abstract).
Ohba, T. and Y. Kitade, Subvolcanic hydrothermal systems: Implica-tions from hydrothermal minerals in hydrovolcanic ash, J. Volcanol.Geotherm. Res., 145, 249–262, 2005.
Oikawa, J., A. Watanabe, H. Tsuji, Y. Morita, T. Koyama, T. Ohmi-nato, M. Takeo, S. Nakada, Y. Aoki, and M. Ichihara, Volcanic earth-quakes and tremor associated with the 2008–2011 Shinmoe-dake erup-tion, Fall Meeting of the Volcanological Society of Japan, A1-11, 2011(in Japanese).
Okuno, M., Chronology of tephra layers in Southern Kyushu, SW Japan,for the last 30,000 years, Quatern. Res., 41, 225–236, 2002 (in Japanesewith English abstract).
Ozawa, T. and T. Kozono, Temporal variation of the Shinmoe-dake craterin the 2011 eruption revealed by spaceborne SAR observations, EarthPlanets Space, 65, this issue, 527–537, doi:10.5047/eps.2013.05.004,2013.
Rowe, M. C., C. R. Thornber, and A. J. R. Kent, Identification and evo-lution of the juvenile component in 2004–2005 Mount St. Helens ash,in A Volcano Rekindled: The Renewed Eruption of Mount St. Helens,2004–2006, edited by D. R. Sherrod, W. E. Scott, and P. H. Stauffer,U.S. Geological Survey Professional Paper 1750, 335–382, 2008.
Sasaki, H., K. Isobe, S. Homma, M. Sakagami, S. Mukoyama, S. Nakada,T. Kobayashi, and M. Murakami, Estimation of lava volume using

Y. SUZUKI et al.: 2008 TO 2011 ERUPTIONS—INSIGHTS FROM ASH 607
oblique aerial photo in Shinmoedake Volcano, Fall Meeting of the Vol-canological Society of Japan, A1-13, 2011 (in Japanese).
Shimano, T., S. Nakada, and T. Kaneko, Evaluation of magmatic contri-bution to the 2000 eruption at Usu Volcano, North Japan, by XRF bulkash composition analysis, Bull. Earthq. Res. Inst., 76, 247–251, 2001(in Japanese with English abstract).
Shimbori, T. and K. Fukui, Time variation of the eruption cloud echoheight from Shinmoe-dake volcano in 2011 observed by Tanegashimaand Fukuoka weather radars, Rep. Coord. Comm. Predict. Volcan.Erup., 108, 189–196, 2012 (in Japanese).
Suzuki, Y. and S. Nakada, Vesiculation and magma ascent process inthe Usu 2000 eruption, inferred from texture and size distribution ofbubbles, Bull. Volcanol. Soc. Jpn., 47, 675–688, 2002 (in Japanese withEnglish abstract).
Suzuki, Y., J. E. Gardner, and J. F. Larsen, Experimental constraints onsyneruptive magma ascent related to the phreatomagmatic phase of the2000AD eruption of Usu volcano, Japan, Bull. Volcanol., 69, 423–444,2007.
Suzuki, Y., A. Yasuda, N. Hokanishi, T. Kaneko, S. Nakada, and T. Fu-jii, Syneruptive deep magma transfer and shallow magma remobiliza-tion during the 2011 eruption of Shinmoe-dake, Japan—Constraintsfrom melt inclusions and phase equilibria experiments—, J. Volcanol.Geotherm. Res., 257, 184–204, 2013.
Taddeucci, J., M. Pompilio, and P. Scarlato, Monitoring the explosiveactivity of the July–August 2001 eruption of Mt. Etna (Italy) by ashcharacterization, Geophys. Res. Lett., 29, doi:10.1029/2001GL014372,
2002.Taddeucci, J., M. Pompilio, and P. Scarlato, Conduit processes during the
July–August 2001 explosive activity of Mt. Etna (Italy): inferences fromglass chemistry and crystal size distribution of ash particles, J. Volcanol.Geotherm. Res., 137, 33–54, 2004.
Tajima, Y., S. Hayashi, A. Yasuda, and H. Itho, Tephrostratigraphy anderuptive history of Shinmoedake volcano of the Kirishima volcanoes,Kyushu, Japan, Quatern. Res., 52, 2013 (in Japanese with English ab-stract).
Tsutsui, M., K. Tomita, and T. Kobayashi, Fumarolic activity since Decem-ber 2003 and volcanic activity during the Meiji and Taisho Eras (1880–1923) of Ohachi Volcano, Kirishima Volcano Group, Southern Kyushu,Japan, Bull. Volcanol. Soc. Jpn., 50, 475–489, 2005 (in Japanese withEnglish abstract).
Ueda, H., T. Kozono, E. Fujita, Y. Kohno, M. Nagai, Y. Miyagi, and T.Tanada, Crustal deformation associated with the 2011 Shinmoe-dakeeruption as observed by tiltmeters and GPS, Earth Planets Space, 65,this issue, 517–525, doi:10.5047/eps.2013.03.001, 2013.
Yakiwara, H., K. Goto, S. Hirano, H. Miyamachi, and S. Nakao, Seismic-ity in and around Kirishima Volcanic Group for recent 10 years andtemporary seismic observation, Japan Geoscience Union Meeting 2011,SVC070-P42, 2011.
Y. Suzuki (e-mail: [email protected]), M. Nagai, F. Maeno, A.Yasuda, N. Hokanishi, T. Shimano, M. Ichihara, T. Kaneko, and S. Nakada