predator-induced defences in daphnia pulex - biomed central
TRANSCRIPT
Spanier et al. BMC Molecular Biology 2010, 11:50http://www.biomedcentral.com/1471-2199/11/50
Daphnia GenomicsConsortium
Open AccessR E S E A R C H A R T I C L E
Research articlePredator-induced defences in Daphnia pulex: Selection and evaluation of internal reference genes for gene expression studies with real-time PCRKatina I Spanier†1, Florian Leese*†1, Christoph Mayer1, John K Colbourne3, Don Gilbert3, Michael E Pfrender2 and Ralph Tollrian1
AbstractBackground: The planktonic microcrustacean Daphnia pulex is among the best-studied animals in ecological, toxicological and evolutionary research. One aspect that has sustained interest in the study system is the ability of D. pulex to develop inducible defence structures when exposed to predators, such as the phantom midge larvae Chaoborus. The available draft genome sequence for D. pulex is accelerating research to identify genes that confer plastic phenotypes that are regularly cued by environmental stimuli. Yet for quantifying gene expression levels, no experimentally validated set of internal control genes exists for the accurate normalization of qRT-PCR data.
Results: In this study, we tested six candidate reference genes for normalizing transcription levels of D. pulex genes; alpha tubulin (aTub), glyceraldehyde-3-phosphate dehydrogenase (GAPDH), TATA box binding protein (Tbp) syntaxin 16 (Stx16), X-box binding protein 1 (Xbp1) and CAPON, a protein associated with the neuronal nitric oxide synthase, were selected on the basis of an earlier study and from microarray studies. One additional gene, a matrix metalloproteinase (MMP), was tested to validate its transcriptional response to Chaoborus, which was earlier observed in a microarray study. The transcription profiles of these seven genes were assessed by qRT-PCR from RNA of juvenile D. pulex that showed induced defences in comparison to untreated control animals. We tested the individual suitability of genes for expression normalization using the programs geNorm, NormFinder and BestKeeper. Intriguingly, Xbp1, Tbp, CAPON and Stx16 were selected as ideal reference genes. Analyses on the relative expression level using the software REST showed that both classical housekeeping candidate genes (aTub and GAPDH) were significantly downregulated, whereas the MMP gene was shown to be significantly upregulated, as predicted. aTub is a particularly ill suited reference gene because five copies are found in the D. pulex genome sequence. When applying aTub for expression normalization Xbp1 and Tbp are falsely reported as significantly upregulated.
Conclusions: Our results suggest that the genes Xbp1, Tbp, CAPON and Stx16 are suitable reference genes for accurate normalization in qRT-PCR studies using Chaoborus-induced D. pulex specimens. Furthermore, our study underscores the importance of verifying the expression stability of putative reference genes for normalization of expression levels.
BackgroundGene-expression studies provide insights into the regula-tory processes of genes that modulate phenotypes of
organisms. The two most reliable techniques to date thatdirectly measure and compare the differential response ingene expression are microarray studies and quantitativereal-time reverse transcription polymerase chain reaction(qRT-PCR) analyses. Microarrays provide a high-throughput measurement of the transcriptional changesfor thousands of genes, within short time, from limited
* Correspondence: [email protected] Ruhr-University Bochum, Department of Animal Ecology, Evolution and Biodiversity, D-44780 Bochum, Germany† Contributed equallyFull list of author information is available at the end of the article
© 2010 Spanier et al; licensee BioMed Central Ltd. This is an Open Access article distributed under the terms of the Creative CommonsAttribution License (http://creativecommons.org/licenses/by/2.0), which permits unrestricted use, distribution, and reproduction inany medium, provided the original work is properly cited.

Spanier et al. BMC Molecular Biology 2010, 11:50http://www.biomedcentral.com/1471-2199/11/50
Page 2 of 11
number of RNA samples. However, quality of expressiondata can vary substantially and is often validated by a sec-ond method. In contrast to microarrays, qRT-PCR pro-vides precise quantification over a wider dynamic range.Because of the higher sensitivity, qRT-PCR is often usedto validate microarray data. Several variables can stillintroduce biases in qRT-PCR studies. For example, theamount and quality of template RNA, the enzymatic effi-ciencies and other in vitro artefacts can add technicalvariability to the data y[1-4]. Hence, experiments are typ-ically standardized and expression levels need to be nor-malized [5,6]. Normalization is accomplished in severalways; the expression values from target genes of interestcan be balanced against the total amount of RNA in thereactions, balanced against synthetic RNA that is "spiked"in each reaction, or measured against internal referencegenes. This last method is generally considered reliableand is frequently applied for quantifying relative geneexpression [7]. Yet, several studies have shown that thisapproach can introduce large errors when the expressionof such "housekeeping genes" varies under different treat-ments and in different tissues [e.g. [8]]. To improverobustness of the experiment, it is recommended to usemore than one reference gene [7,9] and to verify that theirtranscriptional activity are stable across conditions andtissue types. Because it is difficult to assess the expressionstability of a reference gene by itself, current approachesaim to analyze the expression levels of several candidatereference genes with respect to each other. In sampleswith different amounts of input RNA the ratio of twoideal reference genes remains constant.
Once suitable reference genes for a certain experimentare selected, a normalization factor (NF), which is thegeometric mean of the crossing point (CP) values of thereference genes, is calculated for normalization of thegenes under investigation, i.e. to remove nonspecific vari-ation in the data.
Selection of reference genes for Daphnia pulexSo far, no systematic validation of reference genes in D.pulex has been published. In a recent study, Schwarzen-berger et al. [10] tested the expression stability of sevengenes in a different species, D. magna, and found glycer-aldehyde-3-phosphate dehydrogenase (GAPDH), TATAbox binding protein (Tbp), and succinate dehydrogenase(sucDH) suitable for normalization of gene expression inpredator experiments (fish and phantom midge larvaeChaoborus). Under low-food quality conditions (micro-cystin-producing strain of the cyanobacterium Microcys-tis), Tbp, 18S, and alpha tubulin (aTub) were suitablereference genes and GAPDH and ubiquitin conjugatingenzyme (UBC) significantly upregulated [10]. Heckmannet al. [11] investigated the expression stability of severalgenes also in D. magna, when exposed to ibuprofen. They
selected GAPDH, an actin gene (similar to actin isoform3 in D. pulex) and UBC as the most stable reference genesand showed that aTub was differentially regulated. Riderand LeBlanc [12] and Zeis et al. [13] used beta-actin as asingle reference gene for D. magna without prior valida-tion of its suitability for expression normalization. Thecandidate reference genes chosen for our analysis includethree frequently applied housekeeping genes, aTub,GAPDH, Tbp, and three genes with microarray supportfor stable expression: Syntaxin 16 (Stx16), X-box bindingprotein 1 (Xbp1) and CAPON (see Table 1). Xbp1 is atranscription factor which is activated through differen-tial splicing. It plays a major role in unfolded proteinresponse in eukaryotes [14] and is critical for larval devel-opment of Drosophila [15].
CAPON is a protein which targets the neuronal nitric-oxide synthase to the presynaptic nerve terminal in mice[16]. To test the performance of candidate referencegenes in an actual experiment, one gene with expecteddifferential expression levels encoding for a matrix metal-loproteinase (MMP) was selected on the basis microarraydata (manuscript in preparation). MMPs are a family ofevolutionary conserved extracellular proteases that playimportant roles in cell-cell signaling processes in mostanimal species [17-19]. Most importantly, they processand degrade extra- and pericellular proteins. A precisefunction of MMP in D. pulex has not yet been described.
The expression levels of these seven genes were mea-sured by qRT-PCR using D. pulex juveniles that wereexposed to water-borne chemical cues (kairomones)released by Chaoborus larvae and manifested the charac-teristic defence-against-predator phenotype called neck-teeth ('induced' animals) [20]. These recorded genetranscript levels were compared to expression levels inunexposed juveniles without neckteeth (control) thathave not been exposed to Chaoborus larvae. To date, nosingle best strategy for the selection of reference genesexists. Therefore, the suitability of the genes as referencemarkers for normalization was assessed using three dif-ferent algorithms implemented in the programs Best-Keeper [9], geNorm [7] and NormFinder [21] andevaluated by normalizing the expression level of a regu-lated gene against different sets of the candidate referencegenes.
Results and discussionRNA QualityRNA concentration and purity was measured with theNanoDrop ND-1000 spectrophotometer (NanoDropTechnologies). The mean (± SD) A260/280 ratio of thesamples was 2.02 ± 0.05, indicating pure (protein free)RNA quality. RNA integrity of samples was furtherchecked by capillary gel electrophoresis on the StdSens

Spanier et al. BMC Molecular Biology 2010, 11:50http://www.biomedcentral.com/1471-2199/11/50
Page 3 of 11
chip of the Experion RNA StdSens Analysis Kit (Bio-Rad).
qRT-PCR efficiencies and intra-assay variationThe expression levels of the seven candidate referencegenes were measured in triplicates with qRT-PCR in 12biological replicates of each induced and non-induceddaphnids (50 individuals per replicate). The CP values,which negatively correlate with the concentration of tar-get sequence present at the very beginning of the amplifi-cation reaction [22], ranged from 19.72 cycles for thegene with the highest expression (GAPDH) to 28.95cycles for MMP, which showed the lowest expression(Table 2). The standard deviation (SD) within triplicatesranged from 0.044 to 0.532 cycles with a mean of 0.242cycles. Mean PCR efficiencies varied from 90% to 94%(Table 1).
Descriptive analysis of the reference genesThe expression variation of each candidate referencegene was assessed using BestKeeper v. 1.0 [9]. Pfaffl et al.
[9] recommend to exclude genes with a SD of the meanCP of > 1 from the NF (here called BestKeeper Index),which corresponds to a starting template variation by thefactor two. MMP had a SD [CP] of 1.56 and was thereforeexcluded for further analyses (Table 2). The remaininggenes showed minor fluctuations in expression levels(0.65 < SD [CP] < 0.86) and a strong correlation with theBestKeeper index (coefficient of correlation r between0.803 and 0.982) after the exclusion of MMP, which indi-cates expression stability. The expression of all geneshighly correlated with the NF, which is supported by p-values < 0.001.
Ranking the candidate reference genesThe candidate reference genes were ranked with respectto their suitability as reference genes using the programsgeNorm v. 3.5 [7] and NormFinder v.0.953 [21]. geNormutilizes a pairwise comparison approach and calculates agene-stability measure M, which is the arithmetic meanof the pairwise variations between a particular gene andall other candidate control genes. The least stable genes
Table 1: Candidate reference and differentially expressed genes with putative function and gene ID from the Dappu V1.1 draft genome annotation, primer sequences, amplicon characteristics.
Gene symbol
Gene name (putative) Function
Gene ID P Primer sequences [5'→3'] L (bp) Localization in gene
E (%)
aTub alpha Tubulin Cytoskeletal protein
Dappu-301837 5 GCATGTTGTCCAACACTACTGC 135 3' exon 91
CCTCAGAGAACTCTCCCTCCTC
GAPDH Glyceraldehyde-3-phosphate dehydrogenase
Glycolytic enzyme
Dappu-302823 0 TGGGATGAGTCACTGGCATAC 136 3' exon 93
GAAAGGACGACCAACAACAAAC
Tbp TATA binding protein Transcription initiation
Dappu-194512 0 CTACGATGCATTCGATAACATATACC 144 3' exon 90
AGAACCAGCAATGAGTTAAACAAAG
Stx16 Syntaxin 16 Protein involved in exocytosis
Dappu-194044 0 CACATTGGTCGTCCTTAGTCTTG 148 3' exon 93
TGCTATACGTTACGCTTGTCCTTAC
Xbp1 X-box binding protein 1 Transcription factor
Dappu-314438 0 CCGATATTCGAGACTGCAATG 131 3' exon 93
AAAGATGGGTGAGCCAGAAATAC
MMP Matrix metallo-proteinase
Degradation of extracellular proteins
Dappu-303491 0 CGAAACATGGACGCATAACTC 80 spanning penultimate 3' intron
92
GTCCCAAAGTGTGACCGAAC
CAPON C-terminal pdz ligand of neuronal nitric oxide synthase
Location of neuronal nitric oxide synthase
Dappu-100564 0 TAACGAGTCGGGAGGAAGTG 140 3' exon 94
GCTGGACTTGAGCCAGTATCTC
Abbreviations: E: amplification efficiency; P: number of paralogs in D. pulex genome; L: length of the amplicon

Spanier et al. BMC Molecular Biology 2010, 11:50http://www.biomedcentral.com/1471-2199/11/50
Page 4 of 11
have the highest M values and are successively excluded.The program also indicates the minimum number of ref-erence genes that should be included in the NF by calcu-lating the pairwise variation V reflecting the effect of theinclusion of an additional control gene on the NF. Theauthors of geNorm suggest the analysis of at least 8 sam-ples per group and 5 to 10 candidate genes. Figure 1Ashows the stepwise exclusion of the least stable genes andthe average expression stability measure M of the remain-ing genes. The last two genes could not be further rankedbecause the calculation involves the ratio of expressionlevels. Also in this calculation, MMP was the first gene tobe excluded because of the high value for M. The resultsof geNorm suggest Tbp and CAPON as the most stablyexpressed reference genes. However, Vandesompele et al.[7] highly recommended using at least three referencegenes and a cut-off value of pairwise variation of 0.15.Starting with Tbp and CAPON we included Xbp1 as athird reference gene (Figure 1B). The pairwise variationfor the inclusion of Xbp1 was 0.135 (V2/3) and thus liesbelow the suggested cut-off. Pairwise variation even fur-ther decreased with the inclusion of Stx16 (V3/4: 0.122),GAPDH (V4/5: 0.114) and aTub (V5/6: 0.108) andexceeds the 0.15 pairwise variation cut-off only after theinclusion of MMP (V6/7: 0.197).
The second program utilized was NormFinder. Itapplies a model-based approach, which in contrast togeNorm allows the assignment of groups to the samples(treatment vs. control). Inter- and intragroup variationsare used for the calculation of a stability value i.e., candi-dates with minimal combined intra- and intergroup vari-ation are ranked as the most stable genes. This approachhas advantages over the pairwise comparison approach ofgeNorm if coregulated genes, inappropriate as referencegenes, could bias the results [21].
In a first analysis with NormFinder, all seven geneswere tested for intra- and intergroup variation by assign-ing the samples to the two groups (induced and control).
The intergroup variation was very high for MMP (±0.476) and lowest for those of CAPON, Tbp and Xbp1,which lay between ± 0.008 and ± 0.037 (Table 3). The pro-gram indicated Xbp1 as the best reference gene with astability value of 0.079 and Tbp and Xbp1 as the bestcombination of two genes with an even better combinedstability value of 0.075.
The NormFinder approach attempts to compensate forexpression differences between treatment and control byselecting combinations of genes with opposite expressionand as little intra- and intergroup variation as possible.Therefore, in our second NormFinder analysis, those
Table 2: Descriptive statistic analysis with BestKeeper
Gene aTub GAPDH Tbp Stx16 Xbp1 MMP CAPON
N 24 24 24 24 24 24 24
GM [CP] 20.83 19.7 27.66 26.88 26.41 28.89 27.73
AM [CP] 20.87 19.72 27.68 26.9 26.44 28.95 27.74
Min [CP] 19.19 18.67 26.74 25.49 24.81 24.63 26.43
Max [CP] 26.84 23.58 30.16 30.71 29.14 33.67 30.21
SD [CP] 0.82 0.65 0.65 0.77 0.86 1.56 0.71
CV [% CP] 3.92 3.29 2.37 2.86 3.24 5.37 2.54
Min [x-fold] -2.68 -1.89 -1.73 -2.36 -2.69 -13.75 -2.26
Max [x-fold] 36.98 10.96 4.4 10.6 5.43 18.92 4.72
SD [± x-fold] 1.62 1.47 1.47 1.58 1.66 2.51 1.52
BK Corr [r] 0.875 0.84 0.952 0.952 0.978 0.751 0.884
p-value 0.001 0.001 0.001 0.001 0.001 0.001 0.001
BK Corr -MMP [r] 0.943 0.917 0.922 0.982 0.944 0.803
p-value 0.001 0.001 0.001 0.001 0.001 0.001 0.001
Abbreviations: N: number of samples; GM [CP]: the geometric mean of CP; AM [CP]: the arithmetic mean of CP; Min [CP] and Max [CP]: the extreme values of CP; SD [CP]: the standard deviation of the CP; CV [% CP]: the coefficient of variance expressed as a percentage on the CP level; Min [x-fold] and Max [x-fold]: the extreme values of expression levels expressed as an absolute x-fold over- or under-regulation coefficient; SD [± x-fold]: standard deviation of the absolute regulation coefficients; BK CorrC [r]: Pearson correlation coefficient, correlation between the BestKeeper index and the contributing gene. BK Corr -MMP [r]: Pearson correlation coefficient between BestKeeper index without MMP in the analysis and the contributing gene.

Spanier et al. BMC Molecular Biology 2010, 11:50http://www.biomedcentral.com/1471-2199/11/50
Page 5 of 11
genes with a high intergroup variation (aTub, GAPDHand MMP) - and thus a high bias on the selection of thebest genes for normalization - were excluded (Table 4,NormFinder II analysis). The analyses of these genes inthis study revealed that Stx16 has the lowest, i.e. best sta-bility value in combination with Xbp1 (0.076), althoughStx16 alone had the highest, i.e. worst stability value(0.146). The variations in expression levels are oppositeand thus compensate for each other.
The three different algorithmic approaches applied inthis study yielded mostly concordant results. All pro-grams clearly identified MMP as an unstably expressedgene. BestKeeper, however, did not provide information,which of the remaining genes should best be used to nor-malize qRT-PCR results. The programs geNorm andNormFinder both ranked Xbp1, Tbp, CAPON and Stx16as the genes with the highest expression stability, albeit in
a different order. As briefly mentioned above, the use andcomparison of both programs is highly recommended,because in principle, results can be strongly biased by theanalytical approach selected [23].
Because the results of geNorm and NormFinder arelargely concordant, we conclude that there are no signifi-cantly coregulated genes in the seven genes studied.Thus, there is no need to choose genes with opposite reg-ulation in induced and control samples. It is largelyaccepted that at least three reference genes should beused for normalization, as every additional gene increasesthe robustness of the NF. Based on the analyses usinggeNorm and NormFinder, we consider Tbp, CAPON andXbp1 as a good set of internal reference genes for expres-sion analysis of Chaoborus-treated daphnids (Table 5).The results of the NormFinder II analysis (Table 4)showed that the three highest ranked genes (Xbp1, Tbp
Figure 1 Stability of the investigated candidate reference genes (A) and pairwise variations (B) calculated with geNorm.
Average expression stability values of remaining control genes
0.3
0.4
0.5
0.6
0.7
0.8
0.9
MMP aTub GAPDH Stx16 Xbp1 TbpCAPON
Least stable genes Most stable genes
Ave
rage
exp
ress
ion
stab
ility
M
Determination of the optimal number of control genes for normalization
0.1350.122
0.1140.108
0.197
0.000
0.050
0.100
0.150
0.200
0.250
Pairwise Variations
V2/3 V3/4 V4/5 V5/6 V6/7
A) B)
Table 3: Candidate reference gene inter- and intragroup variation (conrol vs. induced specimens).
Gene name Stability value Intergroup variation Intragroup variation
Induced Control Induced Control
Xbp1 0.079 0.037 -0.037 0.02 0.005
Tbp 0.092 0.019 -0.019 0.06 0.014
CAPON 0.101 0.008 -0.008 0.163 0.004
Stx16 0.175 -0.121 0.121 0.062 0.001
aTub 0.337 -0.202 0.202 0.409 0.046
GAPDH 0.338 -0.217 0.217 0.128 0.124
MMP 0.602 0.476 -0.476 0.742 0.468
Best gene Xbp1
Stability value 0.079
Best combination of two genes Tbp and Xbp1
Stability value for best combination of two genes 0.075
Ranking according to expression stability calculated with NormFinder (NormFinder I analysis)

Spanier et al. BMC Molecular Biology 2010, 11:50http://www.biomedcentral.com/1471-2199/11/50
Page 6 of 11
and CAPON) have a slight tendency towards higherexpression in the induced compared to the non-inducedsamples. It might therefore be advisable to include Stx16as a fourth reference gene, because of its opposingexpression, as advocated by Andersen et al. [21].
The genes Xbp1 and CAPON have not yet been used asnormalization genes in any study. However, the system-atic validation in this study provides evidence that theyare suitable reference genes under these experimentalconditions despite comparatively low transcription levels(CP > 25). Most importantly, they are much more stably
expressed between experimental groups than the classicalhousekeeping genes aTub and GAPDH. In general, varia-tion is expected to be inversely proportional to the ampli-fied target amount but low variation despite high CP (Ct)values has been observed in other studies as well [e.g.[24]].
Evaluation of the selected reference genesThe choice of reference genes can have a strong impacton the results in relative expression studies [25]. To testthe impact of reference gene selection and to evaluate thesuitability of the reference genes selected in this study, thedifferential expression of MMP between Chaoborus-induced and non-induced daphnids was assessed usingthree different sets of reference genes - (1) the most stablegenes identified by geNorm and NormFinder, (2) the clas-sical housekeeping genes (aTub, GAPDH and Tbp) and(3) all six candidate reference genes (Table 6, Figure 2).Furthermore, we tested aTub and GAPDH, which weredeemed unstable with high intergroup variation, to deter-mine if this was due to unspecific fluctuations or to a sig-nificant differential expression of both genes (Table 6,Figure 2). In addition, we assessed the effects of using sin-gle traditional housekeeping genes (aTub and GAPDH)for normalization of expression levels only (additional file1).
Expression analyses were done using the relativeexpression software tool REST v. 2.0.7 [26]. REST appliesthe efficiency-corrected comparative CP method [27] andperforms randomization tests to estimate a sample'sexpression ratio and the likelihood of up or down regula-tion, taking into account several reference genes and theindividual amplification efficiency of each gene. The Pvalues obtained from the randomization tests in RESTindicate the likelihood of observing differences betweensample and control groups due to chance alone. They
Table 4: NormFinder analysis of the four genes with the lowest (best) stability value in the previous analysis (NormFinder II analysis)
Intergroup variation Intragroup variation
Stability value Induced Control Induced Control
Xbp1 0.088 0.051 -0.051 0.024 0.006
Tbp 0.093 0.033 -0.033 0.079 0.013
CAPON 0.102 0.022 -0.022 0.02 0.044
Stx16 0.146 -0.107 0.107 0.288 0.04
Best gene Xbp1
Stability value 0.088
Best combination of two genes Xbp1 and Stx16
Stability value for best combination of two genes 0.076
Table 5: Most stable reference genes and optimum number of reference genes calculated by geNorm and NormFinder
geNorm NormFinder
1st analysis 2nd analysis
Tbp/CAPON Xbp1 Xbp1
Xbp1 Tbp Tbp
Stx16 CAPON CAPON
GAPDH Stx16 Stx16
aTub aTub
MMP GAPDH
MMP
Optimum number 3 2 2
Genes are ranked according to Figure 1A (geNorm) and to their stability values in Table 3 and 4, respectively (NormFinder). In bold letters: The recommended optimum combination of genes.
Spanier et al. BMC Molecular Biology 2010, 11:50http://www.biomedcentral.com/1471-2199/11/50
Page 7 of 11
were calculated by 10,000 random reallocations of sam-ples and controls between the groups and counting thenumber of times the relative expression on the randomlyassigned group is greater than the sample data (see RESTmanual http://www.gmo-qpcr-analysis.com/REST2008_Manual_v207.pdf).
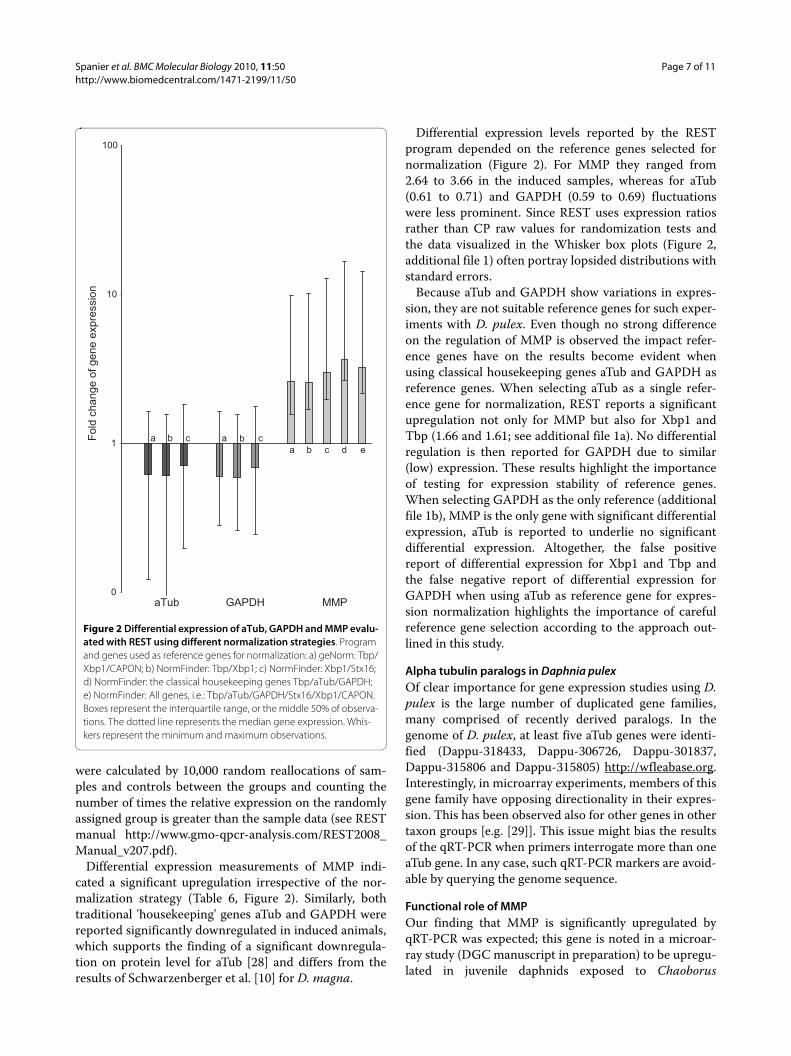
Differential expression measurements of MMP indi-cated a significant upregulation irrespective of the nor-malization strategy (Table 6, Figure 2). Similarly, bothtraditional 'housekeeping' genes aTub and GAPDH werereported significantly downregulated in induced animals,which supports the finding of a significant downregula-tion on protein level for aTub [28] and differs from theresults of Schwarzenberger et al. [10] for D. magna.
Differential expression levels reported by the RESTprogram depended on the reference genes selected fornormalization (Figure 2). For MMP they ranged from2.64 to 3.66 in the induced samples, whereas for aTub(0.61 to 0.71) and GAPDH (0.59 to 0.69) fluctuationswere less prominent. Since REST uses expression ratiosrather than CP raw values for randomization tests andthe data visualized in the Whisker box plots (Figure 2,additional file 1) often portray lopsided distributions withstandard errors.
Because aTub and GAPDH show variations in expres-sion, they are not suitable reference genes for such exper-iments with D. pulex. Even though no strong differenceon the regulation of MMP is observed the impact refer-ence genes have on the results become evident whenusing classical housekeeping genes aTub and GAPDH asreference genes. When selecting aTub as a single refer-ence gene for normalization, REST reports a significantupregulation not only for MMP but also for Xbp1 andTbp (1.66 and 1.61; see additional file 1a). No differentialregulation is then reported for GAPDH due to similar(low) expression. These results highlight the importanceof testing for expression stability of reference genes.When selecting GAPDH as the only reference (additionalfile 1b), MMP is the only gene with significant differentialexpression, aTub is reported to underlie no significantdifferential expression. Altogether, the false positivereport of differential expression for Xbp1 and Tbp andthe false negative report of differential expression forGAPDH when using aTub as reference gene for expres-sion normalization highlights the importance of carefulreference gene selection according to the approach out-lined in this study.
Alpha tubulin paralogs in Daphnia pulexOf clear importance for gene expression studies using D.pulex is the large number of duplicated gene families,many comprised of recently derived paralogs. In thegenome of D. pulex, at least five aTub genes were identi-fied (Dappu-318433, Dappu-306726, Dappu-301837,Dappu-315806 and Dappu-315805) http://wfleabase.org.Interestingly, in microarray experiments, members of thisgene family have opposing directionality in their expres-sion. This has been observed also for other genes in othertaxon groups [e.g. [29]]. This issue might bias the resultsof the qRT-PCR when primers interrogate more than oneaTub gene. In any case, such qRT-PCR markers are avoid-able by querying the genome sequence.
Functional role of MMPOur finding that MMP is significantly upregulated byqRT-PCR was expected; this gene is noted in a microar-ray study (DGC manuscript in preparation) to be upregu-lated in juvenile daphnids exposed to Chaoborus
Figure 2 Differential expression of aTub, GAPDH and MMP evalu-ated with REST using different normalization strategies. Program and genes used as reference genes for normalization: a) geNorm: Tbp/Xbp1/CAPON; b) NormFinder: Tbp/Xbp1; c) NormFinder: Xbp1/Stx16; d) NormFinder: the classical housekeeping genes Tbp/aTub/GAPDH; e) NormFinder: All genes, i.e.: Tbp/aTub/GAPDH/Stx16/Xbp1/CAPON. Boxes represent the interquartile range, or the middle 50% of observa-tions. The dotted line represents the median gene expression. Whis-kers represent the minimum and maximum observations.
0
1
10
100
Fold
cha
nge
of g
ene
expr
essi
on
aTub GAPDH MMP
a aa
bbb
cc
cd e

Spanier et al. BMC Molecular Biology 2010, 11:50http://www.biomedcentral.com/1471-2199/11/50
Page 8 of 11
kairomone. According to the most recent JGI annotation,the MMP gene found is a Meprin A metalloprotease.NCBI BLAST matches it to genes that are members ofthe protein family Astacin (peptidase family M12A;PF01400). MMPs are known to play an important role indevelopment, in particular in degrading and processingproteins, and are associated with cell-cell signalling path-ways [17-19]. Although our data clearly identified MMPas a differentially expressed candidate gene, subsequentanalyses should now focus on analyzing the function ofthis gene product in D. pulex to understand its relevancein the context of predator-induced defences.
ConclusionsOur results suggest that Xbp1, Tbp, CAPON and Stx16are suitable internal reference genes for studying relativegene expression levels in D. pulex that are challenged byChaoborus predation. Two traditional housekeepinggenes, GAPDH and aTub, were studied with qRT-PCRand found to have a strong expression variation and weresignificantly downregulated. One candidate gene withassumed differential expression, MMP, was found to besignificantly upregulated. Using aTub as reference geneleads to a strong bias in reported expression levels
emphasizing the importance of thorough reference geneevaluation prior to target gene expression profiling. Inparticular, for further studies investigating transcriptionalresponses of Daphnia to other treatments we recom-mend to experimentally verify stable expression of refer-ence genes prior to data acquisition in order to improveaccuracy and reliability of qRT-PCR data.
MethodsTest speciesDaphnia pulex (Clone R9) were used for our study.Daphnia medium consisted of charcoal filtered tab water.All Daphnia cultures and experiments were conducted at20°C with a 16/8-h light/dark cycle. Culture daphnidswere maintained at a density of ~50 animals per litre andfed daily with the unicellular green algae Scenedesmusspp. which was cultured in the laboratory.
Predator assayInduction of D. pulex was carried out by incubating age-synchronized adult females in 1 l glass beakers with anylon net cage containing 20 Chaoborus sp. larvae so thatthe adult females and their offspring had contact withChaoborus kairomones but would not be preyed upon.
Table 6: Results of the gene expression analysis with REST for aTub, GAPDH and MMP with different normalization strategies
Normalized against Target gene x-fold change in gene expression* SE range P
geNorm: Tbp, Xbp1, Capon aTub 0.62 0.50 - 1.02 0.009
GAPDH 0.60 0.32 - 1.06 0.007
MMP 2.64 1.06 - 7.18 0.003
NormFinder I: Tbp, Xbp1 aTub 0.61 0.51 - 0.97 0.001
GAPDH 0.59 0.33 - 0.97 0.002
MMP 2.60 0.90 - 7.68 0.005
NormFinder II: Xbp1, Stx16 aTub 0.71 0.51 - 1.13 0.034
GAPDH 0.69 0.44 - 1.08 0.013
MMP 3.02 1.05 - 9.80 0.003
Classical HKGs: Tbp, aTub, GAPDH MMP 3.66 1.00 - 13.16 0.003
All genes MMP 3.27 1.11 - 11.07 0.002
*x-fold change in gene expression in the induced samples compared to the control group.

Spanier et al. BMC Molecular Biology 2010, 11:50http://www.biomedcentral.com/1471-2199/11/50
Page 9 of 11
Chaoborus larvae were fed daily with 40 juveniledaphnids. The control group was reared in similar glassbeakers with nylon net cages that did not contain Chao-borus larvae.
Twelve biological replicates of induction and control,respectively, were conducted.
Neonate daphnids were separated daily from the moth-ers. They were reared under the same conditions untilthey reached the second juvenile instar, and batches of 50animals were preserved in 20 μl RNAlater (Qiagen) andstored at 4°C until RNA extraction. A representativeamount of induced and non-induced juveniles werechecked for the presence and absence of neckteeth,respectively. Batches that did not show the appropriatephenotypic expression were discarded.
RNA isolation and cDNA synthesisRNAlater was decanted from the specimens and RNAwas extracted using the MasterPure Complete DNA andRNA Purification Kit (Epicentre) according to the manu-facturer's protocol. The purified nucleic acids were resus-pended in 30 μl of RNAse free water. The integrity of theRNA samples was checked with Experion RNA StdSensAnalysis Kit (Bio-Rad) and concentration and purity withthe NanoDrop ND-1000 spectrophotometer (NanoDropTechnologies). An amount of 1 μg of each extraction wasreverse-transcribed with QuantiTect Reverse Transcrip-tion Kit (Qiagen) according to the manufacturer's proto-col, which included a 20 min DNAse I digestion prior toreverse transcription. For reverse transcription oligo(dT)primers (1 μM) were used. The cDNA was diluted ten-fold with RNAse free water.
Samples were checked with PCR (GAPDH primer pair)for genomic DNA contamination after the DNAse Idigestion. An additional positive control was the singleproduct of 80 bp in the qRT-PCR reactions with theMMP primer pair which was designed to span an intron.
Identification of candidate reference genesThe sequences of putative genes with microarray andEST support and a gene prediction (data available fromhttp://wfleabase.org) were aligned using tBLASTx againstNCBI (National Center for Biotechnology Information)nucleotide database sequences to find homologue genesand assign a putative function. Unpublished microarraydata (manuscript in preparation) were then taken as basisto estimate expression stability.
Design and validation of qRT-PCR primersFor primer design, the Primer3 v. 0.4.0 software [30] wasused with the following settings differing from the defaultparameters:
Primer size of 20-27 bp, amplicon size 130-150 bp,melting temperature 60-61°C; maximum temperature dif-ference of 0.5°C, maximum length of a polynucleotide
repeat 3, and a number of consecutive Gs and Cs at the 3'end of 1.
Primers were designed preferentially for the 3'-exon.The primers for MMP span the last 3'-intron. To checkfor mispriming primers were blasted (BLASTn) againstthe genome of D. pulex. Primers with a binding energyΔG of less than -3 kcal/mole and -2 kcal/mole for internalhairpins and hairpins at the 3'-end, respectively, as well asthose with less than -6 kcal/mole and -5 kcal/mole forinternal or 3' self and cross dimers, respectively, calcu-lated with Beacon Designer Free Edition of Premier Bio-soft International, were excluded.
Real-time quantitative PCRThe PCR mix consisted of 2 μl cDNA (equivalent toapproximately 10 ng cDNA), 10 μl of the DyNAmo FlashSYBR Green qPCR Kit (Finnzymes), primer concentra-tions of 300 nM of forward and reverse primers each(Stx16, Tbp, MMP, CAPON), 100 nM each (aTub,GAPDH), 400 nM each (Xbp), and PCR-grade water upto a total volume of 20 μl.
Reactions were performed in triplicates and a no-tem-plate control was included. Every gene was tested for allbiological replicates on a separate 96-well plate.
PCR reactions were performed using the DNA EngineOpticon 2 Two-Color Real-Time PCR Detection System(Bio-Rad) and the following conditions: 10 min at 95°Cand 40 cycles of 95°C for 15 s, followed by 60°C for 1 min;finally 1 min at 55°C. Amplification specificity was veri-fied based on the melting curve which was obtained byheating in steps of 0.3°C from 60°C to 95°C.
Analysis of candidate reference genesOptical raw data (not baseline corrected) were exportedfrom the Opticon Monitor software v. 3.1 (Bio-Rad) intoMS Excel (Microsoft) and processed with the programLinRegPCR v. 11.0 [31,32]. LinRegPCR determines CPvalues for each reaction and a mean PCR efficiency corre-sponding to a primer pair by a linear regression fit to thedata in the exponential phase of a reaction.
The BestKeeper descriptive statistical method wasapplied [9] on the CP values determined by LinRegPCR.
For subsequent analysis with the programs geNorm v.3.5 [7] and NormFinder v. 0.953 [21], CP values were con-verted to linear values.
Gene expression analysis and reference gene evaluationGene expression analysis of MMP in the induced versusthe non-induced samples was carried out with the rela-tive expression software tool REST v. 2.0.7 [26] RESTanalyzes gene expression data (based on CP values) withparticular emphasis on describing and visualizing uncer-tainty in expression ratios by introducing a randomiza-tion test, calculating confidence intervals and standard

Spanier et al. BMC Molecular Biology 2010, 11:50http://www.biomedcentral.com/1471-2199/11/50
Page 10 of 11
errors [see [26]]. Whisker box plots provide a visual rep-resentation of variation for each gene.
In this study CP values and mean efficiencies deter-mined with LinRegPCR were used for analysis and ran-domization tests were performed with 10,000 iterationsto assess the significance. The MMP expression levelswere normalized using five different strategies. Further-more, gene expression analysis was carried out for Tbp,Stx16, Xbp1, CAPON and MMP using the classical'housekeeping genes aTub and GAPDH as reference.
Additional material
AbbreviationsGenes: aTub: alpha tubulin; GAPDH: glyceraldehyde-3-phosphate dehydroge-nase; MMP: matrix metalloproteinase; Stx16: syntaxin 16; sucDH: succinatedehydrogenase; Tbp: TATA binding protein; UBC: ubiquitin conjugatingenzyme; Xbp1: X-box binding protein 1.Other: BLAST: basic local alignment search tool; CP: crossing point; NCBI:National Center for Biotechnology Information; NF: normalization factor; SD:standard deviation; qRT-PCR: quantitative real-time reverse transcription poly-merase chain reaction.
Authors' contributionsKIS, FL and RT designed the research. KS and FL carried out the moleculargenetic and statistic analyses, made the data interpretation and drafted themanuscript. CM helped with the data interpretation and provided bioinfor-matic support. MEP, DG and JKC provided the microarray data. RT, MEP, DG andJKC revised critically the manuscript. RT provided financial support to thestudy. All authors read and approved the final manuscript.
AcknowledgementsWe thank Carsten Balczun (Ruhr-University Bochum) who gave valuable com-ments on RNA extraction, real-time PCR setup and analysis, Linda Weiss (Ruhr-University Bochum) for helpful comments on the manuscript and the labora-tory rearing of Daphnia, and two anonymous reviewers for helpful suggestions. This work was supported by a grant of the Ruhr-University Bochum (Rektor-atsprogramm) to FL and CM. MEP was partly supported by NIH grant 5R24GM078274.The sequencing and portions of the analyses were performed at the DOE Joint Genome Institute under the auspices of the U.S. Department of Energy's Office of Science, Biological and Environmental Research Program, and by the Univer-sity of California, Lawrence Livermore National Laboratory under Contract No. W-7405-Eng-48, Lawrence Berkeley National Laboratory under Contract No. DE-AC02-05CH11231, Los Alamos National Laboratory under Contract No. W-7405-ENG-36 and in collaboration with the Daphnia Genomics Consortium (DGC) http://daphnia.cgb.indiana.edu. Additional analyses were performed by wFleaBase, developed at the Genome Informatics Lab of Indiana University with support to Don Gilbert from the National Science Foundation and the National Institutes of Health. Coordination infrastructure for the DGC is pro-vided by The Center for Genomics and Bioinformatics at Indiana University, which is supported in part by the METACyt Initiative of Indiana University, funded in part through a major grant from the Lilly Endowment, Inc. Our work benefits from, and contributes to the Daphnia Genomics Consortium.
Author Details1Ruhr-University Bochum, Department of Animal Ecology, Evolution and Biodiversity, D-44780 Bochum, Germany, 2University of Notre Dame, Department of Biological Sciences, Notre Dame, IN 46556 USA and 3Indiana University, The Center for Genomics and Bioinformatics, Bloomington, IN 47405 USA
References1. Bustin SA, Nolan T: Pitfalls of quantitative real-time reverse-
transcription polymerase chain reaction. J Biomol Tech 2004, 15:155-566.
2. Fleige S, Pfaffl MW: RNA integrity and the effect on the real-time qRT-PCR performance. Mol Aspects Med 2006, 27:126-139.
3. Pérez-Novo CA, Claeys C, Speleman F, Van Cauwenberge P, Bachert C, Vandesompele J: Impact of RNA quality on reference gene expression stability. Biotechniques 2005, 39:52-56.
4. Suslov O, Steindler DA: PCR inhibition by reverse transcriptase leads to an overestimation of amplification efficiency. Nucleic Acids Res 2005, 33:e181.
5. Huggett J, Dheda K, Bustin S, Zumla A: Real-time RT-PCR normalisation; strategies and considerations. Genes Immun 2005, 6:279-284.
6. Nolan T, Hands RE, Bustin SA: Quantification of mRNA using real-time RT-PCR. Nat Protoc 2006, 1:1559-1582.
7. Vandesompele J, De Preter K, Pattyn F, Poppe B, Van Roy N, De Paepe A, Speleman F: Accurate normalization of real-time quantitative RT-PCR data by geometric averaging of multiple internal control genes. Genome Biol 2002, 3:. 0034.1-0034.11
8. Schmittgen TD, Zakrajsek BA: Effect of experimental treatment on housekeeping gene expression: validation by real-time, quantitative RT-PCR. Journal of Biochemical and Biophysical Methods 2000, 46:69-81.
9. Pfaffl MW, Tichopad A, Prgomet C, Neuvians TP: Determination of stable housekeeping genes, differentially regulated target genes and sample integrity: BestKeeper - Excel-based tool using pair-wise correlations. Biotechnol Lett 2004, 26:509-515.
10. Schwarzenberger A, Courts C, von Elert E: Target gene approaches: Gene expression in Daphnia magna exposed to predator-borne kairomones or to microcystin-producing and microcystin-free Microcystis aeruginosa. BMC Genomics 2009, 10:527.
11. Heckmann LH, Connon R, Hutchinson TH, Maund SJ, Sibly RM, Callaghan A: Expression of target and reference genes in Daphnia magna exposed to ibuprofen. BMC Genomics 2006, 7:175.
12. Rider CV, LeBlanc GA: Atrazine stimulates hemoglobin accumulation in Daphnia magna: is it hormonal or hypoxic? Toxicol Sci 2006, 93:443-449.
13. Zeis B, Becher B, Goldmann T, Clark R, Vollmer E, Bölke B, Bredebusch I, Lamkemeyer T, Pinkhaus O, Pirow R, Paul RJ: Differential haemoglobin gene expression in the crustacean Daphnia magna exposed to different oxygen partial pressures. Biol Chem 2003, 384:1133-1145.
14. Schröder M, Kaufman RJ: The mammalian unfolded protein response. Annu Rev Biochem 2005, 74:739-789.
15. Souid S, Lepesant JA, Yanicostas C: The xbp-1 gene is essential for development in Drosophila. Dev Genes Evol 2007, 217:159-167.
16. Jaffrey SR, Benfenati F, Snowman AM, Czernik AJ, Snyder SH: Neuronal nitric-oxide synthase localization mediated by a ternary complex with synapsin and CAPON. Proc Natl Acad Sci USA 2002, 99:3199-3204.
17. Page-McCaw A, Serano J, Santé JM, Rubin GM: Drosophila matrix metalloproteinases are required for tissue remodeling, but not embryonic development. Dev Cell 2003, 4:95-106.
18. Page-McCaw A, Ewald AJ, Werb Z: Matrix metalloproteinases and the regulation of tissue remodelling. Nature Reviews Molecular Cell Biology 2007, 8:221-233.
19. Sternlicht MD, Werb Z: How matrix metalloproteinases regulate cell behaviour. Annu Rev Cell Dev Biol 2001, 17:463-516.
20. Tollrian R: Chaoborus crystallinus predation on Daphnia pulex: can induced morphological changes balance effects of body size on vulnerability? Oecologia 1995, 101:151-155.
21. Andersen CL, Jensen JL, Ørntoft TF: Normalization of real-time quantitative reverse transcription-PCR data: a model-based variance estimation approach to identify genes suited for normalization, applied to bladder and colon cancer data sets. Cancer Res 2004, 64:5245-5250.
22. Heid CA, Stevens J, Livak KJ, Williams PM: Real time quantitative PCR. Genome Res 1996, 6:986-994.
23. Skern R, Frost P, Nilsen F: Relative transcript quantification by quantitative PCR: roughly right or precisely wrong? BMC Mol Biol 2005, 6:10.
Additional file 1 Results of the gene expression analysis with REST when using aTub (1a) and GAPDH (1b) as reference genes for expres-sion normalization.
Received: 31 August 2009 Accepted: 29 June 2010 Published: 29 June 2010This article is available from: http://www.biomedcentral.com/1471-2199/11/50© 2010 Spanier et al; licensee BioMed Central Ltd. This is an Open Access article distributed under the terms of the Creative Commons Attribution License (http://creativecommons.org/licenses/by/2.0), which permits unrestricted use, distribution, and reproduction in any medium, provided the original work is properly cited.BMC Molecular Biology 2010, 11:50

Spanier et al. BMC Molecular Biology 2010, 11:50http://www.biomedcentral.com/1471-2199/11/50
Page 11 of 11
24. Radonić A, Thulke S, Mackay IM, Landt O, Siegert W, Nitsche A: Guideline to reference gene selection for quantitative real-time PCR. Biochem Biophys Res Commun 2004, 313:856-862.
25. Dheda K, Huggett JF, Chang JS, Kim LU, Bustin SA, Johnson MA, Rook GA, Zumla A: The implications of using an inappropriate reference gene for real-time reverse transcription PCR data normalization. Anal Biochem 2005, 344:141-143.
26. Pfaffl MW, Horgan GW, Dempfle L: Relative expression software tool (REST) for group-wise comparison and statistical analysis of relative expression results in real-time PCR. Nucleic Acids Res 2002, 30:e36.
27. Pfaffl MW: A new mathematical model for relative quantification in real-time RT-PCR. Nucleic Acids Res 2001, 29:.
28. Pijanowska J, Kloc M: Daphnia response to predation threat involves heat-shock proteins and the actin and tubulin cytoskeleton. Genesis 2004, 38:81-86.
29. Infante C, Matsuoka MP, Asensio E, Cañavate JP, Reith M, Manchado M: Selection of housekeeping genes for gene expression studies in larvae from flatfish using real-time PCR. BMC Mol Biol 2008, 9:28.
30. Rozen S, Skaletsky HJ: Primer3 on the WWW for general users and for biologist programmers. In Bioinformatics Methods and Protocols: Methods in Molecular Biology Edited by: Krawetz S, Misener S Totowa. NJ: Humana Press; 2000:365-386.
31. Ramakers C, Ruijter JM, Deprez RH, Moorman AF: Assumption-free analysis of quantitative real-time polymerase chain reaction (PCR) data. Neurosci Lett 2003, 339:62-66.
32. Ruijter JM, Ramakers C, Hoogaars WM, Karlen Y, Bakker O, van den Hoff MJ, Moorman AF: Amplification efficiency: linking baseline and bias in the analysis of quantitative PCR data. Nucleic Acids Res 2009, 37:e45.
doi: 10.1186/1471-2199-11-50Cite this article as: Spanier et al., Predator-induced defences in Daphnia pulex: Selection and evaluation of internal reference genes for gene expres-sion studies with real-time PCR BMC Molecular Biology 2010, 11:50