predator program summary 2016 - utah division of … by the general public ... coyote submission in...
TRANSCRIPT

Utah’s Predator Control Program Summary Program activities and data from July 1, 2015 through June 30, 2016 Utah’sMuleDeerProtectionActhasbeenineffectsinceJulyof2012.Theprimarygoaloftheprogramistoreducenumbersofcoyotesinareaswheretheymaypreyonmuledeer.TwobillswerepassedbytheUtahLegislaturethatprovidefundingtoimplementtheprogram.SB245setaside$500,000fromtheUtahGeneralFundtocompensateprogramparticipantsforcoyotesthatareharvestedbythepublic,andSB87addeda$5.00feeincreasetoallbiggamehuntingpermitstohelppayforpredatorremovalefforts.TheUtahDivisionofWildlifeResources(Division)createdtheGeneralPredatorControlProgramwhichtracksharvestandparticipation,andprovidespaymenttoallparticipantsintheprogram.TheDivisionestablishedlocationsthroughoutthestatewherepeoplecouldcheck-incoyotesforpayment.Eachparticipantmustsubmitthescalpoftheanimalwithbothearsattached,thelowerjaw,andadatasheetthatdocumentswherethecoyotewaskilled.ThisreportsummarizesdetailsfromtheimplementationoftheActinFiscalYear2016whichrunsfromJuly1,2015toJune30,2016.Participation,PaymentsandCoyotesSubmittedforPaymentThisisthefourthyearoftheGeneralPredatorControlProgram,andatotalof9,728coyoteswereturnedinfor$486,400incompensation,anincreaseof19%comparedwith8,192coyotesinFY2015.InFY15,theDivisioncommitted$118,000intargetedcontractsestablishedwithhuntersthatqualifiedforspecificareasofthestate.Therewere11contractsissuedinFY15andtheagreementsallowedcontractorstooperateforalongerperiod(February2014toAugust2015).Therefore,thefinalpaymentactuallyoccurredinFY16.TheDivisionestablishedasmallgroupthatincludedUSDAWildlifeServices,Divisionemployees,andseveralsportsmenrepresentativestoevaluatetheeffectivenessofthetargetedcontracts.ThegrouprecommendedthattargetedcontractsshouldnolongerbeusedandFY16effortsshouldfocusonthegeneralbountyprogram.Therefore,nocontractswereissuedduringFY16.InFY2016atotalof1,102individualssubmittedcoyotesthroughtheGeneralPredatorControlProgram.Participationwasup4%fromthepreviousyear(n=1,065).Thenumberofcoyotessubmittedbyindividualhuntersremainedsimilarto2015with39%oftheparticipantssubmittingmorethan5animals.ImpactoftheProgram:EstimatesfromSurveyDataTheDivision’syearlyfurbearersurveyprovidedancillaryinformationaboutcoyoteharvestinthestate.PriortoimplementationoftheMuleDeerProtectionActandtheGeneralPredatorControlProgramtheannualreportedharvestofcoyotesbyhunterslicensedtoharvestfurbearersaveraged7,397.Thereportedharvestofcoyotesbyfurbearerlicenseholderswas7,835during2015-2016.Ofthe7,835coyotesthatwerereportedharvestedbylicensedfurharvesters,44%werenotturnedinforredemptionofthepayment.Therefore,inadditiontothe7,835coyotesthatwereturnedinforpayment,anadditional3,447harvestedcoyoteswerenotsubmittedforapaymentthroughthisprograminFY2016.ThetotalreportedcoyoteharvestbythegeneralpublicfromJuly1,2015toJune30,2016is13,175.OftheindividualswhopurchasedafurbearerpermitinFY2016,48%indicatedthattheyincreasedtheireffortstoharvestcoyotesthisyearbecauseofthepredatorcontrolprogram.
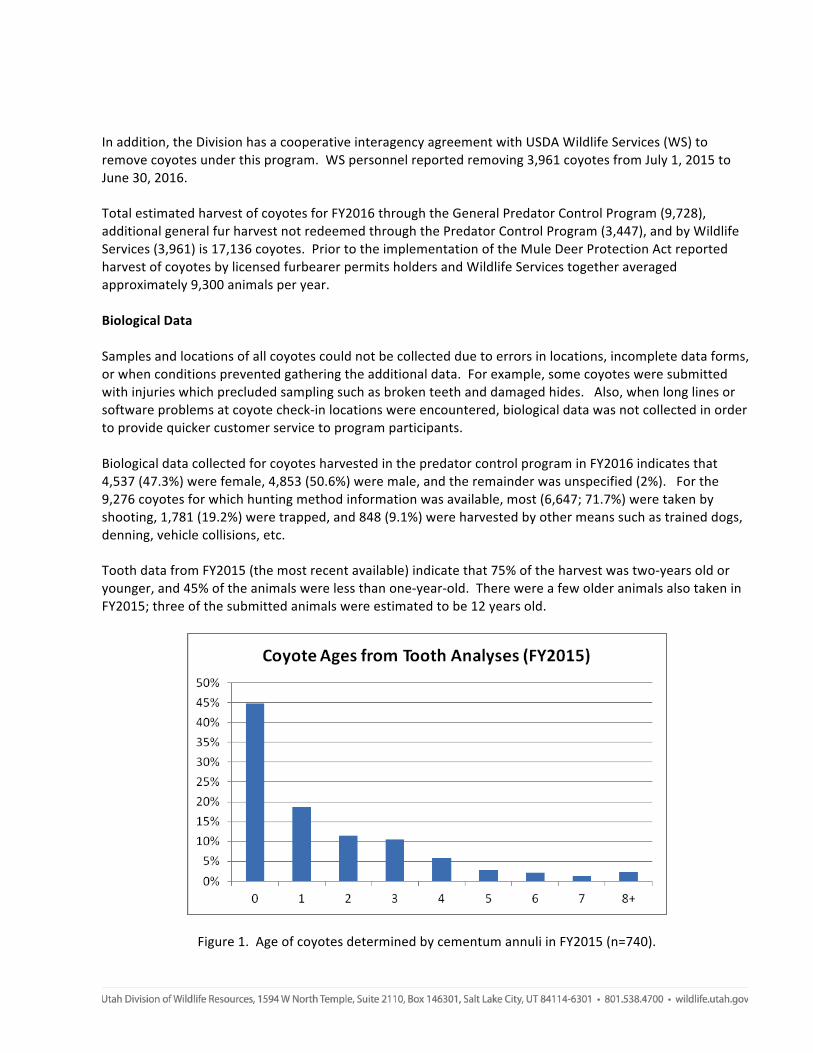
Inaddition,theDivisionhasacooperativeinteragencyagreementwithUSDAWildlifeServices(WS)toremovecoyotesunderthisprogram.WSpersonnelreportedremoving3,961coyotesfromJuly1,2015toJune30,2016.TotalestimatedharvestofcoyotesforFY2016throughtheGeneralPredatorControlProgram(9,728),additionalgeneralfurharvestnotredeemedthroughthePredatorControlProgram(3,447),andbyWildlifeServices(3,961)is17,136coyotes.PriortotheimplementationoftheMuleDeerProtectionActreportedharvestofcoyotesbylicensedfurbearerpermitsholdersandWildlifeServicestogetheraveragedapproximately9,300animalsperyear.BiologicalDataSamplesandlocationsofallcoyotescouldnotbecollectedduetoerrorsinlocations,incompletedataforms,orwhenconditionspreventedgatheringtheadditionaldata.Forexample,somecoyotesweresubmittedwithinjurieswhichprecludedsamplingsuchasbrokenteethanddamagedhides.Also,whenlonglinesorsoftwareproblemsatcoyotecheck-inlocationswereencountered,biologicaldatawasnotcollectedinordertoprovidequickercustomerservicetoprogramparticipants.BiologicaldatacollectedforcoyotesharvestedinthepredatorcontrolprograminFY2016indicatesthat4,537(47.3%)werefemale,4,853(50.6%)weremale,andtheremainderwasunspecified(2%).Forthe9,276coyotesforwhichhuntingmethodinformationwasavailable,most(6,647;71.7%)weretakenbyshooting,1,781(19.2%)weretrapped,and848(9.1%)wereharvestedbyothermeanssuchastraineddogs,denning,vehiclecollisions,etc.ToothdatafromFY2015(themostrecentavailable)indicatethat75%oftheharvestwastwo-yearsoldoryounger,and45%oftheanimalswerelessthanone-year-old.TherewereafewolderanimalsalsotakeninFY2015;threeofthesubmittedanimalswereestimatedtobe12yearsold.
Figure1.AgeofcoyotesdeterminedbycementumannuliinFY2015(n=740).

TemporalDistributionofCoyoteHarvestCoyotesubmissioninFY2016increasedfromNovember2015untilapeakinearly-tomid-February2016,followedbyamarkeddecreasethereafter(Figure2).Thisfollowsthegeneralpatternobservedinpreviousyears,reflectingaseasonalincreaseinhuntersonthelandscapeandpeopleharvestingcoyotesfortheregionalfursaleheldinFebruary.
Spatial Distribution of Coyote TakeThetotalnumberofcoyotessubmittedinFY2016withusablespatialdatawas9,515.Coyoteremovallocationswereplottedontothestate’sdeermanagementunits(Figure3).Coyoteremovalsuccessvariedacrossthestatebut,asinpastyears,severalpopulardeerunits(BoxElder,WestDesert,SouthwestDesert,Fillmore,SouthSlope,Beaver,Cache)accountedformorethanhalfofthecoyotesremovedstatewide(Table1;n=5,502;57%).Ofthe29,973locationswithusablespatialattributessubmittedfromSeptember2013toJuly2016,twentypercent(6,082)overlappedwithareasconsideredimportantformuledeerfawning.
Figure2.NumberofcoyotesturnedinbyweekFY2016.

Figure3.Locationsofcoyoteharvestedandturnedinforpayment.

HuntUnit/TribalArea Coyotes PercentBoxElder 1538 16.16%WestDesert 878 9.23%SouthwestDesert 834 8.77%Fillmore 616 6.47%SouthSlope 577 6.06%Beaver 553 5.81%Cache 506 5.32%SanJuan 419 4.40%PineValley 409 4.30%CentralMountains 362 3.80%Oquirrh-Stansbury 312 3.28%BookCliffs 256 2.69%Zion 248 2.61%Plateau 221 2.32%Paunsaugunt 217 2.28%SanRafael 183 1.92%NineMile 172 1.81%NorthSlope 165 1.73%MorganSouthRich 155 1.63%LaSal 130 1.37%WasatchMountains 121 1.27%Kaiparowits 105 1.10%PanguitchLake 105 1.10%Mt.Dutton 84 0.88%HenryMountains 82 0.86%Monroe 69 0.73%Ogden 67 0.70%EastCanyon 56 0.59%NavajoReservation 48 0.50%Kamas 17 0.18%ChalkCreek 10 0.11%
Table1.Numberofcoyotesturnedinforpaymentbydeerwildlifemanagementunit.

Table2.Muledeerpopulationobjective,post-seasonclassification,post-seasonfawn:doeratios,andknowncoyoteharvestlocationsbywildlifemanagementandyear.

ConclusionThe Predator Incentive Program was efficiently and effectively implemented at a statewide scale during fiscal year 2016. The program demonstrated an increased number of coyotes harvested in Utah. Based on four years of data collected, we estimate that 56,687 coyotes have been harvested. This is an average of 14,172 coyotes per year. Table 2 indicates annual fawn:doe ratios in each of the management units in comparison with the number of known coyotes removed from each unit. It will likely take several years of implementation of this program before improvements in fawn:doe ratios statewide may become observed and this effect may be more visible in local areas versus statewide. Prior to implementation of the Mule Deer Protection Act the statewide (2012) fawn:doe ratio was 61. As indicated above approximately 20% of the known harvest locations for coyotes taken in this program since September 2013 occurred in areas identified as critical for mule deer fawning. Since 2012, the fawn:doe ratio has fluctuated between 61 and 65, indicating a stable deer population overall. There are many factors such as weather, drought and habitat conditions that contribute to fawn:doe ratios.For the entirety of the program, the location data indicates that most coyotes are harvested in areas occupied by mule deer.