predatory credit card lending - center for … predatory credit card lending: unsafe, unsound for...
TRANSCRIPT

www.responsiblelending.org
Predatory Credit Card Lending: Unsafe, Unsound for Consumers and Companies
Joshua M. Frank, Senior Researcher
May 2012
Center for Responsible Lending 1
Executive Summary . . . . . . . . . . . . . . . . . . . . . . . . . . . . . . . . . . 2
Background . . . . . . . . . . . . . . . . . . . . . . . . . . . . . . . . . . . . . . . . . . .4
Findings . . . . . . . . . . . . . . . . . . . . . . . . . . . . . . . . . . . . . . . . . . 4
Conclusion . . . . . . . . . . . . . . . . . . . . . . . . . . . . . . . . . . . . . . . . 14
Appendix . . . . . . . . . . . . . . . . . . . . . . . . . . . . . . . . . . . . . . . . . 17
Endnotes . . . . . . . . . . . . . . . . . . . . . . . . . . . . . . . . . . . . . . . . . 20
Table of ConTenTs

Predatory Credit Card Lending: Unsafe, Unsound for Consumers and Companies 2
eXeCUTIVe sUMMaRY
The Center for Responsible Lending (CRL) examined marketing and pricing practices prevalent in the credit card industry before implementation of the Credit Card Accountability, Responsibility and Disclosure Act (CARD Act) of 2009. CRL then examined the connection between these practices and company performance during the recent economic downturn.
For the study, CRL examined 23 marketing and pricing practices that were common among the top 100 credit card issuers during the summer of 2009, when the CARD Act outlawing or curbing many of these practices was passed but not yet implemented. Common practices included imposing high-cost penalty interest rates even when a consumer paid his card on time, using indexes to calcu-late interest rates to the disadvantage of card holders, and assessing late fees that the Federal Reserve recently ruled were unreasonably high. We then tracked credit losses for these companies from the beginning of 2006 through 2010.
WefoundthatbeforeCARDActreforms:
• A credit card issuer that engaged in one unfair, deceptive or abusive tactic tended to engage in many. In general, smaller banks and credit unions had better practices.
• Bad practices were a good predictor of complaint levels. Complaints to the Better Business Bureau correlated with
specific practices, regardless of an institution’s type or size.
• The more obscure an issuer’s pricing and the more aggressive its marketing, the more its losses jumped during the reces-sion. In fact, credit card practices were the best predictor of how quickly losses would mount compared to competitors—better than a lender’s location, type or size.
• Credit card issuers' claim that high-cost penalty fees and interest were risk-management tools is false. Risk-management practices didn’t explain the correlation between unfair, deceptive or abusive practices and accompanying increases in losses. That’s because these fees and rates didn’t mitigate risk, they were the risk.
The research shows that unfair, deceptive or abusive lending practices were clustered within firms as part of an over-all strategy, suggesting that credit card issuers either believed in pricing that was stated clearly up front and with an eye on long-term customer relationships, or in pricing that was purposely complicated, hard to understand and intended to maximize short-term revenue. Banks embracing the latter strategy also tended to be the most aggressive marketers, using high-volume mailings to existing customers to offer high-cost cash advances from a credit card or check. And, the larger the financial institution was that engaged in deceptive or misleading practices, the worse the practices tended to be. In general, regional or smaller banks or credit unions tended to have clearer, fairer pricing.
a credit card issuer that
engaged in one unfair,
deceptive or abusive tactic
tended to engage in many.
High-cost penalty fees
and interest didn’t mitigate
risk, they were the risk.

Center for Responsible Lending 3
The research also shows that a strategy of maximizing short-term revenue by using unfair, deceptive or abusive lending practices led to higher risk and lower profits during the downturn, undermining a bank’s safety and soundness. Downturns occur fairly frequently. Since 2000 there have been two recessions, and since 1980 there have been five. A case in point is mortgage lending: Predatory products seemed profitable in the short term and seemed to help fuel economic growth but led to a disproportionate escalation in losses when housing markets slowed and the economy soured. Our new research shows this has also been true in the credit card arena.
And the report shows credit card issuers' past claim is wrong that consumer protections have the unintended consequence of undermining the safety and soundness of financial institutions. Common sense curbs on abusive lending practices increase market transparency and bolster firms’ financial strength. This benefits customers, investors, shareholders and, ultimately, taxpayers, who have had to pay hundreds of billions of dollars to bail out banks after regulators allowed unreasonable mortgage practices to flourish.
Lobbyists repeatedly have used the flawed argument that consumer safeguards undermine financial health. They used it to persuade Congress and regulators to refrain from adopting the common-sense mortgage lending rules that would have prevented the recent recession and continuing downturn. And they are using it now to try to roll back reforms adopted in response to the mortgage meltdown. This study shows that measures to stop deceptive and unfair lending practices promote market transparency and enhance the health of lenders—and the economy—long term.
Finally, the report identifies practices the CARD Act did not eliminate but are potentially unfair, deceptive and overly aggressive. Bank supervisors should further scrutinize these practices.
ending practices that
undermine market
transparency is essential
for strong banks and a
vibrant economy.

Predatory Credit Card Lending: Unsafe, Unsound for Consumers and Companies 4
baCKGRoUnD
This new CRL research looked at credit card industry practices and financial statements in the summer before the CARD Act of 20091 restricted issuers’ ability to raise rates on existing balances, limited the size of late fees and how quickly they are triggered, and curbed many other practices customers have complained about for years. Specifically, this research looked at credit card industry practices that were common before the CARD Act and their relationship to customer complaints, to type of financial institution and to changes in loss rates in the downturn.
For our research, we examined credit card solicitations and other financial data2 for the top 100 credit card issuers3 in the summer of 2009. From solicitations, we obtained information on how issuers imposed penalty interest rates and a variety of fees. The financial data supplied information on loss rates and the size of the card issuer. The analysis considered data from ten large issuers and many issuers with medium-sized portfolios.4 We also looked at complaints to the Better Business Bureau for the same period, which was just before full implementation of the CARD Act made many of the practices we examined illegal. Most of the provisions of the Act were fully implemented in February 2010.
The results provide important information about the relationship between a bank’s consumer policies and its safety and soundness and for assessing the CARD Act’s success. Lawmakers intended the CARD Act to create a more transparent market by getting rid of deceptive fees and pricing. Many of the practices discussed in the report have been outlawed or limited by the CARD Act, though some remain legal, including high cash-advance fees, excessive international transaction fees, mini-mum finance charges that can exceed balances, aggressive marketing, and wide interest-rate spreads. Earlier research shows that the CARD Act has improved market transparency without raising the cost of credit or making it scarcer.5 The new research provides insight about the structure and clustering of the bad practices the CARD Act addressed and whether they were connected to complaints and market outcomes.
We tracked credit losses from 2006 through 2010. Losses for most credit card issuers did not start to rise substantially until 2008. The next two years, 2009 and 2010, brought elevated losses for the entire credit card industry. We calculated the increase in losses during the recession by comparing average losses in pre-recessionary 2006 and 2007 with the average during 2009 and 2010.
fInDInGs
Finding 1: A credit card issuer that engaged in one unfair, deceptive or abusive tactic tended to engage in many. In general, smaller banks and credit unions had better practices.
PracticesAnalyzed
We tracked a variety of credit card practices that existed prior to implementation of the CARD Act and often indicated overly aggressive marketing or unfair or deceptive lending strategies. (See Table 1). Many of the pricing practices were deceptive because they were not closely tied to an issuer’s costs or risks, and consumers had a poor understanding of how they worked. Some practices led to wide gaps between the rate quoted in solicitations and the rate consumers actually paid. Clearly, many issuers applied charges and fees based on research showing which costs consumers pay attention to and which they tend to overlook.6

Center for Responsible Lending 5
Examples of practices analyzed include:
• Penalty interest rates imposed by a hair-trigger—a single, minor infraction such as being late on a payment by a single day or, in what is known as “universal default,” paying another company late.7 Before the CARD Act, penalty rates resulted in steep price jumps that were hard to get out of.8
• Manipulation of variable rates using a “pick-a-rate” practice, where an issuer tied interest rates to an index but picked a date on which changes in the index caused the biggest increase. Prior CRL research found this to be one of several hidden pricing strategies that consumers understood poorly and that bore little relationship to an issuer’s risk or cost.9 The Federal Reserve reached the same conclusion and in January 2010 banned “pick-a-rate,” deeming it a deceptive manipula-tion of a variable-rate index.
• Charging minimum finance charges of as much as two dollars even if a consumer owed only a penny of interest that month.
• Charging a foreign transaction fee even when the foreign company billed in dollars, causing the issuer to incur no extra expense.
• Aggressively pushing debt protection insurance products, which are an extremely poor value for customers.10
Practices on this list often indicated an issuer relied on price gimmicks and tricks and traps in general.11 Other issuers used up-front pricing that was clear, understandable, and in line with what consumers expected. (See Table 1 next page.)
ScaleMethodology
We created a measure that scored unfair and deceptive acts and practices.12 We called this the UDAP factor score. The score was produced when we used factor analysis to gauge how prac-tices differed among issuers. The UDAP factor score does not rely on a researcher’s judgment but instead tallies a score based on the similarity of variables and how they tend to be grouped.
In general, smaller
banks and credit unions
had better practices.
Many of the pricing
practices were deceptive
because they were not
closely tied to an issuer’s
costs or risks.

Predatory Credit Card Lending: Unsafe, Unsound for Consumers and Companies 6
Description (with source for further research)
Cash/Purchase APR spread Large spreads between prices are often used to exploit price complexity and behavioral biases (see “What Does the Credit Card Market Have In Common with a Peacock?”) No
Maximum Late Fee High late fees can be a way to raise price components that consumers tend to discount (see “A Just Fee or Just a Fee?”) Yes
Penalty/Regular APR spread Large spreads between prices are often used to exploit price complexity and behavioral biases (see “What Does the Credit Card Market Have In Common with a Peacock?” ) Partial
Minimum Finance Charge Amount Another type of hidden pricing used by many issuers where a $2 charge may be imposed if there is only a penny in finance charges (see “Dodging Reform: As Some Credit Card Abuses Are Outlawed, New Ones Proliferate”) No
Cash advance fee ceiling Consumer-friendly issuers tend to more often limit the maximum cash advance fee (see “Dodging Reform: As Some Credit Card Abuses Are Outlawed, New Ones Proliferate”) No
Hairline penalty trigger to end teaser rate Penalty rates are a form of hidden, back-end pricing, especially when they are easily triggered even in the teaser period (see “Priceless or Just Expensive? The Use of Penalty Rates in the Credit Card Industry”) Yes
Tiered Late Fee Structure Tiered late fee structures have been used to create a deceptive fee structure with hidden fee increases (see “Dodging Reform: As Some Credit Card Abuses Are Outlawed, New Ones Proliferate”) Yes
Teaser/Regular APR spread Large spreads between prices are often used to exploit price complexity and behavioral biases (see “What Does the Credit Card Market Have In Common with a Peacock?”) Partial
Whether issuer uses a penalty APR Penalty rates have been used as a form of hidden, back-end pricing (see “Priceless or Just Expensive? The Use of Penalty Rates in the Credit Card Industry”) Partial
Cash advance fee floor amount Cash advance fee floors have been raised by some issuers as a form of hidden fee increase (see “Dodging Reform: As Some Credit Card Abuses Are Outlawed, New Ones Proliferate”) No
Cash advance fee amount Cash advance fees add to price complexity and may be discounted by consumers when choosing to take a cash advance (see “Dodging Reform: As Some Credit Card Abuses Are Outlawed, New Ones Proliferate”) No
Hairline trigger for penalty APR Penalty rates are a form of hidden, back-end pricing, especially when they are easily triggered (see “Priceless or Just Expensive? The Use of Penalty Rates in the Credit Card Industry”) Yes
International transaction fee amount International fees are a hidden fee charged for transactions in foreign currencies, or sometimes for any transaction with an international merchant (see “Dodging Reform: As Some Credit Card Abuses Are Outlawed, New Ones Proliferate”) No
Whether penalty rate cure is "hard" Penalty rates are a form of hidden, back-end pricing, especially when they are difficult to cure (see “Priceless or Just Expensive? The Use of Penalty Rates in the Credit Card Industry”) Yes
Issuer utilizes "pick-a-rate" This deceptive and obscure tactic is used to manipulate the prime rate used for a variable APR (see “Dodging Reform: As Some Credit Card Abuses Are Outlawed, New Ones Proliferate”) Yes
Whether penalty rate cure is unknown Penalty rates are a form of hidden, back-end pricing. Typically, an unknown (undisclosed) cure means that an account rarely or never cures (see “Priceless or Just Expensive? The Use of Penalty Rates in the Credit Card Industry”) Yes
Cash advance check volume/total loans Encouraging the taking of cash advances with aggressive mail volumes is a way for issuers to exploit inattention to price and fee differences and to maximize consumer debt levels No
Solicitation volume/total loans Overly aggressive use of mail solicitations tends to push debt on consumers rather than respond to true need and is rarely done by the more consumer-friendly issuers. No
Issuer allows extra time before late fee Consumer-friendly issuers often give consumers a break by allowing extra time before charging high late fees. No
Length of grace period Consumer-friendly issuers offer more time between issuing a statement and the due date. Yes
Whether issuer charges intl. fee if in $ Charging an international fee on transactions denominated in dollars is a deceptive fee-maximization tactic (see “Dodging Reform: As Some Credit Card Abuses Are Outlawed, New Ones Proliferate”) No
Whether teaser is short The use of teasers—particularly short teasers—to attract consumers is an attempt to exploit known consumer biases (see “What Does the Credit Card Market Have In Common with a Peacock?”) Yes
Sells fee-based add-ons in card offer Add-on debt protection products have been found to be an exceptionally poor value for the money by the GAO (see Consumer Costs for Debt Protection Products Can Be Substantial Relative to Benefits but Are Not a Focus of Regulatory Oversight) No
Note: Full references to all of the related research cited here are available in the report's footnotes. Practices are ranked based on how closely tied they are to a general measure of bad practices. The practices higher on the list are the ones that are the most powerful predictors of a tendency to have bad practices in general. The construction of this scale is discussed in detail later in the report.
Table1:CreditCardPracticesStudied
Addressed by CARD Act?

Center for Responsible Lending 7
The methodology used to construct this score, called factor analysis, attempts to identify underlying drivers that explain a pattern of correlations within a set of observed variables. Factor analysis identifies a small number of common factors that can explain much of an observed variance. This methodology has the advantage of not relying on a researcher’s assumptions about how variables interrelate. Instead it lets interrelationships among the variables speak for themselves. It is used in psychology to determine what factors define intelligence, in business to understand consumer behavior, in economics to study what drives differences in wealth between nations and in the physi-cal sciences to relate the spatial distribution of different chemicals to possible sources. Factor analysis is useful when a researcher wants to learn what forces or patterns drive a large number of variables.
For example, say we wanted to compare cars. We would identify a number of car features—power seats, leather upholstery, built-in navigation systems, anti-lock brakes, a high crash-test score—and catalog which cars have which. We then would apply factor analysis to determine if features tend to appear together in certain cars and not in others. We might find cars with anti-lock brakes tend to also have a high crash-test score and good mileage but not leather upholstery, or that cars with leath-er upholstery tend not to get good mileage but are likely to have power seats. The way these features group together can be described by more general characteristics: safety features, performance features, luxury or economy features. In factor analysis such characteristics are called “dimensions.”13
In our credit card study, the features we analyzed were practices such as imposing high late fees or having a hair trigger for penalty rates. We analyzed these features to see if they occurred in groups and what dimensions—such as a business strategy—explained the clusters.
ResultsofAnalysisofUDAPFactorScore
Typically, a factor analysis highlights multiple factors or dimensions that can explain observed behavior. A researcher’s job is to interpret the meaning of those dimensions. However, in this case, the factor analysis resulted in a single dominant dimension.14 This was unexpected because we had assumed that practices might cluster in several strategic niches. Not only does a single dimension dominate, but that dimension is very easily interpreted. Practices that were consumer friendly all were associated with low scores on the scale, while practices that could be considered unfair, decep-tive, or unduly aggressive all were associated with higher scores.15 This can be interpreted as showing that the relationships among the 23 variables can be primarily explained by one dimension and that this one dimension can be unambiguously interpreted as a UDAP factor score. A low score indicates consumer friendly practices and a high score indicates the opposite. This implies that issuers that tended to have one consumer-friendly practice tended to have other consumer friendly practices, while issuers that use one unfair, deceptive or abusive tactic tend to use other similar tactics.
Practices indicating aggressive marketing tactics, such as heavily promoting the use of cash advance checks or mailing high volumes of offers, lined up in a single dimension along with practices indica-tive of cost-obscuring product features. This suggests aggressive marketing and deceptive pricing are closely linked strategies. This makes sense. Both focus on pushing products that maximize income regardless of whether they provide a benefit to the customer. Aggressively pushing cash advance checks in particular seeks to tempt consumers into increasing their level of high-cost debt.

Predatory Credit Card Lending: Unsafe, Unsound for Consumers and Companies 8
Table 2 splits the credit card issuers into five groups based on their UDAP Factor Score. While the groups are roughly equal in size based on the number of issuers in each group, it is noteworthy that this is not true of the number of accounts involved. About 90% of credit card balances were held by the top 10 issuers when the data was collected. Six of these top 10 issuers were in the group with the most unclear pricing and aggressive marketing practices. Nine of the top 10 were in the worst two groups. The average or most common practice for each group is shown in the table. Issuers with the best practices tended to have more transparent, straightforward pricing and less dependence on complicated fee policies or pricing gimmicks such as big disparities between teaser interest rates and final rates.
Table2:ProfileofIssuersandsomePracticesbyUDAPFactorScoreQuintile
Good Practices
Middle Practices
Bad Practices
Worst Practices
(defined as factor score 2nd quintile)
(defined as factor score 4th quintile)
(defined as factor score 3rd quintile)
(defined as factor score 2nd quintile)
(defined as factor score 1st quintile)
Regional Bank or Credit Union
Credit UnionCredit Union Regional Bank or Credit Union
Specialist
Large Bank or Credit Union
Specialist
Issu
er A
ttribu
tes
Prac
tice
s
Number of Top Ten Issuers Group 0 0 1 3 6
BBB Complaints per billion dollars 51.6 51.3 119.7 90.0 266.7
Average Factor Score -1.3 -0.8 -0.1 0.7 1.4
Maximum Late Fee $15 $25 $31 $39 $40
Used Tiered Late Fees No No Evenly Split Yes Yes
Difference Between Promotional and Regular Rate if any (percentage points) 2.1% 2.9% 7.6% 12.6% 11.3%
Difference Between Cash and Regular Rate if any (percentage points) 0.0% 0.9% 3.5% 8.2% 9.8%
Used a Penalty APR No Evenly Split Yes Yes Yes
Penalty APR had a hairtrigger NA No No Evenly Split Yes
Once at penalty rate it was very hard to return to normal rate No No Evenly Split Yes Yes
Average International Transaction Fee 0.3% 0.8% 1.2% 1.7% 3.1%
Charged International Transaction Fee for Transactions Based in Dollars NA No No Evenly Split Yes
Manipulated the Variable Rate Index Using the "Pick-a-Rate" trick NA No No No Yes
Cash Advance Checks mailed per million $ 24 44 80 362 995
Average Cash Advance Fee 0.8% 1.7% 2.4% 3.2% 3.4%
Used floor on Cash Advance Fee Amount No Evenly Split Yes Yes Yes
Best Practices
Issuer Most Often is…

Center for Responsible Lending 9
Table 3 shows regression results indicate the UDAP factor score was closely linked to issuer type. The negative coefficients in the second and third rows of the table mean that when the issuer was a regional bank or credit union, their UDAP factor score tended to be lower. In other words, regional banks and credit unions tended to have better practices. As the last row shows, being a larger credit card issuer correlated with a higher UDAP factor score. That means larger issuers tended to have the worst practices, even after taking into account the type of institution. Even being a credit card bank—defined as an institution focused primarily on credit cards—proved an insignificant factor after accounting for other variables.16 As the p-value in the first row of the table shows, the baseline credit card loss rate before the recession, in 2006 and 2007, was also unrelated to practices. This suggests that while some issuers with bad practices focused more on sub-prime consumers, others focused primarily on consumers with prime credit.17
Dependent Variable is UDAP Factor Score
(r-square=.765)
Coefficient p-value
Pre-recession Loss Rate -0.005 0.746
Credit Union -1.919 0.000
Regional Bank -0.433 0.019
Credit Card Bank -0.205 0.286
Managed Loans ($ billions) 0.004 0.025
Finding 2: Bad practices were a good predictor of complaint levels. Complaints to the Better Business Bureau correlated with specific practices regardless of an institution’s type or size.
We tracked complaints to the Better Business Bureau about each issuer. To measure the frequency of complaints after accounting for the size of the credit card issuer, we divided the number of complaints by the issuer’s managed loans. The UDAP factor score explained the level of complaints much better than the variables for issuer type or size (see Table 4 for regression results).18 In fact, issuer type or size has no significant relation-ship with complaint rates when practices are in the model. This can be seen by comparing the p-value column in the second column to the fourth column of Table 4, with a low p-value (often using a cut-off of 0.05 or 0.10 in research) indicating a statistical relationship strong enough for us to be confident that it is not random error. While complaints show quite a bit of variation that remains unexplained, bad practices are a good predictor of complaint levels.
Interestingly, loss rates did not significantly relate to frequency of complaints. This suggests that complaints are not driven by whether a customer has a prime or subprime credit rating but by how the customer is treated.
bad practices are a
good predictor of
complaint levels.
Table3:PracticesareLinkedtoTypeandSizeofIssuer(RegressionResults)

Predatory Credit Card Lending: Unsafe, Unsound for Consumers and Companies 10
Table4:ComplaintsareDrivenbyIssuerPractices(RegressionResults)
Dependent Variable is Complaints to BBB divided by managed loans
(r-square=.153)
Coefficient p-value
Pre-recession Loss Rate -0.009 0.774
Credit Union 0.023 0.964
Regional Bank -0.224 0.506
Credit Card Bank -0.232 0.503
Managed Loans ($ billions) -0.006 0.114
UDAP Factor Score 0.459 0.031
Finding 3: The more obscure an issuer’s pricing and the more aggressive its marketing, the more its losses jumped during the recession. In fact, credit card practices were the best predictor of how quickly losses would mount compared to competitors—better than a lender’s location, type or size.
We calculated the increase in loss rate between the average for the pre-recession period of 2006-2007 compared to the period when credit card loss rates peaked, between 2009 and 2010.19 Using regression analysis, we estimated how much of the change in losses is attributable to practices measured by the UDAP factor score after controlling for other variables.
The results indicate that practices are a significant and powerful predictor of increases in losses during a downturn. To give a sense of the magnitude of the relationship between issuer practices and the change in loss rates, consider two issuers, one with very consumer-friendly practices (10th percentile of UDAP factor score) and one that scores poorly (90th percentile of UDAP factors score). If both issuers start with a loss rate of 3.2% before the recession, the consumer friendly issuer’s loss rate would increase to 5.0% during the downturn, while the other issuer’s loss rate would increase to 11.3%.
Figure1:Consumer-FriendlyPracticesLedtoMuchLowerRecessionLosses
AnExample:TheImpactofPracticesonLosses
12%
3.2% 3.2%
11.3%
5.0%
10%
8%
6%
4%
2%
0%Issuer with Safer Practices Issuer with Deceptive Practices
Pre-Recession Losses Recession Losses
Note: change in losses is based on regression coefficients using issuers in the 10th and 90th percentile on UDAP score.
Cred
it L
osse
s

Center for Responsible Lending 11
In addition to the UDAP factor score, the regression includes variables related to the type and size of the issuer as well as two additional variables. The first additional variable takes into account regional economic distress. Specifically, it tracks Arizona, California, Florida and Nevada—states hardest hit by the foreclosure crisis. There are many ways a region’s rise in foreclosures and drop in home prices can lead to rising credit card defaults. For example, declines in housing prices lead to job loss,20 and job loss historically has been a key predictor of credit card defaults.21 The second additional variable flags issuers that in 2006 and 2007, before the downturn started, had a high concentration of new card holders rather than older, seasoned account holders. Young accounts tend to have low loss rates, especially accounts less than six months old.22 Therefore, the change in loss rate before the recession and during it would likely overstate the impact the recession had on loss rates for issuers that entered it with high numbers of accounts less than a year old. The loss rate would probably have increased anyway, even if the economy remained stable, as new card-holder accounts aged.
Regression results are shown in Table 5. The key result is that issuers’ practices were a statistically significant and powerful predictor of the change in credit losses, as shown by the low p-value in the last row of the table. The worse an issuer’s practices were, the greater its spike in losses during the recession. In fact, issuer practices were the best single predictor of how much losses would increase during the recession.23
Expanding on the example given above, consider comparing an issuer who is in the worst 10 percent in terms of unfair, deceptive and abusive practices to an issuer in the best 10 percent. These two issuers would have UDAP factor scores of +1.4 and -1.3 respectively. This implies that the increase in loss rate during the recession would be 6.3 percentage points higher for the issuer with the bad practices.24 This leads to the same result noted before, if both issuers entered the recession with a loss rate of 3.2%., The consumer friendly issuer would see its loss rate increase to 5.0% while the issuer with the bad practices would see its loss rate increase to 11.3%.25
A loss rate difference of this magnitude has implications not just for the issuer, but also for consum-ers and the whole economy. Even in strong years, the return on assets (ROA) for a credit card issuer is a little over 3%, with the highest ROA since 2000 being 3.66%.26 Therefore, an increase in losses of 6.3 percentage points is enough to threaten the safety and soundness of the issuer.
Table5:LossRateIncreasewasDrivenbyIssuerPractices(RegressionResults)
Dependent Variable is the increase in the annual loss rate during the recession (in percentage points)
(r-square=.468)
Coefficient p-value
Pre-recession Loss Rate 0.100 0.243
Credit Union -0.724 0.620
Regional Bank -1.982 0.039
Credit Card Bank -0.355 0.717
Managed Loans ($ billions) -0.009 0.389
Issuer is in a bubble state 4.265 0.000
Issuer new in 2006-2007 2.343 0.162
UDAP Factor Score 2.049 0.001

Predatory Credit Card Lending: Unsafe, Unsound for Consumers and Companies 12
The second most important predictor of the jump in losses was whether the issuer focused on lending in states hardest hit by the foreclosure crisis. This is not surprising. Financial distress that starts with a family falling behind on a mortgage easily can spread to other debts. And the greater a region’s housing price crash, the higher its unemployment.
Regional banks had a significantly lower increase in loss rate. This was beyond the impact of specific practices or size and could be caused by differences in marketing, underwriting, or other dimensions. All of the regional banks that are in the dataset of top 100 credit card issuers also happen not to have significant business in states hardest hit by foreclosures. This might be the cause of the significance of the regional bank variable. As the regression results indicate, geographic focus is closely linked to the loss rate increase. A bank that reaches across the entire nation in their consumer base includes some concentration in hardest hit states as well as in states that have fared better. However, a regional bank that is not in a hardest-hit state is sheltered from the stronger decline that occurred in these areas and therefore should experience less of an impact from the housing crash than a bank with a portfolio spread across all states.27
Neither an institution’s size, whether it was a bank or credit union, or its loss rate going into the recession had a significant impact on its change in credit losses during the downturn.
Finding 4: Credit card issuers' claim that high-cost penalty fees and interest were risk- management tools is false. Risk-management practices didn’t explain the correlation between unfair, deceptive or abusive practices and accompanying increases in losses. That’s because these fees and rates didn’t mitigate risk, they were the risk.
Issuers' explanation for why there is a link between predatory practices and higher loss rates in the recession is that some of the practices were needed to mitigate risk. The idea is that these practices didn’t cause the risk, but in fact had to be used by issuers to manage the risk posed by some borrowers. On that reasoning, the banking industry claims that the CARD Act eliminated some useful pricing tools used to dampen losses. In particular, issuers point to the CARD Act’s having sharply curtailed their ability to re-price existing balances with a high penalty interest rate, permitting it only when a consumer is 60 days late.28 The claim that the CARD Act interfered with the ability of issuers to reprice for borrower risk is not consistent with the data.
Prior CRL research shows that penalty repricing was not in fact used primarily to manage risk.29 Instead, issuers used it as a tool to extract as much revenue as possible from consumers who had very minor infrac-tions but who did not have a substantially higher risk profile. Used this way, interest rates no longer reflected risk, interest rates had become the risk. Issuers used disproportionate price increases on consumers who were, for example, late a single day, typically more than doubling their interest rate. They also sometimes manipulated due dates and payment processing to increase the likelihood that consumers would pay late and incur a penalty rate. The result was that penalty rates in practice did not result in an issuer’s repricing in a manner well-correlated with risk. The documented behav-ior of major credit card issuers belies their claim they correlated price with risk: They imposed penalty rates for extremely minor violations, even those they caused through manipulation. They used penalty rates that were greatly disproportionate to the risk flagged by the violation. And they made it exceedingly hard for a customer to get back down to a non-penalty rate.
Interest rates
no longer
reflected risk,
interest rates had
become the risk.
Center for Responsible Lending 13
There are a number of other reasons that this alternative hypothesis is not consistent with the evidence presented here. The pre-recession loss rate was not significantly correlated with the jump in losses after the recession. This suggests that the link between practices and the change in loss rates was not caused by the general riskiness of borrowers, which would be clearly evident in the loss rate during periods of normal economic growth. The results show that the baseline risk of loss alone does little to explain what causes some issuers to have a much larger jump in loss rates when the economy deteriorates. Instead, the change in losses is closely tied to a company’s practices regardless of the risk profile of its customers during normal economic periods.
It is also important to note that the practices all clustered along a single dimension. There were a number of practices examined in this study that it is impossible or imprudent to use as a way to manage risk. For example, some argue the difference between a cash advance APR and a purchase APR—with the typical interest rate on a cash advance at a large bank 10 percentage points higher than a purchase rate—are somehow linked to risk-based pricing. But other practices such as manipu-lating the prime rate using the “pick-a-rate” tactic have nothing to do with adjusting price to reflect risk. If some issuers used practices now banned to manage risk, while others issuers used them merely to maximize short-term income, factor analysis would separate these two distinct corporate strategies into two distinct dimensions.30 Table 7 in the Appendix identifies the practices from the original factor analysis that should not be connected to risk management practices.31 As the table shows there is no relationship between how closely a practice is linked to the UDAP factor score and whether it is related to risk management. Practices clearly not used for risk management were just as likely to be closely linked to the factor score as practices banks have argued were risk- mitigation tools.32
To further eliminate the possibility that risk mitigation is driving issuer choices, we do a second factor analysis to create what we will call a UDAP Risk-Unrelated Factor Score. This second factor analysis only includes practices that logically would not be used to mitigate risk. The smaller group of variables in the risk-unrelated factor score include 12 out of the 23 variables from the broader measure while eliminating 11 and correspond again to the practices in Table 7 of the Appendix. This creates a factor score similar to the one previously created, only it should not be at all correlated with risk management techniques used by the issuer.
The new factor score turns out to be almost identical to the one for the broader list that includes risk management factors, with a correlation coefficient between the two of 0.974 (1.0 indicates two variables correlated perfectly). In addition, the UDAP Risk-Unrelated Factor Score shows the same link between practices and the jump in loss rate that the full UDAP Factor Score shows.
Predatory Credit Card Lending: Unsafe, Unsound for Consumers and Companies 14
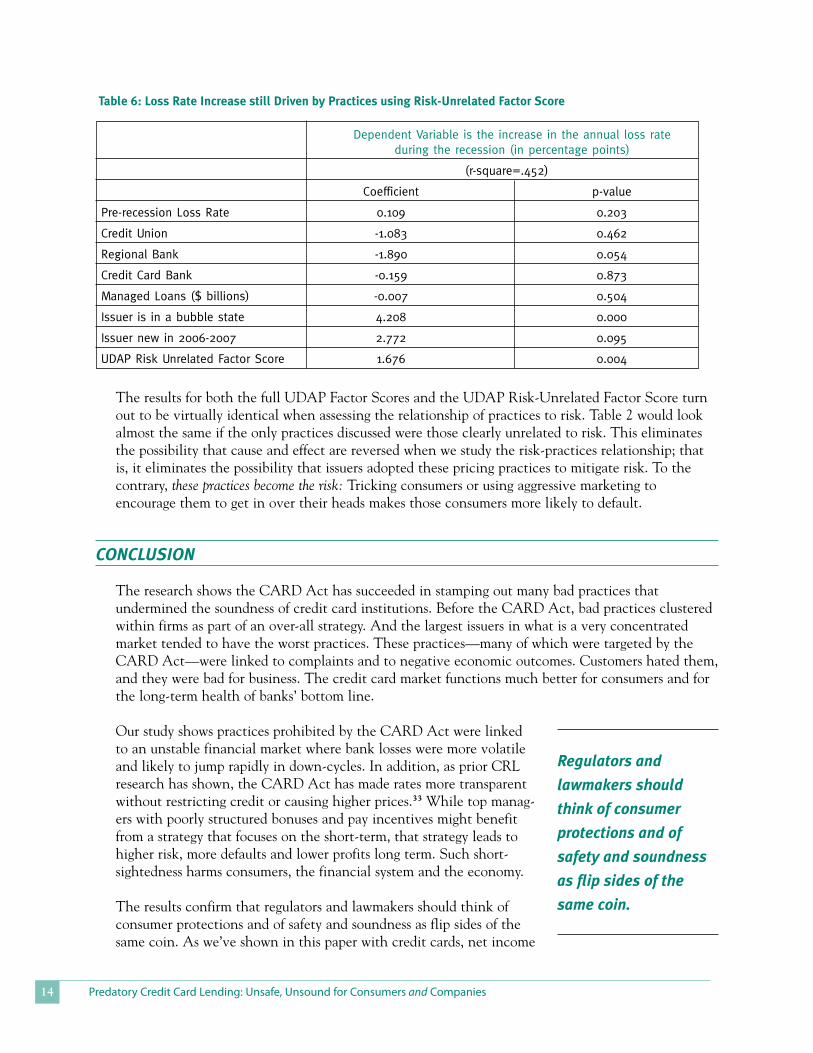
Table6:LossRateIncreasestillDrivenbyPracticesusingRisk-UnrelatedFactorScore
Dependent Variable is the increase in the annual loss rate during the recession (in percentage points)
(r-square=.452)
Coefficient p-value
Pre-recession Loss Rate 0.109 0.203
Credit Union -1.083 0.462
Regional Bank -1.890 0.054
Credit Card Bank -0.159 0.873
Managed Loans ($ billions) -0.007 0.504
Issuer is in a bubble state 4.208 0.000
Issuer new in 2006-2007 2.772 0.095
UDAP Risk Unrelated Factor Score 1.676 0.004
The results for both the full UDAP Factor Scores and the UDAP Risk-Unrelated Factor Score turn out to be virtually identical when assessing the relationship of practices to risk. Table 2 would look almost the same if the only practices discussed were those clearly unrelated to risk. This eliminates the possibility that cause and effect are reversed when we study the risk-practices relationship; that is, it eliminates the possibility that issuers adopted these pricing practices to mitigate risk. To the contrary, these practices become the risk: Tricking consumers or using aggressive marketing to encourage them to get in over their heads makes those consumers more likely to default.
ConClUsIon
The research shows the CARD Act has succeeded in stamping out many bad practices that undermined the soundness of credit card institutions. Before the CARD Act, bad practices clustered within firms as part of an over-all strategy. And the largest issuers in what is a very concentrated market tended to have the worst practices. These practices—many of which were targeted by the CARD Act—were linked to complaints and to negative economic outcomes. Customers hated them, and they were bad for business. The credit card market functions much better for consumers and for the long-term health of banks’ bottom line.
Our study shows practices prohibited by the CARD Act were linked to an unstable financial market where bank losses were more volatile and likely to jump rapidly in down-cycles. In addition, as prior CRL research has shown, the CARD Act has made rates more transparent without restricting credit or causing higher prices.33 While top manag-ers with poorly structured bonuses and pay incentives might benefit from a strategy that focuses on the short-term, that strategy leads to higher risk, more defaults and lower profits long term. Such short-sightedness harms consumers, the financial system and the economy. The results confirm that regulators and lawmakers should think of consumer protections and of safety and soundness as flip sides of the same coin. As we’ve shown in this paper with credit cards, net income
Regulators and
lawmakers should
think of consumer
protections and of
safety and soundness
as flip sides of the
same coin.

Center for Responsible Lending 15
obtained through questionable lending tactics does not imply a greater level of safety and soundness. These tactics are unsustainable and eventually lead to higher loss rates. And the higher loss rates from these tactics tend to come at the bottom of the economic cycle, just when the financial system is most fragile.
In the debate over whether to scale back the power of the new Consumer Financial Protection Bureau (CFPB), Wall Street lobbyists claim that consumer safeguards have unintended consequences and conflict with “safety and soundness.”34 By this logic, any rule curbing an unfair practice is bad because it cuts into bank revenue. CFPB’s supporters include many state and federal regulators and industry leaders such as Citigroup CEO Vikram Pandit.35 Federal Reserve Board Chairman Ben Bernanke has pointed out that bank safety and soundness goes hand in hand with consumer safeguards.36
Regulators responsible for the safety and soundness of the financial system should encourage rules that favor strong consumer protections, such as transparent pricing and products without deceptive practices. Seeing these consumer protections as conflicting with bank safety and soundness is an illusion. In short, the CFPB’s mission is not at odds with the safety and soundness mission other regulators have. Ending practices that undermine market transparency is essential for strong banks and a vibrant economy.
The continuing financial crisis is rife with evidence that lenders and regulators forgot that transparency and sound underwriting are cornerstones of good lending. Mortgages failed largely because federal regulators allowed products to proliferate that consumer advocates warned were harmful to homebuyers and that reduced—often on purpose—consumers’ understanding of their mortgages. For example, prepayment penalties, coupled with high adjustable rates, forced buyers to refinance over and over into bigger and bigger loans. These features are directly linked to significant-ly higher default rates.37
Law professor Ronald Mann has argued that predatory credit card issuers seek to put consumers in a “sweat box”38 and keep them there. Consumers thus trapped continuously incur penalty fees and escalating interest rates and, before the Card Act, were the most profitable segment of the market for issuers. This implies that issuers want consumers to fail to pay their bills to a certain extent so banks can charge them higher rates and more fees than they could consumers who pay off their bill each month and are never late. But keeping consumers in the sweat box is a delicate balance because they often are on the verge of default and in many cases because of the penalty fees and interest rates the banks impose. Banks don’t want them to actually default. The balancing act Mann describes is con-sistent with our finding that issuers with an aggressive strategy of maximizing short-term net income at the expense of consumers’ financial well being—that is, those who purposely make pricing unclear and then aggressively market cards with cost-obscuring features—experience a disproportionate rise in losses when the economy falters.
ending practices
that undermine
market transparency
is essential for
strong banks and a
vibrant economy.

Predatory Credit Card Lending: Unsafe, Unsound for Consumers and Companies 16
Historical evidence shows predatory credit card lending not only backfires during downturns but can extend the slump. In the late 1990s, Providian Financial’s return on assets made it seem the most profitable large issuer. Some analysts declared Providian one of the safest credit card companies to invest in, even as consumer advocates decried many of its practices. When the economy deteriorated after 2000, Providian’s losses were far greater proportionally than its peers, ending in a company restructuring. Advanta also seemed to be a profitable issuer that used practices strongly criticized by consumer advocates. Its losses in the recent downturn started earlier and have been far more severe than competitors’ losses and ended in its bankruptcy.39
An alternative explanation of Providian and Advanta’s woes is that they simply underestimated and therefore mispriced for the risk of their portfolio. But our new research shows their rise in losses doesn’t correlate well with the baseline loss level in strong economic times. That baseline risk of loss doesn’t explain what causes some issuers to have a much larger change in loss rates when the econo-my sours. But change in losses is closely linked to a firm’s practices, regardless of the risk profile of its customers in normal economic periods.
The report also identifies practices the CARD Act didn’t eliminate but that appear linked to strategies based on potentially unfair, deceptive and overly aggressive practices. Examples include a reliance on charges consumers often overlook. These include balance transfer fees, high-cost cash advances, fees for international transactions, and reliance on large spreads between APRs, with interest rates consumers pay least attention to being systematically higher. These practices deserve further regulatory scrutiny.

Center for Responsible Lending 17
aPPenDIX
Table 7 shows which variables were included in the reduced risk-associated-free practice scale described in the text. The reduced scale only contains items that should not be related to risk. The table also shows the coefficient from the component matrix for each practice in relationship to the dominant factor in the full UDAP factor score (i.e. the one that is equivalent to a consumer-friendliness scale).
Included in risk-unrelated factor analysis
Principal Component Analysis Matrix Coefficient
for Dominant Factor
Cash/Purchase APR spread 0.842
Maximum Late Fee 0.825
Penalty/Regular APR spread 0.804
Minimum Finance Charge Amount x 0.786
Cash advance ceiling x -0.783
Hairline penalty trigger for teaser rate 0.782
Tiered Late Fee Structure 0.758
Teaser/Regular APR spread x 0.746
Whether issuer uses a penalty APR 0.737
Cash advance floor amount x 0.715
Cash advance fee amount x 0.712
Hairline trigger for penalty APR 0.699
International transaction fee amount x 0.675
Whether penalty rate cure is "hard" x 0.628
Issuer utilizes "pick-a-rate" x 0.538
Whether penalty rate cure is unknown x 0.525
Cash advance check volume/outstndgs 0.495
Solicitation volume/outstandings 0.441
Issuer allows extra time before late fee -0.343
Length of grace period x -0.332
Whether issuer charges intl. fee if in $ 0.330
Whether teaser is short x 0.313
Sells fee-based add-ons in offer x 0.265
Table7:AdditionalDetailsonVariablesUsedtoDefineConsumerPracticesFactorScore

Predatory Credit Card Lending: Unsafe, Unsound for Consumers and Companies 18
(r-square=.462) (r-square=.468) (r-square=.452)
Coefficient p-value Coefficient p-value Coefficient p-value
Pre-recession Loss Rate 0.107 0.216 0.100 0.243 0.109 0.203
Credit Union -1.137 0.417 -0.724 0.620 -1.083 0.462
Regional Bank -2.033 0.035 -1.982 0.039 -1.890 0.054
Credit Card Bank -0.363 0.712 -0.355 0.717 -0.159 0.873
Managed Loans ($ billions) -0.007 0.463 -0.009 0.389 -0.007 0.504
Issuer is in a bubble state 4.296 0.000 4.265 0.000 4.208 0.000
Issuer new in 2006-2007 2.572 0.124 2.343 0.162 2.772 0.095
UDAP Scale or Score 0.129 0.002 2.049 0.001 1.676 0.004
As discussed in footnote 15, a UDAP scale was constructed before viewing the results of the factor analysis. The UDAP scale was based on judgment regarding the consumer impact of the practices, rather than coming as an output of a statistical technique like factor analysis. To construct the UDAP Scale, all of the factors from Table 7 were rescaled so that they each had a mean of zero and the same standard deviation. This allows each factor to have equal weight when summed together. In addition, some variables were inverted by multiplying by minus 1 so that higher numbers for all variables was indicative of an unfair/deceptive/abusive practice while lower numbers were indicative of more consumer-friendly practices. The variables inverted are those with a negative sign in Table 7. However, the decision to invert these variables were made based on judgment regarding the nature of the practices rather than these factor scores and was done before the factor analysis was ever conducted. As shown in Table 8, all of the measures of UDAP scores (the Scale, the Factor Score, and the Risk-Unrelated Factor Score) turn out to be close to identical with a very high correlation coefficient. The correlations were also all highly statistically significant.
Table8:CorrelationCoefficientsbetweenUDAPMeasures(allstatisticallysignificantatp<.001)
UDAP Scale UDAP Factor Score (full)
UDAP Factor Score (full) 0.997
UDAP Factor Score (risk-unrelated) 0.972 0.974
Regression with UDAP Factor Score
(risk unrelated)
Regression with UDAP Factor Score
(Full)
Regression with UDAP Scale
Table9:LossRateIncreaseRegressionResultswithVariousPracticesScales
Table 9 below shows results for the same regression shown in Table 5 with the other measures of practices (the UDAP Scale and the Risk-unrelated UDAP Factor score) added. The results are generally similar across regressions.
Dependent Variable is the increase in the annual loss rate during the recession (in percentage points)

Center for Responsible Lending 19
Table 10 is similar to the Table 9 regressions except it uses standardized beta coefficients.Standardized coefficients take into account the fact that some independent variables show a lot of variation while some show very little in the data. It puts the coefficients for the independent variables on a comparable scale by converting the standard deviation of each variable to be the same. This allows comparisons to be made across variables in terms of their importance. A higher absolute value for a standardized coefficient implies that more of the variation in the dependent variable can be explained by the variation observed in an independent variable. In all of these regressions, the variable with the greatest explanatory power based on the standardized coefficient is the UDAP scale or score.
Table10:LossRateIncreaseRegressionResultsUsingStandardizedCoefficients
Regression with UDAP Factor Score
(risk unrelated)
Regression with UDAP Factor Score
(Full)
Regression with UDAP Scale
Dependent Variable is the increase in the annual loss rate during the recession (in percentage points)
(r-square=.462) (r-square=.468) (r-square=.452)
Standardized Standardized Standardized Coefficient p-value Coefficient p-value Coefficient p-value
Pre-recession Loss Rate 0.120 0.216 0.113 0.243 0.123 0.203
Credit Union -0.173 0.417 -0.110 0.620 -0.166 0.462
Regional Bank -0.275 0.035 -0.268 0.039 -0.260 0.054
Credit Card Bank -0.045 0.712 -0.044 0.717 -0.020 0.873
Managed Loans ($ billions) -0.079 0.463 -0.094 0.389 -0.072 0.504
Issuer is in a bubble state 0.455 0.000 0.452 0.000 0.446 0.000
Issuer new in 2006-2007 0.151 0.124 0.137 0.162 0.162 0.095
UDAP Scale or Score 0.563 0.002 0.614 0.001 0.534 0.004

Predatory Credit Card Lending: Unsafe, Unsound for Consumers and Companies 20
1 Credit Card Accountability, Responsibility and Disclosure Act (CARD Act) of 2009, Pub. L. No. 111-24, 123 Stat. 1734
2 Although the Top 100 issuers were used in the analysis, due to missing data in some fields, about 80 data points are used in each regression or correlation coefficient. All statistics cited had a sample size of over 70, with about 40% of the sample coming from credit unions. The top 10 issuers hold about 90% of all balances, so that the top 100 issuers include many medium-sized credit card portfolios. Solicitation and mail volume data both came from Mintel Comperemedia, a proprietary database and from examination of individual offers posted online by the issuers.
3 This same data, aside from more recent credit loss information, was used in a prior CRL report: Joshua M. Frank, “A Just Fee or Just a Fee?” Center for Responsible Lending, June 8, 2010, available at http://www.responsiblelending.org/credit-cards/research-analysis/a-just-fee-or-just-a-fee.html . The report found that higher late fee levels were closely linked to other questionable credit card practices and in fact that when these practices are accounted for, late fees were not linked to credit loss levels as was previously claimed.
4 We end up with less than 100 issuers in the dataset because of incomplete data for some issuers. Most results are based on about 80 issuers. So if we define any issuer outside of the top ten as a medium issuer, then our final analysis included 10 large issuers and approximately 70 medium issuers. The smallest issuers in the dataset analyzed each had about $90 million in credit card receivables.
5 Joshua M. Frank, “Credit Card Clarity: CARD Act Reform Works,” Center for Responsible Lending, February 16 2011, available at http://www.responsiblelending.org/credit-cards/research-analysis/FinalCRL-CARD-Clarity-Report2-16-11.pdf.
6 This interpretation of pricing spreads is consistent with Ryan Bubb & Alex Kaufman, “Consumer Biases and Firm Ownership,” Harvard University working paper, May 2009.
7 “Universal default” is defined differently by different experts, but generally refers to raising rates based on factors completely separate from the performance of the consumer’s credit card account with the issuer. “Universal default” can refer to rates being raised based on being late on a card with a different issuer or simply based on an decrease in the consum-er’s credit score due to other factors. Whether “universal default” was outlawed by the CARD Act depends on the definition of universal default used. If “universal default” refers specifically to using these triggers to raise the interest rate on a consum-er’s pre-existing balances, this was outlawed. However, issuers can still use any criteria they want to trigger a rate increase on new balances, even if it has nothing to do with the performance of the consumer’s credit card account with that issuer.
8 Joshua M. Frank, “Priceless or Just Expensive? The Use of Penalty Rates in the Credit Card Industry,” Center for Responsible Lending, December 2009, available at: http://www.responsiblelending.org/credit-cards/research-analysis/ priceless-or-just-expensive-the-use-of-penalty-rates-in-the-credit-card-industry.html
9 Lenders calculate variable rates by adding a fixed amount to a previously identified index rate, typically a market-based rate such as the prime rate that changes over time. Traditionally, issuers have specified the index rate on a certain date as the rate used for calculating that billing cycle’s interest rate. But in the period leading up to the CARD Act, a growing number of credit card issuers had begun to charge customers a higher interest rate by making a very minor and obscure change in the fine print of the agreement. More specifically, instead of stating that the index rate “will be the maximum prime rate reported on the last day of the billing cycle,” many issuers changed the language to state that the index rate “will be the maximum prime rate reported in the 90 days preceding the last day of the billing cycle.” This practices was found to raise interest rates by 0.3 percentage points on average (Joshua M. Frank, “Dodging Reform: As Some Credit Card Abuses Are Outlawed, New Ones Proliferate,” Center for Responsible Lending, December 2009, available at: http://www.responsiblelending.org/credit-cards/research-analysis/Dodging-Reform-As-Some-Credit-Card-Abuses-Are-Outlawed-New-Ones-Proliferate.html).
10 United States Government Accountability Office, “Consumer Costs for Debt Protection Products Can Be Substantial Relative to Benefits but Are Not a Focus of Regulatory Oversight,” March 2011, GAO-11-311.
11 This pricing philosophy in the credit card market is discussed in detail in: Joshua M. Frank, “Why Free Markets Can Sometimes Turn into ‘Peacock Markets’: The Evolution of Credit Cards,” Journal of Economic Issues, June 2010; and Joshua M. Frank, “What Does the Credit Card Market Have In Common with a Peacock?” The Lydian Payments Journal, 24-40, 2009.
12 “UDAP refers to Unfair or Deceptive Acts or Practices” Both federal law and laws in all 50 states have some variant of laws banning such practices. The existing federal UDAP law is the core of the Federal Trade Commission’s enforcement authority against non-banks, (see 15 U.S.C. §45). Prior to the Dodd-Frank financial reform law, the Federal Reserve Board
enDnoTes

Center for Responsible Lending 21
had the authority to issue UDAP rules applicable to banks, which compose the majority of credit card issuers, under the FTC ACT. The new Consumer Financial Protection Bureau (CFPB), when fully operational, will have authority to issue rules to prevent unfair, deceptive and abusive practices that will apply to all credit card issuers. 12 U.S.C. 5531.
13 The descriptions of the dimensions do not appear spontaneously from the data and are interpretations made by the researcher. In some cases, by seeing what original variables (in our example, the car product features) rank high in certain dimensions, it becomes clear and unambiguous what the dimension represents. For example if airbags, anti-lock brakes, traction control, and high scores on crash tests are all linked to one dimension of auto features while other features are not, the dimension seems to somehow represent safety. Sometimes the results of factor analysis can result in dimensions that are hard to translate into a concrete meaning. However, in the case of credit card practices, the dimension that resulted from the analysis was very easy interpreted
14 The first factor explained 38.3% of the entire variance between the 23 practice-based variables examined. No other factor explained more than 7.1% of the variance. Table 7 in the Appendix shows more statistical details of how each variable related to this first, dominant factor. The single factor interpretation is based in part on the Cattell Scree Test, a very commonly used method for determining how many factors to include in factor analysis results. Eigenvalues for the first 5 components were: 9.586, 1.787, 1.660, 1.385, and 1.785, showing a large drop-off after the first factor, therefore creating a clear “elbow” graphically.
15 Typically a factor score dimension is interpreted after it is constructed. However, in this case the factor score dimension turned out to correspond perfectly with a scale that was separately constructed based on “good” or “bad” practices (from the consumer’s perspective). The scale was not used in the final report because, unlike factor analysis, it relies on the subjective judgment of the researcher for its construction. But the fact that the factor score so closely mirrored a scale that was constructed separately, with every variable showing the same sign as the scale is an extremely rare event, and suggests that the interpretation of the factor score dimension is quite clear. The UDAP factor score and the scale ended up having the same signs for each practice studied and being highly correlated with each other.
16 Which issuers were “credit card banks” was defined using the FDIC’s labeling of bank peer groups. If a bank holding company was or had within it a bank designated by the FDIC as a “credit card specialty bank,” then it was given that designation in the dataset. The FDIC defines a credit card specialty banks as an “Insured commercial banks whose lending activities are focused on credit cards are in one of three peer groups within this special line of business peer group.” Most of the top 10 issuers are designated as credit card specialty banks, including banks with a broad range of product lines such as Bank of America and Chase. However, other banks with many lines of lending but that are less prominent in credit cards such as Fifth Third Bancorp and SunTrust Banks, Inc. have no credit card specialty bank.
17 Later we analyze the change in loss rates. An unexpected shock in loss rates is where bad practices may present a safety and soundness risk, even if losses in strong economic times appear to be under control.
18 When the frequency of complaints is analyzed as a function of issuer type and size without including practices, it appears that issuer type matters somewhat, with credit unions getting significantly fewer complaints and regional banks showing a tendency to possibly get fewer complaints. The credit union variable was statistically significant at the 5% level while the regional bank variable was only marginally statistically significant—at the 10% level. This suggests that there is the appearance of a relationship with issuer type and size, but it is superficial and not causal. Instead, any relationship between complaints and issuer type or size is because practices are correlated with issuer type and size and practices are the underlying driver of complaint levels.
19 The loss rate calculation was done in terms of percentage points—i.e. if losses in the 2006-2007 period averaged 4.5% and losses in the 2009-2010 period averaged 8.7%, the increase in losses would be 4.2 percentage points. Since the percentage point increase in losses could in part be a function of how large losses were to start with, the pre-recession loss rate was included as an independent variable in all regressions. In none of the regressions was the starting loss level statistically significant.
20 Bob Lerman and Tom Kingsley, Metro Areas Suffering the Worst Housing Shocks Also Lose the Most Jobs, MetroTrends, Urban Institute, available at http://www.metrotrends.org/commentary/jobs-housing.cfm.
21 Scott Hoyt, Credit Card Chargeoffs Will Fall Ahead of Unemployment, Credit Card Statement, Moody’s (July 14, 2010).
22 FDIC Credit Card Activities Manual, Chapter XII, available at http://www.fdic.gov/regulations/examinations/credit_card/ch12.html#5sub3.
23 Table 10 of the Appendix gives detailed standardized coefficients for the regression which is the basis for this statement. The results were very similar if we use the scale discussed in footnote 15 rather than the UDAP factor score. Table 9 of the Appendix gives regression results using several different measures for practices.

Predatory Credit Card Lending: Unsafe, Unsound for Consumers and Companies 22
24 This is based on taking the difference in factor scores (1.4 + 1.3) and multiplying that sum by the regression coefficient for the impact of factor score on the change in loss rates.
25 The starting loss rate and the average increase used in the example are not arbitrary. They are the average of all of the top 100 issuers.
26 Federal Reserve Board Report to the Congress on the Profitability of Credit Card Operations of Depository Institutions, 2009, available at: http://www.federalreserve.gov/boarddocs/rptcongress/creditcard/2009/default.htm
27 If the geographic concentration of the bank in terms of bubble/non-bubble states is important, then one way to conceptualize the situation is that there would be three levels of loss increase associated with geography. Banks concentrated in a bubble state would have the largest loss increase. Banks that have a national presence would have a mid-level loss increase (because they are in both the bubble and non-bubble states). Banks that concentrate their lending in a non-bubble regions would have the lowest loss increase. All of the “bubble state” issuers in the dataset happened to be credit unions.
28 The argument generally made by issuers is not that the CARD Act raised losses, but that it took away some of the tools they used to create revenue to offset those losses.
29 Joshua M. Frank, “Priceless or Just Expensive? The Use of Penalty Rates in the Credit Card Industry,” Center for Responsible Lending, December 2009, available at: http://www.responsiblelending.org/credit-cards/research-analysis/priceless-or-just-expensive-the-use-of-penalty-rates-in-the-credit-card-industry.html
30 There would be some overlap in these dimensions, but if a group of issuers just used the risk-related practices as a risk management technique, and rarely used the other questionable practices, then a second primary dimension would be needed to explain this pattern of behavior. If all the issuers that tended to have bad practices were just using it to manage risk, the one would see the practices that are not related to risk unexplained or poorly explained by the primary dimension (and likely a second dimension emerging unless these other practices occurred completely randomly).
31 It could be argued that a few other practices such as cash advance fees and a lack of cash advance fee ceilings, and use of hard penalty rate cure are also used to manage risk, but this is not the case. First, just like with penalty rates, the evidence of how issuers used these practices suggests that they were trying to maximize income from hidden pricing rather than trying to align risk with price. In the case of cash advance fees, the same issuers who tend to charge a high cash advance fee and not include a fee ceiling already tend to charge cash advance APR's that are disproportionately higher than the purchase APR relative to the difference in risk between the two groups. Furthermore, the APR is much more rational risk management tool to use to manage the ongoing risk of carrying a balance than a high one-time fee for a cash advance that may be paid off by the next statement . Regarding penalty APR cures, given the minor vDescription (with source for further research) Addressed by CARD Act? Cash/Purchase APR spread Large spreads between prices are often used to exploit price complexi-ty and behavioral biases (see “What Does the Credit Card Market Have In Common with a Peacock?”) No Maximum Late Fee High late fees can be a way to raise price components that consumers tend to discount (see “A Just Fee or Just a Fee?”) Yes Penalty/Regular APR spread Large spreads between prices are often used to exploit price complexity and behavioral biases (see “What Does the Credit Card Market Have In Common with a Peacock?” ) Partial Minimum Finance Charge Amount Another type of hidden pricing used by many issuers where a $2 charge may be imposed if there is only a penny in finance charges (see “Dodging Reform: As Some Credit Card Abuses Are Outlawed, New Ones Proliferate”) No Cash advance fee ceiling Consumer-friendly issuers tend to more often limit the maximum cash advance fee (see “Dodging Reform: As Some Credit Card Abuses Are Outlawed, New Ones Proliferate”) No Hairline penalty trigger to end teaser rate Penalty rates are a form of hidden, back-end pricing, especially when they are easily triggered even in the teaser period (see “Priceless or Just Expensive? The Use of Penalty Rates in the Credit Card Industry”) Yes Tiered Late Fee Structure Tiered late fee structures have been used to create a deceptive fee structure with hidden fee increases (see “Dodging Reform: As Some Credit Card Abuses Are Outlawed, New Ones Proliferate”) Yes Teaser/Regular APR spread Large spreads between prices are often used to exploit price complexity and behavioral biases (see “What Does the Credit Card Market Have In Common with a Peacock?”) Partial Whether issuer uses a penalty APR Penalty rates have been used as a form of hidden, back-end pricing (see “Priceless or Just Expensive? The Use of Penalty Rates in the Credit Card Industry”) Partial Cash advance fee floor amount Cash advance fee floors have been raised by some issuers as a form of hidden fee increase (see “Dodging Reform: As Some Credit Card Abuses Are Outlawed, New Ones Proliferate”) No Cash advance fee amount Cash advance fees add to price complexity and may be discounted by consumers when choosing to take a cash advance (see “Dodging Reform: As Some Credit Card Abuses Are Outlawed, New Ones Proliferate”) No Hairline trigger for penalty APR Penalty rates are a form of hidden, back-end pricing, especially when they are easily triggered (see “Priceless or Just Expensive? The Use of Penalty Rates in the Credit Card Industry”) Yes International transaction fee amount International fees are a hidden fee charged for transactions in foreign currencies, or sometimes for any transaction with an international merchant (see “Dodging Reform: As Some Credit Card Abuses Are Outlawed, New Ones Proliferate”) No Whether penalty rate cure is "hard" Penalty rates are a form of hidden, back-end pricing, especially when they are difficult to cure (see “Priceless or Just Expensive? The Use of Penalty Rates in the Credit Card Industry”) Yes Issuer utilizes "pick-a-rate" This

Center for Responsible Lending 23
deceptive and obscure tactic is used to manipulate the prime rate used for a variable APR (see “Dodging Reform: As Some Credit Card Abuses Are Outlawed, New Ones Proliferate”) Yes Whether penalty rate cure is unknown Penalty rates are a form of hidden, back-end pricing. Typically, an unknown (undisclosed) cure means that an account rarely or never cures (see “Priceless or Just Expensive? The Use of Penalty Rates in the Credit Card Industry”) Yes Cash advance check volume/total loans Encouraging the taking of cash advances with aggressive mail volumes is a way for issuers to exploit inattention to price and fee differences and to maximize consumer debt levels No Solicitation volume/total loans Overly aggressive use of mail solicitations tends to push debt on consumers rather than respond to true need and is rarely done by the more consumer-friendly issuers. No Issuer allows extra time before late fee Consumer-friendly issuers often give consumers a break by allowing extra time before charging high late fees. No Length of grace period Consumer-friendly issuers offer more time between issuing a statement and the due date. Yes Whether issuer charges intl. fee if in $ Charging an international fee on transactions denominated in dollars is a deceptive fee-maximization tactic (see “Dodging Reform: As Some Credit Card Abuses Are Outlawed, New Ones Proliferate”) No Whether teaser is short The use of teasers—particularly short teasers—to attract consumers is an attempt to exploit known consumer biases (see “What Does the Credit Card Market Have In Common with a Peacock?”) Yes Sells fee-based add-ons in card offer Add-on debt protection products have been found to be an exceptionally poor value for the money by the GAO (see Consumer Costs for Debt Protection Products Can Be Substantial Relative to Benefits but Are Not a Focus of Regulatory Oversight) No Note: Full references to all of the related research cited here are available in the report's footnotes . Practices are ranked based on how closely tied they are to a general measure of bad practices. The practices higher on the list are the ones that are the most powerful predictors of a tendency to have bad practices in general. The construction of this scale is discussed in detail later in the report. Violations involved leading to most penalty APR's and the APR increase that typically was disproportionate to risk, a responsive mechanism to return consumers to a regular rate when they show a lower risk level would be consistent with trying to align risk with price. Keeping a consumer at a high penalty rate long-term despite evidence that they have reduced their risk is consistent with using the practice as a trap rather than with trying to align price with risk.
32 This was confirmed using a t-test comparing the factor score coefficients for the two groups of practices with no significant relationship found. Similar results where found when using a scale, with both types of practices best explained by a single scale based on a correlation matrix of all practices.
33 Joshua M. Frank, “Dodging Reform: As Some Credit Card Abuses Are Outlawed, New Ones Proliferate,” Center for Responsible Lending, December 2009, available at: http://www.responsiblelending.org/credit-cards/research-analysis/Dodging-Reform-As-Some-Credit-Card-Abuses-Are-Outlawed-New-Ones-Proliferate.html
34 This dimension of the debate is discussed in Derek Thompson, “Safety and Soundness vs. Consumer Protection”, The Atlantic, March 2, 2010, available at: http://www.theatlantic.com/business/archive/2010/03/safety-and-soundness-vs-consumer-protection/36941/
35 Pandit recently stated that “behavioral arbitrage” where consumers select products that “look cheap but turn out expensive” creates systematic risk as was seen in the credit crisis and housing bubble. Pandit called for stronger consumer protection and product regulation as the solution. Donna Borak, “Citi's Pandit Calls For Greater Consumer Regulation,” PaymentsSource, September 26, 2011.
36 Oct. 23, 2009 Bernanke speech at a Boston Fed economic conference, "...The recent crisis clearly illustrated the links between consumer protection and the safety and soundness of financial institutions. We have seen that flawed financial instruments can both harm families and impair financial stability. Strong consumer protection helps to preserve household savings and to provide families access to credit on terms that are fair and well matched with their financial needs and resources. At the same time, effective consumer protection promotes healthy competition in the marketplace, supports sound lending practices, and increases confidence in the financial system as a whole." http://www.federalreserve.gov/ newsevents/speech/bernanke20091023a.htm
37 Lei Ding, Roberto G. Quercia, Wei Li, and Janneke Ratcliffe. “Risky Borrowers or Risky Mortgages? Disaggregating Effects Using Propensity Score Models.” Chapel Hill, NC: University of North Carolina at Chapel Hill, Center for Community Capital, 2008. U.S. Department of Housing and Urban Development, Office of Policy Development and Research (2010). Report to Congress on the Root Causes of the Foreclosure Crisis, available at http://www.huduser.org/Publications/PDF/Foreclosure_09.pdf. Roberto G. Quercia, Michael A. Stegman, Walter R. Davis, “The Impact of Predatory Loan Terms on Subprime Foreclosures: The Special Case of Prepayment Penalties and Balloon Payments,” Housing Policy Debate 18(2): 311-346. Anthony Pennington-Cross and Giang Ho, The Termination of Subprime Hybrid and Fixed-Rate Mortgages, Real Estate Economics, Volume 38, Issue 3, pages 399–426, Fall 2010
38 Ronald J. Mann, “Bankruptcy reform and the “sweat box” of credit card debt,” University of Illinois Law Review, 2007.
39 Because Advanta went into bankruptcy too soon to get a true reading of what its 2009 and 2010 losses would have been, it is not included in this report’s statistical analysis.

Predatory Credit Card Lending: Unsafe, Unsound for Consumers and Companies 24
noTes

Center for Responsible Lending 25
about the Center for Responsible lending
The Center for Responsible Lending is a nonprofit, nonpartisan research and policy organization dedicated to protecting homeownership and family wealth by working to eliminate abusive financial practices. CRL is affiliated with Self-Help, one of the nation’s largest community development financial institutions.
Visit our website atwww.responsiblelending.org.
NorthCarolina302 West Main StreetDurham, NC 27701Ph (919) 313-8500Fax (919) 313-8595
California1330 BroadwaySuite 604Oakland, CA 94612Ph (510) 379-5500Fax (510) 893-9300
DistrictofColumbia910 17th Street NWSuite 500Washington, DC 20006Ph (202) 349-1850Fax (202) 289-9009
Copyright © 2012 by Center for Responsible Lending