predicating 2016 airlines performance
TRANSCRIPT

Reading In The Future 1
Predicating 2016 Airline Industry Performance
Reading In The
FUTURE
Reading In The Future 2
Predicating 2016 Airline Industry Performance By : Mohammed Salem Awad1 Aviation Consultant One of the major issues in the airline industry is setting targets/forecasting, in the recent time, multiple aviation sources report different predicated figures, based on their analysis, and sight for the aviation market, off course there is a well-known brand names and companies doing these analysis, as IATA, ICAO, ACI, Boeing, Airbus, and many Worldwide companies. The dilemma, that, there is no basic foundation and rules for the predicators, especially manufacture companies as everyone comes with their own assumptions and approaches which lead to different results, yes there are many indicators to testify the results, one of these is R square – Coefficient of Determination, even though this indicator is not fairly enough to implemented and get the complete picture, It is worldwide aviation practice. In this article, a new concept is addressed, and two testify parameters are used. First is R - square– Coefficient of Determinations and Signal Tracking, S. T. , they are used as mapping tool on x-y coordinates for Displacement and Rotational factors that governed the mathematical model. Aviation Data:
ICAO and IATA are considered the main data source for aviation industry,
IATA - International Air Transport Association - is a trade association of the world’s airlines. About 250 airlines, primarily major carriers, carry approximately 84% of total Available Seat Kilometers - ASK of air traffic. IATA supports airline activity and helps formulate industry policy and standards. So airlines are the main stream source of traffic data for IATA.
ICAO - International Civil Aviation Organization, is a specialized agency of the United Nations. It codifies the principles and techniques of international air navigation and fosters the 1 Mohammed S. Awad, MBA, Mobile: 00967735222692, Email: [email protected]
Aviation Data
“Give me a place to stand on, and I will move the Earth”
Archimedes 287 B.C. – 212 B.C.
Reading In The Future 3
planning and development of international air transport to ensure safe and orderly growth. ICAO is distinct from IATA, with the Civil Air Navigation Services Organization (CANSO), an organization for Air Navigation Service Providers (ANSPs). These are trade associations representing specific aviation interests, whereas ICAO is a body of the United Nations. While airports are the main source of traffic data for ICAO. The main data source for this article is the newsletter by ICAO, Economic Development – Air Transport Monthly Monitor. As shown in the figures. The basic performance parameters for airlines are ASKs, RPKs, and Load Factor.
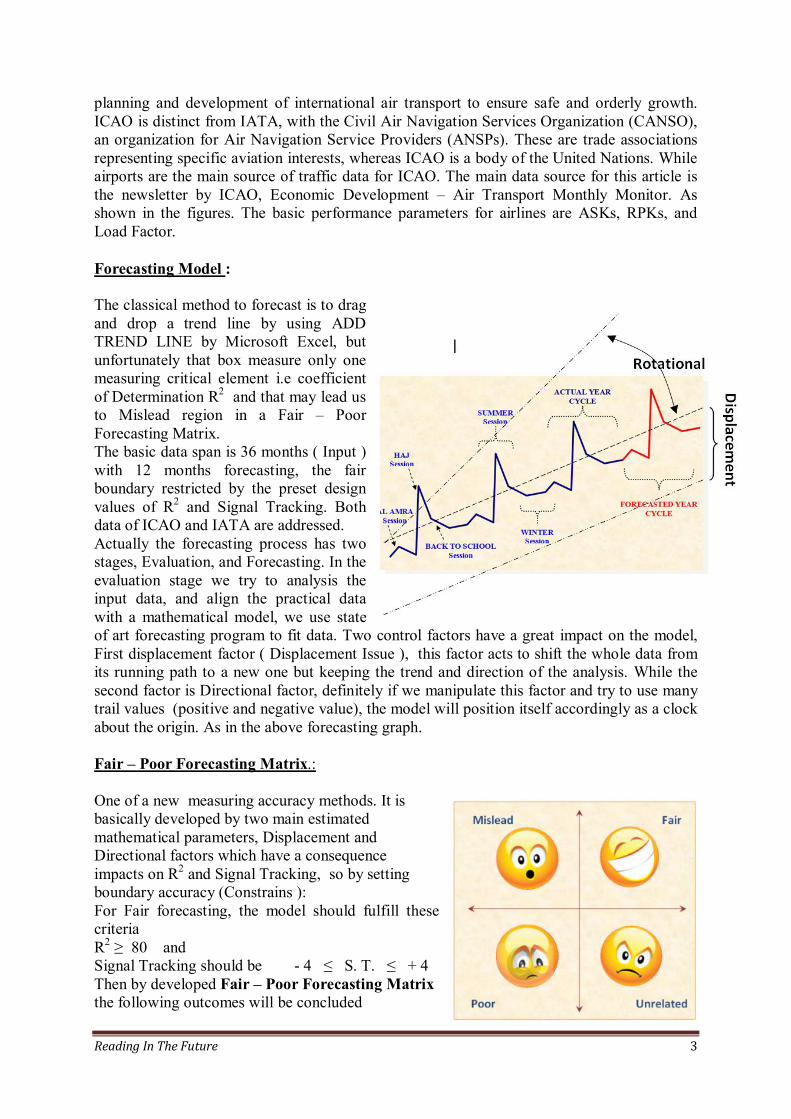
Forecasting Model : The classical method to forecast is to drag and drop a trend line by using ADD TREND LINE by Microsoft Excel, but unfortunately that box measure only one measuring critical element i.e coefficient of Determination R2 and that may lead us to Mislead region in a Fair – Poor Forecasting Matrix. The basic data span is 36 months ( Input ) with 12 months forecasting, the fair boundary restricted by the preset design values of R2 and Signal Tracking. Both data of ICAO and IATA are addressed. Actually the forecasting process has two stages, Evaluation, and Forecasting. In the evaluation stage we try to analysis the input data, and align the practical data with a mathematical model, we use state of art forecasting program to fit data. Two control factors have a great impact on the model, First displacement factor ( Displacement Issue ), this factor acts to shift the whole data from its running path to a new one but keeping the trend and direction of the analysis. While the second factor is Directional factor, definitely if we manipulate this factor and try to use many trail values (positive and negative value), the model will position itself accordingly as a clock about the origin. As in the above forecasting graph. Fair – Poor Forecasting Matrix.: One of a new measuring accuracy methods. It is basically developed by two main estimated mathematical parameters, Displacement and Directional factors which have a consequence impacts on R2 and Signal Tracking, so by setting boundary accuracy (Constrains ): For Fair forecasting, the model should fulfill these criteria R2 ≥ 80 and Signal Tracking should be - 4 ≤ S. T. ≤ + 4 Then by developed Fair – Poor Forecasting Matrix the following outcomes will be concluded

Reading In The Future 4
1- Fair Forecast – when R2 and Signal Tracking are in boundary . 2- Mislead – Displacement Issue. This case when R2 is in boundary and Signal Tracking
is out boundary. we can adjusted signal tracking to be in boundary when there is a room for R2 in the same analysis so that it can be consider as a fair forecast.
3- Unrelated – Directional Issue. This case when R2 is out of the boundary and Signal Tracking in the boundary. i.e the balance of accumulated error without any correlation
4- Poor Forecast – when both R2 and Signal Tracking are out of the boundary ( Total Mess).
This matrix manipulate the four decision regions to develop the right and best picture of the accuracy of forecasting. And to enhance the process of decision making for airline data analysis especially traffic forecasting, that maps the overall forecasting accuracy of Airline Industry Performance in terms of Load Factor . Forecasting of ASK, RPK ( ICAO ) The analysis period is 36 months starting from Nov.2012 to Oct. 2015 for ASK and RPK. The analysis shows the seasonality pattern of aviation industry figures for ASK and RPK, which fairly fitted at R, 99.6 and 99.2 respectively. In July and August shows the peaks values for the model while the activities reached to lowest levels is in November and February. Based on the reported figures of ICAO, the load factor is evaluated which is simply equal RPK/ASK, this includes all aviation activities in the world with non-registered airlines with IATA, while IATA represents about 84 % of ASK, the remaining 16% represents the others airlines some of them in Russia ,African countries and other UN aviation activities.
Reading In The Future 5
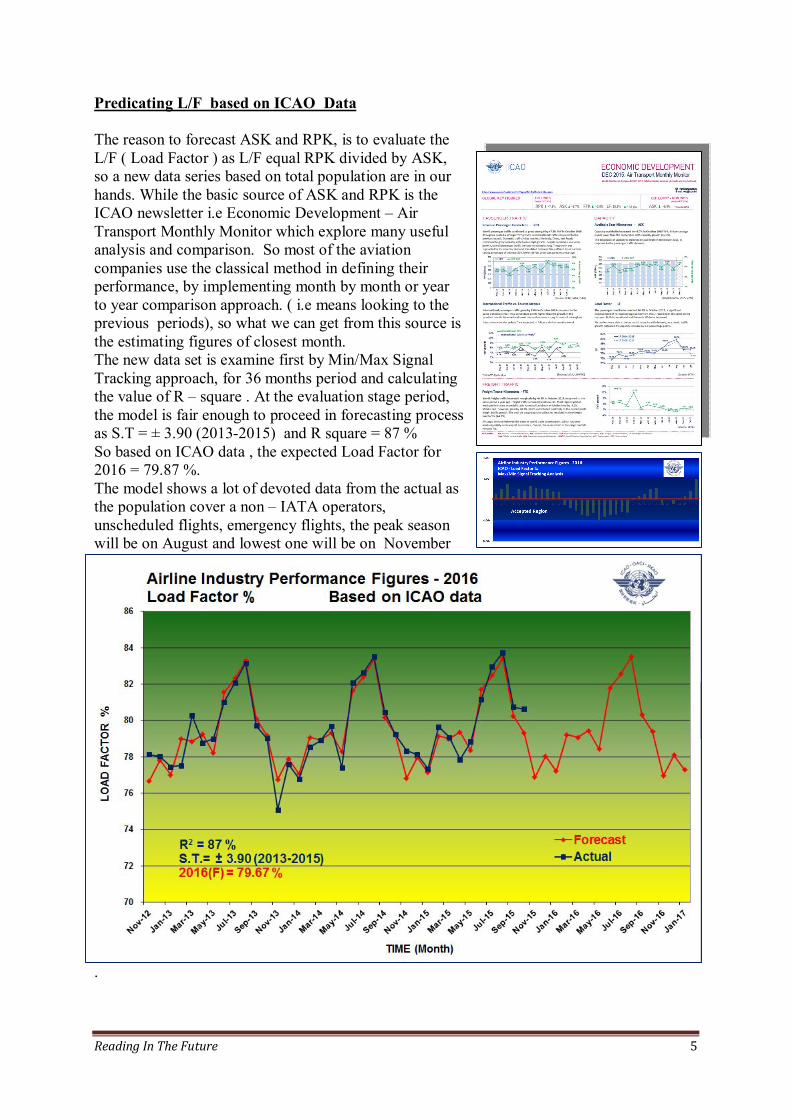
Predicating L/F based on ICAO Data The reason to forecast ASK and RPK, is to evaluate the L/F ( Load Factor ) as L/F equal RPK divided by ASK, so a new data series based on total population are in our hands. While the basic source of ASK and RPK is the ICAO newsletter i.e Economic Development – Air Transport Monthly Monitor which explore many useful analysis and comparison. So most of the aviation companies use the classical method in defining their performance, by implementing month by month or year to year comparison approach. ( i.e means looking to the previous periods), so what we can get from this source is the estimating figures of closest month. The new data set is examine first by Min/Max Signal Tracking approach, for 36 months period and calculating the value of R – square . At the evaluation stage period, the model is fair enough to proceed in forecasting process as S.T = ± 3.90 (2013-2015) and R square = 87 % So based on ICAO data , the expected Load Factor for 2016 = 79.87 %. The model shows a lot of devoted data from the actual as the population cover a non – IATA operators, unscheduled flights, emergency flights, the peak season will be on August and lowest one will be on November
.

Reading In The Future 6
Predicating L/F based on IATA Data Iata data does not represent the whole population figures of the airline industry, it only reported 84 % of total sampling of airline industry, while the quality of data is high which shows clearly the seasonality’s periods of airline industry at an excellent level data fitting, some analysis reported by air passengers market analysis – IATA , using the concept of the percentile changes either for month by month or year by year which clearly declare the event at one time or period. So IATA data are examine first by Min/Max Signal Tracking approach, for 36 months period and calculating the value of R – square . At the evaluation stage period, the model is highly fair for the process of forecasting since S.T = ± 3.35 (2013-2015) and R square = 94.9 % which satisfies the pre-set constrains. So based on IATA data , the expected Load Factor for 2016 = 80.26 %. The model shows a smooth sequence of data flow from the actual reading, defining the right seasonality patterned for Airline Industry, the peak season will be on August and lowest one will be on November.

Reading In The Future 7
Implementation of Accuracy Forecasting Matrix.:
Four main performance factors are evaluated, i.e ASK, RPK, & L/F by ICAO and Load Factor by IATA as it is mentioned in the following table:
And accordingly accuracy forecasting matrix is constructed, exploring a clear picture for accuracy and fairness of the analysis. Three factors are consider Fair situation while one consider Mislead, but by referring to the graph of ASKs, we found the data were spread on both sides of trend line which clearly shows by signal tracking values ± 6.22 so in this case we can consider ASKs also a Fair situation. R – square for ASKs and RPKs very high, and this indicate a strong relation between actual data and the modeling values. The best performance factor is Load Factor by IATA, Results : The expected ASK for 2016 will be = 8504 Billions With a growth rate :5.40 % The expected RPK for 2016 will be = 6778 Billions With a growth rate :5.43 % The expected Load Factor for 2016 ( ICAO) = 79.66 % The expected Load Factor for 2016 ( IATA) = 80.26 %

Reading In The Future 8
Summary Two data aviation sources are addressed in this study ( ICAO and IATA), and a new analysis concept is applied – Max/Min Signal Tracking approach – to forecast the Airline Industry Performance in terms of Load Factor, while the accuracy is mapping on Forecasting Matrix, defining the complete picture of the analysis. Three performance factors are in a Fair situation i.e RPKs, L/F (ICAO), and L/F(IATA), while ASKs is the only performance factor that may indicate a Mislead situation, but that also denied by the visual view for the forecasting graph and the values of Max/Min values on both sides of the trend line by ± 6.22, the best analysis is IATA Load Factor, which shows, the Airline Industry Performance ( Load Factor ) will be 80.26 % ■ Appendix: Errors Evaluation: By comparing actual data vs model values for the period – from Nov.2012 to Oct. 2015, the maximum error is not exceed 2.5 %,