predicting concrete resistivity from ohms law
TRANSCRIPT

PREDICTING CONCRETE RESISTIVITY FROM OHMS LAW
by
Alex Jay Hammond
A thesis submitted to the faculty of The University of Utah
in partial fulfillment of the requirements for the degree of
Master of Science
Department of Civil and Environmental Engineering
The University of Utah
May 2010
PREDICTING CONCRETE RESISTIVITY FROM OHMS LA W
by
Alex Jay Hammond
A thesis submitted to the faculty of The University of Utah
in panisl fulfillment of the requirements for the degree of
Master of Science
Depanmcnt of Civil and Environmental Engineering
The University of Utah
May2010

Copyright © Alex Jay Hammond 2010
All Rights Reserved
Copyright 0 Alex Jay Hammond 2010
All Rights Reserved

THE UNIVERSITY OF UTAH GRADUATE SCHOOL
SUPERVISORY COMMITTEE APPROVAL
of a thesis submitted by
Alex Jay Hamm ond
This thesis has been read by each member of the following supervisol)' committee and by majority vote has been found to be satisfactol)'.
Chris Pantelides

THE UNIVERSITY OF UTAH GRADUATE SCHOOL
FINAL READING APPROVAL
To thc Graduatc Council of thc University of Utah:
[ have read the thesis of Alex Jay Hammond in its final form and have found that (I) its fonnat, citations, and bibliographic style arc consistent and acceptable: (2) its illustrative matcrials including figures, tablcs, and eharts arc in place: and (3) the final manuscript is satisfactory to the supervisory committee and is ready for submission \0 The Graduate School.
,to �:f:?t� Approved for thc Major Departmcnt
Approved for the Graduate Council
Charles A�Wight Dean of The Graduatc School

ABSTRACT
The resistance of concrete to the penetration of chloride ions from deicing salts or
other brine solutions is one of the most important performance properties used in
concrete mixture design specifications. This property provides valuable insight into the
time to the corrosion initiation of reinforcing steel. The AASHTO T277 or ASTM
CI 202 tests have been used in the approval of mixture designs for most high performance
concrete (HPC) specifications as an indicator of durability. This test is time consuming
and not conducive to the volume or time constraints of quality control or quality
assurance (QC/QA) testing of in-situ concrete or field cured concrete. In recent years,
various iterations of the Wenner probe have been developed to characterize the electrical
resistance of concrete, a property that plays an important role in the initiation and
propagation of corrosion. Fully developed life cycle analysis models use both a)
corrosion initiation time; and b) corrosion propagation components to address their goals.
This thesis demonstrates that the physics of these two tests are closely related and using
26 different HPC mixture designs, the electrical resistivity can reliably predict the
resistance of concrete to the penetration of chloride ions with substantially less effort and
expense. In this large number of different mixture designs for bridge decks and exposed
structures, the electrical resistance consistently correlated with the T277 and CI202 test
results. In addition, the concrete's electrical resistance is a physical property of the
ABSTRACT
The resistance of concrete to the penetration of chloride ions from deicing salts or
other brine solutions is one of the most important performance properties used in
concrete mixture design specifications. This property provides valuable insight into the
time to the corrosion initiation of reinforcing steel. The AASHTO T277 or ASTM
C 1202 tests have been used in the approval of mixture designs for most high performance
concrete (HPC) specifications as an indicator of durability. This test is time consuming
and not conducive to the volume or time constraints of quality control or quality
assurance (QCIQA) testing of in-situ concrete or field cured concrete. In recent years,
various iterations of the Wenner probe have been developed to characterize the electrical
resistance of concrete, a property that plays an important role in the initiation and
propagation of corrosion. Fully developed life cycle analysis models use both a)
corrosion initiation time; and b) corrosion propagation components to address their goals.
This thesis demonstrates that the physics of these two tests are closely related and using
26 different HPC mixture designs, the electrical resistivity can reliably predict the
resistance of concrete to the penetration of chloride ions with substantially less effort and
expense. In this large number of different mixture designs for bridge decks and exposed
structures, the electrical resistance consistently correlated with the T277 and C 1202 test
results. In addition, the concrete's electrical resistance is a physical property of the

concrete, not just an indicator of potential behavior. As such, it can be directly used in
the development of corrosion models.
This thesis discusses the research conducted to verify the correlation between the
ASTM CI202 testing results and the Wenner resistivity results using Ohms law.
Through this research, it was determined that there was a consistent relationship through
Ohms law.
v
concrete, not just an indicator of potential behavior. As such, it can be directly used in
the development of corrosion models.
This thesis discusses the research conducted to verify the correlation between the
ASTM C l202 testing results and the Wenner resistivi ty resul ts using Ohms law.
Through this research, it was detennined that there was a consistent relationship through
Ohms law.

TABLE OF CONTENTS
ABSTRACT iv
LIST OF TABLES viii
LIST OF FIGURES ix
ACKNOWLEDGMENTS xi
Chapter
1. INTRODUCTION 1
Electrical Conductivity of Concrete and Its Role in Corrosion 1 Tests of Resistivity and Conductivity 2 The Need of the Tests 3 The Need of a Correlation 4 Problem Statement 4
2. LITERATURE REVIEW 5
Resistivity and ASTM C1202 5
3. MATERIALS AND METHODS 10
Concrete Materials and Methods 10 ASTM CI202 12
Wenner Resistivity 14
4. ACI MANUSCRIPT 18
Manuscript Introduction 18
Manuscript 19
5. EVALUATION OF DATA 40
Geometric Correction 40 Joule Effect 41
TABLE OF CONTENTS
ABSTRACT ....................................................................................................................... iv
LIST OF T ABLES ........................................................................................................... viii
LIST OF FIGURES .................................................. ................................................. ... ..... ix
ACKNOWLEDGMENTS ............................................................................................ ..... xi
Chapter
I. INTRODUCTION ........ .. ................ ...... .......... ...... ....... ........................................... 1
Electrical Conductivity or Concrete and Its Role in Corrosion ..... .............. 1 Tests or Resistivity and Conductivity .......................................................... 2 The Need orthe Tests ............................................................................... ... 3 The Need or a Correlation ................. .......................................................... .4 Problem Slatemenl ............................................................................. ......... .4
2. LITERATU RE REVIE\V ...................................... ................................................. .5
Resistivity and ASTM C 1202 .................... ................................................. .5
3. MATERIALS AN D METHODS ........................................................................... 10
Concrete Materials and Mcthods ............................................................... 1 0 ASTM CI202 ............................................................................................. 12 Wenner Rcsislivily ..................................................................................... 14
4. ACI MANUSCRIPT ......................................................................................... ... .. 18
Manuscript Introduction .................... ................................................. ........ 18 Manuscript ........................................... ................................. .... ................. 19
5. EVALUATION OF DATA .................................... ....... ....... ................................ .40
Geometric Correction ................................................................................ .40 Joule Effccl ............................................................................................... .41

Resistivity from Coulomb and Coulomb from Resistivity 43 Deviation from Theoretical Ohms Law 45 Drying Time and Excluded Data 46 Comparison with Prior Work 47 Material Influence Evaluation 47 Suggested Additional Research 52
6. SUMMARY AND CONCLUSIONS 59
Summary 59
Conclusions 60
APPENDIX 63
REFERENCES 66
vii
Resistivity from Coulomb and Coulomb from Resistivity ................... ... ..43 Deviation from Theore1ical Ohms Law ............................................. ....... .45 Drying Time and Excluded Data .............................................................. .46 Comparison with Prior Work ....... ........................................................ .... .. 47 Material lnnuence Evaluation .. .... .. ................... .............. .. ....................... . .47 Suggested Addi tional Research .................... .. .. ......................................... 52
6. SUMMARY AND CONCLUS IONS ...... ......... ....................... .. ............. ............... 59
Summary ................................... .. . .............................................................. 59 Conclusions ................................ .. ............ ............................. ..................... 60
APPENDiX ........................................................................................................................ 63
REFERENCES ...................................................................................................... ............ 66
vii

LIST OF TABLES
Table Page
3.1 Cementitious material properties 11
3.2 Aggregate material properties 11
4.1 Drying time effect on resistivity for 65TI/30F/5SF 25
4.2 Wenner resistivity conversions to coulomb 29
4.3 AASHTO T277 conversions to resistivity 31
5.1 Independent testing of geometric correction factor 41
5.2 Extended testing coulomb vs. joule corrected coulomb 42
5.3 Adjusted equation variation from theoretical equation 46
5.4 Correction factor variability 57
A. 1 Condensed 98-day resistivity and coulomb data 64
A.2 Condensed 28-day resistivity and coulomb data 65
USTOFTA BLES
Table Page
3.1 Cementitious material properties ............... ........................................................... 11
3.2 Aggregate material properties ............................. ........................................... ........ 11
4. 1 Drying time efTect on resistivity for 65T1!30F/5SF .... .. ......................................... 25
4.2 Wenner resistivity conversions to coulomb ................... .................... ................... .29
4.3 AASHTO TI77 conversions to resistivity ............................................................ .31
5.1 Independent testing of geometric corrcction factor .............................................. .4 1
5.2 Extended testing coulomb vs. joule corrected coulomb ....................................... .42
5.3 Adjusted equation variation from theoretical equation .......................................... 46
5.4 Correction factor variabili ty ................................................................................... 57
A.I Condensed 98·day resistivity and coulomb data ................................................... 64
A.2 Condensed 28·day resistivity and coulomb data ................................................... 65

LIST OF FIGURES
Fig. Page
3.1 Wenner resistivity probes 15
4.1 AASHTO T277 test apparatus 21
4.2 Wenner meter 22
4.3 Raw coulomb and adjusted coulomb (joule effect and geometric correction) 32
4.4 Raw coulomb and adjusted T277 coulomb (joule effect) 33
4.5 Raw coulomb and adjusted (geometric correction) coulomb obtained from resistivity (Wenner meter) 34
4.6 Raw resistivity and adjusted resistivity (joule effect and geometric correction)...35
4.7 Adjusted resistivity (joule effect) calculated from T277 data 36
4.8 Raw resistivity and adjusted (geometric correction) Wenner resistivity 37
4.9 Wenner resistivity vs. AASHTO T277 coulomb... 38
4.10 Comparison of adjusted (joule effect and geometric correction) relationship and theoretical relationship 39
5.1 Joule effect 43
5.2 Comparison to previous work 48
5.3 AASHTO T277 coulomb vs. Wenner resistivity 49
5.4 Pozzolan substitution comparison 50
5.5 AASHTO T277 coulomb vs. Wenner resistivity - silica fume 51
LI ST OF FIGURES
3.1 \Venner resistivity probes ...................................................................................... 15
4.1 AASHTO TI77 test apparatus ............................................................................... 21
4.2 \Venner meter ......................................................................................................... 22
4.3 Raw coulomb and adjusted coulomb (joule effcct and g .. :omctric correction) ...... 32
4.4 Raw coulomb and adjusted TI77 coulomb (joule effcct) ...................................... 33
4.5 Raw coulomb and adjusted (geometric correction) coulomb obtained from resisti vity (Wenner meter) ................................................................................... 34
4.6 Raw resistivity and adjusted resistivity (joule effcct and geometric correction) ... 35
4.7 Adjusted resistivity (joule effect) calculated from TI77 data ............................... 36
4.8 Raw resistivity and adjusted (geometric corrcction) Wenner resistivity ............... 37
4.9 Wenner resistivity vs. AAS HTO TI77 coulomb ................................................... 38
4.10 Comparison of adjusted (joule effect and geometric correction) relationship and theoretical relationship ........................................................................................ .39
5. 1 Joule effect ............................................................................................................. 43
5.2 Comparison to previous worX ................................................................................ 48
5.3 AASHTO TI77 coulomb vs. Wenner resistivity .................................................. .49
5.4 Pozzolan substitution comparison .......................................................................... 50
5.5 AAS HTO T277 coulomb vs. Wenner resistivity - s ilica fume ............................. 51

5.6 AASHTO T277 coulomb vs. Wenner resistivity - metakaolin 52
5.7 AASHTO T277 coulomb vs. Wenner resistivity - slag 53
5.8 AASHTO T277 coulomb vs. Wenner resistivity - Class F fly ash 54
5.9 AASHTO T277 coulomb vs. Wenner resistivity - Class F2 fly ash 55
5.10 AASHTO T277 coulomb vs. Wenner resistivity - Class C fly ash 56
5.11 98-day AASHTO T277 coulomb vs. 28-day Wenner resistivity 57
x
5.6 AASHTO TI77 coulomb vs. Wenner resistivity - metakaolin ............................ 52
5.7 AASHTO TI77 coulomb vs. Wenner rcsistivity - slag ........ ... ... .......... ............... 53
5.8 AASHTO T277 coulomb vs. Wenner resislivi ty - Class F fly ash ....................... 54
5.9 AASHTO T277 coulomb vs. Wenner resislivity - Class F2 fly ash ..................... 55
5.10 AASHTO TI77 coulomb vs. Wenner resistivity - Class C fly ash ....................... 56
5.11 98-day AASHTO TI77 coulomb vs. 28-day Wenner resistivity ........................... 57

ACKNOWLEDGMENTS
I would like to acknowledge contributions from the Federal Highway
Administration and the states involved in the pool funded study that made this research
possible. Dr. Paul Tikalsky has provided abundant guidance with the research and
creation of this thesis and for that I am grateful. Acknowledgment goes to those with
whom I worked in the laboratory, including Pratanu Ghosh and the many undergraduates
that helped collect the data, and Mark Bryant. I would especially like to thank my wife
Amanda and my family for their patience and encouragement along the way.
ACKNOWLEDGMENTS
I would [ike to acknowledge contributions from the Federal Highway
Administration and the states involved in the pool funded study that made this research
possible. Dr. Paul Tikalsky has provided abundant guidance with the research and
creation of this thesis and for that J am grateful. Acknowledgment goes to those wi th
whom I worked in the laboratory, including Pratanu Ghosh and the many undergraduates
that helped collect the data. and Mark Bryant. [would especially like to thank my wife
Amanda and my family for their patience and encouragement along the way.

CHAPTER 1
INTRODUCTION
As a culminating report of work completed at the University of Utah in the Civil
and Environmental Engineering department, this thesis is submitted to the department
and graduate school. The work encompasses research on a correlation between two
testing methods: Wenner resistivity and ASTM CI202 - "Standard Test Method for
Electrical Indication of Concrete's Ability to Resist Chloride Ion Penetration" (1) (also
known as American Association of State Highway and Transportation Officials
(AASHTO) Standard T277-05, "Standard Method of Test for Electrical Indication of
Concrete's Ability to Resist Chloride"(2)) using established physics principles.
Electrical Conductivity of Concrete and Its Role in Corrosion
The electrical conductivity of concrete plays a major role in the corrosion of steel
rebar embedded in concrete. If the concrete has high conductivity, there is a greater
potential for corrosion cells to develop due to greater concentrations of ions at the rebar
level as opposed to low conductivity concrete. The corrosion of rebar is an
electrochemical process, which requires electrochemical potentials to form corrosion
cells. These cells are often formed due to different ionic concentrations of alkalis and
chlorides within a material. When the metal has different ionic concentrations at
CHAPTER 1
INTRODUCTION
As a culminating report of work completed at the University of Utah in the Civil
and Environmental Engineering department, this thesis is submitted to the department
and graduate school. The work encompasses research on a correlation between two
testing methods: Wenner resistivity and ASTM C1202 - "Standard Test Method for
Electrical Indication of Concrete's Ability to Resist Chloride Ion Penetration" (1) (also
known as American Association of State Highway and Transportation Officials
(AASHTO) Standard T277-05, "Standard Method of Test for Electrical Indication of
Concrete's Ability to Resist Chloride"(2)) using established physics principles.
Electrical Conductivity of Concrete and Its Role in Corrosion
The electrical conductivity of concrete plays a major role in the corrosion of steel
rebar embedded in concrete. If the concrete has high conductivity, there is a greater
potential for corrosion cells to develop due to greater concentrations of ions at the rebar
level as opposed to low conductivity concrete. The corrosion of rebar is an
electrochemical process, which requires electrochemical potentials to form corrosion
cells. These cells are often formed due to different ionic concentrations of alkalis and
chlorides within a material. When the metal has different ionic concentrations at

2
different locations along its length, anodes and cathodes may develop. In order for the
corrosion to take place, water, oxygen, and ions need to be present between the cathode
and anode. When chlorides are present and with high conductivity concrete (highly
permeable), more ions are present for this process to initialize and propagate corrosion.
The corrosion that occurs is manifested as the formation of rust, which when it is formed
has an expansive reaction. When the rust expands, the concrete is no longer able to
withstand the tensile forces and cracks or spalls. Cracking and spalling brings more air,
water, and ions that penetrate very quickly when cracks are present, and thus propagate
the rusting. Conversely, with low permeable concrete there are less chloride ions present,
so the reaction is much slower if it develops at all. This provides a longer lasting
structure due to the reduction of corrosion in the rebar.
When the rebar is rolled, its surface has a passivating iron-oxide layer that is
resistant to corrosion in an alkaline environment of concrete, pH 13. The introduction of
chloride ions reduces the pH of the pore water in concrete. When the pH drops below 10,
the coating becomes susceptible to corrosion. The reduction of pH may destroy the
protective layer on the rebar and initiate the corrosion process. These reasons are why
measuring the electrical conductivity of concrete is important in concrete structures
containing steel reinforcement (3).
Tests of Resistivity and Conductivity
The Wenner resistivity testing method was initially developed for use by
geologists to determine the resistivity of soil strata; it has since been modified for use in
testing certain material properties in concrete (4). This method involves using a 4 probe
2
different locations along its length, anodes and cathodes may develop. In order for the
corrosion to take place, water, oxygen, and ions need to be present between the cathode
and anode. When chlorides are present and with high conductivity concrete (highly
permeable), more ions are present for this process to initialize and propagate corrosion.
The corrosion that occurs is manifested as the formation of rust, which when it is formed
has an expansive reaction. Whcn the rust expands, the concrete is no longer able to
withstand the tensile forces and cracks or spalls. Cracking and spalling brings more air,
water, and ions that penetrate very quickly when cracks are present, and thus propagate
the rusting. Conversely, with low permeable concrete there are less chloride ions present,
so the reaction is much slower if it develops at all. This provides a longer lasting
structure due to the reduction of corrosion in the rebar.
When the rebar is rolled, its surface has a passivating iron-oxide layer that is
resistant to corrosion in an alkaline environment of concrete, pH 13. The introduction of
chloride ions reduces the pH of the pore water in concrete. When the pH drops below 10,
the coating becomes susceptible to corrosion. The reduction of pH may destroy the
protective layer on the rebar and initiate the corrosion process. These reasons are why
measuring the electrical conductivity of concrete is important in concrete structures
containing steel reinforcement (3).
Tests of Resistivity and Conductivity
The Wenner resistivity testing method was initially developed for use by
geologists to determine the resistivity of soil strata; it has since been modified for use in
testing certain material properties in concrete (4). This method involves using a 4 probe

device used to measure the electrical resistivity of a material. The use of this device for
this purpose is relatively new; only in the last 10 years has it been used for this purpose.
The ASTM C 1202 test method has been used since the 1980s as an indicator of the
resistance to chloride ion penetration into concrete. The difficulty with the widespread
acceptance of this testing method is the lengthy time required to perform the procedures.
The curing and sample preparation takes 28 to 56 days and the test requires another 6
hours to perform. This time frame is unacceptable for most quality control measures.
The information gained from performing these tests indicates how resistant the
concrete is to chloride ion penetration. Although it is not a direct measurement, it has
been shown to be a reliable indicator.
The Need of the Tests
A major reason for premature bridge replacement in the United States is due to
rebar corrosion. This corrosion is due to roadway salts being applied during winter or sea
salt spraying onto the structure and the chlorides in the salts penetrating the concrete to
the rebar. As the rebar corrodes, it expands and delaminates and cracks concrete, which
furthers the corrosion process. The importance of the ASTM CI 202 testing method is to
determine which concrete mixtures can reduce or eliminate chlorides from penetrating
the concrete and attacking the rebar. One deficiency in the ASTM CI202 method is the
ability to use it in-situ to ensure the concrete placed meets the testing standard.
3
device used to measure the electrical resistivity of a material. The use of this device for
this purpose is relatively new; only in the last 10 years has it been used for this purpose.
The ASTM C 1202 test method has been used since the 1980s as an indicator of the
resistance to chloride ion penetration into concrete. The difficulty with the widespread
acceptance of this testing method is the lengthy time required to perform the procedures.
The curing and sample preparation takes 28 to 56 days and the test requires another 6
hours to perform. This time frame is unacceptable for most quality control measures.
The information gained from performing these tests indicates how resistant the
concrete is to chloride ion penetration. Although it is not a direct measurement, it has
been shown to be a reliable indicator.
The Need of the Tests
A major reason for premature bridge replacement in the United States is due to
rebar corrosion. This corrosion is due to roadway salts being applied during winter or sea
salt spraying onto the structure and the chlorides in the salts penetrating the concrete to
the rebar. As the rebar corrodes, it expands and delaminates and cracks concrete, which
furthers the corrosion process. The importance of the ASTM C1202 testing method is to
determine which concrete mixtures can reduce or eliminate chlorides from penetrating
the concrete and attacking the rebar. One deficiency in the ASTM C 1202 method is the
ability to use it in-situ to ensure the concrete placed meets the testing standard.

4
Problem Statement
The purpose of this work is to relate the ASTM CI 202 testing results with results
obtained using a Wenner resistivity device by utilizing Ohms law. Throughout the
scientific community, it has been established that there is a correlation in the testing
results based on experimental data, but these findings have failed to explain what the
relationship is and why there is a relationship. The main objective is to show that there is
a scientific connection between the two testing results through Ohms law.
The Need of a Correlation
One of the major flaws of the existing research in this area is that the researchers
simply show a connection between the two tesing methods, but do not present a
theoretical link between the two tests. Several articles have been published on research
showing a relationship between these two testing methods. The importance of this
research is to show how they are related using a basic physics concept, Ohms law (5).
With this knowledge, it is anticipated that the Wenner resistivity can eventually replace
the ASTM CI 202 as an electrical indicator of potential chloride ion penetration that can
be used in-situ.
The Need of a Correlation
One of the major flaws of the existing research in this area is that the researchers
simply show a connection between the two tesing methods, but do not present a
theoretical link between the two tests. Several articles have been published on research
showing a relationship between these two testing methods. The importance of this
research is to show how they are related using a basic physics concept, Ohms law (5).
With this knowledge, it is anticipated that the Wenner resistivity can eventually replace
the ASTM C 1202 as an electrical indicator of potential chloride ion penetration that can
be used in-situ.
Problem Statement
4
The purpose of this work is to relate the ASTM C 1202 testing results with results
obtained using a Wenner resistivity device by utilizing Ohms law. Throughout the
scientific community, it has been established that there is a correlation in the testing
results based on experimental data, but these findings have failed to explain what the
relationship is and why there is a relationship. The main objective is to show that there is
a scientific connection between the two testing results through Ohms law.

CHAPTER 2
LITERATURE REVIEW
The following literature review can also be found in the journal article submitted
to the American Concrete Institute Materials Journal in Chapter 4.
Resistivity and ASTM C1202
Investigation into whether the AASHTO T277 testing method can be used as an
indicator for chloride ion penetration was conducted by Feldman et al. (<5). It was
determined that the physical characteristics of the concrete specimens in the T277 test
were changed by the severe conditions found in the test, thus possibly leading to skewed
results. They determined that there was good correlation between current passed and
conductivity (which is the inverse of resistivity). One of their recommendations was to
perform more tests to correlate data between resistivity and initial current in the T277 test
with blended cements.
An evaluation of the Wenner technique for measuring resistivity was conducted
by Gowers and Millard to evaluate the best testing methods for using the Wenner device
(7). Their work consisted of using the Wenner device in various situations to determine
the best way to use the device. Their recommendations include ensuring good contact
CHAPTER 2
LITERATURE REVIEW
The following literature review can also be found in the journal article submitted
to the American Concrete Institute Materials Journal in Chapter 4.
Resistivity and ASTM C1202
Investigation into whether the AASHTO 1'277 testing method can be used as an
indicator for chloride ion penetration was conducted by Feldman et al. (6). It was
determined that the physical characteristics of the concrete specimens in the T277 tcst
were changed by the severe conditions found in the test, thus possibly leading to skewed
results. They determined that there was good correlation between current passed and
conductivity (which is the inverse of resistivity). One oftheir recommendations was to
perform more tests to correlate data between resistivity and initial current in the '1'277 test
with blended cements.
An evaluation of the Wenner technique for measuring resistivity was conducted
by Gowers and Millard to evaluate the best testing methods for using the Wenner device
(7). Their work consisted of using the Wenner device in various situations to determine
the best way to use the device. Their recommendations include ensuring good contact

between the device and the concrete, allowing adequate edge distance, having probe
spacing larger than 1.5 times the maximum aggregate size, and using a pachometer to
determine bar locations in concrete to avoid bar interference.
Research into the factors involved in performing resistivity readings was
investigated by Sengul and Gjorv (8). Through this research, it was verified that the
spacing of the resistivity probes on the Wenner four probe array has a large influence on
the resistivity measured. This same study showed the temperature and moisture curing
conditions of the specimens can change the resistivity outcome. The conclusions of this
research indicate that resistivity measurements can be used for quality control as long as
the testing method and specimen conditions are uniform between tests.
Research was done on the effect of specimen geometry and probe spacing on
resistivity readings by Morris et al. (9). This research was conducted to correlate
readings from standard strength test cylinders with semi-infinite slabs in order to
indirectly measure concrete characteristics. The experiment involved creating a finite
element model of concrete specimens as well as testing specimens with a Wenner
resistivity device. A correction factor was developed to correlate experimental and
modeled values of resistivity with different probe spacing and specimen shape and size.
This correction factor is called the geometric correction factor.
Experimentation using the Wenner device on 529 sample sets was conducted by
Kessler et al. at the Florida Department of Transportation (10) to investigate whether
resistivity can be used as a quality control measure in place of AASHTO T277 and the
variation in readings from different testing technicians was also studied. Their findings
indicate that, using the geometric correction factor, there is a good correlation between
between the device and the concrete, allowing adequate edge distance, having probe
spacing larger than 1.5 limes the maximum aggregate size, and using a pachometer to
delemline bar locations in concrele to avoid bar in terference.
Research into the factors involved in perfonning resistivity readings was
investigated by Sengul and Gjorv (8). Through this research, it was verified thal1he
spacing of the resistivi ty probes on the Wenner four probe array has a large influence on
the resistivity measured. This same study showed the temperature and moisture curing
conditions orthe specimens can change the resistivity outcome. The conclusions o f this
research indicate that res istivi ty measurements can be used for quality control as long as
the tes ting method and specimen conditions are uniforn} between tests.
Research was done on the effect of specimen geomet!), and probe spacing on
resistivity readings by Morris et a1. (9). This research was conducted to correlate
readings from standard strength test cylindcrs with semi-infinite slabs in order to
indirectly measure concrete characteristics. The experiment involved creating a finite
element model of concrete sp\."Cimens as wcll as testing specimens with a Wenner
resistivity device. A correction factor was developed to correlate experimental and
modeled values of resistivity with different probe spacing and specimen shape and size.
This correction faclor is called the geometric correction fac tor.
Experimentation using the Wenner device on 529 sample sets was conducted by
Kessler et al. at the Florida Dcpat1ment of Transpot1ation (10) to ilwestigate whether
resistivity can be used as a quality control mcasure in place of AASHTO T277 and the
variation in readings from diffcrent testing tcchnicians was also studied. Their findings
indicate that, using the geometric correction factor, there is a good correlation between
6

7
AASTHO T277 and resistivity (R =0.948) and it was suggested as a replacement for
AASHTO T277. The Florida Department of Transportation has also developed a method
to standardize how resistivity readings should be performed (77).
The T277 test involves the application of 60Vdc, which increases the current flow
producing excessive heating of the specimen and changing the pore structure of concrete
over a short period of time. This increase in specimen temperature during testing, due to
the application of a high voltage, is called the "joule effect." As a resistor (concrete
specimen) is heated, the conductivity of the material increases. Since the AASHTO T277
is a measurement of conductivity, an excessive increase of specimen temperature during
testing results in a higher T277 reading, created by the joule effect. A relationship
between temperature change during testing and final coulomb readings was developed by
Betancourt and Hooton (12) in order to eliminate excessive heating effects of the
specimen during testing. These researchers also state that the joule effect has been a
major obstacle in connecting T277 data and the electrical conductivity. They
recommended that research should be performed to validate the correlation in these two
testing methods. The data presented in this paper shows the Wenner resistivity data and
AASHTO T277 data are related with consideration of the joule effect.
Investigation into whether the AASHTO T277 test can accurately predict chloride
ion ingress with concrete mixtures containing silica fume (SF) and ground granulated
blast-furnace slag (GGBFS) using the AASHTO T277 test, AASHTO T259, and
resistivity readings was performed by Wee et al. (13). The investigation included varying
curing days and material fineness. The findings were that there was a correlation
between the AASHTO T277 test and resistivity readings, but the connection between
7
AASTHO T277 and resistivity (R2=O.948) and it was suggested as a replacement for
AASHTO T277. The Florida Department of Transportation has also developed a method
to standardize how resistivity readings should be performed (11).
The T277 test involves the application of60Ydc, which increases the current flow
producing excessive heating of the specimen and changing the pore structure of concrete
over a short period of time. This increase in specimen temperature during testing, due to
the application ofa high voltage, is called the "joule eiTect." As a resistor (concrete
specimen) is heated, the conductivity of the material increases. Since the AASHTO T277
is a measurement of conductivity, an excessive increase of specimen temperature during
testing results in a higher '1'277 reading, created by the joule effect. A relationship
between temperature change during testing and final coulomb readings was developed by
Betancourt and Hooton (J 2) in order to eliminate excessive heating effects of the
specimen during testing. These researchers also state that the joule effect has been a
major obstacle in connecting T277 data and the electrical conductivity. They
recommended that research should be performed to validate the correlation in these two
testing methods. The data presented in this paper shows the Wenner resistivity data and
AASHTO T277 data are related with consideration of the joule etTec!.
Investigation into whether the AASHTO T277 test can accurately predict chloride
ion ingress with concrete mixtures containing silica fume (SF) and ground granulated
blast-furnace slag (GGBFS) using the AASHTO '1'277 test, AASHTO T259, and
resistivity readings was performed by Wee et a!. (13). The investigation included varying
curing days and material fineness. The findings were that there was a correlation
between the AASHTO T277 test and resistivity readings, but the connection between

AASHTO T277 and the AASHTO T259 was not very strong (R2=0.40 for GGBFS and
R =0.10 for SF). The recommendation was that AASHTO T277 is only a predictor of
relative chloride ion ingress of mixtures containing SF and GGBFS.
As part of research performed by Smith at Penn State University, two different
manufacturers of Wenner resistivity devices were tested to determine the relationship
between the two devices, as well as how the data correlates with the AASHTO T277 test
(14). The conclusion was the data from the meters follows a similar trend, but does not
present the same values for each measurement. For example, in a mixture where the
resistivity was moderately high (34 kQ*cm, 13.4 kf2*in) with one meter was also
moderately high (20 kU*cm, 7.9 kQ*in) with the other meter, only not as high. Data
obtained through Smith's research indicate that there is a relationship between the
AASHTO T277 test and resistivity readings. From curves comparing AASHTO T277
data with resistivity using a similar device to the one used in the research reported herein,
a good relationship was obtained (R =0.897). Another important idea that can be
gathered through Smith's research is that concrete exposed to chlorides for extended
periods of time may have lower resistivity readings than those not exposed to chlorides.
An investigation into the testing methods used to determine concrete chloride
penetration was performed for the Federal Highway Administration by Stanish et al. (75).
This investigation involved a literature review of the current methods used in 1997 to
determine the chloride penetration of concrete. Many methods were investigated in this
thorough analysis including the AASHTO T277 (Rapid Chloride Permeability Test) and
testing using Resistivity Techniques. The researchers investigated the pros and cons of
each test and concluded that each test has its strengths and weaknesses and that the
AASHTO T277 and the AASHTO T259 was not very strong (R2=0040 for GGBFS and
R2=0.10 for SF). The recommendation was that AASHTO T277 is only a predictor of
relative chloride ion ingress of mixtures containing SF and GGBFS.
8
As part of research performed by Smith at Penn State University, two different
manufacturers of Wenner resistivity devices were tested to determine the relationship
between the two devices, as well as how the data correlates with the AASHTO T277 test
(J 4). The conclusion was the data from the meters follows a similar trend, but does not
present the same values for each measurement. For example, in a mixture where the
resistivity was moderately high (34 kO*cm, 1304 kO*in) with one meter was also
moderately high (20 kO'cm, 7.9 kO*in) with the other meter, only not as high. Data
obtained through Smith's research indicate that there is a relationship between the
AASHTO T277 test and resistivity readings. From curves comparing AASHTO T277
data with resistivity using a similar device to the one used in the research reported herein,
a good relationship was obtained (R2=0.897). Another important idea that can be
gathered through Smith's research is that concrete exposed to chlorides for extended
periods of time may have lower resistivity readings than those not exposed to chlorides.
An investigation into the testing methods used to determine concrete chloride
penetration was performed for the Federal Highway Administration by Stanish et a1. (J 5).
This investigation involved a literature review of the current methods used in 1997 to
determine the chloride penetration of concrete. Many methods were investigated in this
thorough analysis including the AASHTO T277 (Rapid Chloride Permeability Test) and
testing using Resistivity Techniques. The researchers investigated the pros and cons of
each test and concluded that each test has its strengths and weaknesses and that the

proper test should be chosen for the desired outcome. The difficulties described for the
ASTM CI 202 test were concerning current passing through all ions, not just chloride
ions; the data was collected before steady state was reached; and the excessive heating of
the specimens can cause error. The difficulty with resistivity was concerning the
conductivity of the pore solution in the concrete. This could potentially yield different
resistivity readings with the same mixture of concrete.
Burke and Hicks (16) used 3 inch by 6 inch specimens submerged in 3% NaCl
solution for 2 years for an electrochemical test to determine resistivity of the concrete
material. This resistivity was compared to AASHTO T277 data and a relationship was
developed. The researchers determined that the relationship developed was adequate for
mixtures with permeability values below 2000 coulomb, but above this threshold, the
specimens were subject to excess heating during testing, which produced unacceptable
results.
9
proper lest should be chosen for the desired outcome. The difficulties described for the
ASTM C 1202 test were concerning current passing through all ions, not just chloride
ions; the data was collected before steady Slale was reached; and the excessive heating of
the specimens can cause crror. The difficulty with resistivi ty was concerning the
conducti vi ty of the pore solution in the concrete. This CQuld potentially yield different
resistivity readings with the same mixture of concrete.
Burke and Hicks (/6) used 3 inch by 6 inch specimens submerged in 3% Nne)
solution for 2 years for an clectrochemicaltcst to determine resistivity of thc concrete
materia1. This resistivity was compared \0 AASHTO T277 data and a relationship was
developed. The researchers determined that the relationship developed was adequate for
mixtures with permeability values below 2000 coulomb. but above th is threshold. the
specimens were subject to excess heating during testing. which produced unacceptable
results.

CHAPTER 3
MATERIALS AND METHODS
This chapter describes the materials and methods used to create and test the
concrete in this study. The concrete materials are only briefly discussed; a more
thorough analysis of the concrete materials and admixtures can be found elsewhere as
referenced in this chapter.
Concrete Materials and Methods
Mixture Materials
The concrete mixture design was based on 564 pounds of total cementitious
materials per cubic yard. The mixture design includes air entrainment, ASTM C33 No.
67 limestone aggregate, and C33 sand with a fineness modulus of 2.81. The coarse and
fine aggregate was from a local aggregate provider located in Salt Lake City, Utah. The
types of cement used varied from ASTM C595 Type IP (portland-pozzolan), Type IS
(portland blast-furnace slab), and Type ISM (slag-modified portland cement), to ASTM
CI 157 GU. The supplementary materials include ASTM CI 140 silica fume, ASTM
C618 Class F fly ash, and Class C fly ash, ASTM C618 Class N pozzolan metakaolin,
and ASTM C989 Grade 100 ground blast furnace slag. More information on these
'.'"
CHAPTER 3
MATERIALS AND METHODS
This chapter describes the materials and methods used to create and test the
concrete in this study. The concrete materials are only briefly discussed; a more
thorough analysis of the concrete materials and admixtures can be found elsewhere as
referenced in this chapter.
Concrete Materials and Methods
Mixture Materials
The concrete mixture design was based on 564 pounds of total cementitious
materials per cubic yard. The mixture design includes air entrainment, ASTM C33 No.
67 limestone aggregate, and C33 sand with a fineness modulus of 2.81. The coarse and
fine aggregate was from a local aggregate provider located in Salt Lake City, Utah. The
types of cement used varied from ASTM C595 Type IP (portland-pozzolan), Type IS
(portland blast-furnace slab), and Type ISM (slag-modified portland cement), to ASTM
Cl157 GU. The supplementary materials include ASTM Cl140 silica fume, ASTM
C618 Class F fly ash, and Class C fly ash, ASTM C618 Class N pozzolan metakaolin,
and ASTM C989 Grade 100 ground blast furnace slag. More information on these

11
Table 3.1 - Cementitious material properties
Material Specific Gravity Type I Cement 3.15 TISM Cement 2.95 TIP Cement 3.11
Limestone Cement 3.25 Class C Fly Ash 2.62 Class F Fly Ash 2.37 Class F Fly Ash 2.41
GGBFS 120 2.96 Silica Fume 2.21 Metakaolin 2.52
Table 3.2 - Aggregate material properties
Material Specific Gravity
Absorption Fineness Modulus
Natural River Sand 2.64 1.96% 2.81 3A inch Gravel 2.68 0.86% N/A
materials can be found in the report "Development of Performance Properties of Ternary
Mixtures: Phase I Final Report," report number Pooled Fund Study TPF-5(117) by
Tikalsky et al. submitted to the Federal Highway Administration (FHWA) in December
of 2007 (77). A summary of the material specific gravity for cementitious material can
be found in Table 3.1 and specific gravity, absorption, and fineness modulus for
aggregate materials in Table 3.2. Additional information on the cementitious material
and admixtures can also be found in the journal article "Effects of Different Air
Engraining Agents (AEA), Supplementary Cementitious Materials (SCM), and Water
Reducing Agent (WR) on the Air Void Structure of Fresh Mortar" by Rupnow et al. (18).
11
materials can be found in the report "Development of Performance Properties of Ternary
Mixtures: Phase I Final Report," report number Pooled Fund Study TPF-5(J 17) by
Tikalsky et al. submitted to the Federal Highway Administration (FHWA) in December
of 2007 (17). A summary of the material specific gravity for cementitious material can
be found in Table 3.1 and specific gravity, absorption, and fineness modulus for
aggregate materials in Table 3.2. Additional information on the cementitious material
and admixtures can also be found in the journal article "Effects of Different Air
Engraining Agents (AEA), Supplementary Cementitious Materials (SCM), and Water
Reducing Agent (WR) on the Air Void Structure of Fresh Mortar" by Rupnow et al. (18).
Table 3.1 - Cementitiolls material properties
Material Specific Gravity Type I Cement 3.15 TISM Cement 2.95 TIP Cement 3.11
Limestone Cement 3.25 Class C Fly Ash 2.62 Class F Fly Ash 2.37 Class F Fly Ash 2.41
GGBFS 120 2.96 Silica Fume 2.21 Metakaolin 2.52
Table 3.2 - Aggregate material properties
Material Specific Absorption Fineness Gravity Modulus
Natural River Sand 2.64 1.96% 2.81 % inch Gravel 2.68 0.86% N/A

12
Mixture Design
Concrete mixtures were made using a 0.44 water-to-cementitious ratio in batch
sizes ranging from 1 cubic foot to 3.5 cubic feet. Using the same proportions to make
one cubic yard of concrete (quantity more widely used), the approximate weight of coarse
aggregate would be 1,811 pounds, fine aggregate weight would be 1,237 pounds, and
cementitious material would be 564 pounds.
Mixture Methods and Curing Methods
The concrete was mixed in a 9 cubic foot counter planetary mixer with an energy
cycle of 3 minutes on, 3 minutes off, and a final 2 minutes on before discharging the
concrete. Smaller mixtures of 1 cubic foot were done in an inclined shaft drum mixer as
needed. Cylinders and other testing specimens were cast and cured in accordance with
current standards of practice. Resistivity specimens were wet cured in a curing chamber
from the time mixed until removal for testing. Chloride ion penetration samples were
wet cured for 14 days in water with lime, then removed for dry curing in the laboratory
until tested.
ASTM C1202
Curing and Testing
In accordance with ASTM CI202, concrete cylinders were prepared from
concrete mixtures with various amounts of pozzolanic materials. These cylinders were
wet cured in a curing tank with lime for 14 days before being removed for dry curing and
were tested on the 98 t h day after they were cast. These cylinders, after being wet cured,
12
Mixture Design
Concrete mixtures were made using a 0.44 water-to-cementitious ratio in batch
sizes ranging from I cubic foot to 3.5 cubic feet. Using the same proportions to make
one cubic yard of concrete (quantity more widely used), the approximate weight of coarse
aggregate would be 1,811 pounds, fine aggregate weight would be 1,237 pounds, and
cementitious material would be 564 pounds.
Mixture Methods and Curing Methods
The concrete was mixed in a 9 cubic foot counter planetary mixer with an energy
cycle of 3 minutes on, 3 minutes off, and a tinal 2 minutes on before discharging the
concrete. Smaller mixtures of I cubic foot were done in an inclined shall drum mixer as
needed. Cylinders and other testing specimens were cast and cured in accordance with
current standards of practice. Resistivity specimens were wet cured in a curing chamber
from the time mixed until removal for testing. Chloride ion penetration samples were
wet cured for 14 days in water with lime, then removed for dry curing in the laboratory
until tested.
ASTM C1202
Curing and Testiug
Tn accordance with ASTM C 1202, concrete cylinders were prepared from
concrete mixtures with various amounts of pozzolanic materials. These cylinders were
wet cured in a curing tank with lime for 14 days before being removed for dry curing and
were tested on the 98th day after they were cast. These cylinders, after being wet cured,

13
were sliced using either a lapidary saw or modified tile saw into 2 inch thick by 4 inch
diameter specimens. Once sliced, they were allowed to dry. When dry, epoxy was
applied to the outside diameter of the slice. The specimens were allowed to dry for at
least 1 week before testing. The testing procedures were done in accordance with ASTM
CI202 using a commercially available instrument manufactured for use with the ASTM
CI202 testing method.
The specimens were wet cured for 14 days to allow the cement and pozzolans to
react and to simulate the curing duration that may be applied on structures in the field.
Once removed, they were exposed to laboratory temperatures until the day they were
tested.
Equipment
The testing equipment used for testing was a commercially available instrument
manufactured for use with the ASTM C1202 testing method. This was a complete testing
set up with a power source, testing cells, and all the software needed to collect and
compile the data. The software included a data logger that collected the current and
temperature of the cells, variability to be able to test the specimens at different voltages
and different times, and a report generating system.
Results
The results obtained by using this testing method are in coulombs (Amp*sec),
which is an integration of the current applied over the testing time. This coulomb value
is then reduced according to ASTM CI202 to an equivalent result that would be obtained
--7-" , .. _-.":
13
were sliced using either a lapidary saw or modified tile saw into 2 inch thick by 4 inch
diameter specimens. Once sliced, they were allowed to dry. When dry, epoxy was
applied to the outside diameter of the slice. The specimens were allowed to dry for at
least 1 week before testing. The testing procedures were done in accordance with ASTM
C 1202 using a commercially available instrument manufactured for use with the ASTM
C1202 testing method.
The specimens were wet cured for 14 days to allow the cement and pozzolans to
react and to simulate the curing duration that may be applied on structures in the field.
Once removed, they were exposed to laboratory temperatures until the day they were
tested.
Equipment
The testing equipment used for testing was a commercially available instrument
manufactured for use with the ASTM C 1202 testing method. This was a complete testing
set up with a power source, testing cells, and all the software needed to collect and
compile the data. The software included a data logger that collected the current and
temperature of the cells, variability to be able to test the specimens at different voltages
and different times, and a report generating system.
Results
The results obtained by using this testing method are in coulombs (Amp*sec),
which is an integration of the current applied over the testing time. This coulomb value
is then reduced according to ASTM C1202 to an equivalent result that would be obtained

14
using a specimen diameter of 3.75 inches. The values in ASTM CI202 were established
using 3.75 inch diameter specimens, so in order to compare experimental results with the
standard in ASTM CI202, this correction should be applied.
Wenner Resistivity
Method
Florida Department of Transportation Method FM 5-578
A summary of FM 5-578 (77) is given for completeness. The testing method FM
5-578 requires three 4.0 inch by 8.0 inch specimens meeting ASTM C470 requirements.
All specimens should be moist cured in a moist room (without lime) until the day of
testing. Twenty-four hours after being cast, the cylinder molds are removed and four
marks are placed at 0, 90, 180, and 270 degrees around the circumference of the top of
the cylinder. The cylinders are then placed back in the curing room until the time of
testing, at which time the cylinders are removed. The Wenner resistivity probe, with 1.5
inch probe spacing, is then placed with its handle parallel with the center of the cylinder
at approximately half the height of the cylinder. The operator then waits 3 to 5 seconds
for a stable reading, and then rotates the cylinder to take readings below the 0, 90, 180,
and 270 degree marks. These readings are to be done twice per cylinder. Once this is
completed, the operator moves on to the next cylinder. When readings have been
collected for all three specimens, the readings are averaged to obtain the average
resistivity for the mixture.
14
using a specimen diameter of3.75 inches. The values in ASTM C1202 were established
using 3.75 inch diameter specimens, so in order to compare experimental results with the
standard in ASTM C 1202, this correction should be applied.
Wenner Resistivity
Method
Florida Department o/Transportation Method FM 5-578
A summary ofFM 5-578 (11) is given for completeness. The testing method FM
5-578 requires three 4.0 inch by 8.0 inch specimens meeting ASTM C470 requirements.
All specimens should be moist cured in a moist room (without lime) until the day of
testing. Twenty-four hours after being cast, the cylinder molds are removed and four
marks are placed at 0,90, 180, and 270 degrees around the circumference of the top of
the cylinder. The cylinders are then placed back in the curing room until the time of
testing, at which time the cylinders are removed. The Wenner resistivity probe, with 1.5
inch probe spacing, is then placed with its handle parallel with the center of the cylinder
at approximately half the height of the cylinder. The operator then waits 3 to 5 seconds
for a stable reading, and then rotates the cylinder to take readings below the 0, 90, 180,
and 270 degree marks. These readings are to be done twice per cylinder. Once this is
completed, the operator moves on to the next cylinder. When readings have been
collected for all three specimens, the readings are averaged to obtain the average
resistivity for the mixture.

15
Fig. 3.1—Wenner resistivity probes
Left: Adjustable, Right: Nonadjustable
Testing Method for Data in This Paper
Resistivity readings were done in accordance with the Florida Department of
Transportation (FDOT) testing method (FM 5-578) with the exception of the probe
spacing, number of cylinders cast, and resistivity characterization for permeability. The
data in this report were tested using a probe spacing of 2 inches, instead of 1.5 as
recommended by FDOT; and the number of cylinders cast for testing varied from 2 to 6,
instead of 3 as recommended. The probe spacing could not be changed as it came from
the manufacturer with 2 inch spacing; however, the 2 inch spacing was beneficial as
compared to the 1.5 inch spacing because there is less large aggregate interference with
the longer spacing. Large aggregate interference occurs when the spacing is not more
than 2 times the diameter of the largest aggregate size and with longer spacing there is
less interference. Fig. 3.1 shows the different Wenner probes; on the left is the probe
used by FDOT and on the right is the one used in this study.
15
Testing Method/or Dara in This Paper
Resistivity readings were done in accordance with Ihc Florida Dcpartmcm of
Transportation (FOOT) testing method (FM 5.578) wilh the exception of the probe
spacing, number of cylinders cast, and resistivity characterization for pcnncabi lity. The
data in this report were tested using a probe spacing of2 inches, instead of 1.5 as
recommended by FDOT; and Ihe number of cylinders cast for testing varied from 2 10 6,
instead of 3 as recommended. The probe spacing could not be changed as il came from
Ihe manufacturer with 2 inch spacing; however, the 2 inch spacing was beneficial as
compared to Ihc 1.5 inch spacing because there is less large aggregate interference wi th
the longer spacing. Large aggregate interference occurs when the spacing is not more
than 2 times the diameter of the largest aggregate size and wi th longer spacing there is
Jess in terference. Fig. 3.1 shows the different Wenner probes: on the left is the probe
used by FOOT and on the right is the one used in this study.
Fig. 3. I- Wenner resislh'ily probes
Left: Adjustable, Right: Nonadjustable

16
Curing
Resistivity specimens were cured according to the requirements of FM 5-578,
which were to cast the specimens, cure them in a wet curing room in accordance with
ASTM CI 92 until the day of testing, and remove and test the cylinders. No time duration
between when the specimen is removed and when it should be tested was specified in the
FDOT standard. For this research, the tests were to be completed within 15 minutes of
being removed from the curing room. Only specimens or testing results done in
accordance with this curing method (unless intentionally cured differently) were used for
analysis.
Equipment
The resistivity measuring setup chosen for testing was a commercially available
Wenner resistivity meter with a four probe Wenner device with foam contact points and
spacing of 2 inches, as shown in Fig. 3.1. The setup was chosen due to the ease of use
and it offered several other attachments that could be used for other testing being
performed in the lab by others. Other devices, such as those used by the Florida
Department of Transportation in which the probe spacing can be adjusted, could have
been used, but it is recommended to use the same device for all testing.
Results and Considerations
The results of this testing method are in kOhm*cm and are for a curved concrete
surface unless corrected. In order to reduce the variability of the data, some effects were
kept constant throughout the testing. These effects include using only 4 inch x 8 inch
16
Curing
Resistivity specimens were cured according to the requirements ofFM 5-578,
which were to cast the specimens, cure them in a wet curing room in accordance with
ASTM C 192 until the day of testing, and remove and test the cylinders. No time duration
between when the specimen is removed and when it should be tested was specified in the
FDOT standard. For this research, the tests were to be completed within 15 minutes of
being removed from the curing room. Only specimens or testing results done in
accordance with this curing method (unless intentionally cured differently) were used for
analysis.
Equipment
The resistivity measuring setup chosen for testing was a commercially available
Wenner resistivity meter with a four probe Wenner device with foam contact points and
spacing of 2 inches, as shown in Fig. 3.1. The setup was chosen due to the ease of use
and it offered several other attachments that could be used for other testing being
performed in the lab by others. Other devices, such as those used by the Florida
Department of Transportation in which the probe spacing can be adjusted, could have
been used, but it is recommended to use the same device for all testing.
Results and Considerations
The results of this testing method are in kOhm*cm and are for a curved concrete
surface unless corrected. In order to reduce the variability of the data, some effects were
kept constant throughout the testing. These effects include using only 4 inch x 8 inch

17
cylinders, keeping cylinders in wet cure until day of testing, keeping approximately the
same edge distance with probes, using the same meter, testing within 15 minutes of
removal from wet cure, and not testing with rebar present. In this way, consistent results
could be obtained throughout the mixtures in order to establish a relationship.
17
cylinders, keeping cylinders in wet cure until day of testing, keeping approximately the
same edge distance with probes, using the same meter, testing within 15 minutes of
removal from wet cure, and not testing with rcbar present. In Ihis way, consistent results
could be obtained throughout the mi.>:tures in order 10 establish a relationship.

CHAPTER 4
ACI MANUSCRIPT
Manuscript Introduction
The journal article found in this chapter beginning on the next page has been
submitted to the American Concrete Institute (ACI) Materials Journal for acceptance in
February 2010, and is currently under review for acceptance. It is placed in this chapter
with the exact text in which it was submitted, with the formatting changed slightly to
match the formatting of the thesis. This was done because the manuscript has not been
accepted for publication as of the submission date of the thesis. An earlier version was
submitted to the Transportation Research Board (TRB) for acceptance for publication,
but was not accepted. This was beneficial to the manuscript as peer reviewed comments
were returned with the article. These comments were reviewed and implemented into the
paper to improve its clarity. The ACI Materials Journal is considered to be a better
audience for the content of the manuscript and is more widely known throughout the
world. It is anticipated that the manuscript will be accepted for publication as it has been
peer reviewed and improved through the TRB comments.

19
Manuscript
Abstract
Concrete resistance to the penetration of chloride ions from deicing salts or brine
solutions is an important performance indicator for mixture design specifications. The
AASHTO T277 test can be used for approval of concrete mixture designs as an indicator
of potential long-term behavior, but it is time consuming and not conducive to quality
control or quality assurance (QC/QA) testing of field cured concrete. The Wenner probe
device characterizes the electrical resistance of concrete, which has a role in both the
initiation and propagation of corrosion. Fully developed life cycle analysis models use
both of these components to address life expectancy. This paper demonstrates the
connected physics relationship between these two tests. Using 26 different concrete
mixture designs, the electrical resistivity is correlated with T277 results and predicts the
resistance of concrete to the penetration of chloride ions with less effort and expense.
Introduction
Chloride-based deicing salts are commonly used on bridges and pavements during
winter conditions to improve driving conditions and safety. The diffusion of dissolved
chlorides through the concrete enhances the conditions for the steel reinforcement in
bridge structures and continuously reinforced pavements to oxidize and subsequently
corrode. The corroding steel eventually delaminates the concrete, resulting in the need to
replace bridge decks, substructures, and pavements. Performance-based or high
performance concrete specifications need measures that predict concretes which resist the
intrusion of chloride ions. AASHTO T277 (T277)/ASTM C1202 (2,1) has been used to
19
Manuscript
Abstract
Concrete resistance to the penetration of chloride ions from deicing salts or brine
solutions is an important performance indicator for mixture design specifications. The
AASHTO T277 test can be used for approval of concrete mixture designs as an indicator
of potential long-term behavior, but it is time consuming and not conducive to quality
control or quality assurance (QCIQA) testing of field cured concrete. The Wenner probe
device characterizes the electrical resistance of concrete, which has a role in both the
initiation and propagation of corrosion. Fully developed life cycle analysis models use
both of these components to address life expectancy. This paper demonstrates the
connected physics relationship between these two tests. Using 26 different concrete
mixture designs, the electrical resistivity is correlated with T277 results and predicts the
resistance of concrete to the penetration of chloride ions with less effort and expense.
Introduction
Chloride-based deicing salts are commonly used on bridges and pavements during
winter conditions to improve driving conditions and safety. The diffusion of dissolved
chlorides through the concrete enhances the conditions for the steel reinforcement in
bridge structures and continuously reinforced pavements to oxidize and subsequently
corrode. The corroding steel eventually delaminates the concrete, resulting in the need to
replace bridge decks, substructures, and pavements. Performance-based or high
performance concrete specifications need measures that predict concretes which resist the
intrusion of chloride ions. AASHTO T277 (T277)1 AS TM C 1202 (2,1) has been used to

20
predict concrete resistance to chloride ion penetration. This test is designed to verify
mixture designs in a laboratory, but not for in-situ quality control measures. The T277
test requires a month or more of curing under controlled conditions and more than 24
hours to prepare and perform using vacuum saturation and 60Vdc impressed voltage to
accelerate the chloride ingress. The test provides a relative measure of the resistance of
concrete to the ingress of chloride ions, but not a measure of a fundamental material
property of concrete.
A different approach of evaluating the resistance of concrete to transport chloride
ions can make use of basic physics and material properties. A Wenner four probe device,
by measuring the electrical resistivity of concrete using a fixed electrical current and
voltage measurement, has been used to measure the properties of concrete for potential to
allow for chloride ingress. This class of device reduces the time spent on sample
preparation and testing. It also provides for a scientific measurement of properties that
includes the effects of material quality, mixing, transportation, placement, and curing
found in-situ, rather than laboratory preparation conditions.
Research Significance
Highway agencies and researchers could use the Wenner device to evaluate a
performance measure of mixture designs and in-situ properties of constructed facilities,
when a reliable correlation of these two testing methods existed or a range of application
limitations existed. The durability of concrete structures could be determined more
efficiently and in completed constructions. This could be used for quality assurance in
concrete acceptance criteria.
20
predict concrete resistance to chloride ion penetration. This test is designed to verify
mixture designs in a laboratory, but not for in-situ quality control measures. The T277
test requires a month or more of curing under controlled conditions and more than 24
hours to prepare and perform using vacuum saturation and 60V dc impressed voltage to
accelerate the chloride ingress. The test provides a relative measure of the resistance of
concrete to the ingress of chloride ions, but not a measure of a fundamental material
property of concrete.
A different approach of evaluating the resistance of concrete to transport chloride
ions can make use of basic physics and material properties. A Wenner four probe device,
by measuring the electrical resistivity of concrete using a fixed electrical current and
voltage measurement, has been used to measure the properties of concrete for potential to
allow for chloride ingress. This class of device reduces the time spent on sample
preparation and testing. It also provides for a scientific measurement of properties that
includes the effects of material quality, mixing, transportation, placement, and curing
found in-situ, rather than laboratory preparation conditions.
Research Significance
Highway agencies and researchers could use the Wenner device to evaluate a
performance measure of mixture designs and in-situ properties of constructed facilities,
when a reliable correlation of these two testing methods existed or a range of application
limitations existed. The durability of concrete structures could be determined more
efficiently and in completed constructions. This could be used for quality assurance in
concrete acceptance criteria.

21
Background
The AASHTO T277 method can be modeled as an electrical circuit composed of
a power source and a resistor with a voltage drop across it, as seen in Fig. 4.1. The total
charge in coulomb (amp-sec) passed is considered a relative measure of the resistance to
chloride ingress of the concrete. In addition to time consuming preparation and testing
time, the testing of the specimen can change the pore structure and resistivity of the
specimen (6). The temperature rise in the cells over 6 hours results in a "joule effect"
that eliminates the steady state condition of the test (72). Since low resistive concrete
experiences a substantial temperature rise as compared to highly resistive concrete, the
results are not linearly related but skewed.
The Wenner probe was originally designed to determine soil resistivity in soil
strata, but has been adapted for concrete (4). A current is passed between the two outside
contact probes, and the voltage drop between the two inner contact points is measured as
shown in Fig. 4.2 (7). Results from using the Wenner device are in electrical resistivity
(kQ*cm). Research has been conducted to investigate the effects
Shunt
2" Concrete Specimen
Power Source
Fig. 4.1 - AASHTO T277 test apparatus
21
Background
The AASHTO TI77 method can be modeled as an electrical circuit composed of
a power source and a resistor with a voltage drop across it, as seen in Fig. 4. J, The total
charge in coulomb (amp-sec) passed is considered a relative measure of the resistance to
chloride ingress of the concrete. [n addition 10 time consuming prepanuion and testing
timt', the testing of the specimen can change the pore structure and resistivity of the
specimen (6). The temperature rise in the cells over 6 hours results in a "joule effect"
that eliminates the steady stale condition of the test (12). Since low resistive concrete
experiences a substantial temperature rise as compilrcd to highly resistive concrete, the
resulls are not linearly related but skewed.
The Wenner probe was originally designed to detennine soil resistivity in soi l
strata. but has been adapted for concrete (4). A current is passed between the two outside
contact probes. and the voltage drop between the two inner contact points is measurt.'d as
shown in Fig. 4.2 (7). Results from using the Wenner device are in electrical resistivity
(kO·cm). Research has been conducted to investigate the e IYects
Shunt
Concrete Specimen
Power Source
Fig. 4.1 - AASHTO T277 tes t apparatus

22
<D a a
*<« • a
Current flow lines
CONCRETE
EquipotcntiaJ lines Resistivity (p) = 2na V.
Fig. 4.2 - Wenner meter (7)
of probe spacing and other factors on resistivity readings (7,8,15,14). The Florida
Department of Transportation has developed a method to standardize procedures for
collection of resistivity readings (77).
Investigation into whether the AASHTO T277 testing method can accurately be
used as a method of testing for chloride ion penetration was conducted by Feldman et al.
(6). It was determined that the physical characteristics of the concrete specimens in the
T277 test were changed by the high impressed voltage and vacuum saturation procedure
found in the test, potentially leading to incorrect values. They determined that there was
good correlation between current passed and conductivity (which is the inverse of
resistivity). The data presented in this paper verifies their determination that there is a
good correlation between current passed and conductivity through use of a Wenner
device. Additional research was conducted to investigate all testing methods and the pros
and cons of each method (75) as well as material influence on the T277 test (13).
Equipotential lines
CONCRl:."TE
Re;sisth'iIY (p) - 2111Y I
Fig. 4.2 - Wenner meier (7)
of probe spacing and other f(letors on resistivity readings (7.8./5./4), The Florida
Department ofTmnsportulion has developed a method \0 standardize procedures for
collection of resistivity readings (I I),
Investigation into whether the AASHTO TI77 testing method can accurately be
22
used as a method of testing for chloride ion penetration was conducted by Feldman et a1.
(6), It was detennined that the physical characteristics of the concrele specimens in the
T277 lest were changed by the high impressed voltage and vacuum saturation procedure
found in the lest, potentially leading to incorrect values. They dctcnnined thallhere was
good correlation between current passed and conductivity (which is the inverse of
resistivity). The data presented in this paper verifies their determination that there is a
good cOlTClation between current passed and conductivity through use of a Wenner
device. Additional research was conducted to investigate all testing methods and the pros
and cons of each method (15) as well as material influence on the 1'277 test (13).

23
Research was done on the effect of specimen geometry and probe spacing on
resistivity readings by Morris et al. (9). This research was conducted to correlate
readings from standard strength test cylinders with semi-infinite slabs in order to
indirectly measure concrete characteristics. The experiment involved creating a finite
element model of concrete specimens as well as testing specimens with a Wenner
resistivity device. A correction factor was developed to correlate experimental and
modeled values of resistivity with different probe spacing and specimen shape and size.
This correction factor is called the geometric correction factor.
Experimentation using the Wenner device on 529 sample sets was conducted by
Kessler et al. at the Florida Department of Transportation (10) to investigate whether
resistivity can be used as a quality control measure in place of AASHTO T277. Their
findings indicate that there is a good correlation between AASTHO T277 and resistivity
with the application of the geometric correction factor.
The T277 test involves the application of 60Vdc, which increases the current flow
producing excessive heating of the specimen and changing the pore structure of concrete
over a short period of time. As a resistor (concrete specimen) is heated, the conductivity
of the material increases. Since the AASHTO T277 is a measurement of conductivity in
order to quantify chloride ion ingress, an excessive increase of specimen temperature
during testing results in a higher T277 reading, created by the joule effect. A relationship
between temperature change during testing and final coulomb readings was developed by
Betancourt and Hooton (12) in order to eliminate excessive heating effects of the
specimen during testing. These researchers also state that the joule effect has been a
major obstacle in connecting T277 data and the electrical conductivity. They
Research was done on the effect of specimen geometry and probe spacing on
resistivity readings by Morris et a1. (9). This research was conducted to correlate
readings from standard strength test cylinders with semi-intinite slabs in order to
indirectly measure concrete characteristics. The experiment involved creating a finite
element model of concrete specimens as well as testing specimens with a Wenner
resistivity device. A correction factor was developed to correlate experimental and
modeled values of resistivity with different probe spacing and specimen shapc and size.
This correction factor is called the geometric correction factor.
23
Experimentation using thc Wenner device on 529 sample sets was conducted by
Kessler et a!. at the Florida Department of Transportation (10) to investigate whether
resistivity can be used as a quality control measure in place of AASHTO T277. Their
findings indicate that therc is a good correlation between AASTHO T277 and resistivity
with the application of the geometric correction factor.
The T277 test involves the application of60Vdc, which increases the current flow
producing excessive hcating of the specimcn and changing the pore structure of concrete
over a short period of time. As a resistor (concrete specimen) is heated, the conductivity
of the material incrcases. Since the AASHTO T277 is a measurement of conductivity in
order to quantify chloride ion ingress, an excessive increase of specimen temperature
during testing results in a higher T277 reading, created by the joule effect. A relationship
between temperature change during testing and final coulomb readings was developed by
Betancourt and Hooton (12) in order to eliminate excessive heating effects of the
specimen during testing. These researchers also state that the joule effect has been a
major obstacle in connecting T277 data and the electrical conductivity. They
24
recommended that research should be performed to validate the correlation in these two
testing methods. The data presented in this paper shows the Wenner resistivity data and
AASHTO T277 data are related with consideration of the joule effect.
The purpose of this work is to relate the AASHTO T277 testing results with
results obtained using a Wenner resistivity device by Ohms law. It has been established
that there is a correlation in the testing results based on experimental data. The idea that
a connection exists using Ohms law has been presented (12), but no relationship has been
developed. The main objective is to show that there is a scientific connection between
the two testing results through Ohms law.
Experimental Investigation
Research has been conducted through a pooled-fund study (17) for the Federal
Highway Administration (FHWA) on the durability of 26 different binary and ternary
blends of cement. These blends of ASTM CI 50 Type II cement include pozzolans such
as silica fume (SF), ground granulated blast furnace slag (GGBFS), two types of Class F
fly ash (labeled F and F2), Class C fly ash, and metakaolin. In addition to different types
of pozzolans, different types of cements were used including ASTM C595 Type IP
(portland-pozzolan), and two Type IS (portland blast-furnace slag) cements, and an
ASTM CI 157 GU cement. These abbreviations are used next to percentages of each
mineral admixtures for the remainder of this article (i.e., 75TI/20F2/5M indicates 75%
Type I, 20% F2 fly ash, and 5% metakaolin). The water/cementitious materials ratio for
these mixtures was 0.44. In order to meet the requirements of the study, an air-entraining
24
recommended that research should be performed to validate the correlation in these two
testing methods. The data presented in this paper shows the Wenner resistivity data and
AASHTO T277 data are related with consideration of the joule effect.
The purpose of this work is to relate the AASHTO T277 testing results with
results obtained using a Wenner resistivity device by Ohms law. It has been established
that there is a correlation in the testing results based on experimental data. The idea that
a connection exists using Ohms law has been presented (12), but no relationship has been
developed. The main objective is to show that there is a scientific connection between
the two testing results through Ohms law.
Experimental Investigation
Research has been conducted through a pooled-fund study (17) for the Federal
Highway Administration (FHWA) on the durability of 26 different binary and ternary
blends of cement. These blends of ASTM C 150 Type II cement include pozzolans such
as silica fume (SF), ground granulated blast furnace slag (GGBFS), two types of Class F
fly ash (labeled F and F2), Class C fly ash, and metakaolin. In addition to different types
ofpozzolans, different types of cements were used including ASTM C595 Type IP
(portland-pozzolan), and two Type IS (portland blast-furnace slag) cements, and an
ASTM C1157 GU cement. These abbreviations are used next to percentages of each
mineral admixtures for the remainder of this article (i.e., 75TI/20F2/5M indicates 75%
Type 1, 20% F2 fly ash, and 5% metakaolin). The water/cementitious materials ratio for
these mixtures was 0.44. In order to meet the requirements ofthe study, an air-entraining

25
Table 4.1 - Drying time effect on resistivity for 65TI/30F/5SF
Drying time (min) Resistivity (kQ*cm) Difference vs. 5 min. 5 55.25 0%
35 63.25 14% 55 68.75 24%
admixture and water reducer were used in all the mixtures. The aggregates used had a
maximum nominal diameter of 19 mm (3/4 inch).
As part of this study, resistivity and AASHTO T277 readings have been obtained.
To determine the relationship between the T277 test results and results obtained using the
Wenner device, samples were prepared according to the T277 method and tested at 98-
days (± 1 day). The specimens were tested at 98-days to capture the effects of the
pozzolans that generally contribute to concrete resistivity after 28-days. The T277
specimens were wet cured in lime water for 14 days after being cast, then were dry cured
under laboratory conditions until being tested. Specimen temperatures at the beginning
of testing were kept constant between the two testing methods to avoid thermal
interference outside of the joule effect.
Cylinders for resistivity measurements were cast and placed in a wet curing room
in accordance with ASTM CI92. They were removed from the plastic cylinders at 2 days
and were wet cured until 98-day (± 1 day) readings were taken. An evaluation of the
effect of saturation on resistivity readings was performed. Two cylinders from one
mixture (65TI/30F/5SF) were left out and tested at 5 minutes, 35 minutes, and 55 minutes
after being removed from wet cure with the results shown in Table 4.1. This was done to
study the effects that standardization of testing would have on the resistivity readings.
25
admixture and water reducer were used in all the mixtures. The aggregates used had a
maximum nominal diameter of 19 mm (3/4 inch).
As part of this study, resistivity and AASHTO T277 readings have been obtained.
To determine the relationship between the T277 test results and results obtained using the
Wenner device, samples were prepared according to the T277 method and tested at 98-
days (± 1 day). The specimens were tested at 98-days to capture the effects of the
pozzolans that generally contribute to concrete resistivity after 28-days. The T277
specimens were wet cured in lime water for 14 days after being cast, then were dry cured
under laboratory conditions until being tested. Specimen temperatures at the beginning
of testing were kept constant between the two testing methods to avoid thermal
interference outside of the joule effect.
Cylinders for resistivity measurements were cast and placed in a wet curing room
in accordance with ASTM C192. They were removed from the plastic cylinders at 2 days
and were wet cured until 98-day (± 1 day) readings were taken. An evaluation of the
effect of saturation on resistivity readings was performed. Two cylinders from one
mixture (65TII30F/5SF) were left out and tested at 5 minutes, 35 minutes, and 55 minutes
after being removed from wet cure with the results shown in Table 4.1. This was done to
study the effects that standardization of testing would have on the resistivity readings.
Table 4.1 - Drying time effect on resistivity for 6STI/30F/SSF
Drying time (min) Resistivity (kO*cm) Difference vs. 5 min. 5 55.25 0%
35 63.25 14% 55 68.75 24%

26
Analytical Development
It is necessary to determine the resistivity from the AASHTO T277 data in order
to compare with the results obtained using the Wenner device. These testing methods are
related by Ohms law, shown in Equation (1), which relates voltage (V), current (I), and
resistance (R) in an electrical circuit. To validate the Wenner device readings for
concrete, data was collected experimentally in the lab and compared to the theoretical
resistivity computed using the relationship in Equation (1) and AASHTO T277 readings.
The AASHTO T277 test can be modeled as an electrical circuit consisting of a
power source, steady voltage drop, and a resistor. The basic equation for electrical
resistivity is Equation (2) and is calculated by rearranging the Ohms law equation in
Equation (1). The resistivity (p) of the specimen used in T277 can be determined using
Equation (3) by substituting the resistance into Equation (2). The units of resistivity are
expressed as k'Q*cm (k£2*in). The T277 test has a constant voltage drop (60 Vdc) across
the resistor, a measured current value and time interval, and the dimensions of the
specimen are also known, so resistivity can be directly calculated. In this way, the data
from the AASHTO T277 method can be theoretically compared to data obtained using
the Wenner device.
i-v-R
(1)
p = R Area
(2) Thickness
26
Analytical Development
It is necessary to determine the resistivity from the AASHTO T277 data in order
to compare with the results obtained using the Wenner device. These testing methods are
related by Ohms law, shown in Equation (1), which relates voltage (V), current (I), and
resistance (R) in an electrical circuit. To validate the Wenner device readings for
concrete, data was collected experimentally in the lab and compared to the theoretical
resistivity computed using the relationship in Equation (1) and AASHTO T277 readings.
1= V R
(1)
The AASHTO T277 test can be modeled as an electrical circuit consisting of a
power source, steady voltage drop, and a resistor. The basic equation for electrical
resistivity is Equation (2) and is calculated by rearranging the Ohms law equation in
Equation (1). The resistivity (p) of the specimen used in T277 can be determined using
Equation (3) by substituting the resistance into Equation (2). The units of resistivity are
expressed as kI2*cm (kO*in). The T277 test has a constant voltage drop (60 Vdc) across
the resistor, a measured current value and time interval, and the dimensions of the
specimen are also known, so resistivity can be directly calculated. In this way, the data
from the AASHTO T277 method can be theoretically compared to data obtained using
the Wenner device.
p = R* Area Thickness
(2)

27
V x Area (3) P = I x Thickness
The converted coulomb value was then calculated using Equation (3) and the
experimental resistivity data collected using the Wenner device. In Equation (3),
coulombs were determined by solving for the current (I), then multiplying the current
value by the T277 testing time (6 hours = 21,600 seconds). The resulting value is the
theoretical coulomb value calculated using the Wenner resistivity device readings.
The Wenner technique uses a series of four probes connected to a power source.
The spacing of the probes is constant (a=5.1 cm [2 inches]), a known current is passed
between the two outer probes, and the resulting voltage drop across the two inner probes
is measured. A diagram of this arrangement is shown in Fig. 4.2. The equation for
determining the resistivity using the Wenner device is shown in Equation (4),
where "a " is the distance between probes.
Current is not one dimensional; it is a three-dimensional field. When resistivity is
measured on a round cylinder using the Wenner meter, the current is restrained within the
concrete and interference is caused by the concrete and air interface. Resistivity readings
from a semi-infinite flat slab represent the standard for resistivity of the material, whereas
the resistivity from the curved cylinder has interference from the edge of the cylinder. In
order to account for this interference, the data needed to be converted into an equivalent
P = 2*71* a* — I
(4)
27
Vx Area p=
1 x Thickness (3)
The converted coulomb value was then calculated using Equation (3) and the
experimental resistivity data collected using the Wenner device. In Equation (3),
coulombs were determined by solving for the current (I), then multiplying the current
value by the T277 testing time (6 hours = 21,600 seconds). The resulting value is the
theoretical coulomb value calculated using the Wenner resistivity device readings.
The Wenner technique uses a series of four probes connected to a power source.
The spacing of the probes is constant (a=5.1 cm [2 inches)), a known current is passed
between the two outer probes, and the resulting voltage drop across the two inner probes
is measured. A diagram of this arrangement is shown in Fig. 4.2. The equation for
determining the resistivity using the Wenner device is shown in Equation (4),
V p=2*;rr*a*-
1
where "a" is the distance between probes.
(4)
Current is not one dimensional; it is a three-dimensional field. When resistivity is
measured on a round cylinder using the Wenner meter, the current is restrained within the
concrete and interference is caused by the concrete and air interface. Resistivity readings
from a semi-infinite flat slab represent the standard for resistivity of the material, whereas
the resistivity from the curved cylinder has interference from the edge of the cylinder. In
order to account for this interference, the data needed to be converted into an equivalent

28
semi-infinite slab resistivity where there are no curvature effects. This was accomplished
with a geometric correction factor (K). This correction factor was first established by
Morris et al. (9) and was verified by independent testing for 10 cm by 20 cm (4 inch x 8
inch) cylinders for this study. The values obtained by using the Wenner device should be
divided by the proper correction factor as in Equation (5) (9), which was determined to be
K = 2.7 for 5.1 cm (2 inch) probe spacing and 10 cm by 20 cm (4 inch x 8 inch) cylinder.
This correction factor was used to determine the adjusted resistivity reading values shown
in Table 4.2. The geometric correction factor is applied equally to all 10 cm by 20 cm (4
inch x 8 inch) cylinders used in this test. The Florida Department of Transportation (13)
used this to develop the limits for the FDOT resistivity testing method (77).
Preal ~ Pmeasured / K (5)
The joule effect was considered to account for heating of the specimens during
AASHTO T277 testing. This heating of the specimens may result in incorrect
permeability results. A relationship was developed by Betancourt and Hooton (12) to
account for specimen heating during testing. The equation developed is Equation (6),
where Q 0 is the total corrected charge, Qc,6h is the measured charge obtained from
AASHTO T277 corrected for specimen diameter, p is an experimental constant equal to
1245, and 5T is the temperature rise during testing (in Kelvin). The results of using
Equation (6) are different for every mixture and vary depending on the amount of joule
28
semi-infinite slab resistivity where there are no curvature effects. This was accomplished
with a geometric correction factor (K). This correction factor was first established by
Morris et al. (9) and was verified by independent testing for 10 cm by 20 cm (4 inch x 8
inch) cylinders for this study. The values obtained by using the Wenner device should be
divided by the proper correction factor as in Equation (5) (9), which was determined to be
K = 2.7 for 5.1 cm (2 inch) probe spacing and 10 cm by 20 cm (4 inch x 8 inch) cylinder.
This correction factor was used to determine the adjusted resistivity reading values shown
in Table 4.2. The geometric correction factor is applied equally to all 10 cm by 20 cm (4
inch x 8 inch) cylinders used in this test. The Florida Department of Transportation (13)
used this to develop the limits for the FDOT resistivity testing method (11).
Prcal = Pmeasurcd / K (5)
The joule effect was considered to account for heating of the specimens during
AASHTO T277 testing. This heating of the specimens may result in incorrect
permeability results. A relationship was developed by Betancourt and Hooton (12) to
account for specimen heating during testing. The equation developed is Equation (6),
where Qo is the total corrected charge, Qc,6h is the measured charge obtained from
AASHTO T277 corrected for specimen diameter, P is an experimental constant equal to
1245, and 8T is the temperature rise during testing (in Kelvin). The results of using
Equation (6) are different for every mixture and vary depending on the amount of joule

29
Table 4.2 - Wenner resistivity conversions to coulomb
Wenner Method
Mixture Measured
Resistivity (p) Geometric K Factor
Geometric Adjusted
Resistivity (GAR)
Calculated Coulombs from GAR
kft*cm (kft*in) kQ*cm (kQ*m) Coulombs 75TI/20F/5M 28.7(11.3) 2.7 10.6 (4.2) 1711 60TI/30F/10F2 8.4 (3.3) 2.7 3.1 (1.2) 5857 60TI/20F2/20G120S 42.4(16.7) 2.7 15.7 (6.2) 1158 75TI/20F2/5M 42.6(16.8) 2.7 15.8(6.2) 1152 67TI/30F2/3SF 36.3 (14.3) 2.7 13.4 (5.3) 1352 60TI/20F/20F2 14.8(5.8) 2.7 5.5 (2.2) 3328 100TIP 20.5 (8.1) 2.7 7.6 (3.0) 2394 60TI/30F2/10C 17.0 (6.7) 2.7 6.3 (2.5) 2887 75TISM/25C 18.7 (7.3) 2.7 6.9 (2.7) 2630 75TISM/25F2 30.6(12.1) 2.7 11.3 (4.5) 1603 97TISM/3SF 49.3 (19.4) 2.7 18.2 (7.2) 997 75TI/20F/5SF 36.4(14.3) 2.7 13.5 (5.3) 1349 100TI 17.9 (7.0) 2.7 6.6 (2.6) 2746 65TI/30F2/5SF 64.0 (25.2) 2.7 23.7(9.3) 767 65TIP/35G120S 73.8 (29.0) 2.7 27.3 (10.8) 666 60TI/20F/20G120S 36.3 (14.3) 2.7 13.4 (5.3) 1354 100E 16.7 (6.6) 2.7 6.2 (2.4) 2938 80E/20G120S 29.8(11.7) 2.7 11.0 (4.3) 1650 95E5SF 46.0(18.1) 2.7 17.0 (6.7) 1068 62TI/35G120S/3SF 62.8 (24.7) 2.7 23.3 (9.2) 782 60TI/35G120S/5M 65.1 (25.6) 2.7 24.1 (9.5) 754 75TI/20F2/5SF 65.6 (25.8) 2.7 24.3 (9.6) 748 77TI/20F2/3SF 42.4(16.7) 2.7 15.7(6.2) 1158 65TISM/35G120S 39.2(15.4) 2.7 14.5(5.7) 1253 50TI/35G120S/15SF 47.2(18.6) 2.7 17.5 (6.9) 1040 85TIP/15F 25.8(10.2) 2.7 9.6 (3.8) 1902
Note: 75TI/20F/5M = 75% Type I cement, 20% Class F fly ash, 5% metakaolin
Table 4.2 - Wenller resistivity conversions to cou lomb
Mixture Measured
Resistivi ty (p) Geometric K Factor
Adjusted Coulombs
from GAR
29

30
A relationship may be established by comparing values determined from the same
concrete mixture using the AASHTO T277 method with Equation (3) and the Wenner
Technique with Equation (4). However, these relationships must be normalized to a
uniform ambient condition. With the application of both the geometric correction and the
adjustment for the joule effect, the results can be analytically combined as an evaluation
tool for concrete. The results can be completed quickly and with less effort using the
Wenner device to determine the chloride ion ingress into concrete. The testing procedure
using the Wenner device requires approximately 30 minutes for completion, as compared
to over 24 hours for the AASHTO T277 method. A comparison of the two testing
methods is presented in Fig. 4.3 through Fig. 4.9 for both corrected and uncorrected
resistivity.
effect adjustment required. For mixtures with higher permeability (higher coulomb,
lower resistivity), larger heating variations occur during testing as compared with low
permeability mixtures. This is due to larger currents passing through the interconnected
voids. For these permeable mixtures, larger temperature variations produce larger joule
effect adjustments. The joule effect adjustment was used to determine the adjusted T277
coulomb values shown in Table 4.3.
Q _eMQc,6h)+lH\i6T-\im)} ^
30
effect adjustment required. For mixtures with higher permeability (higher coulomb,
lower resistivity), larger heating variations occur during testing as compared with low
permeability mixtures. This is due to larger currents passing through the interconnected
voids. For these permeable mixtures, larger temperature variations produce larger joule
effect adjustments. The joule effect adjustment was used to determine the adjusted T277
coulomb values shown in Table 4.3 .
..
(6)
A relationship may be established by comparing values determined from the same
concrete mixture using the AASHTO T277 method with Equation (3) and the Wenner
Technique with Equation (4). However, these relationships must be normalized to a
uniform ambient condition. With the application of both the geometric correction and the
adjustment for the joule effect, the results can be analytically combined as an evaluation
tool for concrete. The results can be completed quickly and with less effort using the
Wenner device to determine the chloride ion ingress into concrete. The testing procedure
using the Wenner device requires approximately 30 minutes for completion, as compared
to over 24 hours for the AASHTO T277 method. A comparison of the two testing
methods is presented in Fig. 4.3 through Fig. 4.9 for both corrected and uncorrected
resistivity.

Table 4.3 - AASHTO T277 conversions to resistivity
AASHTO T277
Mixture Raw Average
T277 Data Joule Effect
Adjusted T277 Calculated Resistivity
from T277 (p) Coulomb Coulomb k£2*cm (kI2*in)
75TI/20F/5M 1621 1369 13.3 (5.2) 60TI/30F/10F2 6786 3871 4.7(1.8) 60TI/20F2/20G120S 2316 1804 10.1 (4.0) 75TI/20F2/5M 2363 1877 9.7 (3.8) 67TI/30F2/3SF 1987 1611 11.3 (4.4) 60TI/20F/20F2 5490 3431 5.3 (2.1) 100TIP 4023 2715 6.7 (2.6) 60TI/30F2/10C 6137 3558 5.1 (2.0) 75TISM/25C 4023 2725 6.7 (2.6) 75TISM/25F2 3032 2173 8.4 (3.3) 97TISM/3SF 935 845 21.5 (8.5) 75TI/20F/5SF 1163 1032 17.6 (6.9) 100TI 4562 3068 5.9 (2.3) 65TI/30F2/5SF 1512 1308 13.9 (5.5) 65TIP/35G120S 1176 1040 17.5 (6.9) 60TI/20F/20G120S 2000 1709 10.6 (4.2) 100E 5890 3649 5.0 (2.0) 80E/20G120S 1970 1703 10.7(4.2) 95E5SF 1656 1415 12.9 (5.1) 62TI/35G120S/3SF 984 872 20.9 (8.2) 60TI/35G120S/5M 698 627 29.0(11.4) 75TI/20F2/5SF 1230 1071 17.0 (6.7) 77TI/20F2/3SF 1900 1555 11.7 (4.6) 65TTSM/35G120S 1568 1318 13.8(5.4) 50TI/35G120S/15SF 1437 1216 15.0(5.9) 85TIP/15F 3634 2555 7.1 (2.8)
Note: 75TI/20F/5M = 75% Type I cement, 20% Class F fly ash, 5% metakaolin
31
Table 4.3 - AASHTO T277 con\'crsions 10 resistivity
Mixture
. Ii

32
T277 Coulomb vs. Theoretical Coulomb from Resistivity
> • Raw Adjus ted — — Raw Adjus ted
vit
10000 st
i 10000 R
esi * ""
fro
m 1
ib)
1000
Coulo
mb
(Coulo
ir 1000
to 100
tit 100
jore
100 1000 10000
Th<
AASHTO T277 Reading (Coulomb)
Fig. 4.3 - Raw coulomb and adjusted coulomb (joule effect and geometric
correction)
Results
Resistivity and AASHTO T277
In order to verify a relationship using Ohms law, three different ways of analyzing
the data needed to be investigated. The first type of analysis done was to calculate
equivalent coulomb values from resistivity data and compare it to the T277 coulomb data.
The second method was to calculate equivalent resistivity from T277 data to compare
with the Wenner resistivity data. The third type of analysis done was to compare T277
coulomb data and Wenner resistivity data.
To develop a relationship between the AASHTO T277 test and resistivity, data
was collected and shown in Fig. 4.3 through Fig. 4.9. Each data point represents average
values of resistivity with 8 readings per cylinder and an average of 2 cylinders per
T277 Coulomb vs. Theoretical Coulomb from Resistivity
~ .;; 10000 .~
'iii Qj a: E 0_ ... ..c
:;:; E 1000 E..5!
..5! g ::l U 0-U
n:I u 100
• Raw ., Adjusted - - Raw - Adjusted
...•..... ~ .... ' ...
..... ,' ... ........
......
.....................
32
.~ o Qj .c I-
100 1000 10000
AASHTO T277 Reading (Coulomb)
Fig. 4.3 - Raw coulomb and adjusted coulomb Goule effect and geometric
correction)
Results
Resistivity and AASHTO T277
In order to verify a relationship using Ohms law, three different ways of analyzing
the data needed to be investigated. The first type of analysis done was to calculate
equivalent coulomb values from resistivity data and compare it to the T277 coulomb data.
The second method was to calculate equivalent resistivity from T277 data to compare
with the Wenner resistivity data. The third type of analysis done was to compare T277
coulomb data and Wenner resistivity data.
To develop a relationship between the AASHTO T277 test and resistivity, data
was collected and shown in Fig. 4.3 through Fig. 4.9. Each data point represents average
values ofresistivity with 8 readings per cylinder and an average of2 cylinders per

33
T277 Coulomb vs. Theoretical Coulomb from Resistivity - Joule Effect Adjustment -
~ * Raw Ad jus ted — — Raw Ad jus ted
10000
AASHTO T277 Reading (Coulomb)
Fig. 4.4 - Raw coulomb and adjusted T277 coulomb (joule effect)
mixture, and 2 to 6 specimens for AASHTO T277. By comparing coulomb values from
T277 with calculated coulomb from resistivity as in Fig. 4.3 through Fig. 4.5 and Table
4.2, it can be seen that there is a strong need for using the joule effect adjustment and
geometric correction factor to relate these two testing methods through Ohms law. The
closer the line is to a 1:1 relationship, the better the relationship is between these two
methods using Ohms law. Fig. 4.3 shows the adjusted (including joule effect and
geometric correction factor) and raw (no adjustment) coulomb relationship. The
correlation is near the 1:1 relationship with the adjustments. To understand how each of
these corrections affects the data, they are plotted separately in Fig. 4.4 and Fig. 4.5,
keeping the joule effect adjustment or geometric correction unchanged for each plot. The
trend in Fig. 4.4 is due to the excessive heating of the specimens caused by high
permeability mixtures. As can be seen, both adjustments are made to account for most of
the differences in the coulomb relationship for Ohms law for these two testing methods.
T277 Coulomb vs, Theoretical Coulomb from Resistivity - Joule Effect Adjustment-
• Row • Adjusted - - Raw - Adjusted
")000 • •
)000
)00
) 00 )000
AASHTO nn Reading (Coulomb)
Fig, 4.4 - Raw coulomb and adjusted T277 coulomb (joule effect)
33
)0000
mixture. and 2 to 6 specimens for AASHTO 1'277. By comparing coulomb values from
1'277 with calculated coulomb from resistivity as in Fig. 4.3 through Fig. 4.5 and Table
4.2, it can be seen that there is a strong need for using the joulc effeci adjustment and
geometric correction factor to relate these two testing mcthods through Ohms law. The
closer the line is 10 a I: I relationship, the bellcr thc relationship is between these two
methods using Ohms law. Fig. 4.3 shows the adjusled (including joule effect and
geometric correction factor) and raw (no adjustment) coulomb relationship. The
correlation is near the I: I relationship with the adjustments. To understand how each of
these corrections afTects the data, they are plotted separately in Fig. 4.4 and Fig. 4.5,
keeping the joule effect adjustment or geometric correction unchanged for each plot. The
trend in Fig. 4.4 is due to the excessive heating of the specimens caused by high
penneabili lY mixtures. As can be seen, both adjustments arc made to account for most of
the differences in the coulomb relationship fo r Ohms law for these two testing methods.

34
T277 Coulomb vs. Theoretical Coulomb from Resistivity - Geometric Correction -
Raw Ad jus ted — — Raw Ad jus ted
cc E o —. -Q | E I u
10000
1000
100
100 1000
AASHTO T277 Reading (Coulomb)
10000
Fig. 4.5 - Raw coulomb and adjusted (geometric correction) coulomb obtained from
resistivity (Wenner meter)
The same trend is observed as in the coulomb comparisons for calculated
resistivity in Fig. 4.6 through Fig. 4.8 and Table 4.3. Similar to the coulomb
comparisons, either the joule effect adjusted values or the geometric corrected values are
kept the same for each plot to observe the effect of the adjustment. With the adjustments,
it is observed that the relationship is much closer to a 1:1 relationship than without these
corrections. Two sets of data are presented in Fig. 4.7 with the geometrically adjusted
resistivity remaining unchanged, one showing the T277 raw data converted to resistivity
and the other showing the joule effect factored into the calculations for T277 data. With
the joule effect adjustment, the relationship between the calculated resistivity from T277
and the experimentally determined resistivity is closer to a 1:1 relationship, as would be
expected with Ohms law. Fig. 4.8 shows the effects of varying the geometric correction
f T277 Coulomb VS. Theoretical Coulomb from Resistivity
. Geometric Correction·
• Raw • Adjusted - - Raw - Adjusted
1()()()() •
1000
AASHTO T277 Reading (Coutomb)
34
1()()()()
Fig. 4.5 - Raw coulomb and adjusted (geometric correction) coulomb obt ained from
resistivi ty (Wenner meter)
The same trend is observed as in the coulomb comparisons ror calculated
resistivity in Fig. 4.6 through Fig. 4.8 and Table 4.3. Similar to the coulomb
comparisons, either the joule efTect adjusted values or the geometric corrected values are
kept the same ror each plot to observe the efTect orthe adjustment. With the adjustments.
it is observed that the relationsh ip is much closer to a 1:1 relationship than wi thout these
corrections. Two sets or data are presented in Fig. 4.7 with the geometrically adjusted
resistivity remaining unchanged, one showing the T277 raw data convened to resistivity
lInd the other showing the joule efTeet ractored into the calculmions for TI77 data. With
the joule efTect adjustment. the relationship between the calculated resistivity from TI77
and the experimentally detennined resistivity is closer to a I: I relationship. as would be
expected with Ohms law. Fig. 4.8 shows the efTt."Cts of varying the geometric correction
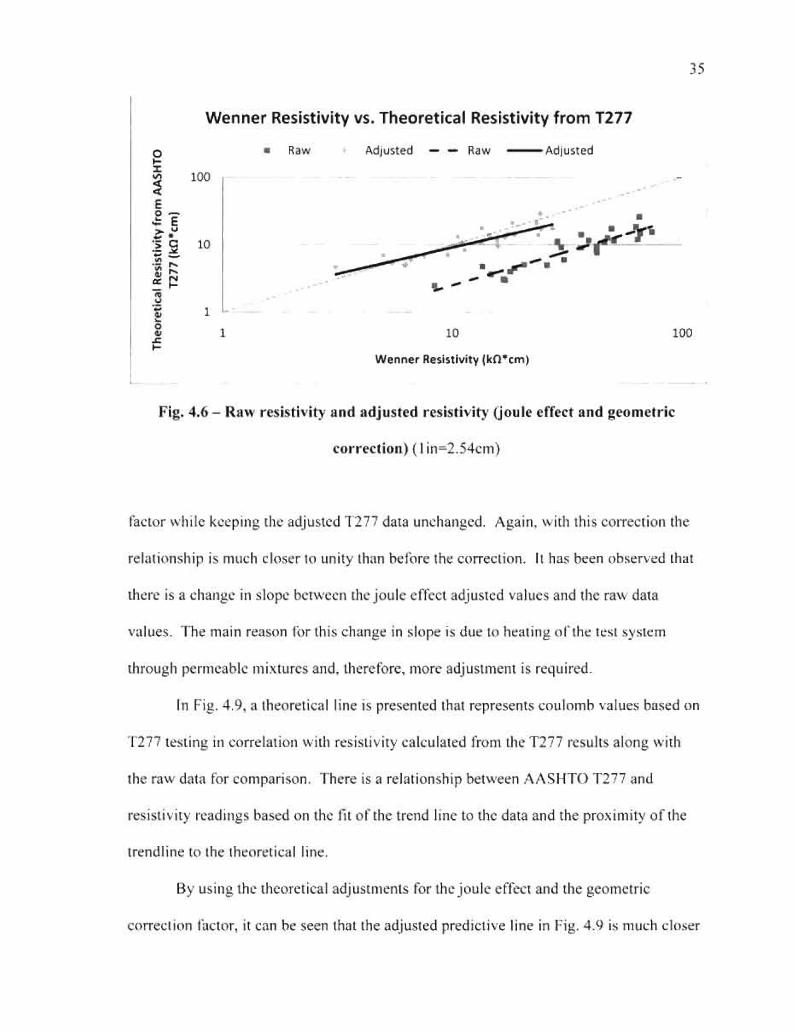
35
Wenner Resistivity vs. Theoretical Resistivity from T277
O • Raw Adjus ted — — Raw Adjus ted i-
| 1 0 0 ______ E
S i 10 100
Wenner Resistivity (kQ*cm)
Fig. 4.6 - Raw resistivity and adjusted resistivity (joule effect and geometric
correction) (lin=2.54cm)
factor while keeping the adjusted T277 data unchanged. Again, with this correction the
relationship is much closer to unity than before the correction. It has been observed that
there is a change in slope between the joule effect adjusted values and the raw data
values. The main reason for this change in slope is due to heating of the test system
through permeable mixtures and, therefore, more adjustment is required.
In Fig. 4.9, a theoretical line is presented that represents coulomb values based on
T277 testing in correlation with resistivity calculated from the T277 results along with
the raw data for comparison. There is a relationship between AASHTO T277 and
resistivity readings based on the fit of the trend line to the data and the proximity of the
trendline to the theoretical line.
By using the theoretical adjustments for the joule effect and the geometric
correction factor, it can be seen that the adjusted predictive line in Fig. 4.9 is much closer
Wenner Resistivity vs. Theoretical Resistivity from T277
• Raw
100
10
Adjusted - - Raw - Adjusted
• •
•
• ... ;,. . i;,r~ . ". ...... --. • .. -Wenner Reslsttvity (kO"cm)
35
100
Fig. 4.6 - Raw resist ivity and adjusted resistivity (joule effect and geomctric
correction) (I in=2.S4cm)
factor while keeping the adjusted T277 data unchanged. Again, with this correction the
relationship is much closer to unity than before the correction. It has been observed that
there is a change in slope between the joule effect adjusted values and the raw data
values. The main reason for this change in slope is due to heating of the lest system
through penneable mixtures and, therefore, more adjustment is required.
In Fig. 4.9, a theoretical line is presented that represents coulomb values based on
T277 testing in correlation with resistivi ty calculated from the TI77 results along with
the raw data for comparison. There is a re la tionship between AASHTO 1'211 and
resistivity readings based on the fit o f the trend line to the data and the proximity of the
trendline to the theoretical line.
By using the theoretical adjustments for the j oule effect and the geometric
correction factor, it can be sccn that the adjusted predictive line in Fig. 4.9 is much closer

36
Wenner Resistivity vs. Theoretical Resistivity from T277 - Joule Effect Adjustment -
o i-S • Raw Ad jus ted — — Raw Ad jus ted
| l 10 100
Wenner Resistivity (kO*cm)
Fig. 4.7 - Adjusted resistivity (joule effect) calculated from T277 data (lin=2.54cm)
to the theoretical values obtained from AASHTO T277. There still exists a variance
between the theoretical and adjusted values; however, this can be explained by looking at
surface resistivity vs. concrete resistivity. Surface resistivity is determined by the
Wenner device and only determines the resistivity a small distance into the concrete (up
to a depth equal to the probe spacing). Concrete conductivity is determined through the
AASHTO T277 test over the entire depth of the specimen. The difference between the
theoretical and empirical readings is due to the presence of more paste at the surface of
the concrete, which has a different resistivity than the center of the concrete where less
paste exists.
Variation in Relationship
To understand how closely the adjusted equation shown in Fig. 4.9 is to the
theoretical equation, an investigation into the percent variation between the results of
Wenner Resistivity vs. Theoretical Resistivity from T211 • Joule Effect Adjustment·
• Raw
100
1
1
• Adju~ted - - Raw - Adjusted
-:0<-- _-. .. -Wenner Resl$tlvlty (kClO t m)
36
100
Fig. 4.7 - Adjusted resistivity (joule effect) calcu la ted from T277 data (I in: 2.54cm)
to Ihe theoretical values obtained from AASHTO T277. There still cxists a variance
betwecnthe theoretical and adjustcd values; however. this can be explained by looking at
surface resislivilY vs. concrete resistivity. Surface resistivity is delemlined by the
Wenner device and only detennines Ihe resistivity a small distance inlO the concrele (up
to a deplh equal to Ihe probe spacing). Concrete conductivity is detemlined through the
AASHTO TI77 test oller the enti re depth of the specimen. The difference between the
theoretical and empirical readings is due to the presence of more paste at the surface of
the concrete, which has a different resistivi ty than the center of the concrete where less
paste cxists.
Varia/iOIl i/l ReJatiollSlrip
To understand how closcly the adjustcd equation shown in Fig. 4.9 is to the
theoretical equation, an investigation into the percent variation betwcen the results of

37
Wenner Resistivity vs. Theoretical Resistivity from T277 - Geometric Correction -
o _ t o
I Raw Ad jus ted — — Raw Adjus ted
E 100
10
1
• •
o 1 10 100
Wenner Resistivity (kQ*cm)
Fig. 4.8 - Raw resistivity and adjusted (geometric correction) Wenner resistivity
(lin=2.54cm)
each equation was performed. Fig. 4.10 shows the same equations and relationship as
Fig. 4.9, but with the variation limits shown in a variation triangle. The top of the
triangle shows where there is no variation (where the two equations are equal) and the
first row from the top shows where the results of each equation vary by approximately
5% (to the right of the vertical line, the adjusted equation overestimates the coulomb
value by 5% and to the left it underestimates by 5% from the theoretical value). Larger
variations are observed in dense, low permeable concrete, but smaller with higher
permeable concrete. This provides greater confidence in values of greatest concern.
Summary and Conclusions
In order to use chloride ion penetration as part of a durability acceptance criterion,
an effective and simpler means of testing concrete other than the AASHTO T277 test
Wenner Resistivity vs. Theoretical Resistivity from T277 - Geometric Correction -
• 'ow • Adjuned - - Raw -Adju~led
100
~
37
10
~ . ~
• ~-= • -~r----=-'-- -. " .-- -. '!.- -- ~
• • •
1
1 10 "'0 Wenner Resln lvlty IkO' cm)
Fig. 4.8 - Raw resisth'ity and adjusted (geometric correction) Wenner resisti\'ity
(I in=2.54cm)
each equation was pcrfonned. Fig. 4.10 shows the same equations and relationship as
Fig. 4.9. but with the variation limits shown in a varia tion triangle. The top of the
triangle shows where then,- is no variation (where the two equations are equal) and the
fi rst row from the top shows where the results of each equation vary by approximately
5% (to the right of the vertical line, the adjusted equation overestimates the coulomb
value by 5% and to the left it underestimates by 5% from the theoretical value). Larger
variations arc observed in dense. low penneable concrete. but smaller with higher
penneablc concrete. This provides greater confidence in values of greatest concern.
Su mmary and Coneiusions
In order to usc chloride ion penetration as part of a durability acceptance criterion,
an effectivc and simpler means of testing concrete other than the AASHTQ T277 test

38
Wenner Resistivity vs. T277 Coulomb
Theoret ica l • Raw Ad jus ted — — Theoret ica l Raw Ad jus ted
_T 10000 E _o 3 O M .= 1000 •o ra <u cc 1̂
o I— X
CO i
100
Adjus ted
y = 12120x 0 - 7 8 5
R 2 = 0.7987
*"••• . _ • mm , m
Theoret ica l • y = 18179X"1
R 2 = 1
10
Wenner Resistivity (kn*cm)
100
Fig. 4.9 - Wenner resistivity vs. AASHTO T277 coulomb (lin=2.54cm)
needs to be used. Through this research and work performed by other researchers, it has
been observed that there is a correlation between AASHTO T277 and resistivity using a
Wenner four probe device. The AASHTO T277 6-hour testing results and results
obtained using a Wenner resistivity meter can be related through Ohms law for blended
and unblended cement concrete mixtures. This is particularly true for mixtures with
higher permeability.
Through the results of this research, it is possible to obtain resistivity
measurements from a 10 cm by 20 cm (4 inch by 8 inch) cylinder and compare them to
theoretical resistivity data obtained by using AASHTO T277. This can be done by using
adjustments for cylinder geometry for resistivity and the joule effect during testing for
T277. These adjustment factors were verified through independent testing. It is possible
to obtain correlations for ternary mixture, binary mixture, and unblended cement
concretes through the use of these factors.
38
Wenner Resistivity vs. T277 Coulomb
Theoretical - Raw Adjusted - - Theoretical···· .. • Raw - Adjusted
:c 10000 E o "3 o ~ tIO .= 'tl III QI a:: ..... ..... ~ ~ J:
~
1000
100
1
Adjusted y = 12120x-O.785
R2 = 0.7987
Tneoretical y = 18179x-1
R2 = 1
". •••••••
• "'11.. • ....... ~·· .. I
___ n .if .. : .... J .• ..... "";...... .
10
Wenner Resistivity (kO*cm)
Fig. 4.9 - Wenner resistivity vs. AASHTO T277 coulomb (lin=2.54cm)
100
needs to be used. Through this research and work performed by other researchers, it has
been observed that there is a correlation between AASHTO T277 and resistivity using a
Wenner four probe device. The AASHTO T277 6-hour testing results and results
obtained using a Wenner resistivity meter can be related through Ohms law for blended
and unblended cement concrete mixtures. This is particularly true for mixtures with
higher permeability.
Through the results of this research, it is possible to obtain resistivity
measurements from a 10 cm by 20 cm (4 inch by 8 inch) cylinder and compare them to
theoretical resistivity data obtained by using AASHTO T277. This can be done by using
adjustments for cylinder geometry for resistivity and the joule effect during testing for
T277. These adjustment factors were verified through independent testing. It is possible
to obtain correlations for ternary mixture, binary mixture, and unblended cement
concretes through the use of these factors.

39
Wenner Resistivity vs. T277 Coulomb
Theoret ica l Ad jus ted — — Theoret ica l — Ad jus ted
E 10000 _o 3 O w c
1000 _ r» rsi
O t-X t o 3
100
Adjus ted
y = 12120x-°7 8 5
R 2 = 0.7987
Theoret ica l
y=18179X 1
R 2 = 1
5.25 4.25
2.75 2.25
5 % 8.5 10% 10.75
15%, 14.25 20%, 18.75
25%, 25.5
2.25 6.63 i o 25.5
Wenner Resistivity (kn*cm)
100
Fig. 4.10 - Comparison of adjusted (joule effect and geometric correction)
relationship and theoretical relationship (lin=2.54cm)
This data supports the use of the Wenner device as a quality assurance/quality
control (QA/QC) tool in concrete field testing. A testing method needs to be developed
that specifies the dry curing period between wet curing and time of testing in order to
standardize and compare the results. Continued research on how to ensure that in-situ
concrete is saturated to an acceptable level (saturated surface dry) should be performed in
addition to environmental effects on in-situ resistivity readings. Cylinders cast as QA
specimens and placed in wet curing for strength testing could be used for resistivity
testing.
39
Wenner Resistivity vs. T277 Coulomb
• Theoretical • Adjusted - - Theoretic,,1 - Adjusted
" E """'" ~ Adjusted Theoretical , ;--.. 0 Y" 12120x~'ts -. '" • - R'",O.7987 < (l')I;, 6.63 • '000 • • • , , ~ 0
>0" • %
" , 2.25 6.63 >0 25.5 '00 ~ Wenne r Resist ivity (kCl*(m)
Fig. 4. 10 - Comparison or adjuslcd Goulc effect and geometric cor rect ion)
relationship and theoretical re lal ionship ( l io=2.54CIII)
This data supports the use of the Wenner device as a quali ty assurance/quali ty
control (QA/QC) \001 in concrete field test ing. A testing method needs to be developed
that specifics the dry curing period between wet curing and time of testing in order to
standardize and compare the resul ts. Continued research on how to ensure that in-si lu
concrete is saturated to an acceptable level (saturated surface dry) should be performed in
addition to environmental efTects on in-situ resistivity readings. Cylinders cast as QA
specimens and placed in wet curing for strength testing could be used for resistivi ty
testing.

CHAPTER 5
EVALUATION OF DATA
This chapter provides further explanation for the results portion of the ACI
manuscript found in Chapter 4 as well as other information not included in the
manuscript.
Geometric Correction
The curvature of the concrete specimen introduces distortions in the electrical
field that affect the resistivity value measured by the Wenner device. The Wenner probe
passes a current between the two outside probes, and the voltage drop across the inner
probes is measured. As the current is three-dimensional, it reaches the boundary between
the curved surface of the cylinder and the air at various angles to the direction of the
probes. This causes the current to be concentrated within the conducting material and so
larger values of voltage are measured as compared to a semi-infinite flat slab. The
correction factor for the 4 inch by 8 in cylinder was tested for validity for the ACI
manuscript in Chapter 4. This testing involved six 4 inch by 8 inch cylinders and one 1
foot by 1 foot by 4 inch slab. The readings were taken diagonally on the slab to minimize
edge interference. As can be seen in Table 5.1, using a correction factor of 2.7, the
. ...;... .
CHAPTER 5
EVALUATION OF DATA
This chapter provides further explanation for the results portion of the ACI
manuscript found in Chapter 4 as well as other information not included in the
manuscript.
Geometric Correction
The curvature of the concrete specimen introduces distortions in the electrical
tield that affect the resistivity value measured by the Wenner device. The Wenner probe
passes a current between the two outside probes, and the voltage drop across the inner
probes is measured. As the current is three-dimensional, it reaches the boundary between
the curved surface of the cylinder and the air at various angles to the direction of the
probes. This causes the current to be concentrated within the conducting material and so
larger values of voltage are measured as compared to a semi-infinite flat slab. The
correction factor for the 4 inch by 8 in cylinder was tested for validity for the ACI
manuscript in Chapter 4. This testing involved six 4 inch by 8 inch cylinders and one 1
foot by I foot by 4 inch slab. The readings were taken diagonally on the slab to minimize
edge interference. As can be seen in Table 5.1, using a correction factor of2.7, the

41
Table 5.1 - Independent testing of geometric correction factor
Specimen Avg. reading Geometric Adjusted Difference Shape 28 day Correction Resistivity (%)
l f tx l f tx 5in Slab
22.4 kft*cm 1 22.4 kQ*cm 5.5%
4in x 8in Cylinder 57.0kft*cm 2.7 21.1 kQ*cm
5.5%
4 inch by 8 inch cylinder results were very close to the results obtained for a flat slab.
The effect of this correction can be seen in Fig. 4.5 in which the geometric correction
factor corrects the Wenner resistivity data (used to determine coulomb in Fig. 4.5) closer
to an Ohms law relationship. The one-to-one relationship is considered an Ohms law
relationship due to both methods yielding the same result, shown as the diagonal line.
The geometric correction factor also includes the differences in surface resistivity
of the specimens as well. There may be a difference in surface resistivity between the
vertical cylinder and horizontal slab as the horizontal slab may have more paste at the
surface than the edge of the cylinder. This is discussed more in the suggested additional
research section at the end of this chapter.
Joule Effect
The joule effect correction was applied to the ASTM CI202 data after testing.
This correction was done to account for the effects of heating of the specimen during
testing. As stated earlier, as the temperature of the specimen increases, so does the
electrical conductivity. As the ASTM CI202 test is a measurement of conductivity
through the specimen, it was expected that as the temperature would rise, so would the
current passed. In order to test this expectation, specimens were cast and prepared the
same as with all other testing done for this thesis. The specimens chosen were at both
41
Table 5.1 - Independent testing of geometric correction factor
Specimen Avg. reading Geometric Adjusted Difference Shape 28 day Correction Resistivity (%)
Iftx Iftx 22.4 kf.!*cm I I 22.4 kQ*cm
Sin Slab 5.5%
4in x 8in 57.0 kll*cm i '2.7 21.1 kn*cm
Cylinder
4 inch by 8 inch cylinder results were very close to the results obtained for a flat slab.
The effect of this correction can be seen in Fig. 4.5 in which the geometric correction
factor corrects the Wenner resistivity data (used to determine coulomb in Fig. 4.5) closer
to an Ohms law relationship. The one-to-one relationship is considered an Ohms law
relationship due to both methods yielding the same result, shown as the diagonal line.
The geometric correction factor also includes the differences in surface resistivity
of the specimens as well. There may be a difference in surface resistivity between the
vertical cylinder and horizontal slab as the horizontal slab may have more paste at the
surface than the edge of the cylinder. This is discussed more in the suggested additional
research section at the end of this chapter.
Joule Effect
The joule effect correction was applied to the ASTM C 1202 data after testing.
This correction was done to account for the effects of heating of the specimen during
testing. As stated earlier, as the temperature of the specimen increases, so does the
electrical conductivity. As the ASTM C 1202 test is a measurement of conductivity
through the specimen, it was expected that as the temperature would rise, so would the
current passed. In order to test this expectation, specimens were cast and prepared the
same as with all other testing done for this thesis. The specimens chosen were at both

42
Table 5.2 - Extended testing coulomb vs. joule corrected coulomb
Normal ASTM CI202 Test Extended Variation Initial Final Joule Extended Percent
Different Mixture Specimen Temp (c)
Temp (c)
Corrected Coulomb
Test Coulomb
Percent Different
75TI/20F2/5M 1 21 32 1,268 1,072 18%
75TI/20F2/5M 2 21 32 1,359 1,008 35%
62TI/35G120S/3SF 1 21 28 888 737 20%
62TI/35G120S/3SF 2 22 30 855 761 12%
60TI/35G120S/5M 1 21 27 921 545 69%
60TI/35G120S/5M 2 20 27 683 602 13%
100TI 1 21 45 2,555 2,552 < 1 %
ends of the permeability spectrum, that is, high permeability and low permeability. One
set of these specimens were tested for a longer duration (36 hours) with lower applied
voltage (10V); the others were tested using the ASTM CI202 method (60V over 6 hours)
with the joule effect adjustment applied using Equation (4). In this way, the same energy
was applied to the cell prolonged over an extended period of time as was applied during
the normal testing time. This was expected to cause less temperature rise during testing
and allowed for direct comparison with the temperature corrected specimens. It was
found that the results comparing the temperature corrected specimen data and the
prolonged testing time were very close for the higher permeable mixtures and not quite as
close for lower permeable mixtures, as can be seen in Table 5.2. The standard deviation
for these specimens was 646 coulombs, the mean was 1129, and the coefficient of
variation was 0.57, which was considered acceptable. Fig. 5.1 shows both the
temperature rise and current increase over the testing period for both the extended testing
time and the standard testing time (6 hours). The area between the standard testing time
and the extended testing time is the joule effect. It was concluded that the joule effect
must be considered when performing the ASTM
42
ends of the permeability spectrum, that is, high permeability and low permeability. One
set of these specimens were tested for a longer duration (36 hours) with lower applied
voltage (lOY); the others were tested using the ASTM Cl202 method (60Y over 6 hours)
with the joule effect adjustment applied using Equation (4). In this way, the same energy
was applied to the cell prolonged over an extended period of time as was applied during
the normal testing time. This was expected to cause less temperature rise during testing
and allowed for direct comparison with the temperature corrected specimens. It was
found that the results comparing the temperature corrected specimen data and the
prolonged testing time were very close for the higher permeable mixtures and not quite as
close for lower permeable mixtures, as can be seen in Table 5.2. The standard deviation
for these specimens was 646 coulombs, the mean was 1129, and the coefficient of
variation was 0.57, which was considered acceptable. Fig. 5.1 shows both the
temperature rise and current increase over the testing period for both the extended testing
time and the standard testing time (6 hours). The area between the standard testing time
and the extended testing time is the joule effect. It was concluded that the joule effect
must be considered when performing the ASTM
Table S.2 - Extended testing coulomb vs. joule corrected coulomb
Nonnal ASTM CI202 Test Extended Variation Initial Final louie Extended
Percent Mixture Specimen Temp Temp Corrected Test
Different (c) (c) Coulomb Coulomb
75Tl/20F2/5M I 21 32 1,268 1,072 18% 2 21 32 1,359 1,008 35%
62Tl/35G 120S/3SF 1 21 28 888 737 20% 2 22 30 855 761 12%
60TI/35G 120S/5M 1 21 27 921 545 69% 2 20 27 683 602 13%
100Tl 1 21 45 2,555 2,552 <1%

43
50
45
40
2 - 35 d E 30 <u I-
25
20
15
Joule Effect 100TI S tandard 100TI Ex tended
• 100TI S tandard - m A — • • 100TI Ex tended - m A
i 1 1 T ~i r
250
200
< 150 E
c 100 £
3 U 50
0
0 0.5 1 1.5 2 2.5 3 3.5 4 4.5 5 5.5 6
Time (hrs)
Fig. 5.1—Joule effect
CI202 test in order to get more realistic information about the material properties without
the interference of specimen heating. The effect of this correction can be seen in Fig. 4.4
in which it corrects the ASTM CI202 data closer to an Ohms law relationship. The one-
to-one relationship is considered an Ohms law relationship due to both methods yielding
the same result.
Resistivity from Coulomb and Coulomb from Resistivity
Resistivity from Coulomb
In order to understand the relationship between the ASTM CI202 testing method
and Wenner resistivity, it was important to calculate resistivity from the ASTM CI202
data using Ohms law and compare the results with experimental resistivity using the
43
Joule Effect
____ 10011 Standard - looTt E~lended
-+ - tOOTIStandard-mA - • · lOOTlE~lended · mA
so 2>,
" " !: 35
"'" • '" E
.... . . .. . ~.--"""+: -.- .--... ::::-= .. . .
• E 30 • " 2>
• 0
100 t , u
~
SO 20
" , r' - . - . - • - . - • - . - • - . - . - . - . - .
o 0.5 1 1.5 2 2.5 3 3.S 4 4.5 5 5.5 6
Time 1111'S)
Fig. 5. I-Joule effect
C 1202 test in order to gel more realistic infomlation about!he materia! properties wi thout
Ihe interference of specimen healing. The eITeet of this correction can be seen in Fig. 4.4
in which it corrects the ASTM C 1202 data closer to an Ohms law relationship. The onc-
to-one relationship is considered an Ohms law relationship due 10 both methods yielding
Ihc same result.
Resistivity fro m Coulomb and Coulomb from Resisti vity
Resistivity from Coulomb
In order to understand the relationship between the ASTM C 1202 testing method
and Wenner resistivi ty, il was important to calculate resistivity from the ASTM C 1202
data using Ohms law and compare the results with experimental res istivi ty using the

44
same concrete. In order to determine the equation needed to convert the ASTM CI202
data into resistivity, certain basic principles need to be understood.
Ohms law states that current flowing in a material is directly proportional to the
potential difference across the ends of a resistor divided by the electrical resistance.
Another basic concept is the resistivity of a material, which is how strongly a material
opposes the flow of electric current. A low resistivity means that the current can flow
through the material with ease; conversely, the higher the resistivity, the more opposition
the current experiences through the material. Resistivity is the resistance of the material
multiplied by the cross-sectional area of the material divided by the length of material
(see Equation (3)). Combining Ohms law with resistivity by inputing the equation for
Ohms law into the resistivity equation allows the resistivity of a material to be
determined (see Equation (4)). The required information is the potential voltage drop
across the material, current applied to the material, cross sectional area, and thickness of
the material, all of which are known or can be derived from the ASTM CI 202 results.
By taking the Coulomb (Amp*sec) value corrected for the joule effect from
ASTM CI202, which has a nearly constant current applied, and dividing it by the total
time of the test (6 hours = 21,600 seconds) it was possible to determine the average
current applied during testing. Then taking the constant potential applied during testing
(60V), multiplying it by the cross sectional area of the concrete specimen (using a
diameter of 3.75 inches as stated in Chapter 3), dividing it by the average current and
thickness of the specimen, the resistivity was obtained. The results of this can be found
in Table 4.1.
same concrete. In order to determine the equation needed to convert the ASTM C 1202
data into resistivity, certain basic principles need to be understood.
44
Ohms law states that current flowing in a material is directly proportional to the
potential difference across the ends of a resistor divided by the electrical resistance.
Another basic concept is the resistivity of a material, which is how strongly a material
opposes the flow of electric current. A low resistivity means that the current can flow
through the material with ease; conversely, the higher the resistivity, the more opposition
the current experiences through the material. Resistivity is the resistance of the material
multiplied by the cross-sectional area of the material divided by the length of material
(see Equation (3)). Combining Ohms law with resistivity by inputing the equation for
Ohms law into the resistivity equation allows the resistivity of a material to be
determined (see Equation (4)). The required information is the potential voltage drop
across the material, current applied to the material, cross sectional area, and thickness of
the material, all of which are known or can be derived from the ASTM C1202 results.
By taking the Coulomb (Amp*sec) value corrected for the joule effect from
ASTM C 1202, which has a nearly constant current applied, and dividing it by the total
time of the test (6 hours = 21 ,600 seconds) it was possible to determine the average
current applied during testing. Then taking the constant potential applied during testing
(60Y), multiplying it by the cross sectional area of the concrete specimen (using a
diameter of3.75 inches as stated in Chapter 3), dividing it by the average current and
thickness of the specimen, the resistivity was obtained. The results of this can be found
in Table 4.1.

45
Coulomb from Resistivity
Another method to check if an Ohms law relationship existed between the ASTM
CI202 testing method and Wenner resistivity was to convert geometrically corrected
resistivity into coulomb using Ohms law. By following the methodology in the previous
section, solving for current instead of solving for resistivity, the coulomb values could be
determined using Ohms law. If the potential difference is assumed to be the same as is
used in ASTM CI202 (60V) and all the other perameters are known, Equation (4) could
be rearranged and the current could be solved for. Once the average current is solved and
multiplying it by the testing time, coulombs are determined. A summary of selected
mixtures is given in Table 4.2.
Deviation from Theoretical Ohms Law
As is generally the case between theoretical equations/relationships and
experimental data in concrete, there is a variation between the theoretical Ohms law
relationship between these tests and the experimental. This is evident in Fig. 4.10. The
variation is greater with low permeability mixtures than for higher permeability mixtures,
and the relationship is equal at 6.63 kr2*cm. One reason for this variation may be that
the geometric correction factor, as stated above, may not be the same for low permeable
mixtures as it is with high permeable mixtures. The triangle shape in Fig. 4.10 shows the
variation at different resistivity values between the theoretical line and the adjusted line.
These were determined by using the same resistivity value in each equation and
comparing the results. Table 5.3 shows the results of each equation and the variation at
45
Coulomb from Resistivity
Another method to check if an Ohms law relationship existed between the ASTM
C1202 testing method and Wenner resistivity was to convert geometrically corrected
resistivity into coulomb using Ohms law. By following the methodology in the previous
section, solving for current instead of solving for resistivity, the coulomb values could be
determined using Ohms law. If the potential difference is assumed to be the same as is
used in ASTM C1202 (60V) and all the other perameters are known, Equation (4) could
be rearranged and the current could be solved for. Once the average current is solved and
multiplying it by the testing time, coulombs are determined. A summary of selected
mixtures is given in Table 4.2.
Deviation from Theoretical Ohms Law
As is generally the case between theoretical equations/relationships and
experimental data in concrete, there is a variation between the theoretical Ohms law
relationship between these tests and the experimental. This is evident in Fig. 4.10. The
variation is greater with low permeability mixtures than for higher permeability mixtures,
and the relationship is equal at 6.63 kQ*cm. One reason for this variation may be that
the geometric correction factor, as stated above, may not be the same for low permeable
mixtures as it is with high permeable mixtures. The triangle shape in Fig. 4.10 shows the
variation at different resistivity values between the theoretical line and the adjusted line.
These were determined by using the same resistivity value in each equation and
comparing the results. Table 5.3 shows the results of each equation and the variation at

46
Table 5.3—Adjusted equation variation from theoretical equation
Resistivity kQ*cm (kQ*in)
Theoretical Eqn. (coulomb)
Adjusted Eqn. (coulomb)
% Variation
6.57 (2.6) 2768 2768 0% 8.5 (3.3) 2139 2261 5%
10.75 (4.2) 1691 1881 10% 14.25 (5.6) 1276 1508 15% 18.75 (7.4) 970 1216 20% 25.5 (10) 713 956 25%
each point to the right of equality. This comparison is done to show how closely the
theoretical trendline and the experimental data trendline are.
Drying Time and Excluded Data
Some of the testing data was excluded from the presented results as a result of
incorrect or inconsistent testing methods. Two sets of ASTM CI 202 data were excluded
due to a large difference in testing results. It was not desirable to include some of the
data from the sets and not others. Resistivity data were also excluded due to improper
curing before testing. The specimens were left out to dry longer than the 15 minute
window used for this test, yielding higher resistivity values from poor contact areas.
Through testing the effects of drying time, it was determined that the longer the
specimens were left out, the higher the resistivity. Table 4.3 shows the duration of time
left out to dry and the resistivity reading obtained using a mixture with a moderate
coulomb value.
46
Table 5.3-Adjusted equation variation from theoretical equation
Resistivity Theoretical Eqn. Adjusted Rqn. % kO*cm (kO*in) (coulomb) (~oulombi Variation
6.57 (2.6) 2768 2768 0% 8.5(3.3) 2139 2261 5%
10.75 (4.2) 1691 1881 10% 14.25 (5.6) 1276 1508 15% 18.75 (7.4) 970 1216 20% 25.5(10) 713 956 25%
each point to the right of equality. This comparison is done to show how closely the
theoretical trendline and the experimental data trendline are.
Drying Time and Excluded Data
Some of the testing data was excluded from the presented results as a result of
incorrect or inconsistent testing methods. Two sets of ASTM CI202 data were excluded
due to a large difference in testing results. It was not desirable to include some of the
data from the sets and not others. Resistivity data were also excluded due to improper
curing before testing. The specimens were left out to dry longer than the 15 minute
window used for this test, yielding higher resistivity values from poor contact areas.
Through testing the effects of drying time, it was determined that the longer the
specimens were left out, the higher the resistivity. Table 4.3 shows the duration of time
left out to dry and the resistivity reading obtained using a mixture with a moderate
coulomb value.

47
Comparison with Prior Work
Burke and Hicks (16) developed a relationship between the ASTM CI202 and
electrochemically determined resistivity. This relationship is shown in Fig. 5.2 along
with the adjusted and theoretical relationships developed in Chapter 4. As can be seen,
all the relationships are in a similar range and are relatively close to each other. It is
important to note that the Burke relationship does not extend beyond 2,000 coulombs,
because the information was determined to be inaccurate due to heating of the specimens,
or what we now know as the joule effect. The difference in the lines is possibly due to
variability in the geometric effect for lower permeable mixtures.
Material Influence Evaluation
Effects on Resistivity
Resistivity testing was performed at the University of Utah as part of the pool
funded study on 27 of the 48 mixtures studied. Eleven more were completed, but due to
saturation variations, the data were shown not to be reliable. An additional 7 did not have
enough materials to complete.
The relationship between ASTM CI202 and Wenner resistivity can be seen in
Fig. 5.3; the theoretical trend line is shown for resistivity values calculated using Ohms
law and ASTM CI202 data from all samples. To understand the chart, a higher coulomb
value (lower the resistivity) indicates the mixture is less resistant to chloride ion
penetration. Fig. 5.3 (similar to Fig. 4.9) shows the inverse relationship between
coulomb and resistivity, where when coulomb is high, resistivity is low. As ASTM
CI 202 measures the conductivity of the material and resistivity measures the
47
Comparison with Prior Work
Burke and Hicks (16) developed a relationship between the ASTM C1202 and
electrochemically determined resistivity. This relationship is shown in Fig. 5.2 along
with the adjusted and theoretical relationships developed in Chapter 4. As can be seen,
all the relationships are in a similar range and are relatively close to each other. It is
important to note that the Burke relationship does not extend beyond 2,000 coulombs,
because the information was determined to be inaccurate due to heating of the specimens,
or what we now know as the joule effect. The difference in the lines is possibly due to
variability in the geometric effect for lower permeable mixtures.
Material Influence Evaluation
Effects on Resistivity
Resistivity testing was performed at the University of Utah as part of the pool
funded study on 27 of the 48 mixtures studied. Eleven more were completed, but due to
saturation variations, the data were shown not to be reliable. An additional 7 did not have
enough materials to complete.
The relationship between ASTM C1202 and Wenner resistivity can be seen in
Fig. 5.3; the theoretical trend line is shown for resistivity values calculated using Ohms
law and ASTM Cl202 data from all samples. To understand the chart, a higher coulomb
value (lower the resistivity) indicates the mixture is less resistant to chloride ion
penetration. Fig. 5.3 (similar to Fig. 4.9) shows the inverse relationship between
coulomb and resistivity, where when coulomb is high, resistivity is low. As ASTM
C1202 measures the conductivity of the material and resistivity measures the

48
10000 si E
_o 3 O DO C
IN H
1000
Adjusted vs. Theoretical vs. Burke • — Theoret ica l Ad jus ted Burke
^ ^ A d j u s t e d
Burke
Theoret ica l
x t o
3 100
10 ^ Resistivity (kI2*cm)
100
Fig. 5.2—Comparison to previous work
resistance of the material, it is expected that there is a relationship between the two
because conductance is the inverse of resistance.
Each marker in Fig. 5.3 represents a different mixture and includes 8 to 48
resistivity readings using a Wenner device that were then averaged to obtain the data
point. These mixtures were made of ternary cements, binary cements, and single cement
mixtures and were cured for 98 ± 1 day. This testing time was chosen to ensure the
majority of the pozzolans reacted in the concrete. We believe that through additional
testing, the correlation of these two methods would improve.
Material Substitution Observations
Mixtures containing any ternary combination of Class F, C, F2 fly ashes had T277
performance levels higher than the control of 100% Type I/II. High volumes of fly ash
generally increase the bleed water, which led to an increase in T277 values as
48
Adjusted VS. Theoretical VS. Burke - - Theoretical - Adjusted - - Burke
e-__________ ~~jU~"~.dC---------Burke -.....:: .........
Theoretital
, >0 Resistivity (kt1*cm)
>0,
Fig. 5.2-Com parison to prc"ious work
resistance of the material, it is c){peeted that there is a relationship between the \WO
because conductance is the inverse of resistance.
Each marker in Fig. 5.3 represents a different mixture and includes 8 \0 48
resistivity readings using a Wenner device thai were then averaged \0 obtain the data
point. These mixtures were made of Ie mary cements. binary cemenls, and single cement
mixtures and were cured for 98 :t I day. This testing time was chosen \0 ensure the
majority of the pozzolans reacted in the concrete. We believe thal1hrough additional
testing, the correlation of these two methods would improve.
Material Substitution Observations
Mixtures containing any tcrnary combination of Class F, C, F2 fly ashes had T277
performance Icvels higher than the control o f 100% Type lill. High volumes of fly ash
generally increase the bleed water, which led to an increase in T277 values as

49
Wenner Resistivity vs. T277 Coulomb
• Theoret ica l • Ad jus ted — — Theoret ica l Ad jus ted
| 10000 o
00 I 1000 re
P O 100
•
2 t
Ad jus ted
y = 1 2 1 2 0 x ° 7 8 5
R 2 = 0.7987
Theoret ica l
y = 1 8 1 7 9 X 1
R 2 = 1
10
Wenner Resistivity (kn*cm)
Fig. 5.3—AASHTO T277 coulomb vs. Wenner resistivity
100
interconnected voids appear in the mixtures. When larger amounts of fly ashes are
combined, it increases the amount of bleeding as the spherical shape of the fly ash
particles does not interact with water as other pozzolans do, such as silica fume. A
decrease in water to cementitious material may be warranted in these mixtures.
It was observed in Fig. 5.4 that with Type I/II cement and a replacement of 40%
cementitious material with 30% Class F2 fly ash and 10% Class C fly ash that a coulomb
reading of 6137 and a resistivity reading of 17 kQ*cm (6.7 kQ*in) were obtained. By
replacing only 33% of cementitious material with 30% Class F2 fly ash and 3% silica
fume, a coulomb reading of 1988 and resistivity reading of 36.313 kQ*cm were obtained.
This substitution produced a reduction of 61.6% for coulomb and an increase of 113% for
resistivity. Similarly, with Type I/II cement and a replacement of 40% cementitious
material with 20% Class F fly ash and 20% Class F2 fly ash, readings of 4963 coulombs
and 14.75 kU*cm (5.8 k£2*in) were obtained. By replacing the 20% Class F fly ash with
f 10000 o 3 §. tl.O C :c 1000
~ § ~ 100 l:
~
Wenner Resistivity vs. T277 Coulomb
• Theoretical • Adjusted - - Theoretical - Adjusted
1
. ---~. Theoretical y = 18179x-1
R2 = 1
10
Wenner Resistivity (kO*cm)
•
Adjusted y = 12120x-o.785
R2 = 0.7987
Fig. 5.3-AASHTO T277 coulomb vs. Wenner resistivity
interconnected voids appear in the mixtures. When larger amounts of fly ashes are
combined, it increases the amount of bleeding as the spherical shape of the fly ash
particles does not interact with water as other pozzolans do, such as silica fume. A
decrease in water to cementitious material may be warranted in these mixtures.
49
100
It was observed in Fig. 5.4 that with Type IIII cement and a replacement of 40%
cementitious material with 30% Class F2 fly ash and 10% Class C fly ash that a coulomb
reading of6137 and a resistivity reading of 17 kQ*cm (6.7 kQ*in) were obtained. By
replacing only 33% of cementitious material with 30% Class F2 fly ash and 3% silica
fume, a coulomb reading of 1988 and resistivity reading of 36.313 kQ*cm were obtained.
This substitution produced a reduction of 67.6% for coulomb and an increase of 113% for
resistivity. Similarly, with Type 1111 cement and a replacement of 40% cementitious
material with 20% Class F fly ash and 20% Class F2 fly ash, readings of 4963 coulombs
and 14.75 kQ*cm (5.8 kQ*in) were obtained. By replacing the 20% Class F fly ash with

_ 7000 g 6000 jr 5000 5* 4000 | 3000 ~ 2000 | 1000 I 0
o u
50
Material Observations - AASHTO T277
J AASHTO T277 H Resistivity 6137 42 .375
36 .313 4963
17 1988
Mixture Type
Fig. 5.4—Pozzolan substitution comparison (lin=2.54cm)
20% G120 ground granulated blast furnace slag, readings of 2147 coulomb and 42.375
k£2*cm (16.7 k£2*in) were obtained - a reduction of 56.7% for coulomb and an increase
of 187%) for resistivity. With the addition of small amounts (<5%) of silica fume and
metakaolin and (<35%) GGBFS, the AASHTO T277 measurement decreases
significantly and the resistivity inversely. The microstructure becomes more dense as the
calcium hydroxide is consumed by the pozzolans, making it more difficult for the
chloride ions and electrical current to pass through the concrete.
Effects of Different Pozzolans
Although mixtures contained different amounts of pozzolans, Fig. 5.5 to Fig. 5.10
illustrate that there is a general trend in most of the pozzolans used in this study. Each of
50
Material Observations - AASHTO T277
t.:I AAS HTO T2 77 • Resistivity
7000 6137 42.375 50 -u 6000 40 E • • 5000 u • 30 • ~ 4000 S E 3000 20 -"- 2000 ·f • 10 ~ 1000 E 0 0 :g 0 ,
\,<J- f?q. " ,"' • 0 ~ u \,0 ,
&' " \,0> ~o 0' ,\, #'~ .,' 1-' " • ,,0 #'
Mixture Type
Fig. 5.4-Pozzolull subslitut ion cOlllllar ison (I in; 2.54cm)
20% G ! 20 ground granulated blast furnace slag. readings of2 J 47 coulomb and 42.3 75
kO·cm (16. 7 kO*in) were obtained - a reduction of 56.7% for coulomb and an increase
of 187% for resistivity. With the addition of small amounts «5%) of silica fume and
mctakaolin and «35%) GGBFS. the AASHTO T277 measurement decreases
significantly and the resistivity inversely. The microstructure becomes more dense as the
calcium hydroxide is consumed by the pozzoians, making it more difficult for the
chloride ions and electrical CUTTent 10 pass th rough the concrete.
Effeets of Different J'ozzola ns
Although mixtures contained different amounts of pozzoJans, Fig. 5.5 to Fig. 5. J 0
illustrate that there is a general trend in most of the pozzolans used in this study. Each o f

51
Resistivity vs. Coulomb - Silica Fume Theoret ica l • Si l ica Fume Theoret ica l
S" 10000 i • _ _ _ _ _ _ _ _ _ . — _
o
100
Fig. 5.5—AASHTO T277 coulomb vs. Wenner resistivity - silica fume
the Figs. 5.5 to Fig. 5.10 shows the theoretical line for reference from all mixtures and
each pozzolan that was used and where the data plotted compared to the theoretical line.
Silica fume can be found in Fig. 5.5, which shows that the addition of silica fume (3-5%
in this case), lower values of CI 202 and higher resistivity readings are obtained. Those
familiar with CI202 may notice that the values appear to be higher than expected
(expected less than 1,000); this appears in mixtures containing Class F fly ash and less
than 5% silica fume. This combination of Class F fly ash and silica fume is less resistant
to chloride ion penetration as compared to the other mixtures containing silica fume.
Similar to silica fume, Fig. 5.6 shows that with the addition of Metakaolin (3-5%),
the coulomb values are on the lower end of the range of data obtained. In Fig. 5.7, slag
mixtures are presented again with coulomb values on the mid to lower end of the range.
In Fig. 5.8, Class F fly ash varied from the mid to upper end of the theoretical line. This
is possibly due to excess bleed water forming additional voids in the concrete. In Fig.
51
the Figs. 5.S to Fig. 5.10 shows the theoretical line for reference from all mixtures and
each pozzolan that was used and where the data ploued compared \0 the theoretical line.
Silica fume can be found in Fig. 5.5, which shows thatlhc addi tion of silica fume (3-5%
in this case), lower values of C [202 and higher resistivity readings 3rc obtained. Those
familiar with C 1202 may notice tha t the values appear to be higher than expected
(expected less than [,(00): this appears in mixtures containing Class F fly ash and less
than 5% silica fume. This combination of Class F fly ash and si lica fume is less resistant
10 chloride ion penetration as compared to the other mixtures containing silica fume.
Similar to silica fume. Fig. 5.6 shows thaI wi th the addition of Metakaolin (3-5%),
the coulomb values are on the lower end of the range of data obtained. In Fig. 5.7. slag
mi.l{tures are presented again with coulomb values on the mid to lower cnd of the range.
In Fig. 5.8, Class F fly ash varied from the mid to upper end of the theoreticallinc. This
is possibly due to excess blced water fanning additional voids in the concrete. In Fig.
Resistivity vs. Coulomb - Silica Fume
• Theoretical • Silka Fume --TheoreHcal
• 1()()()() e ~ • ,. • ., 1000 • • • • , , ~ 100 0 • 1 10 100 < ~ Resistivity (kfi*cm)
Fig. 5.5-AAS HTO T277 cou lomb \ '5. Wenner resis tivity - silica fume

52
Resistivity vs. Coulomb - Metakaolin
-Q
100
Resistivity (k£l*cm)
Fig. 5.6—AASHTO T277 coulomb vs. Wenner resistivity - metakaolin
5.9, another Class F fly ash (designated F2) with a similar trend to the previous Class F
fly ash is observed. Fig. 5.10 shows the Class C fly ash on the upper end of the
theoretical relationship. Again, this is most likely due to excess bleed water caused by
the fly ash.
As seen in Fig. 5.8 and Fig. 5.9, one of the largest variations in CI 202 data and
resistivity was using the two Class F fly ashes. Again, this was possibly due to excess
water and bleeding caused by the fly ash. In general, a good correlation in resistivity and
CI202 was obtained.
Suggested Additional Research
Geometric Correction Factor
The geometric correction factor established by others (9) was established using
Type I, Type I with 20% fly ash, and Type II cements. These generally have higher
Theoretical • Metakaolin Theoretical
10000 i - — — — — — — — —
" Resistivity vs. Coulomb - Metakaolin
• Theoretical • Metakaolln --Theoretical
" '0000
e 0 > •• 0
" >000 -< • " • • • , , '00 ~
0 , >0 '00 • %
~ Resistivity (kil*cm)
Fig. 5.6--AASHTO T277 coulomb vs. Wenner resistivity - meta kaolin
5.9, another Class F fly ash (desigmltcd F2) with a similar trend to the previous Class F
fly ash is observed. Fig. 5.10 shows Ihe Class C fly ash on the upper end orthe
theoretical relationship. Again, Ihis is mosllikely due to excess blcc<l water caused by
the fly ash.
As secn in Fig. 5.8 and Fig. 5.9, one of the largest variations in C1202 data and
resistivity was using the two Class F fly ashes. Again. Ihis was possibly due to excess
water and bleeding caused by the fly ash. In general, a good correlation in resistivity and
C 1202 was obtained.
Suggested Additional Resea rch
Geometric Correction Factor
The geometric correction factor established by others (9) was established using
Type I, Type I with 20% fl y ash, and Type II cements. These generally have higher

53
E
100
Fig. 5.7—AASHTO T277 coulomb vs. Wenner resistivity - slag
permeability as compared to mixtures containing silica fume or slags. It was observed
from information collected by others (14) that there appeared to be different variations
between the cylinder resistivity and the slab resistivity depending on the permeability of
the mixture. Mixtures with lower resistivity were close to 2.7 as was used throughout
this thesis, but those with higher permeability are significantly higher (closer to 3.3). The
testing device was similar to the one used in the tests for this thesis. Information in Table
5.4 was taken from Smith (14) and shows the comparison of the different mixture
resistivity for slabs and cylinders and the correction factor needed to obtain the slab
resistivity from the cylinder resistivity. In Table 5.4, PC is portland cement, BS is
ground granulated blast-furnace slag, SF is silica fume, and FA is Class F fly ash.
Resistivity vs. Coulomb - Slag Theoretical • Slag Theoretical
_ 10000 | • — — 2
53
Resistivity vs. Coulomb - Slag
• Theoretical • Slag --Theoretical
I----~--
1 100
Resistivity IkO*cm)
Fig. S. 7- AASIITO T277 coulomb vs. Wenner resislh'ity - slag
permeabili ty as compared to mixtures containing silica fume or slags. It was observed
from information collected by others (14) that there appeared to be different varia tions
between the cylinder resistivity and the slab resistivity depending on the permeabili ty of
the mixture. Mixtures with lower resistivi ty werc close to 2.7 as was used throughout
this thesis, bUllhose with higher permeability arc significantly higher (closer to 3.3). The
testing device was similar to the one used in thc leSlS for th is thesis. Information in Table
5.4 was taken from Smith (/4) and shows the comparison of the different mixture
resistivity for slabs and cylindcrs and the correction factor needed to obtain the slab
resistivity from the cyl inder resistivity. In Table 5.4. PC is penland cement, BS is
ground granulated blast· furnace slag. SF is si lica fu me, and FA is Class F fly ash,

54
Resistivity vs. Coulomb - Class F
100
Fig. 5.8—AASHTO T277 coulomb vs. Wenner resistivity - Class F fly ash
Resaturation
Data has been collected on different curing methods and their effect on resistivity.
One of the main reasons for this procedure was to determine if it is possible for the
concrete to be resaturated after it has been dry cured for a period of time. As stated in
Chapter 3, all specimens used in this thesis were wet cured until the day of testing. Other
specimens were wet cured until 14 days, then removed for dry cure until the time of
testing. These specimens were tested at 2 days, 14 days, 28 days, and 98 days after being
cast.
Two drying schemes were established after the 14t h day of wet curing. The first
was to dry cure the specimen until 2 days before testing, then place the cylinder in wet
cure and test on the prescribed days. This information could then be compared to the wet
curing resistivity data. The other drying scheme involved dry curing until 3 days before
testing, then placing the cylinders in wet cure until the day of testing. Again, this
Theoretical • Class F Theoretical
10000 r — — — — — — — —
54
Resistivity vs. Coulomb - Class F
• Theoretical • ClassF --Theoretical
•
>0,
Resistivity (kfi*cm)
Fig. S.8--AASHTO T217 coulomb \'5. Wenner resisth'ity - Class F ny ash
Resat uralion
Data has been collected on different curing methods and their effect on resistivity.
One of lhe main reasons lor this procedure was to determine ifil is possible for Ihe
concrete to be resaturated after it has been dry cured for a period or lime. As stated in
Chapter 3, all specimens used in this thesis were wei cured until the day of testing. Olher
specimens were wet cured until 14 days, then removed for dry cure until the lime of
testing. These spo..-cimcns were tested al 2 days. 14 days, 28 days, and 98 days after being
cast.
Two drying schemes WCTC established after Ihc J 4 th day of weI curing. The first
was to dry cure the specimen unti l 2 days before testing, then place the cylinder in wet
cure and test on the prcscribed days. This infonnation could thcn be compared to the wet
curing resistivi ty data. The other drying scheme involved dry curing until 3 days before
testing, then placing Ihe cylinders in wei cure until the day o f Ie sting. Again. this

55
Resistivity vs. Coulomb - Class F2
XI
100
Fig. 5.9—AASHTO T277 coulomb vs. Wenner resistivity - Class F2 fly ash
information would need to be compared to the wet cured specimens. Through this
variation in drying methods, it was anticipated that that data would indicate whether it
was possible to resaturate the cylinders after a drying period. Obviously, there are other
variations that could affect the resistivity readings, so other tests would need to be
performed to determine the saturation level of the concrete. Determining the saturation
level and establishing a method to resaturate concrete in-situ and a level of saturation that
is adequate for the resistivity meter to work properly would be an area of future work.
This needs to be completed before Wenner resistivity can realistically be used in- situ. In
the meantime, as expressed in other areas of this thesis, cylinders could be cast and left in
wet cure until the day of testing.
Theoretical • Class F2 Theoretical
10000 i — —
55
Resistivity vs. Coulomb - Class F2
• Theoretical • Class f2 --Theoretical
10000 • e • 2 , 0 ,.
1000 • • • <
" • • • , , 100 ~
0 1 10 100 ~
~ ReSisti vity (kO*cm)
Fig. S.9- AAS HTO T277 cou lomb vs. Wenner resistivity - Class F2 fly ash
infon11ation would need to be compared to the wet cured specimens. Through this
variation in drying methods, it was anticipated that that dala would indicate whether it
was possible to resaturate the cylinders after a drying period. Obviously. there arc other
variations thaI could aITecl the resistivity readings, so other tests would need to be
performed \0 determine the salUration level of the concrete. Determining the saturation
level and establishing a method \0 resalUrate concrete in-situ and a level of saturation that
is adequate for the resistivity meIer to work properly would be an area o f future work.
This needs to be completed before Wenner resistivity can realistically be used in- situ. In
the meantime, as expressed in other areas of this thesis, cylinders could be cast and lell in
wet cure unt il the day of testing.

56
Resistivity vs. Coulomb - Class C Theoretical • Class C Theoretical
-Q E o 3 O
OA c 'B ro <u cc
IV l»s CM I -
B I to \
10000
1000
100
10
Resistivity (kil*cm)
100
Fig. 5 .10—AASHTO T277 coulomb vs. Wenner resistivity - Class C fly ash
Environmental Effects on Resistivity
Additional research should be conducted to determine how environmental factors
(humidity, solar heating of concrete, temperature) affect resistivity readings in-situ. If
needed, adjustments should be made to resistivity readings taken in-situ to compare with
lab-based ASTM CI202 readings.
Prediction Testing
Additional analysis and testing may be considered for early predicting of concrete
permeability at 28 days for 98-day characteristics. If a reliable correlation were to exist
between the 28-day resistivity and 98-day permeability data, it would allow the resistivity
meter to be used as a quality control measure earlier than the 98 days presented, and
would capture the effects of the pozzolans on permeability. This would also allow the
testing to be completed before traffic and deicing salts are applied to the structure. Fig.
56
Resistivity vs. Coulomb - Class C
• Theoretical • Cl a~sC --ThE'Qrct ical
' 0000
>000 I----~~--H)o , >0,
Resist ivity (kil*cm)
Fig. 5. IO-AASHTO T277 coulomb vs. Wenner resisth'ity - C lass C ny ash
En\'ironmental Effects on Resistivity
Additional research should be conducted to dctenninc how environmental factors
(humidity, solar heating of concrete, temperature) affect resistiv ity readings in-situ. If
needed, adjustments should be made 10 resist ivity readings taken in-si tu \0 compare with
lab-based ASTM Cl202 readings.
Prediction Testing
Additional analysis and testing may be considered for early predicting of concrete
permeabili ty at 28 days for 98-day characterist ics. If a reliable correlation were to exist
between the 28-day resistivity and 98-day penneability data. it would allow the resistivity
meter to be used as a quality control measure earlier than the 98 days presented, and
would capture the efTects of\he pozzolans on penneabili ty. This would also allow the
testing to be completed before tramc and deicing salts arc applied to the structure. Fig.

57
Table 5.4 - Correction factor variability
Test #
Mixture Composition
Cylinder Resistivity (kft*cm)
Slab Resistivity (kn*cm)
Correction Factor
Required 1 100PC(0.54w/c) 15.5 5.8 2.67 2 97PC/3SF(0.57wc) 26.3 5.3 4.96 3 100PC 19.3 7.5 2.57 4 100PC 16.5 6.4 2.57 7* 70PC/27FA/3SF 58.0 17.5 3.31 10* 70PC/30FA 44.0 10.6 4.15 11 65PC/30FA/5SF 91.0 21.2 4.29 12 97PC/3SF 33.5 10.4 3.22 13 65PC/35BS 49.0 14.9 3.29
14** 55PC/42BS/3SF 99.0 28.7 3.45 15 100PC 17.9 6.9 2.59 16 55PC/42BS/3SF 65.6 29.8 2.20 17 70PC/27FA/3SF 35.6 22.4 1.59
indicates a gap in testing numbers due to missing cylinder data ¥ Capacity of meter exceeded
Wenner Resistivity vs. T277 Coulomb
• Theoretical • 98 day * 28 day — — Theoretical 98 day
10000
28 day
-Q E o 3 8 c
T3 n> OJ cc r>
B x
1000
100
28 Day adjusted y = 1 4 6 8 9 x ° 9 7 8
R 2 = 0.8747
98 day Adjusted y = 1 2 1 2 0 x 0 7 8 5
R 2 = 0.7987 Theoretical y = 18179X1
R 2 = 1
10
Wenner Resistivity (kfl*cm)
100
Fig. 5 .11—98-day AASHTO T277 coulomb vs. 28-day Wenner resistivity
.-E ~ ~ • .E
" • • • , , ~ 0 • < ~
Table 5.4 - Correction factor variability
Test Mixture Cylinder Slab Correction , Composition
Resistivity (kn·cm)
~~SistiV iI Y kO·cm)
I JOore 0.54w/c 15.5 5.8 2 97PC/3SF 0.57\\"c 26.3 5.3 3 lOOpe 19.3 7.5 4 !Oore 16.5 6.4 7' 70PC127F A13SF 58.0 17.5 10' 70PC/30FA 44.0 10.6
" 65PCl30FN5SF 91.0 21.2 12 97PC/3SF 33.5 10.4 IJ 6S PC/35 BS 49.0 14.9
14" 55PC/42BS/3SF 99.0 28.7 15 lOore 17.9 6.9 16 55PC/41BS/3SF 65 .6 29.8 17 70PC127FAJ3SF 35.6 22.4
• indicates a gap in testing numbers due 10 missing cylinder data •• Capacity of meIer exceeded
Wenner Resistivity vs. T211 Coulomb
Factor Required
2.67 4.96 2.57 2.57 3.3 1 4.15 4.29 3.22 3.29 3.45 2.59 2.20 \.59
57
• Theoretical. 98day • 28day - - TheoretTcal - 98day- - 28day
"'00
'00 ,
98 day Adjusted y: 12120l<<>'ns
R' '" 0.7987
• •
theoretical y '" 18179~·t
R' = 1
Wenner Resistivity tkfi*cm)
•
28 Day adjusted V. 14689~ -o-·"
R' = 0.8147
Fig. 5.11- 98.day AAS HTO 1'277 coulomb vs. 28-day Wen ner resislh·ity
'00

58
5.11 is a plot of the 28-day wet cured resistivity vs. 98-day ASTM CI 202 chloride ion
permeability. There is a good correlation in this data (R2 = 0.87). A better correlation
should try to be obtained to see if using resistivity readings at 28 days as a predictor of
98-day durability is justified.
5.11 is a plol of the 28-day weI cured resistivity vs. 98-day ASTM Cl202 chloride ion
pcnneability. There is a good correlation in this data (R:!" 0.87). A beller correlation
should try 10 be obtained to see if using resistivity readings al 28 days as a predic tor of
98-day durability is justified.
58

CHAPTER 6
SUMMARY AND CONCLUSIONS
Summary
Research was conducted to determine the electrical resistivity of the concrete
using ASTM C1202. Electrical resistivity is a physical property that indicates how
strongly a material opposes the flow of electric current. A low resistivity indicates that
the current can flow through the material with relative ease; conversely the higher the
resistivity, the more opposition the current experiences through the material. It considers
the electrical resistance, cross-sectional area of the specimen, and the length through
which the current must pass. In concrete, resistivity is related to how interconnected the
voids are, the amount of ions present, and the amount of saturation.
The research also involved determining the electrical conductivity of the concrete
according to ASTM CI 202. Electrical conductivity is the inverse of electrical resistivity,
and is the type of measurement performed when using the ASTM CI 202 testing method.
When high conductivity concrete is used in construction where rebar and chlorides are
present, a faster deterioration of rebar occurs as compared to low conductivity concrete.
Electrical resistivity and electrical conductivity are related through Ohms law.
Ohms law states that current flowing in a material is directly proportional to the potential
difference across the ends of a resistor divided by the resistance of the resistor. The
CHAPTER 6
SUMMARY AND CONCLUSIONS
Summary
Research was conducted to determine the electrical resistivity of the concrete
using ASTM C 1202. Electrical resistivity is a physical property that indicates how
strongly a material opposes the flow of electric current. A low resistivity indicates that
the current can flow through the material with relative ease; conversely the higher the
resistivity, the more opposition the current experiences through the material. It considers
the electrical resistance, cross-sectional area of the specimen, and the length through
which the current must pass. In concrete, resistivity is related to how interconnected the
voids are, the amount of ions present, and the amount of saturation.
The research also involved determining the electrical conductivity of the concrete
according to ASTM C 1202. Electrical conductivity is the inverse of electrical resistivity,
and is the type of measurement performed when using the ASTM C 1202 testing method.
When high conductivity concrete is used in construction where rebar and chlorides are
present, a faster deterioration of rebar occurs as compared to low conductivity concrete.
Electrical resistivity and electrical conductivity are related through Ohms law.
Ohms law states that current flowing in a material is directly proportional to the potential
difference across the ends of a resistor divided by the resistance of the resistor. The

60
current is transported by ions present in an electrolyte, which in this case is the fluid
found inside the concrete specimen. In concrete, there are a series of voids created by the
hydration process and these voids become saturated with hydroxyle and chloride ions
when exposed to chlorides. These series of voids allow the current to pass through the
concrete, and the electrolytes make it possible to use Ohms law to relate electrical tests
with each other.
It has been shown that there is a correlation between the testing results of ASTM
CI202 and Wenner resistivity using Ohms law. This correlation was made using two
correction factors, one to account for the joule effect in the ASTM CI 202 method, and
the other to account for geometric differences in the resistivity method. The result
bridges the gap between these two testing methods and shows scientifically through
physics that there is another method for electrical indication of chloride ion ingress in
concrete.
Additional research needs to be completed to improve the reliability of the
relationship in order to further improve the quality control of concrete. More research
should also be completed on how to implement these testing methods in the field.
Conclusions
An excellent relationship between the two testing methods has been developed,
and it is considered to be valid based on the correlation of the data presented. This is
particularly true for mixtures with higher permeability. More research should be
conducted to further correlate this data with low permeability mixtures.
60
current is transported by ions present in an electrolyte, which in this case is the fluid
found inside the concrete specimen. In concrete, there are a series of voids created by the
hydration process and these voids become saturated with hydroxyle and chloride ions
when exposed to chlorides. These series of voids allow the current to pass through the
concrete, and the electrolytes make it possible to use Ohms law to relate electrical tests
with each other.
It has been shown that there is a correlation between the testing results of ASTM
C1202 and Wenner resistivity using Ohms law. This correlation was made using two
correction factors, one to account for the joule effect in the ASTM C 1202 method, and
the other to account for geometric differences in the resistivity method. The result
bridges the gap between these two testing methods and shows scientifically through
physics that there is another method for electrical indication of chloride ion ingress in
concrete.
Additional research needs to be completed to improve the reliability of the
relationship in order to further improve the quality control of concrete. More research
should also be completed on how to implement these testing methods in the field.
Conclusions
An excellent relationship between the two testing methods has been developed,
and it is considered to be valid based on the correlation of the data presented. This is
particularly true for mixtures with higher permeability. More research should be
conducted to further correlate this data with low permeability mixtures.

61
By using adjustments for cylinder geometry for resistivity and the joule effect
during testing for T277, it is possible to obtain resistivity measurements from a 10 cm by
20 cm (4 inch by 8 inch) cylinder and compare them to theoretical resistivity data
obtained by using AASHTO T277. These factors were verified through independent
testing. Through the use of these factors, it is possible to obtain correlations for ternary
mixture, binary mixture, and unblended cement concretes.
This data supports the use of the Wenner device as a quality assurance/quality
control (QA/QC) tool in concrete field testing. To be used in the field for in-situ testing,
additional research should be conducted to determine the effect of the concrete and
saturation solution temperature on resistivity readings and, if needed, a correction be
developed. In addition, a testing method needs to be developed that specifies the dry
curing period between wet curing and the time of testing in order to standardize and
compare the results. Continued research into how to ensure that concrete in the field is
saturated to an acceptable level (saturated surface dry [SSD]) should be performed as
well as environmental effects on resistivity readings in-situ. Cylinders cast as QA
specimens and placed in wet curing for strength testing could be used for resistivity
testing.
Consistent testing methods should be followed in order to obtain correct
correlations. Through testing it was found that resistivity readings taken at 5 minutes as
compared to those taken at 45 minutes after being removed from wet cure are
approximately 15% lower, and compared to 60 minutes are approximately 25% lower.
This shows that testing in a fully saturated condition is necessary and there is a need for
standardization in order to obtain reliable correlations.
61
By using adjustments for cylinder geometry for resistivity and the joule effect
during testing for T277, it is possible to obtain resistivity measurements from a 10 cm by
20 cm (4 inch by 8 inch) cylinder and compare them to theoretical resistivity data
obtained by using AASHTO T277. These factors were verified through independent
testing. Through the use of these factors, it is possible to obtain correlations for ternary
mixture, binary mixture, and unblended cement concretes.
This data supports the use of the Wenner device as a quality assurance/quality
control (QA/QC) tool in concrete field testing. To be used in the field for in-situ testing,
additional research should be conducted to determine the effect of the concrete and
saturation solution temperature on resistivity readings and, if needed, a correction be
developed. In addition, a testing method needs to be developed that specifies the dry
curing period between wet curing and the time of testing in order to standardize and
compare the results. Continued research into how to ensure that concrete in the field is
saturated to an acceptable level (saturated surface dry [SSOD should be performed as
well as environmental effects on resistivity readings in-situ. Cylinders cast as QA
specimens and placed in wet curing for strength testing could be used for resistivity
testing.
Consistent testing methods should be followed in order to obtain correct
correlations. Through testing it was found that resistivity readings taken at 5 minutes as
compared to those taken at 45 minutes after being removed from wet cure are
approximately 15% lower, and compared to 60 minutes are approximately 25% lower.
This shows that testing in a fully saturated condition is necessary and there is a need for
standardization in order to obtain reliable correlations.

62
Well-proportioned concretes containing pozzolans such as Class F fly ash, Class
C fly ash, silica fume, metakaolin, and ground granulated blast furnace slag will yield
concrete more resistant to chloride ion penetration and resistance to electrical current. As
shown, with the substitution of only a small amount of silica fume (3%) or ground
granulated blast furnace slag (35%), a great reduction in the chloride ion ingress can be
accomplished.
62
Wel1-proponioned concretes containing pozzolans such as Class F fly ash, Class
C fly ash, silica fume, metakaolin. and ground granulated blast furoace slag will yield
concrete morc resistant to chloride ion penetration and resistance to electrical current. As
shown, with Ihc substitution of only a small amount of silica fume (3%) or ground
granulated blast furnace slag (35%), a greal reduction in thc chloride ion ingress can be
accomplished.

APPENDIX
98-Day Resistivity and Coulomb Data
As stated earlier in this thesis, the blends of cement include pozzolans such as
silica fume (SF), ground granulated blast furnace slag (GGBFS), two types of Class F fly
ash (labeled F and F2), Class C fly ash, and metakaolin. In addition to different types of
pozzolans, different types of cements were used including type IP (portland-pozzolan),
type IS (portland blast-furnace slab), type ISM (slag-modified portland cement), and type
E (as defined in this research, limestone). These abbreviations are used next to
percentages of each mineral admixtures (i.e., 75TI/20F2/5M indicates 75% type I, 20%
F2 fly ash, and 5% Metakaolin). Tables A.l and A.2 contain the summarized data used
in this research for 98-day and 28-day testing.
APPENDIX
98-Day Resistivi ty and Coulomb Data
As stated earlier in this thesis, the blends of cement include pozzolans such as
silica fume (SF), ground granulated blast furnace slag (GGBFS). two types of Class F fly
ash (labeled F and F2). Class C fly ash, and mctakaolin. In addition to different types of
po72olans. different types of cements were used including type IP (ponland-pozzolan).
type IS (ponland blast-furnace slab), type ISM (slag-modified ponland cement), and type
E (as defined in this research, limestone). These abbreviations are used next to
percentages of each mineral admixtures (i.e., 75T lnOF2/5M indicates 75% type I, 20%
F2 fly ash, and 5% Metakaolin). Tables A.I and A.2 contain the summarized data used
in this research for 98-day and 28-day testing.

64
Table A.l - Condensed 98-day resistivity and coulomb data
Mix ID Wet Cure
98-day Resistivity
Number of
Readings
Standard Deviation
Geometric Adjusted
Resistivity
ASTM CI 202 Data
Temp Adjusted
CI 202 kQ*cm kQ*cm Coulombs Coulombs
75TI/20F/5M 28.69 16 4.50 11 1621 1369 60TI/30F/10F2 8.38 16 1.27 3 6786 3871
60TI/20F2/20G120S 42.38 8 5.26 16 2316 1804 75TI/20F2/5M 42.63 8 3.25 16 2364 1877 67TI/30F2/3SF 36.31 16 6.55 13 1988 1611 60TI/20F/20F2 14.75 8 3.11 5 5490 3431
100TIP 20.50 8 7.75 8 4023 2715 60TI/30F2/10 17.00 8 1.93 6 6137 3558 75TISM/25C 18.66 16 4.36 7 4024 2725 75TISM/25F2 30.63 16 3.56 11 3032 2173 97TISM/3SF 49.25 16 6.83 18 935 845 75TI/20F/5SF 36.38 8 3.11 13 1163 1032
100TI 17.88 16 2.39 7 4563 3068 65TI/30F2/5SF 64.0 16 9.24 24 1512 1308 65TIP/35G120S 73.75 16 10.96 27 1176 1040
60TI/20F/20G120S 36.25 16 4.71 13 2000 1709 100E 16.71 48 1.05 6 5890 3649
80E/20G120S 29.75 48 6.02 11 1970 1703 95E/5SF 45.96 48 6.92 17 1657 1415
75TI/20F2/5M 50.38 16 8.28 19 1568 1314 62TI/35G120S/3SF 62.81 16 12.89 23 985 872 60TI/35G120S/5M 65.06 16 8.23 24 698 627
100TI 13.56 16 2.72 5 3814 2619 75TI/20F2/5SF 65.63 16 5.50 24 1230 1071 77TI/20F2/3SF 42.41 32 4.10 16 1900 1555
65TISM/35G120S 39.19 16 2.01 15 1568 1318 50TI/35G120S/15F 47.19 16 4.12 17 1438 1216
85TIP/15F 25.81 16 1.83 10 3634 2555 Number of readings taken (8 per cylinder)!
64
Table A. I - Condensed 98.day res istivity and coulomb data
Mix ID Standard

28 Day Resistivity and Coulomb Data
Table A.2 - Condensed 28-day resistivity and coulomb data
Mix ID Wet Cure 98-day Resistivity
Number of Readings
Geometric Adjusted Resistivity
kQ*cm kQ*cm 75TI/20F/5M 19.19 16 7.11
60TI/30F/10F2 6.48 16 2.40 60TI/20F2/20G120S 19.88 8 7.36
75TI/20F2/5M 22.75 8 8.43 67TI/30F2/3SF 19.25 16 7.13 60TI/20F/20F2 9.51 8 3.52
100TIP 12.75 8 4.72 60TI/30F2/10 10.16 8 3.76 75TISM/25C 10.25 16 3.80 75TISM/25F2 13.75 16 5.09 97TISM/3SF 23.75 16 8.80 75TI/20F/5SF 15.38 8 5.69
100TI-AG 12.32 16 4.56 65TI/30F2/5SF 23.88 16 8.84 65TIP/35G120S 34.12 16 12.64
60TI/20F/20G120S N/A N/A N/A 100E 12.73 48 4.71
80E/20G120S 25.17 48 9.32 95E/5SF 33.98 48 12.58
75TI/20F2/5M N/A N/A N/A 62TI/35G120S/3SF N/A N/A N/A 60TI/35G120S/5M N/A N/A N/A
100TI N/A N/A N/A 75TI/20F2/5SF 37.69 16 13.96 77TI/20F2/3SF 26.81 32 9.93
65TISM/35G120S 30.81 16 11.41 50TI/35G120S/15F 25.94 16 9.61
85TIP/15F 16.06 16 5.95 Number of readings taken (8 per cylinder)!
65
28 Day Resistivity and Coulomb Data
Table A.2 - Condensed 28-day resistivity and coulomb data
Mix ID Wet Cure 98-day Number of Geometric Adjusted
Resistivity Readings Resistivity kO'cm kO'cm
75TI120F/5M 19.19 16 7.11 60TlI30FIl OF2 6.48 16 2.40
60TlI20F2/20G 120S 19.88 8 7.36 75T1/20F2/5M 22.75 8 8.43 67TlI30F2/3SF 19.25 16 7.13 60TI/20F/20F2 9.51 8 3.52
100TJP 12.75 8 4.72 60TIl30F21 I 0 10.16 8 3.76 75TISM/25C 10.25 16 3.S0 75TlSM/25F2 13.75 16 5.09 97TISM/3SF 23.75 16 8.80 75TI120F/SSF IS.38 8 5.69
,~,-
100Tl-AG 12.32 16 4.56 6STI/30F2/SSF 23.88 16 8.84
-~--
6STJP/3SG 120S 34.12 16 12.64 60TI/20F/20G 120S N/A N/A N/A
100E 12.73 48 4.71 80E/20G 120S 25.17 48 9.32
95E/5SF 33.9X 48 12.58 75TI/20F2/5M N/A N/A N/A
62TJ/35G 120S/3SF N/A N/A N/A 60TI/3SG 120S/5M N/A N/A N/A
100TI N/A N/A N/A 75TJ120F2/5SF 37.69 16 13.96 77T1I20F2/3SF 26.81 32 9.93
65TJSM/3SG 120S 30.81 16 11.41 50TlI35G 120SIl5F 25.94 16 9.61
8STJPIl SF 16.06 16 5.95 Number of readings taken (8 per cylinder))

REFERENCE
1. ASTM Standards vol. 04.01, 04.02, American Society for Testing and Materials, Philadelphia, PA, 2007.
2. AASHTO Standard T277, "Standard Method of Test for Electrical Indication of Concrete's Ability to Resist Chloride," American Association of State Highway and Transportation Officials, Washington, D.C., U.S.A, 2005.
3. Mehta, P., and Monteiro, P., "Concrete Microstructure, Properties, and Materials," 3 r d Edition, McGraw-Hill Professional, New York, NY, USA, 2006, 177-182. Print.
4. Ewins, AJ. "Resistivity Measurements in Concrete," British Journal ofNDT, V. 32, No. 3, 1990, pp. 120-126. Print.
5. Serway, R., and Jewett, J., "Physics for Scientists and Engineers, with Modern Physics," 6 t h Edition, Thomson Brooks/Cole, Belmont, CA, USA, 2004, pp. 835-837. Print.
6. Feldman, R.F., Chan, G.W, Brousseau, R.J., and Tumidajski, P.J., "Investigation of the Rapid Chloride Permeability Test," ACI Materials Journal, V. 91, No. 2, 1994, pp.246-255.
7. Gowers, K.R., and Millard, S.G., "Measurement of Concrete Resistivity for Assessment of Corrosion Severity of Steel Using Wenner Technique," ACI Materials Journal, V. 96, No. 5, 1999, pp. 536-541.
8. Sengul, O., and Gjorv, O.E., "Electrical Resistivity Measurements for Quality Control During Concrete Construction," ACI Materials Journal, V. 105, No. 6, 2008, pp. 541-547.
9. Morris, W., Moreno, E.I., and Sagiies, A. A., "Practical Evaluation of Resistivity of Concrete in Test Cylinders using a Wenner Array Probe," Cement and Concrete Research, Vol. 26, No. 12, 1996, pp. 1779-1787.
10. Kessler, R.J., R.F. Powers, and M.A. Paredes. "Resistivity Measurements of Water Saturated Concrete as an Indicator of Permeability," NACE International Corrosion Conference 2005, Houston, Texas, Paper 5261, pp. 1 -10 .
REFERENCE
1. ASTM Standards vol. 04.01,04.02, American Society for Testing and Materials, Philadelphia, PA, 2007.
2. AASHTO Standard T277, "Standard Method of Test for Electrical Indication of Concrete's Ability to Resist Chloride," American Association of State IIighway and Transportation Ofticials, Washington, D.C., U.S.A, 2005.
3. Mehta, P., and Monteiro, P., "Concrete Microstructure, Properties, and Materials," 3'd Edition, McGraw-Hill Professional, New York, NY, USA, 2006, 177 -182. Print.
4. Ewins, AJ. "Resistivity Measurements in Concrete," British Journal (fNDT, V. 32, No.3, 1990, pp. 120-126. Print.
5. Serway, R., and Jewett, 1., "Physics for Scientists and Engineers, with Modem Physics," 6th Edition, Thomson Brooks/Cole, Belmont, CA, USA, 2004, pp. 835-837. Print.
6. Feldman, R.F., Chan, G.W, Brousseau, R..T., and Tumidajski, PJ., "Investigation of the Rapid Chloride Permeability Test," ACI Materials Journal, V. 91, No.2, 1994, pp. 246-255.
7. Gowers, K.R., and Millard, S.G., "Measurement of Concrete Resistivity for Assessment of Corrosion Severity of Steel Using Wenner Technique," ACI Materials Journal, V. 96, No.5, 1999, pp. 536-541.
8. Sengul, 0., and Gjorv, O.E., "Electrical Resistivity Measurements for Quality Control During Concrete Construction," ACI Materials Journal, V. 105, No.6, 2008, pp. 541-547.
9. Morris, W., Moreno, E.!., and Sagiies, A.A., "Practical Evaluation of Resistivity of Concrete in Test Cylinders using a Wenner Array Probe," Cement and Concrete Research, Vol. 26, No. 12, 1996, pp. 1779-1787.
10. Kessler, R.J., R.F. Powers, and M.A. Paredes. "Resistivity Measurements of Water Saturated Concrete as an Indicator of Permeability," NACE International Corrosion Conference 2005, Houston, Texas, Paper 5261, pp. 1 ~ 10.

67
11. FDOT Standard FM5-578, "Florida Method of Test for Concrete Resistivity as an Electrical Indicator of Its Permeability," Florida Department of Transportation, 2004.
12. Julio-Betancourt, G.A, and Hooton, R.D., "Study of the Joule Effect on Rapid Chloride Permeability Values and Evaluation of Related Electrical Properties of Concretes," Cement and Concrete Research, V. 34, 2004, pp. 1007 - 1015.
13. Wee, T.H., Suryavanshi, A.K., and Tin, S. S., "Evaluation of Rapid Chloride Permeability Test (RCPT) Results for Concrete Containing Mineral Admixtures," ACI Materials Journal, V. 97, No. 2, March-April 2000, pp. 221 - 232.
14. Smith, K., "Evaluating Concrete Bridge Design Factors Using Concrete Resistivity," Penn State University Master's Thesis, 2002, pp. 92-113, pp. 151-152.
15. Stanish, K.D., Hooton, R.D., and Thomas, M.D.A., "Testing the Chloride Penetration Resistance of Concrete: A Literature Review," FHWA Contract DTFH61-97-R-00022 University of Toronto, Toronto, Ontario, Canada. June 31, 2000.
16. Berke, N. S., and Hicks, M.C., "Estimating the Life Cycle of Reinforced Concrete Decks and Marine Piles Using Laboratory Diffusion and Corrosion Data", Corrosion Forms and Control for Infrastructure, ASTM STP 1137, V. Chaker, ed., American Society for Testing Materials, Philadelphia, 1992.
17. Tikalsky, P., Schaefer, V., Wang, W., Scheetz, B., Rupnow, T., St. Clair, A., Siddiqi, M., and Marquez, S., "Development of Performance Properties of Ternary Mixtures: Phase I Final Report," Report No. Pool Fund Study TPF-5(117). Federal Highway Administration. Washington, DC. December 2007.
18. Rupnow, T. D., Schaefer, V. R., Wang, K., and Tikalsky, P. J., "Effects of Different Air Entraining Agents (AEA), Supplementary Cementitious Materials (SCM), and Water Reducing Agent (WR) on the Air Void Structure of Fresh Mortar," International Conference on Optimizing Paving Concrete Mixtures and Accelerated Concrete Pavement Construction and Rehabilitation, FHWA/ACI/ACPA, Nov. 6-9, 2007.
67
11. FDOT Standard FM5-578, "Florida Method of Test for Concrete Resistivity as an Electrical Indicator of Its Permeability," Florida Department of Transportation, 2004.
12. Julio-Betancourt, G.A, and Hooton, R.D., "Study of the Joule Effect on Rapid Chloride Permeability Values and Evaluation of Related Electrical Properties of Concretes," Cement and Concrete Research, V. 34,2004, pp. 1007 - 1015.
13. Wee, T.H., Suryavanshi, A.K., and Tin, S. S., "Evaluation of Rapid Chloride Permeability Test (RCPT) Results for Concrete Containing Mineral Admixtures," ACI Materials Journal, V. 97, No.2, March-April 2000, pp. 221 - 232.
14. Smith, K., "Evaluating Concrete Bridge Design Factors Using Concrete Resistivity," Penn State University Master's Thesis, 2002, pp. 92-113, pp. 151-152.
15. Stanish, K.D., Hooton, R.D., and Thomas, M.D.A., "Testing the Chloride Penetration Resistance of Concrete: A Literature Review," FHW A Contract DTFH61-97-R-00022 University of Toronto, Toronto, Ontario, Canada. June 31, 2000.
16. Berke, N. S., and Hicks, M.e., "Estimating the Life Cycle of Reinforced Concrete Decks and Marine Piles Using Laboratory Diffusion and Corrosion Data", Corrosion Forms and Control for Infrastructure, ASTM STP 1137, V. Chaker, ed., American Society for Testing Materials, Philadelphia, 1992.
17. Tikalsky, P., Schaefer, V., Wang, W., Scheetz, 8., Rupnow, T., St. Clair, A., Siddiqi, M., and Marquez, S., "Development of Performance Properties of Ternary Mixtures: Phase I Final Report," Report No. Pool Fund Study TPF-5(117). Federal Highway Administration. Washington, De. December 2007.
18. Rupnow, T. D., Schaefer, V. R., Wang, K., and Tikalsky, P. J., "Effects of Different Air Entraining Agents (AEA), Supplementary Cementitious Materials (SCM), and Water Reducing Agent (WR) on the Air Void Structure of Fresh Mortar," International Conference on Optimizing Paving Concrete Mixtures and Accelerated Concrete Pavement Construction and Rehabilitation, FHWA/ACIIACPA, Nov. 6-9,2007.