predicting customer satisfaction with product reviews
TRANSCRIPT
Yasir Hussain
PREDICTING CUSTOMER
SATISFACTION WITH PRODUCT
REVIEWS A comparitive study of some machine learning approaches
Faculty of Information Technology and Communication Sciences
M. Sc. Thesis
Dec 2019
ABSTRACT
Yasir Hussain: Predicting customer satisfaction with product reviews: A comparative study of some
machine learning approaches
M.Sc. Thesis, 49 pages, 0 appendices pages
Tampere University
Master’s Degree Programme in Computational Big Data Analytics
Dec 2019
In past two decades e-commerce platform developed exponentially, and with this advent, there came sev-
eral challenges due to a vast amount of information. Customers not only buy products online but also get
valuable information about a product they intend to buy through an online platform. Customers share their
experiences by providing feedback which creates a pool of textual information and this process continu-
ously generates data every day. The information provided by customers contains both subjective and ob-
jective text that contains a rich information regarding behaviour, liking and disliking towards a product and
sentiments of customers. Moreover, this information can be helpful for the customers who are yet to buy
or who are yet in decision making process. This thesis studies comparison of four supervised machine
learning approaches to predict customer satisfaction. These approaches are: Naïve Bayes, Support Vector
Machines (SVM), Logistic Regression (LR), and Decision Tree (DT). The models use term frequency
inverse document frequency (TF-IDF) vectorization for training and testing sets of data. The models are
applied after basic pre-processing of text data that includes the lower casing, lemmatization, the stop words
removal, smileys removal, and digits removal. We compare the performance of models using accuracy,
precision, recall, and F1-scores. Support Vector Machines (SVM) outperforms the rest of the models with
the accuracy rate 83% while Naïve Bayes, Logistic Regression (LR) and Decision Tree (DT) have accuracy
rate 82%, 78%, and 76%, respectively. Moreover, we evaluate the performance of classifiers using confu-
sion matrix.
Key words and terms: Customer Satisfaction, NLP, Review Mining, Machine Learning, Supervised Learn-
ing, Classification.
The originality of this thesis has been checked using the Turnitin OriginalityCheck service.

PREFACE
The research work presented in this thesis has been conducted at Faculty of Information
Technology and Communication Sciences (ITC), University of Tampere, Finland. With
the acceptance of this thesis, I complete my Masters’ in Computational Big Data Analyt-
ics. The thesis would have been difficult without support of my friends who played their
vital role.
I sincerely express my gratitude towards my supervisors Kati Iltanen and Tapio Nummi
for their advice, support and guidance throughout this thesis. I also thank my teachers
and other faculty members who were always supporting.
Finally, I am truly blessed to have a supportive family, and I thank from the core of my
heart for your care, and love. You guys are a reason of my motivation.
Tampere, 12/12/2019
Yasir Hussain

Contents
1 INTRODUCTION ...................................................................................................................... 1
1.1. PROBLEM STATEMENT ............................................................................................................... 2 1.2. OBJECTIVES OF THE STUDY ....................................................................................................... 3
2 RELATED WORK..................................................................................................................... 4
2.1 PRODUCT REVIEWS ........................................................................................................................ 4 2.2 REVIEW MINING ............................................................................................................................. 6 2.3 CUSTOMER SATISFACTION ............................................................................................................. 8 2.4 MACHINE LEARNING APPROACHES ............................................................................................. 12 2.5 CLASSIFICATION TECHNIQUES ..................................................................................................... 14
3 METHODOLOGY ................................................................................................................... 18
3.1 DATA PRE-PROCESSING ................................................................................................................ 18 3.1.1 Lower casing ..................................................................................................................... 19 3.1.2 Lemmatization ................................................................................................................... 19 3.1.3 Stop Word Removal ........................................................................................................... 20 3.1.4 HTML tag removal ............................................................................................................ 21 3.1.5 Smileys Removal ................................................................................................................ 21 3.1.6 Tokenization ...................................................................................................................... 22
3.2 BAG OF WORDS ........................................................................................................................... 22 3.2.1 TF-IDF Vectorizer ............................................................................................................. 23
3.3 MACHINE LEARNING FOR TEXT CLASSIFICATION ......................................................................... 23 3.3.1 Supervised Machine Learning techniques for text data ..................................................... 24
3.3.1.1 Text Classification ........................................................................................................................24 3.3.1.1.1 Naïve Bayes Classifier .......................................................................................................25 3.3.1.1.2 Support Vector Machine classifier .....................................................................................26 3.3.1.1.3 Logistic Regression Classifier............................................................................................27 3.3.1.1.4 Decision Tree Classifier .....................................................................................................28
3.3.1.2 Evaluation of Classifiers ...............................................................................................................29
4 DATA ....................................................................................................................................... 32
4.1 AMAZON DATASET: INSIGHTS ...................................................................................................... 32
5 RESULTS AND DISCUSSION ................................................................................................ 38
6 CONCLUSION......................................................................................................................... 42
7 REFERENCES ......................................................................................................................... 44
List of Figures
Figure 1. Word Cloud of Amazon reviews [Engler et al., 2015]. ................................................ 9
Figure 2. Opinion mining techniques. ........................................................................................ 13
Figure 3. An approach to convert non-grammatical words or phrases [Mushtaq 2017]. ........... 14
Figure 4. The pre-processing of text data. .................................................................................. 18
Figure 5. Lemmatization Process. .............................................................................................. 19
Figure 6. List of stop words........................................................................................................ 20
Figure 7. List of smileys. ............................................................................................................ 21
Figure 8. Classification process. ................................................................................................. 25
Figure 9. Support Vector Machine partition............................................................................... 27
Figure 10. Sigmoid Function. ..................................................................................................... 28
Figure 11. Confusion matrix. ..................................................................................................... 31
Figure 12. Amazon dataset format. ............................................................................................ 32
Figure 13. Distribution of overall rating for Amazon products. The x-axis cotains ratings and y-
axis contains counts. .................................................................................................................... 33
Figure 14. Distribution of average rating of product. ................................................................. 34
Figure 15. Average rating by customer. ..................................................................................... 34
Figure 16. Distribution of cases in labels '0' and '1'. .................................................................. 35
Figure 17. 𝑊𝑜𝑟𝑑 𝐶𝑙𝑜𝑢𝑑 of features appearing with label 1....................................................... 36
Figure 18. 𝑊𝑜𝑟𝑑 𝐶𝑙𝑜𝑢𝑑 of features appearing with label ‘0’. ................................................... 36
Figure 19. Word counts in the review. ....................................................................................... 37
Figure 20. Confusion matrix of Naive Bayes (NB) classifier. ................................................... 39
Figure 21. Confusion matrix of Support Vector Machines (SVM) classifier. ........................... 40
Figure 22. Confusion matrix of Logistic Regression (LR) classifier. ........................................ 40
Figure 23. Confusion matrix of Decision Tree (DT) classifier. ................................................. 41
List of Tables
Table 1. Bag of Words (BoW)................................................................................................... 23
Table 2. Summary of ratings. .................................................................................................... 33
Table 3. Summary of the results of all the classification techniques. ......................................... 38
Table 4. Actual and predicted values by the models trained on dataset for some test cases. ..... 38

List of Abbereviations
AWS Amazon Web Service
BoW Bag of words
CS Customer Ssatisfaction
DT Decision tree
FN False Negative
FP False Positive
IDF Inverse document frequency
kNN k-Nearest Neighbours
LR Logistic Regression
NB Naïve Bayes
NLP Natural language Processing
NLTK Natural Language Toolkit
NN Neural Network
SVM Support Vector Machines
TF Term frequency
TF-IDF Term frequency-Inverse docusment frequency
TN True Negative
TP True Positive
-1-
1 Introduction
In the past two decades, e-commerce developed exponentially around the globe. Consum-
ers not only buy products online but also look for valuable information shared by other
buyers about a product they intend to buy through an e-commerce platform. E-commerce
is bringing a huge change in people’s lifestyle, consumer behaviour, the business model
and the way how an organization works. In a very short span of time, e-commerce devel-
oped itself from the mechanism for online selling and buying to something like a system
that is developing ease of doing business, consumers’ trust, and providing comfort to
consumers by providing them desired products at their doorstep.
Companies operating around the globe are now collecting different type of infor-
mation that is coming from different sources. The most common information is the col-
lection of product reviews by enabling customers to review a product and share their ex-
perience. Online customer reviews are useful to the customers as well as the producers.
In customer point of view, the customer can have access to the information provided by
the customers who have already experienced that product. Moreover, the customers can
read some more not only about the product, but also about features of a product. Such a
huge information satisfies consumers’ need for information. In producer point of view,
they are using this information not only for enhancement of businesses but also for
decision making. The decision making that revolves around sales management, marketing
management, customer relationship management, new product designing and supply
chain management.
The collection of reviews is possible in several ways but in general the customer gets
space to rate the product and shares his experience. The structured data is the data that a
company collects and save it into a formatted repository. It goes into the database and the
company use it when needed. For example, it can be sales data, or account information,
ledgers, invoices, etc. The unstructured data is a type of information that a company
collects on an undefined model or it doesn’t follow a predefined model. Whereas, the
semi-structured data is a type of structured data that doesn’t follow any pre-defined
model, but somehow it contains the information that can be dealt as structured data. An
example of semi-structured data is the reviews: data that a company collects after
provision of good or services. The reviews data can be mixed data where the customers
give not only ratings but also their opinion if they liked the product or not, or which
feature of the product is appealing. Moreover, it also contains some customer information
about his age, location, the number of times he bought a product or service.

-2-
In e-business there is no direct communication between a customer and buyer, but
the products are provided by the hosts where there are different brands providing their
products. The reviews give benefits not only the hosts but also the company whose prod-
uct is being sold online. So, in the process not only the host can improve its system but
also the brand can improve the products and satisfy the customer needs and wants.
The famous saying, “customer is the boss of the market” indicates that all what an e-
commerce does is for the customer and customer satisfaction is the prior goal to get the
customer, to maintain the customer by fulfilling their needs and wants. The satisfaction
of a customer is the result the customer experience when a seller does all that it is neces-
sary to meet the expectation of a customer in a timely, and on consistent basis. The satis-
faction is ultimately something that can be conceived from the customer.
There are giants in the market doing businesses through e-commerce platforms. The
list is huge but prominent e-commerce firms are: Amazon, Ali Express, Zolando, Shopify,
and Walmart, etc. These firms are providing in a huge number of countries around the
globe. Amazon is leading these giants with net worth of US$10.073 billion1 providing its
virtual store around the globe.
Amazon provides a facility to the customer where they can share their experiences
through feedback and there are billions of product reviews available on amazon website
for research purposes.
Analysis of customer feedback using text data focuses more on models of prediction.
Not only the sentiments, but there are also some other aspects hidden in the text data
provided by the customer in the form of feedback. Customers are asked to provide the
ranking based on their liking or disliking also provided meaningful insight about a product
and on behalf of that ranking the potential customer can decide if the product is appealing
or not. The potential customer can also access the detail why it is ranked some number.
1.1. Problem statement
Analysis of customer feedback using text data focuses more on models of prediction. The
text information contains not only the customers’ sentiments, but also other important
aspects of information.
The focus on most of the researches is whether the text is subjective or ob-
jective, and if it is objective then it is positive or negative. Where there was work mainly
focusing on sentiment analysis, the researchers opted the subjective approach to deal with
the analysis and model building and predictions. However, there are still challenges to
deal with the text data.
1 https://en.wikipedia.org/wiki/Amazon_(company)
-3-
Our focus is on both subjective and objective text analysis [ Yassine & Hajj, 2010; Wilson
et al., 2004] where we are training models, testing and predicting on behalf of mixed
information (objective and subjective).
1.2. Objectives of the study
The objective of the study are as follows.
• To explore the customers’ insights from the data provided by Amazon, including
features from text analysis.
• Classifying the customers according to their level of satisfaction (satisfied, dissat-
isfied).
• Comparing some supervised machine learning techniques by analysing their per-
formances on mixed text information through different approaches.

-4-
2 Related Work
A considerable amount of research has been conducted so far, and it is still going on in
the field of Natural Language Processing (NLP). Text subjectivity analysis and sentiment
analysis is performed in year 1990 by the Computational Linguistic Community2 [Män-
tylä et al., 2018]. Textual analysis can be carried out by choosing one or mix of ap-
proaches such as vocabulary based, machine learning and rule based. In the following
sections, we explain the old approaches used for the purpose of measurement of customer
satisfaction and to deal with opinion mining.
2.1 Product reviews
The growth of e-commerce has generated mass information that is crucial to be dealt for
meaningful purposes and decision making. There is no proper reputation system in the
digitally mediated markets, consumers are not familiar with products, features, and the
quality of a product and there are trust issues due to virtual connectivity. The compensa-
tion of trust issues and lack of expected quality in digitally managed markets, several
retailers provide rating system for consumers where they can rate a product according to
the level of expectation it meets. Consumer can give his views and explain how it fulfilled
the expectation or not. The information sharing among consumers has potential to de-
crease uncertainty about quality of a product [Dellarocas 2003]. Reviews can play a vital
role in purchase decision of a customer as it makes him able to read about specification
of a product that he is willing to buy. Researchers declared customer reviews an un-in-
vestigated issue that makes it helpful for other customers in the process of decision mak-
ing [Mudambi 2010].
An important question for the firm is to realize that why customers will believe on
the information provided by strangers and how trust can be formed in consumers them-
selves. Credibility is an important aspect of information sharing, and it plays a vital role
in sales of products as it involves reliability and consumers trust. The Amazon provides
such a balanced platform for product reviews where a consumer not only posts reviews,
but also, he can vote the reviews if it is helpful or not. The voting is giving a clear direction
if consumers agree with the opinion that is made by a reviewer and the counts give a clear
direction and settles a pathway for decision making. The voting of helpfulness is an indi-
cation of the quality of reviews to other consumers [Dhanasobhon et al., 2007]. Moreover,
reviews having helpful votes have a strong impact on the decision making of a customer
2 https://compling.livejournal.com/

-5-
and the reviews have a stronger impact on less popular products as compare to more pop-
ular products and helpfulness of reviews has an ability to incorporate an addition in the
sale [Chen et al., 2006].
The ratings are usually displayed to the users of a product as an average of all the
ratings assigned by other consumers. These ratings are usually displayed on top of the
page where a consumer can assess the quality of the products and products are usually
given a polarized opinion of the product which is misleading [Hu, Pavlo, and Zhandg
2006]. Because the average rating doesn’t exactly show how many consumers have given
low and high ratings. The average rating may not play a positive role in decision making
as humans’ way of decision making may vary from what it is being explained by an av-
erage.
Online ratings are much more than that of numbers and they are playing their role as
a strong data of opinion. The ratings are good enough to give a strong insight about the
customer, the product and the market. The information leads to a useful information that
can be a strong reason why a product fails or successes in the market [Chevalier and
Mayzlin 2006]. Online product ratings have been researched covering various topics. The
important category of research is the examination of influence of the product rating on
decision making of consumers. Numerous studies found a significant positive influence
of the rating on decision making of customers that led to the purchase of a product [Lin
et al., 2011; Mauri and Minazzi, 2013]. The text in the reviews also contains a lot of
information that gives pertinent insights of customers’ behaviour, sentiments and satis-
faction.
Consumers can give their opinion about the product and its associated segments3 and
the length of product review is depending on the consumers’ sentiments. According to a
report [Woolf 2017], the statistics shows that there are the greatest number of reviews
containing 100-150 words, and it is followed by the reviews that have 150-200 words.
The report also shows that the average amount of characters in a review is 582.
Customers are usually motivated by several reasons to participate in giving online
reviews and feedback for a product that they purchase. The few reasons have been men-
tioned above. However, customers post reviews with this motive to help future customers
for the purpose of better decision making [Yoo and Gretzel, 2011]. Another reason of
posting online reviews is the fulfilment of the psychological needs of customers. Con-
sumers can give their opinion and they can show positive or negative sentiments, depend-
ing upon the experience they had. Another reason to post online reviews is to obtain a
positive reputation by getting votes for the helpfulness of the reviews that one posts
3 Associated segments are the connected elements with the product such as packaging, delivery etc.
-6-
[Kwok and Xie, 2016]. One more important reason of posting online reviews is showing
his relevance or making relevance in the community and in this way, people even post
fake reviews without even experiencing the product or service. The final reason is related
to the economic proliferation of reviewer. They may get some incentive for giving re-
views and it may depend on the quality of reviews or the quantity of reviews [Hennig-
Thurau et al., 2004].
2.2 Review mining
Data collection is an important part of any research to be conducted. Researchers have
used multiple ways to collect reviews from the databases or the link provided by the firm.
Generally, in an automated system the data is collected by a system web crawler. Hu &
Liu [2004] collected the data through a customized web crawler and stored the collected
set of reviews in a local database. Miao [2014] used the crawler by dividing the large-
scale job into several small jobs and then ran functions in parallel.
Amazon reviews doesn’t have a complete information of a product with its features,
but it has a code assigned to the product and a short description is also the data. It doesn’t
give a valid information, so it is difficult to mine product features through reviews. Re-
views usually have technical details about the product, but it is not necessary that the
consumer can understand. Apart from language analysis and sentiments, it is important
to extract the aspect of product that are attracting customers to buy the product. The re-
views are either saying something about the product or it can contain the features that a
reviewer is discussing about. The features of products are usually in the form of nouns or
phrases. The feature that is being extracted, it should have either a subject, an attribute of
the subject, or the attribute of part of the subject [Yi and Niblack 2005]. Sometimes the
product features are explicitly4 mentioned in the review and sometimes implicitly5 [Chen
2018]. Explicit features can be extracted by using a manual or automatic extraction pro-
cess. The features can be extracted manually by setting up the features’ vocabulary that
is related to a product feature and then extract those features from reviews. In this regard
several classes are to be assigned to the data and then extraction is made. Kobayashi et
al. [2005] developed a semi-automatic system for the purpose to collect the reviews and
the opinion of consumers. They collected the features, products name, and the opinion or
sentiments of consumers. However, it is quite unaffordable to use semi-automatic or
manual ways to extract features from data when the information is coming in huge num-
bers. In the era of big data, it is not possible to deal manually, however, researchers are
doing their best to mine the vast amount of data. Natural language processing provides
4 Explicit reviews are reviews where a feature of a product is mentioned e.g. camera
5 Implicit reviews are reviews where a product feature is being discussed passively.
-7-
methods to extract features from language. The features can be parts of speech, such as
subject, adjective or nouns, and syntactic analysis. Moreover, it is possible to extract the
information that is either subjective or objective.
Subjective information can be a discussion towards some topic or the opinion of con-
sumers towards a product. Moreover, the opinion can be either negative or positive as it
depends on the satisfaction of customer and utility of the product. For this purpose, both
machine learning techniques such as supervised, unsupervised, hybrid or lexicon ap-
proached can be employed [Mushtaq 2017]. Hu and Liu [2004] extracted features by
manually labelling the words that are appearing in the corpus. Subjectivity is the aspect
of language which is used to express sentiments or opinion, evaluation and speculation
of language being used in reviews. Wilson et al. [2004] gave a review of work in learning
subjective information from the document by using natural language processing. They
incorporated the study by generating subjectivity of the corpus, adjectives, and verbs etc
using similarity approaches. They extracted the features by examining the overall corpus.
Moreover, the authors showed the density of subjectivity effects strongly to the overall
text that how likely it is to be subjective. Ghose et al. [2011] formulated three basic con-
structs for the features based on textual information that have their impact on the average
level of subjectivity, the difference of subjectivity and objectivity of the corpus, the ability
of the corpus to be read and the spelling errors of the corpus. They also observed that
there were reviews having objective information which describes the product and its char-
acteristics.
Pang and Lee [2004] explained a technique to identify the objective and subjective
information available in the sentences. They applied the method in a set of data containing
reviews and they considered the objective information the body of the text and subjective
information that appears in the reviews. Ghose et al. [2011] considered objective infor-
mation as the information that appears in the description of the product and all other is
considered as subjective. Yassine and Hajj [2010] described subjective information as the
information that explain some emotions towards some event and objective is something
that doesn’t show any emotion, but it contains all other information. Where the emotion
is a state of mind that customers have after consumption of a product. Ekman [1992]
labelled a list of basic emotions: happiness, anger, sadness, disgust, surprise and fear.
Some researchers categorised emotions into few classes as per the requirement of their
research questions and theses classes are often positive or negative that describes the state
of mind of the reviewer or respondent. The emotion stating positive or negative are indi-
cating the level of strength associated with the emotions of respondent [Thelwall 2010].
Yassine and Hajj [2010] proposed a model for the unstructured language of online social
networks and developed a new lexicon approach to cover expression and sentiments of
-8-
online users. Our approach is to use the unstructured information by using mixed ap-
proach where both subjective and objective information is considered.
2.3 Customer Satisfaction
Customer satisfaction is the state of customer after using a product or service which ex-
plains if the product met the expectations of a customer or not. Customer satisfaction can
be viewed as a pattern of aspects and associated sentiments and this is due to the depend-
ence of customer satisfaction on the aspect of a product or service [Farhadloo et al., 2016].
Moreover, customer satisfaction is the fulfilment of needs [Oliver 1997] and the product
that is meeting the expectation of the customers is the fulfilment of needs.
A customer can give his feedback not only in the form of texts but also, he can rate
the product. A lower rating is usually associated with dissatisfaction and a high rating
stands for satisfaction. Product rating is one of the pertinent ways to judge the satisfaction
level of a customer and its influences have been studied [Banerjee and Chua, 2016]. The
biggest strength of assigning ratings to a product is that it directly states the satisfaction
level of a customer [Zhao et al., 2019]. The product rating is an expression of satisfaction
and it is not justifiable to say that it is the assessment of quality. Analysis of customer
satisfaction is the central idea in marketing research which measures satisfaction of each
customer on an individual basis [Yi, 1991]. Customer satisfaction is the defined function
where CS is depending on the expectation of customer and performance of a product
[Fornell et al., 1996]. The customers expectation can be hypothesized as the probabilities
of how a product will affect a customer where a positive effect stands for desired proba-
bilities. The expectations can’t be idealized as the post purchase phenomena, it is a pre-
purchase phenomenon [Engler et al., 2015] and the customer executes it after experienc-
ing the product.
Engler et al. [2015] searched through the complete text information of Amazon online
reviews to generalize that online product rating reflect customer satisfaction. For this pur-
pose, they collected reviews from 1994 to 2014 containing 7,834,166 cases. They visu-
alized the features of data by creating a word cloud from 10 percent randomly chosen
cases. The word cloud is given in Figure 1.

-9-
Figure 1. Word Cloud of Amazon reviews [Engler et al., 2015].
The unstructured form of data provides the information of the customers’ perception
and their experiences, product highlights, highlights of the product features, other ser-
vices, such as product delivery, packaging, and other related issues. The information that
is provided by the customer is not only the experiences of the customers, but also the
suggestions that how a product service can be improved. Moreover, by using this infor-
mation the product or service can be improved and the marketing strategies can be devel-
oped as well. Zhao et al. [2019] predicted the customer satisfaction using the technical
attributes of online reviews and feedback and the involvement of customers in an online
community. There are some major challenges that need to be addressed to link the rela-
tionship between product ratings and the textual information provided in the reviews. The
reviewers mention the technical attributes (features) in the reviews and these attributes
explain the variation occurring in the product ratings. The attributes or the features exist-
ing in the customer review can have a significant effect on the ratings [Geetha et al.,
2017].
There are several researches conducted to predict the behaviour of customers using
online reviews data of hotels. Zhao et al. [2019] conducted research to predict the cus-
tomer behaviour and their overall level of satisfaction with hotels. Customers’ behaviour
is one of the important fields of research in marketing that is being conducted to investi-
gate the individual customers or a segment of customers fulfil their needs and wants when
an organization dispose its ideas, product or services. It refers to the behaviour or actions
of customers in the marketplace that how they act and respond strategies. Customers’
behaviour is influenced due to marketing factors: price, promotion, packaging, and posi-
tioning of a product; personal factors: age, gender, education level; psychological factors:
perception of the product or service, fame of a brand in the area or among SECs6. Cus-
tomers behaviour in an online environment can be different from one another and they
6 SEC is the categorising people according to their economic position in the society.
-10-
have sentiments and opinion towards a product accordingly. Schuckert et al. [2015] as-
serted that different customers can have different behaviour and perception which is de-
pending upon their background such as to which language group they belong to. Moreo-
ver, the behaviour of customers is depending on purpose why they are travelling or using
the hotel services [Xu et al., 2019].
Product quality is also an important factor in customers’ satisfaction. The assessment
of quality can simply be that if a product is fulfilling the needs of a customer or not, and
if it is up to the standard that a customer wants or not. Researchers have conducted nu-
merous studies where they investigated not only the lexicon, subjectivity and objectivity
but also hidden factors such as quality. In most of the studies, the researcher assumed that
the baseline of the product quality can be assessed by product ratings. However, it is
found with empirical evidences that rating doesn’t have an enough role in the reflection
of true product quality [Koh et al., 2010].
Söderlund [1998] studies the customer satisfaction and its effect of customer behav-
iour under two conditions: low and high level of satisfaction. They examined three dif-
ferent variable such as word of mouth, feedback and loyalty of customers. They con-
cluded that not only the differences exist but also differences exist between the difference
in the sense that different patterns develop for each variable that is pondered as behav-
ioural variable.
Kang and Park [2014] studies the review-based measurement of customer satisfaction
by using sentiment analysis and VIKOR approach on mobile services. VIKOR is the
ranking method of multicriteria decision making approach and suggested that customer
satisfaction can be measured by using sentiment analysis that simultaneously considers
maximum group satisfaction and individual regret. They worked in two stages, at first
stage they implemented sentiment analysis and then using sentiments scores they calcu-
lated the scores for each attribute. At second stage they applied VIKOR to measure the
customer satisfaction. They concluded that the customer review-based approach saves
time and effort captured the real voice of customers.
Engler et al. [2015] worked on understanding of online customers ratings by imple-
menting a customer satisfaction model. The analysed the data collected from Ama-
zon.com where the language of text was German. They argued that the customer rating is
the reflection of customers’ ratings. They introduced a customer satisfaction model which
https://www.ecnmy.org/learn/your-society/status-in-society/socio-economic-class/

-11-
features customers’ expectations before purchase and actual product performance as fac-
tors of ratings. They concluded that both factors: pre purchase expectations and actual
products performance have significant influence on product ratings.
Xu and Li [2016] investigated the antecedents of customer satisfaction and dissatis-
faction towards various types of hotels by using latent semantic approach of text mining.
They used the customer reviews and analysed the determinants that create the customers
satisfaction or dissatisfaction towards the services provided by the hotels. They also pro-
vided the clues that how a hotelier can improve the services and satisfy the customers’
needs.
Farhadloo et al. [2016] modelled customer satisfaction from unstructured data using
Bayesian approach. They focused mainly on the aspects that are associated with the prod-
uct and measured the overall customer satisfaction from the text that is written in free
form. They converted the unstructured data into semi-structured form of data by applying
the sentiment analysis based on aspects. They collected the data from TripAdvisor7 and
the empirical approaches applied on the data gave effective results with accuracy rate
88.3 percent.
Ting et al. [2017] studied customer experiences posted on Yelp8 impact the hospital-
ity industry. They combined the programming and data mining approaches to analyse
customer review posted on Yelp. The study aimed to deconstruct the hotel guests’ expe-
riences and its association with satisfaction rating. Findings show that there are many
important factors involved in customers reviews that carry different weights and find the
meaningful semantic composition inside the customer reviews. Moreover, the opted ap-
proach can utilize the big data analytics to find different aspects that are not yet studied
in the hospitality industry.
Zhao et al. [2019] predicted overall customer satisfaction by using data collected from
hotel online textual reviews. Using the online data, they studied the overall satisfaction
of customers using the technical attributes of the reviews and concluded that a higher
level of subjectivity and longer length of reviews lead to the dissatisfaction of customers.
Moreover, they concluded that the involvement of customers in the review community
influences the overall satisfaction of customers.
7 Trip Advisor is the online marketplace where one can book a complete tour.
https://www.tripadvisor.com/ 8 https://www.yelp.com
-12-
Sezgen et al. [2019] conducted study to measure the customer satisfaction by using
text mining approaches. They investigated the key drivers of dissatisfaction and satisfac-
tion of customers towards two distinct carriers: low and full service. They collected 500
passengers’ reviews where 50 different airlines are reviewed. They concluded that the
fundamental difference in customers’ satisfaction and dissatisfaction is based on the
model and cabin class. Another factor that derives satisfaction of customers is the friend-
liness of cabin crew whereas deficiency in hygiene factors is the major factor of dissatis-
faction among customers.
Jung and Suh [2019] worked on the voice of employees by implementation of text
mining approaches to identify and analyse the job satisfaction factors from online em-
ployee reviews. The collected 35,063 online employee reviews for identification of job
satisfaction from Jobplanet9 using latent Dirichlet Allocation (LDA) and conducted a se-
ries of analyses based on factors under study. They measured the sentiment analysis of
employees as well as the importance of each job satisfaction factor. They concluded that
senior management is the most important factor that plays a dominant role in the satisfac-
tion of employees.
Most of the researches are in the field of sentiment analysis where it has been analysed
that how customers react after consuming a product or service. However, our focus is on
the level of satisfaction of customers, which is being predicted using machine learning
approaches. When considering sentiment analysis, our research is closely related to Ngu-
yen et al. [2018], but we are working on customers’ satisfaction.
2.4 Machine Learning Approaches
There are several methods that can be utilized for classification and predictions of opin-
ion. Two of the most important techniques that have been used for opinion mining and
prediction are machine learning and lexicon-based approach. Another technique that has
been widely used is hybrid technique that combines both machine learning and lexicon-
based approach, and it optimizes the solutions [Cambero 2016].
The machine learning approach depends on classification and text analysis. The pur-
pose of text analysis is business decision making and strategic moves, and for this purpose
it needs text pre-processing. Initially, it needs some data to train a model, which can later
be used for the purpose of prediction on a new set of data without any labels [Mushtaq
2017]. The machine learning approach is further divided into following two methods.
1. Supervised Learning: Supervised learning reveals patterns, and relationships from
a labelled training dataset.
9 https://www.jobplanet.co.kr/

-13-
2. Unsupervised Learning: Unsupervised learning is applicable to infer patterns
from a dataset when the dataset is not labelled.
The tree structure of classification techniques is given below in Figure 2 and these
techniques are discussed in details in section 2.5.
Figure 2. Opinion mining techniques.
Our focus is on supervised learning.
Opinion can be classified in terms of levels that how the text will be dealt. Some of
them are discussed below. The classification can be carried out using sentence level clas-
sification. Using sentence level classification, the opinion of every single sentence is an-
alysed [Turney 2002]. It assumes that there is a single opinion extracted from each sen-
tence. Sentence level classification is needed when aim is to analyse more than one opin-
ion in a document. Moreover, sentences are treated in a different way for classification
purposes.
Another level of classification is document level classification when aim is to classify
the opinion of an overall document. It considers whole document as an entity and it is not
suitable when there are more than one opinion in a document [Mushtaq 2017]. The
method is unrealistic because it is possible for a document to contain more than one opin-
ion and in this scenario, it is not viable to carry out document level classification.
The classification of opinion can also be carried out using user level opinion analysis.
It is not an often-used case, but the researchers carried it out to analyse the behaviour of
neighbour user. Tan et al. [2011] worked on user-level sentiment analysis by using social
media information where the main aim of the research is to conduct the measurements to
find the connectedness of customers. Moreover, they also aimed to investigate that how
connectedness affects opinion of users.
Another level of classification is aspect level classification. This method highlights
the opinion in a sentence towards the aspects of features of a product. For example, “The

-14-
speaker of mobile is great”, here in this sentence, the speaker is an aspect that provides
the ground for an opinion to be formed. The level can be implemented on sentence each
sentence of phrase. The method works on aspect level by finding out the target and then
the opinion. Previously discussed level focus on document, paragraph or sentences. The
analysis can be attained by finding out the difference between polar phrases and then
defining the sentiment from others [Wilson 2005]. Aspect level classification is mainly
considered best when the focus is on product or service. The models built for the purpose
of opinion mining and product analysis about some product or services are based on as-
pect level classification [Chen et al., 2013].
Figure 3 shows the process of aspect level classification and identifies how aspects
of reviewed product based on opinion of customers can be extracted. In the features’ se-
lection, the models collect the features of a products reviewed by the reviewer.
Figure 3. An approach to convert non-grammatical words or phrases [Mushtaq 2017].
2.5 Classification Techniques
In opinion mining, classification techniques are of core importance and there are several
researches done based on it. The main purpose of classification techniques is to differen-
tiate between classes such as positive, negative and neutral [Pang et al., 2008]. In super-
vised learning, initially the models are trained using classifiers to classify opinion of a
document. The documents under study have some key features or topic related words.

-15-
The comparison of classification techniques is discussed below in the light of previous
researches and related work.
Pang, Lee and Vaithyanathan [2002] proposed sentiment analysis classification
method for the first time. They used machine learning methods on a set of movie reviews
data. They analysed the data with Naïve Bayes, Max Entropy and Support Vector Ma-
chines (SVM) models to sentiment classification. Features were extracted from data using
unigram and bigram. In their experiment, SVM for unigram feature extraction product
best results with accuracy 82.9 %. Mullen and Collier [2004] performed classification
approaches to classify consumer sentiment. They implemented classification approaches
on the data coming from the purchase of jewellery, clothes and shoes. They performed
hybrid SVM, Logistic Regression (LR), Decision Tree (DT), and Naïve Bayes and com-
pared the results. In the study SVM produced the best results with 86 % accuracy rate.
Lilleberg, Zhu, and Zhang [2015] performed a study based on comparison of features
extraction methods i.e Word2vec and TF-IDF using SVM. The compared the classifica-
tion results that are performed with stop words and without stop words. The accuracy rate
88 % appeared when SVM is performed on TF-IDF without stop words. He et al. [2000]
conducted a comparative study on Chinese text categorization methods. Based on re-con-
structed People’s Daily10 corpus, they evaluated k Nearest Neighbour, Support Vector
Machines, and Adaptive Resonance Associative Map (ARAM). They concluded that all
the methods are producing satisfactory results and ARAM is comparatively doing better
with better generalization capability on relatively small and noisy training set. Balamuru-
gan et al. [2007] performed a comparative study of data mining approaches for suspicious
email detection. They implemented four classification approaches Neural Network (NN),
SVM, Naïve Bayes and DT for the purpose of classification. They had a set of 10000
emails, and they parted emails into training and testing sets equally. They concluded that
ID3 works better for the purpose of suspicious email detection where the accuracy 99.4%
has been measures. Bhavitha et al. [2018] conducted sentiment analysis and compared
the various machine learning techniques and lexicon methods. They concluded 74% ac-
curacy for SentiWordnet method, and 86.40% for SVM method.
Aggarwal and Zhai [2012] focused on a specific amendment which is applicable for
the purpose of text classification. For the purpose, they used DT, Rule based Classifier,
SVM classifiers, Neural Network classifiers, Bayesian (Generative) classifiers, genetic
algorithm-based classifiers, and Nearest Neighbour classifiers. They explained the feature
selection methods and described the methods of text classification. In same year, Korde
and Mahender introduced text classifier and compared the classifiers based on criteria
like principle, performance and time complexity. Colas and Brazdil [2006] compared the
10 http://en.people.cn/ Chinese news agency

-16-
old classification approaches and text categorization. They also found the strengths and
weaknesses of algorithms. For the purpose of analysis, they chose SVM, Naïve Bayes
and k-Nearest Neighbour (kNN) algorithm. The aim of research was to examine that how
a number of attributes of feature space affect the performance of algorithm. They ran
experiment on 20newsgroups11 to find the best value of parameters. The concluded that
at first Naïve Bayes and performed well and are much faster than SVM in performance.
Secondly, as compare to SVM, kNN and Naïve Bayes are very simple to preform, how-
ever, SVM has more theoretical implications.
Mamoun and Ahmed [2014] highlighted the algorithms used for the purpose of clas-
sification. They performed a comparative study where they compared a different type of
classification approaches to the text categorization. They compared several algorithms
such as SVM, K Nearest Neighbour, Naïve Bayes, Distance-Based, J48, C5.0 and Roccio.
They used these algorithms for Arabic document classification. The concluded that SVM
outperforms other algorithm and give generalization accuracy 90%. Hemiedi et al. [2015
conducted study to automate the Arabic text categorization. The compared the five best
classification algorithms for the purpose of text classification. They performed Naïve
Bayes classifier, SVM, K-Nearest Neighbour, DT, and Decision Table Classifier. The
collected the dataset from Diab Abu Aiadh, the Arabic Articles that are publicly available.
The dataset contains 2700 document of different categories such as arts, economics,
health, law, literature, politics, religion etc. Moreover, they checked the scalability and
accuracy of data mining tools: Weka12 and RapidMinor13. The results showed that SVM
performed better as compare to other algorithm included in the study. They also recom-
mended RapidMinor because of its scalability and effectiveness when Arabic text is being
categorized.
In a study conducted in 2015 by Vala and Gandhi compared the classifier and dis-
cussed feature selection approaches. They compared kNN, Neural Network (NN), SVM,
DT and Naïve Bayes and differentiated their pros and cons. They concluded that as com-
pared to other algorithms SVM performs better in terms of accuracy, speed of learning,
speed of classification etc. They also concluded that high dimensionality is a real issue
on classification of text, thus they performed feature selection method for the purpose to
deal with high dimensional data. Islam et al. [2017] conducted a study to compare differ-
ent type of approaches to categorize the Bengali documents. They implemented well-
known supervised learning approaches such as Naïve Bayes, SVM, and Stochastic Gra-
dient Descent (SGD). They indicated that besides classifiers, feature extraction is also
11 https://www.kaggle.com/crawford/20-newsgroups
12 https://www.cs.waikato.ac.nz/ml/weka/
13 https://rapidminer.com/
-17-
important to deal with classification purposes. They collected text documents from vari-
ous Bengali newspapers such as Prothom-alo14, BDNews15, and DailyKalerKantha16 etc.
They analysed performance of classifier on predicting a document against twelve catego-
ries. They implemented Chi-square and Normalized TF-IDF methods for feature selection
process. They compared the F1-scores of algorithms and concluded that SVM outper-
forms other algorithm when performed using normalized TF-IDF and its accuracy rate is
93%.
14 https://prothom-alo.com,
15 https://bdnews24.com
16 https://dailykalerkantha.com
-18-
3 Methodology
The methodology section includes the methods used in this thesis.
3.1 Data pre-processing
Pre-processing of any data is important when dealing with text analysis. It includes the
choices of reviewer how he is going to use the language and what sort of characters he is
going to put in the review. The actual purpose of pre-processing is to bring data in form
that is predictable and able to be analysed. Steps such as removal of stop words and word
stemming [Porter 1980] are applied to the document to reduce the noisy information.
Most of the data is found to be in an unstructured format and it appear when the limits are
not decided within which data need to be provided. The unstructured form of data often
comes by emails, reviews, newspapers and social media such as YouTube reviews, Face-
book comments or tweets etc. The pre-processing included various types that needs to be
dealt before moving towards actual technique needed for analysis. Pre-processing of text
document includes steps such as stop words removal and stemming of words [Porter,
1980]. According to the previous researches conducted to deal with textual information,
pre-processing improves the retrieval of text, summarization and classification [Yang &
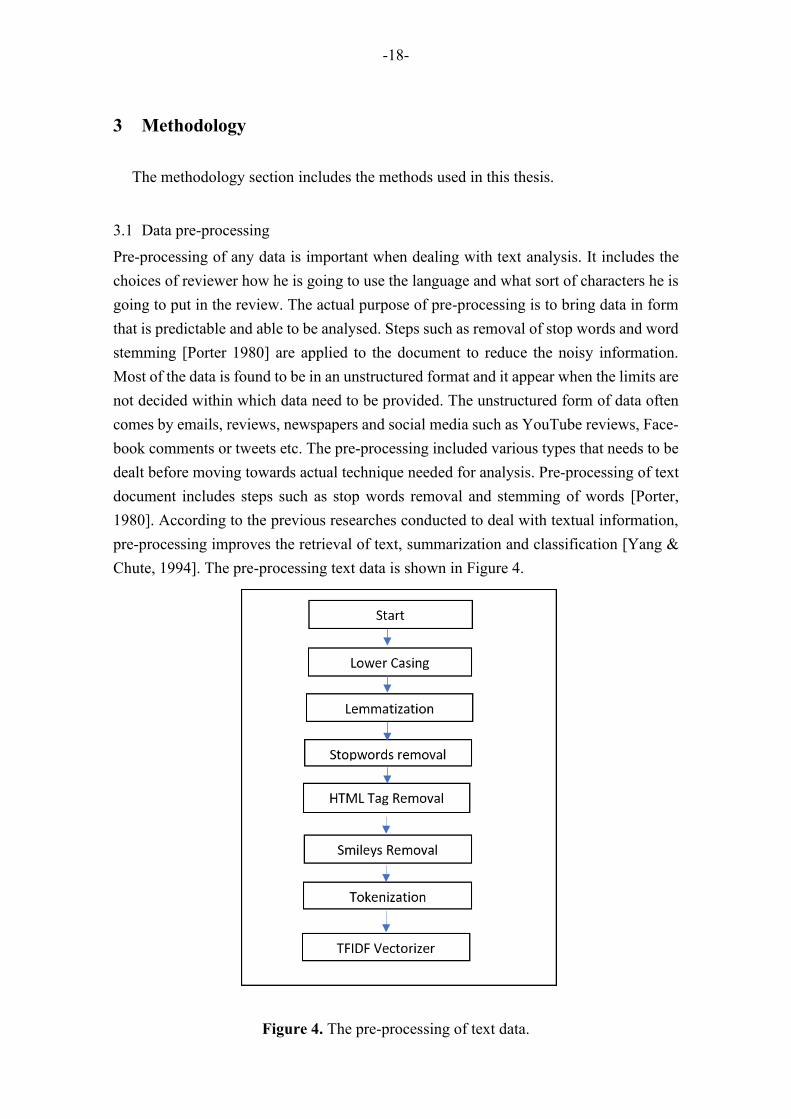
Chute, 1994]. The pre-processing text data is shown in Figure 4.
Figure 4. The pre-processing of text data.
-19-
In the field of Natural Language Processing (NLP), the techniques that are used to
normalize the text, words, and documents are numerous. Some of these techniques are
explained that are important in the context of this thesis. In order to deal with pre-pro-
cessing, we are going to use Natural Language Tool Kit (nltk)17. The main approaches
that we will use in this thesis are explained here.
3.1.1 Lower casing
Lower casing is one of the basic methods used in text pre-processing. It is important
because when dealing with the text, the environment is case sensitive, and it is difficult
to appear when searched for a word or character. So, when all the text is lower-cased, it
will appear on search when it is required. In the dataset one of the respondents reviewed
a product as follows;
“Great Energy Level VI travel charger! Very compact and fast charging. It is the
most convenient product I never seen before ! I like it. I am very happy with this seller.
Order packed very well and ship fast .Great energy level VI slimmest travel charger .
Courteous service !”
In above mentioned review, there are several words where there are upper cases
words that can cause difficulties to remove noisy information and it is difficult to find
the frequency of a word and same word will give different type of output and classifier
may lose some concomitant features.
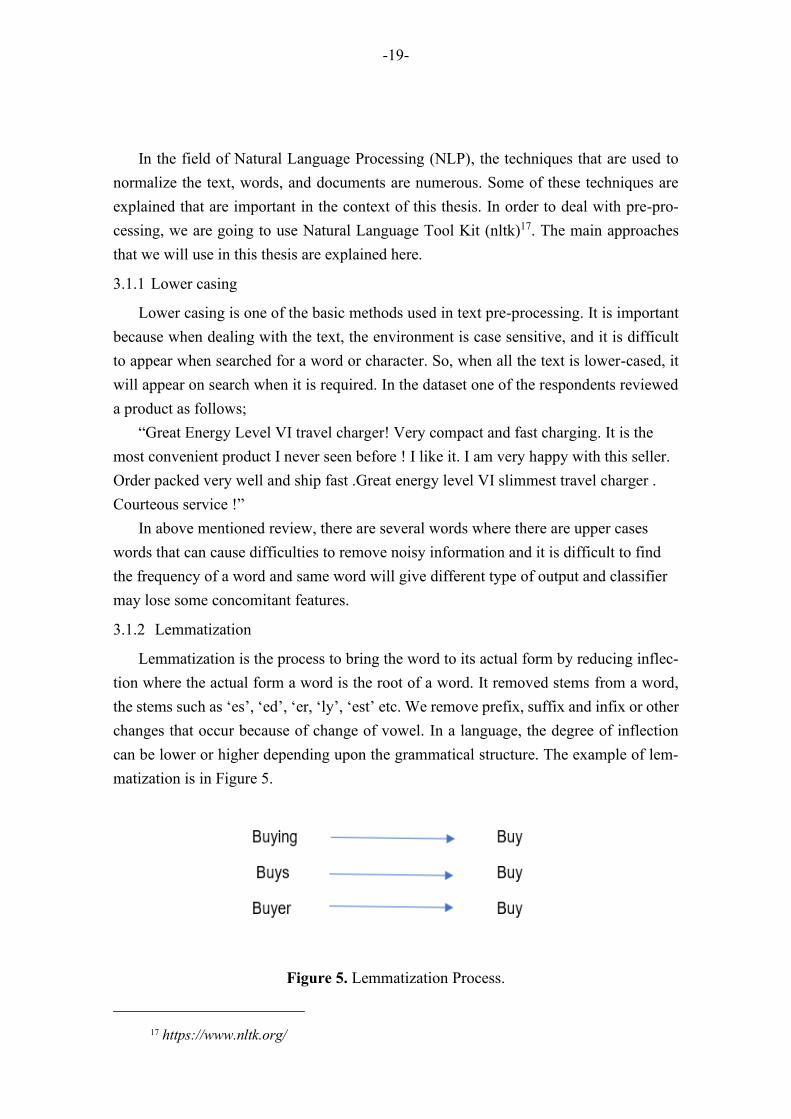
3.1.2 Lemmatization
Lemmatization is the process to bring the word to its actual form by reducing inflec-
tion where the actual form a word is the root of a word. It removed stems from a word,
the stems such as ‘es’, ‘ed’, ‘er, ‘ly’, ‘est’ etc. We remove prefix, suffix and infix or other
changes that occur because of change of vowel. In a language, the degree of inflection
can be lower or higher depending upon the grammatical structure. The example of lem-
matization is in Figure 5.
Figure 5. Lemmatization Process.
17 https://www.nltk.org/
-20-
Similarly, “Order packed very well and ship fast” “order pack
very well and ship fast”. Researchers have used suffix stripping algorithm to deal with
lemmatization of text data because of its wide use. However, in some cases the algorithm
may not work due to low performance especially when dealing with the second and third
forms of verbs such as drink, drank and drunk. It is still being used due to its implemen-
tation ease in automatic text processing [Scott and Matwin 1999]. Martin Porter intro-
duced Porter Stemmer [Porter 1980] that is a technique to remove inflexional endings and
common morphological terms in English. The algorithm is being used for normalization
of text when it is retrieved from the system.
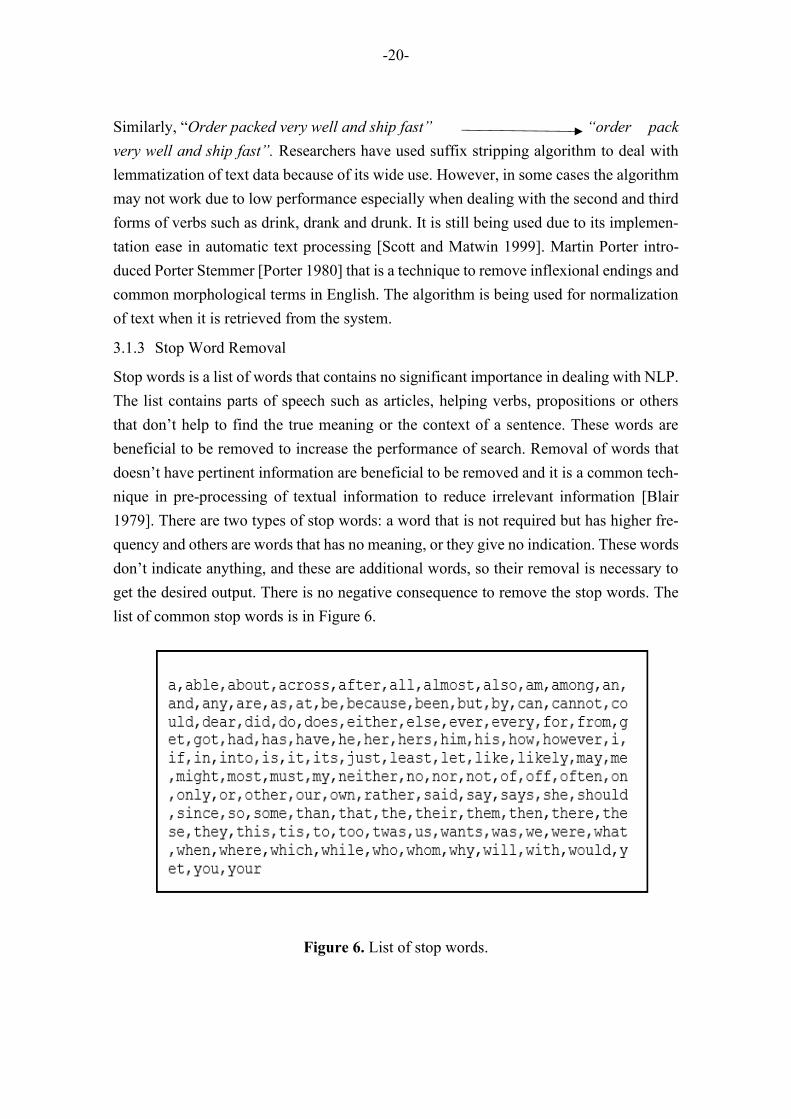
3.1.3 Stop Word Removal
Stop words is a list of words that contains no significant importance in dealing with NLP.
The list contains parts of speech such as articles, helping verbs, propositions or others
that don’t help to find the true meaning or the context of a sentence. These words are
beneficial to be removed to increase the performance of search. Removal of words that
doesn’t have pertinent information are beneficial to be removed and it is a common tech-
nique in pre-processing of textual information to reduce irrelevant information [Blair
1979]. There are two types of stop words: a word that is not required but has higher fre-
quency and others are words that has no meaning, or they give no indication. These words
don’t indicate anything, and these are additional words, so their removal is necessary to
get the desired output. There is no negative consequence to remove the stop words. The
list of common stop words is in Figure 6.
Figure 6. List of stop words.
-21-
Stop words help us to reduce the feature dimensionality. We use same library nltk
to remove stop words by additionally adding a function of corpus with python 3.7.0.
3.1.4 HTML tag removal
Most of the data is coming from online sources and there is possibility that it might con-
tain the html tags in the paragraph on corpus. These tags may have strong effect on the
final output as it can’t be decided how frequent they are in the data. In reviews data,
people often discuss about some reference product. For example, somebody saw a product
online and ordered it online but when received it is totally different from the one that is
ordered. So, he may complain about the product and give tag as a reference. It can also
be when referring a product to fellow buyers or scrappers. The example from the dataset
is as follows,
“Did not function at all. Device was receiving power (there is no power indica-
tor LED but you could see the SPDIF port light up when the device was plugged in)
but was unable to get any video output from the device at 720p or 1080p resolution
inputs.<br /><br />Ended up purchasing this device instead and it functions per-
fectly with no issues: http://www.amazon.com/gp/product/B00BIQER0E”.
These tags are unnecessary, and they don’t contain any vital information to be taken
under consideration. To deal tags we can use BeautifulSoup library in python to remove
theses tags.
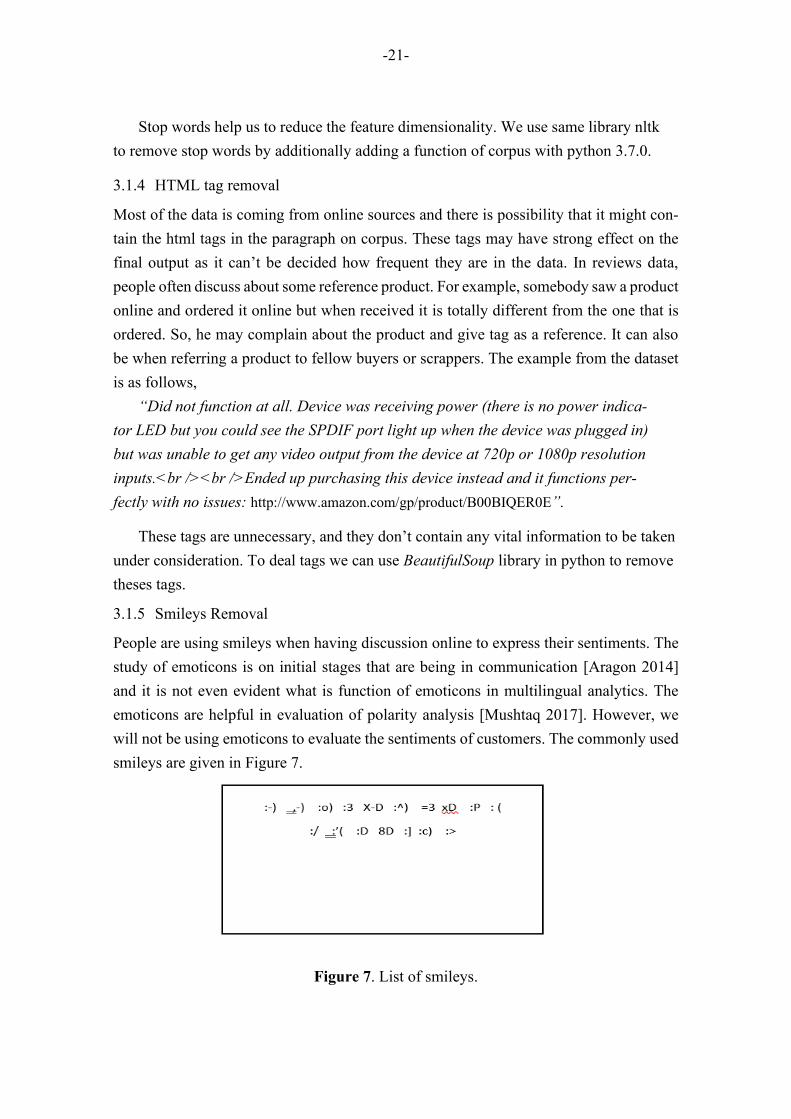
3.1.5 Smileys Removal
People are using smileys when having discussion online to express their sentiments. The
study of emoticons is on initial stages that are being in communication [Aragon 2014]
and it is not even evident what is function of emoticons in multilingual analytics. The
emoticons are helpful in evaluation of polarity analysis [Mushtaq 2017]. However, we
will not be using emoticons to evaluate the sentiments of customers. The commonly used
smileys are given in Figure 7.
Figure 7. List of smileys.

-22-
3.1.6 Tokenization
Tokenization is a procedure that breaks a sentence or sequence of words into pieces such
as keywords, words, and symbols etc. Tokenization can be done for a word or a group of
words. Moreover, a paragraph can be broken up into sentences or individual words.
Simply, in a paragraph under study, tokenization splits strings or tokenize words. To-
kenization deals acronyms and abbreviations in a bit different. For example, A.C.C is an
abbreviation and tokenization will split it as A, B and C. However, Smart Tokenization
can prevent this matter without losing the actual state of abbreviation or an acronym.
There are several methods to deal with tokenization and some of them are as follows.
• Sentence Tokenization: By using sentence tokenization, we can
split whole sentence into strings. We use Sent_tokenize in nltk library to
tokenize the sentences. Moreover, it can tokenize whole sentences or group
of sentences. Here is an example of sentence tokenization. One of the re-
viewers reviewed a product as, “Great price. Easy to install.” And after
tokenization it shows like this, “[‘Great price. Easy to install.’]
• Word Tokenization: Word tokenization splits the sentence into
number of strings. For example, “Great price. Easy to install.” Is to-
kenized by using word_tokenize function of nltk library in python 3.7. So,
after tokenization its output is, [`Great´, `price`, ‘Easy’, ‘to’, ‘install.’].
The splitting can be performed by using space delimiter. The tokenization
is performed in whole document to practice this exercise.
3.2 Bag of Words
Bag of words (BoW) is the extraction of words or features from a corpus to be used for
modelling purposes such as machine learning and data mining algorithms. BoW explains
the representation of words with the number how many times a word occurred in a docu-
ment. It measures the vocabulary in a document or the presence of a words in a document.
This is a very common technique to measure the occurrences of words in a document and
its occurrence can be presented with counts or it can be visualized. The proper represen-
tation of words in a collection of documents can also be seen with bag of words. The
implementation of BoW on tokenized documents makes it easy to understand and then
implement the modelling technique. A review is taken as an example from the dataset to
explain the BoW. One of the reviewers reviewed a product as, “It works as advertising”.
Now converting this document in the bag of words will show a frequency in the following
way. An example of BoW is in Table 1.

-23-
Table 1. Bag of Words (BoW).
Words counts
It
1
Works 1
As
1
Advertising 1
3.2.1 TF-IDF Vectorizer
TF-IDF Vectorizer is the counting the number of times a term occurs in a document.
Scenario is explained above; however, it has two techniques that researcher has used in
abundance.
Term Frequency (TF): TF explain the significance of a model in a document by the
number of times it appears in a document. It ignores the meaning of a words, but it fo-
cuses more on the appearance of a word in a document. Term frequency is the ratio be-
tween number of words a word occurs and total number of words in a document.
𝑇𝐹 =𝐹𝑟𝑒𝑞𝑢𝑒𝑛𝑐𝑦 𝑜𝑓 𝑎 𝑤𝑜𝑟𝑑 𝑖𝑛 𝑎 𝑑𝑜𝑐𝑢𝑚𝑒𝑛𝑡
𝑇𝑜𝑡𝑎𝑙 𝑁𝑢𝑚𝑏𝑒𝑟 𝑜𝑓 𝑤𝑜𝑟𝑑𝑠 𝑖𝑛 𝑎 𝑑𝑜𝑐𝑢𝑚𝑒𝑛𝑡 . (1)
Inverse Document Frequency (IDF): IDF explain that uniqueness of a word in a doc-
ument. It calculates the scores that highlight the distinction of a term in a document.
𝐷𝐼𝐹 = 𝑙𝑜𝑔(𝑇𝑜𝑡𝑎𝑙 𝑛𝑢𝑚𝑏𝑒𝑟 𝑜𝑓 𝑑𝑜𝑐𝑢𝑚𝑒𝑛𝑡𝑠
𝑁𝑢𝑚𝑏𝑒𝑟 𝑜𝑓 𝑑𝑜𝑐𝑢𝑚𝑒𝑛𝑡𝑠 𝑤ℎ𝑒𝑟𝑒 𝑎 𝑤𝑜𝑟𝑑 𝑒𝑥𝑖𝑠𝑡𝑠). (2)
TF-IDF is the multiplication of TF and IDF. It reduces values of words that commonly
occur in a document. The rarity of words is explained by TF-IDF in a document i.e. higher
the TF-IDF score, rare is the word. It puts higher weights on rare terms and decreases the
weights of common term that occur in a document so that uniqueness of a document oc-
curs in results [Sidorova et al., 2008].
3.3 Machine Learning for text classification
The extraction of pertinent information from document or textual information for decision
making with the use of statistical techniques is referred to as machine learning from text
data. The methods in machine learning are used for automatically modelling the data that
-24-
is coming from different sources. Machine learning algorithms work as an engine that are
turning data into different models. It finds the natural patterns in data and provides bene-
ficial insights. Machine learning has two types supervised and unsupervised and here we
will discuss the former one.
3.3.1 Supervised Machine Learning techniques for text data
Supervised machine learning techniques are the methods that can manipulate the training
set of data. It learns the functions of classification or regression to compute the predictions
on the set of data that is unseen or yet to come in databases. Supervised learning is nor-
mally a set of techniques where we have input data (x), output data (𝑦) and train an
algorithm to learn the relationship or mapping from input to the output data. Formally,
we denote
𝑦 = 𝑓(𝑥), (3)
where f is a function used to describe the relationship between input and output.
The goal of training a model is to predict the results on behalf of unseen infor-
mation. The model trains and tests the model and make predictions for the predefined
classes on behalf of the labels assigned to the classes.
3.3.1.1 Text Classification
Classification is the technique used to determine, understand and differentiate the ideas.
The vital reason why it is called supervised machine learning is predefined labels of clas-
ses in which data exists. Classification works of those classes that are defined for specific
objectives. The classification of text involves short documents as well as long documents.
Classification allocates the text or word to predefined class based on its learning. It can
be defined as the automatic categorization of document into predefined classes on behalf
of their subject. The classification technique has been widely used to solve problems re-
lated to databases, information retrieval, machine learning and data mining. The classifi-
cation of a text document can be defined as follows. We have a set of data D(x1, x2, … , xn)
and we divide the set of data into training and test data. We have training set of data
(𝑥1, 𝑥2, … , 𝑥𝑘) such that each class such that each case is labelled with a value assigned
to a class drawn from 𝑝 different values. These values are 𝑝 are indexed as (1,2, … , p).
The training of classification data is based on the training data. The model relates the
extracted features to one of the class labels. For the test data, the training model predicts
the class label for the features.
-25-
The assignment of labels to the classes is assumed to be categorical, however the
labels can be assigned as continuous values. The count of a word also plays an important
role in the process of classification. If a word is rare in a document, and it belongs to class
𝑝 where 𝑝 has label 𝑙, then in prediction the word will directly predict the class.
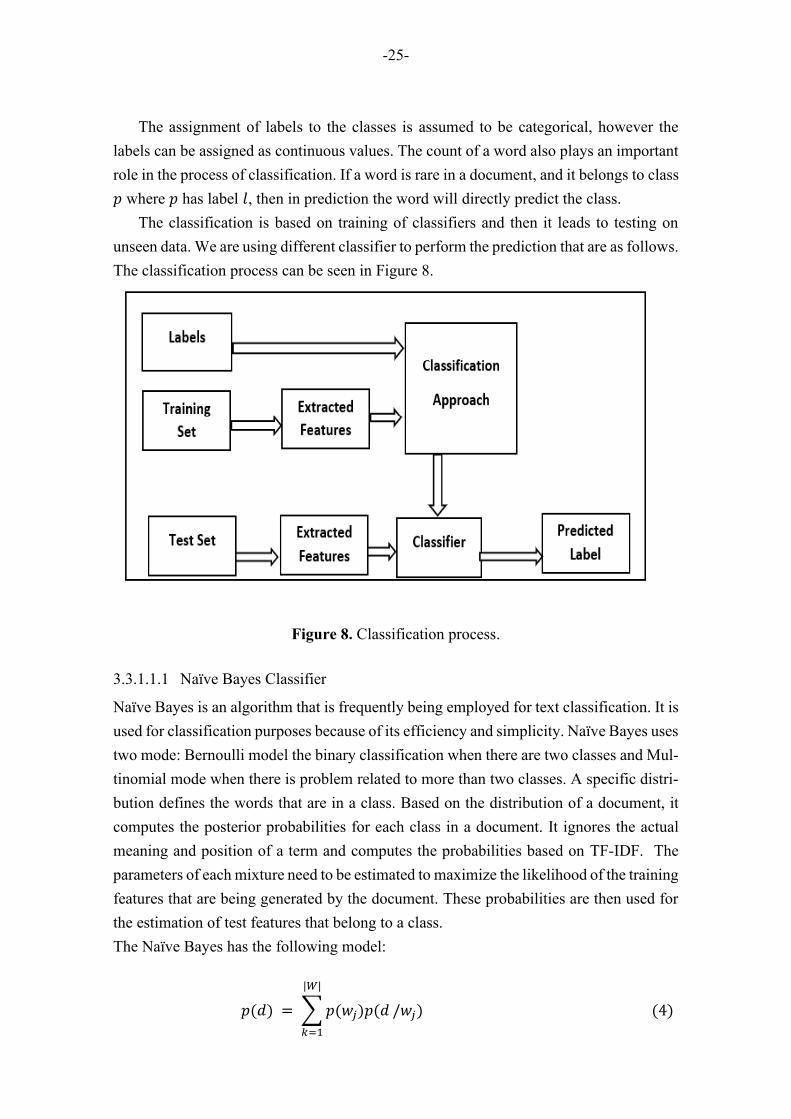
The classification is based on training of classifiers and then it leads to testing on
unseen data. We are using different classifier to perform the prediction that are as follows.
The classification process can be seen in Figure 8.
Figure 8. Classification process.
3.3.1.1.1 Naïve Bayes Classifier
Naïve Bayes is an algorithm that is frequently being employed for text classification. It is
used for classification purposes because of its efficiency and simplicity. Naïve Bayes uses
two mode: Bernoulli model the binary classification when there are two classes and Mul-
tinomial mode when there is problem related to more than two classes. A specific distri-
bution defines the words that are in a class. Based on the distribution of a document, it
computes the posterior probabilities for each class in a document. It ignores the actual
meaning and position of a term and computes the probabilities based on TF-IDF. The
parameters of each mixture need to be estimated to maximize the likelihood of the training
features that are being generated by the document. These probabilities are then used for
the estimation of test features that belong to a class.
The Naïve Bayes has the following model:
𝑝(𝑑) = ∑ 𝑝(𝑤𝑗)𝑝(𝑑
|𝑊|
𝑘=1
/𝑤𝑗) (4)
-26-
where 𝑤𝑗 are the words extracted from BoW belong to a certain class, |𝑤| is the
positive number of feature a class contains, 𝑑 is the class which contains features, and
𝑃(𝑤𝑗) are the calculated prior probabilities. The model can be transformed to get the
posterior probabilities that there is 𝑤𝑗 behind the calculation of 𝑑.
𝑝(𝑤𝑗 𝑑⁄ ) = 𝑝(𝑤𝑗)𝑝(𝑑 𝑤𝑗)⁄
𝑝(𝑑) (5)
Then, the classifier selects the class having maximum posterior probability for
classification where p(d) is a constant.
𝑤(𝑑) = 𝑎𝑟𝑔𝑚𝑎𝑥 𝑝(𝑤)𝑝(𝑑 𝑤𝑗) (6)⁄
The estimation of prior probabilities from training set are possible due to the fre-
quency of training set in each class 𝑤𝑗.
3.3.1.1.2 Support Vector Machine classifier
Support vector machines is considered as state-of-the-art techniques in mining textual
information. SVM and Naïve Bayes classifier are efficient and scalable when there is
huge textual data [Chen 2018]. The regularizer of support vector machine has special
interpretation that has been defined as 𝑚𝑎𝑟𝑔𝑖𝑛 − 𝑏𝑎𝑠𝑒𝑑 𝑠𝑒𝑝𝑎𝑟𝑎𝑡𝑖𝑜𝑛 separation as it sep-
arates the data point belonging to binary classes. It creates hyperplanes to split the points
belong to two different classes and these hyperplanes are symmetric. It assumes that top-
ics related to training set and topic related to test sets are linearly separable. The topic
separation between two classes can be performed by linear equation (7)
𝑑𝑡𝑤 + 𝑏 = 0. (7)
Where 𝑤 is the feature vector extracted from the corpus based on information, 𝑑
is weigh vector and 𝑏 exists in equation as a bias. The equation (7) can be rewritten
as follows:
𝑑𝑡𝑤𝑖 + 𝑏 ≥ 0 𝑓𝑜𝑟 𝑝𝑖 = 1 , (8)
𝑑𝑡𝑤𝑖 + 𝑏 < 0 𝑓𝑜𝑟 𝑝𝑖 = 0 ,
where 𝑝𝑖 is the class.
The equation separates the hyperplanes and Ω indicates the closest points to the
hyperplanes. The decision function is as follows:
-27-
𝑓(𝑥) = 𝑑𝑡𝑤 = ∑ 𝑑𝑘𝑤𝑘,𝑛
𝑘 =1 (9)
where n is the dimension.
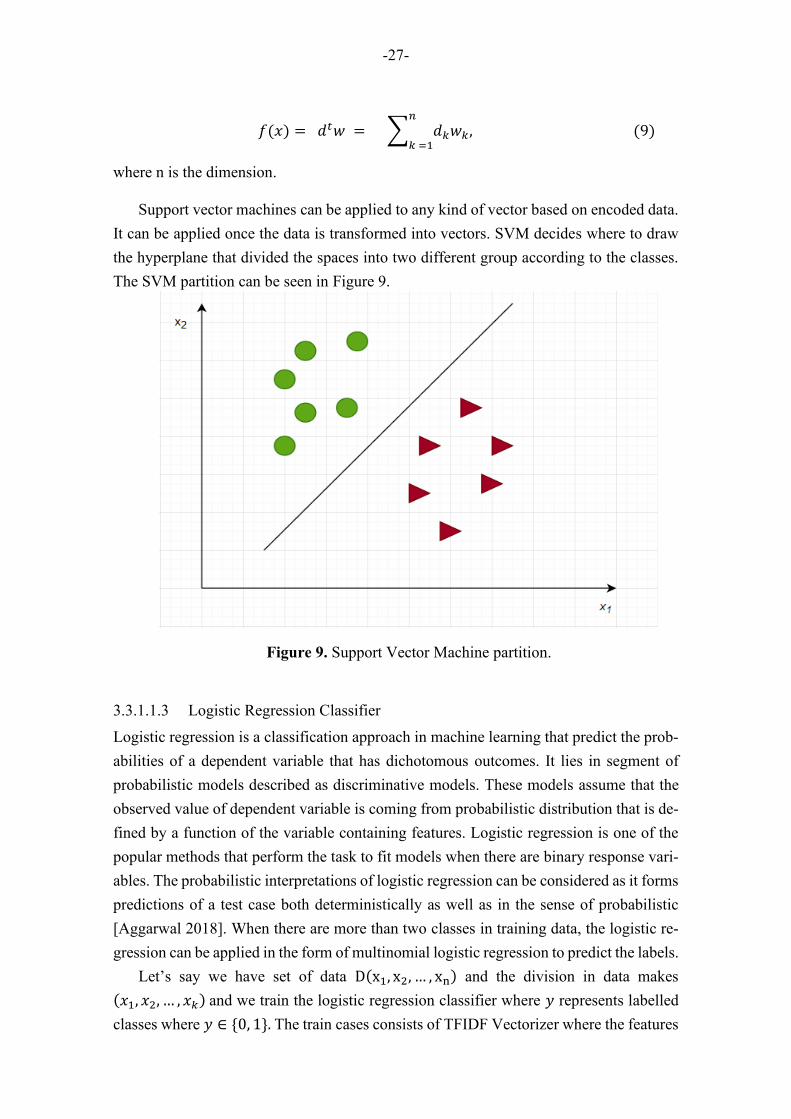
Support vector machines can be applied to any kind of vector based on encoded data.
It can be applied once the data is transformed into vectors. SVM decides where to draw
the hyperplane that divided the spaces into two different group according to the classes.
The SVM partition can be seen in Figure 9.
3.3.1.1.3 Logistic Regression Classifier
Logistic regression is a classification approach in machine learning that predict the prob-
abilities of a dependent variable that has dichotomous outcomes. It lies in segment of
probabilistic models described as discriminative models. These models assume that the
observed value of dependent variable is coming from probabilistic distribution that is de-
fined by a function of the variable containing features. Logistic regression is one of the
popular methods that perform the task to fit models when there are binary response vari-
ables. The probabilistic interpretations of logistic regression can be considered as it forms
predictions of a test case both deterministically as well as in the sense of probabilistic
[Aggarwal 2018]. When there are more than two classes in training data, the logistic re-
gression can be applied in the form of multinomial logistic regression to predict the labels.
Let’s say we have set of data D(x1, x2, … , xn) and the division in data makes
(𝑥1, 𝑥2, … , 𝑥𝑘) and we train the logistic regression classifier where 𝑦 represents labelled
classes where 𝑦 ∈ 0, 1. The train cases consists of TFIDF Vectorizer where the features
Figure 9. Support Vector Machine partition.

-28-
represent the vectorizers with their occurrences. In logistic regression we can model
the function not in the form of linear regression function such as 𝑦 as a function of 𝑥,
instead it can be functions as 𝑃(𝑦 = 0|𝑥) 𝑤ℎ𝑒𝑟𝑒 0 𝑟𝑒𝑝𝑟𝑒𝑠𝑒𝑛𝑡𝑠 𝑡ℎ𝑒 class whose la-
bels are being predicted. Thus, the logistic model becomes;
𝑝(𝑦 = 0|𝑥) = 𝑒𝛽0+𝛽1𝑥
1+𝑒𝛽0+𝛽1𝑥 . (10)
The right side is called the 𝑆𝑖𝑔𝑚𝑜𝑖𝑑 𝑓𝑢𝑛𝑐𝑡𝑖𝑜𝑛 of 𝑃(𝛽0 + 𝛽1𝑥) which gives a S-
shaped curve and probabilities ranging from 0 to 1. Logistic regression is often rep-
resented as:
log( 𝑝(𝑦 = 0|𝑥)
1 − 𝑝(𝑦 = 0|𝑥)) = (𝛽0 + 𝛽1𝑥), (11)
where the left-hand side is so called 𝑙𝑜𝑔𝑖𝑡 𝑓𝑢𝑛𝑐𝑡𝑖𝑜𝑛. Equation (11) is an inverse
function of equation (10). The classification model is first trained with the logistic
regression and then tested to predict the labels.
The plot showing g(z) to the 𝑠𝑖𝑔𝑚𝑜𝑖𝑑 𝑓𝑢𝑛𝑐𝑡𝑖𝑜𝑛 and indicates that 𝑔(𝑧) tends
towards 1 as z → ∞. The sigmoid is plotted in Figure 10.
Figure 10. Sigmoid Function.
3.3.1.1.4 Decision Tree Classifier
A decision tree is a predictive model and it can be used for representation of both regres-
sion model and classifier. Decision tree is referred to a hierarchical model in operation
research. The decision maker implements decision tree to identify the strategy to reach
-29-
her goal [Rokach et al., 2008]. When decision tree is used for the purpose of classifica-
tion, then it is more appropriate to call it a classification tree.
In data mining, the use of decision tree is wide and clear and that is why it is often used.
Moreover, it is widely use because of its simplicity and transparency. Classification tree
is usually represented graphically with a hierarchy that shows the relationship between
the features. A decision tree is a classifier articulated as a partition of the feature space 𝐷.
The decision tree with nodes forms rooted tree that is the indication that the tree is di-
rected. Every node has an edge and if there is no edge then the node is called “test” node.
Other nodes are called “leaves”. Each internal node splits the feature space into two or
more subspaces. The features are denoted with 𝑤1, 𝑤2, 𝑤3, . . . 𝑤𝑡. The feature space is
partitioned according to the value of attribute. The classes have leaves where each class
represents the target value.
In our scenario, a training set of cases are assigned to the decision tree and the goal is to
formulate an explanation that can be used to predict the classes of features in test cases.
The training set is also called a bag instance. A bag instance contains tuples and each
tuple is describes as a consist of attribute values. Rokach et al., [2008] described bag
schema as 𝐵(𝐷 𝑈 𝑦) where D connotes to a set of features extracted in feature space i.e
𝐷 = 𝑤1, 𝑤2, 𝑤3, . . . 𝑤𝑡 and y denotes the target attribute. It is often assumed that tuples
in training set are assumed randomly and independently and according to some joint prob-
ability that is unknown.
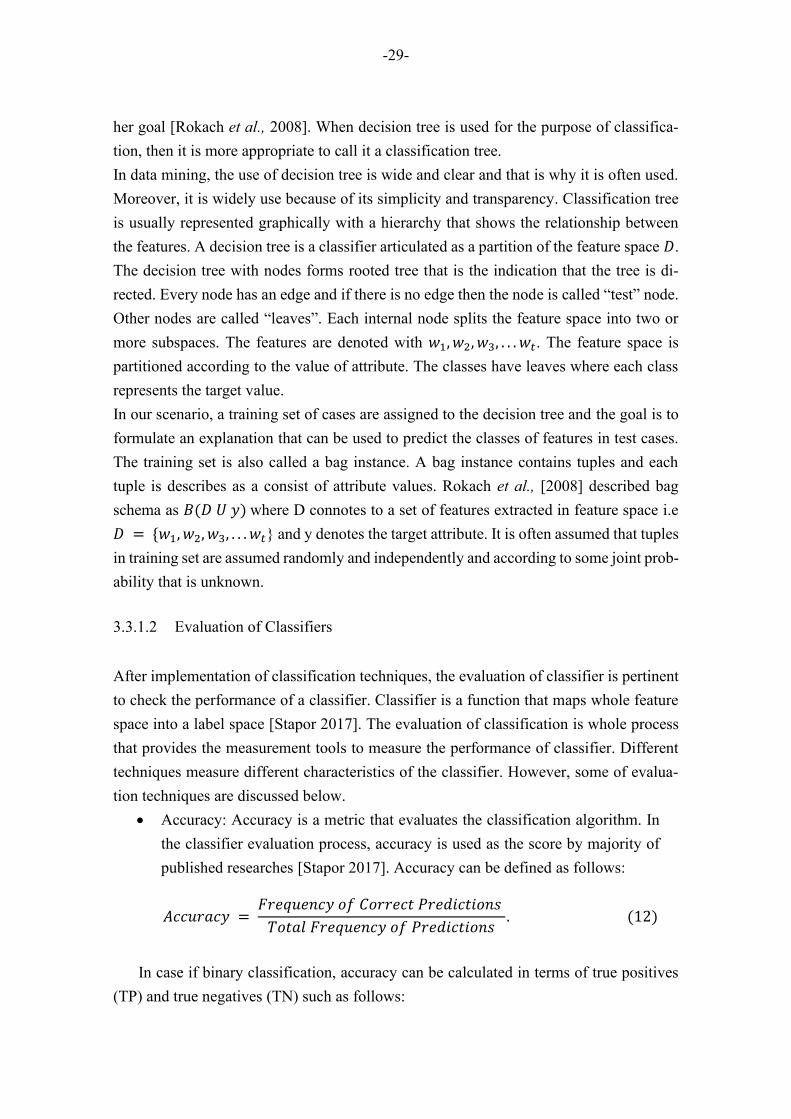
3.3.1.2 Evaluation of Classifiers
After implementation of classification techniques, the evaluation of classifier is pertinent
to check the performance of a classifier. Classifier is a function that maps whole feature
space into a label space [Stapor 2017]. The evaluation of classification is whole process
that provides the measurement tools to measure the performance of classifier. Different
techniques measure different characteristics of the classifier. However, some of evalua-
tion techniques are discussed below.
• Accuracy: Accuracy is a metric that evaluates the classification algorithm. In
the classifier evaluation process, accuracy is used as the score by majority of
published researches [Stapor 2017]. Accuracy can be defined as follows:
𝐴𝑐𝑐𝑢𝑟𝑎𝑐𝑦 = 𝐹𝑟𝑒𝑞𝑢𝑒𝑛𝑐𝑦 𝑜𝑓 𝐶𝑜𝑟𝑟𝑒𝑐𝑡 𝑃𝑟𝑒𝑑𝑖𝑐𝑡𝑖𝑜𝑛𝑠
𝑇𝑜𝑡𝑎𝑙 𝐹𝑟𝑒𝑞𝑢𝑒𝑛𝑐𝑦 𝑜𝑓 𝑃𝑟𝑒𝑑𝑖𝑐𝑡𝑖𝑜𝑛𝑠. (12)
In case if binary classification, accuracy can be calculated in terms of true positives
(TP) and true negatives (TN) such as follows:
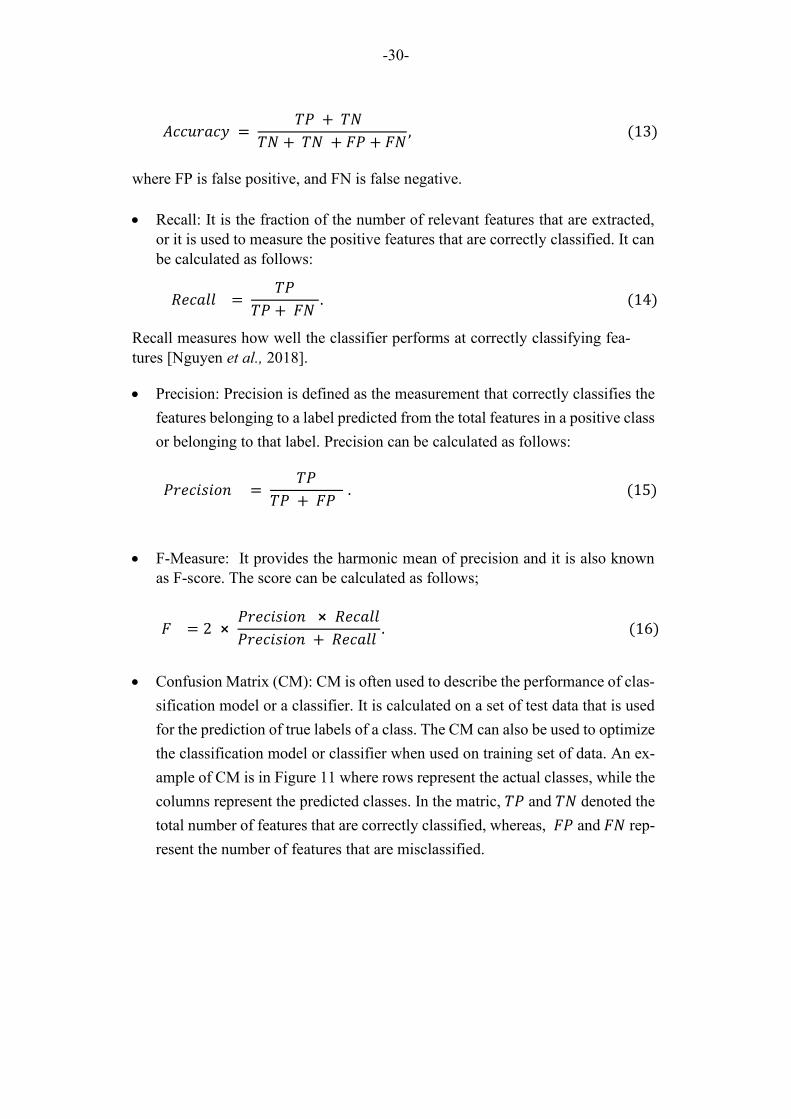
-30-
𝐴𝑐𝑐𝑢𝑟𝑎𝑐𝑦 = 𝑇𝑃 + 𝑇𝑁
𝑇𝑁 + 𝑇𝑁 + 𝐹𝑃 + 𝐹𝑁, (13)
where FP is false positive, and FN is false negative.
• Recall: It is the fraction of the number of relevant features that are extracted,
or it is used to measure the positive features that are correctly classified. It can
be calculated as follows:
𝑅𝑒𝑐𝑎𝑙𝑙 = 𝑇𝑃
𝑇𝑃 + 𝐹𝑁 . (14)
Recall measures how well the classifier performs at correctly classifying fea-
tures [Nguyen et al., 2018].
• Precision: Precision is defined as the measurement that correctly classifies the
features belonging to a label predicted from the total features in a positive class
or belonging to that label. Precision can be calculated as follows:
𝑃𝑟𝑒𝑐𝑖𝑠𝑖𝑜𝑛 = 𝑇𝑃
𝑇𝑃 + 𝐹𝑃 . (15)
• F-Measure: It provides the harmonic mean of precision and it is also known
as F-score. The score can be calculated as follows;
𝐹 = 2 ⨯ 𝑃𝑟𝑒𝑐𝑖𝑠𝑖𝑜𝑛 ⨯ 𝑅𝑒𝑐𝑎𝑙𝑙
𝑃𝑟𝑒𝑐𝑖𝑠𝑖𝑜𝑛 + 𝑅𝑒𝑐𝑎𝑙𝑙 . (16)
• Confusion Matrix (CM): CM is often used to describe the performance of clas-
sification model or a classifier. It is calculated on a set of test data that is used
for the prediction of true labels of a class. The CM can also be used to optimize
the classification model or classifier when used on training set of data. An ex-
ample of CM is in Figure 11 where rows represent the actual classes, while the
columns represent the predicted classes. In the matric, 𝑇𝑃 and 𝑇𝑁 denoted the
total number of features that are correctly classified, whereas, 𝐹𝑃 and 𝐹𝑁 rep-
resent the number of features that are misclassified.
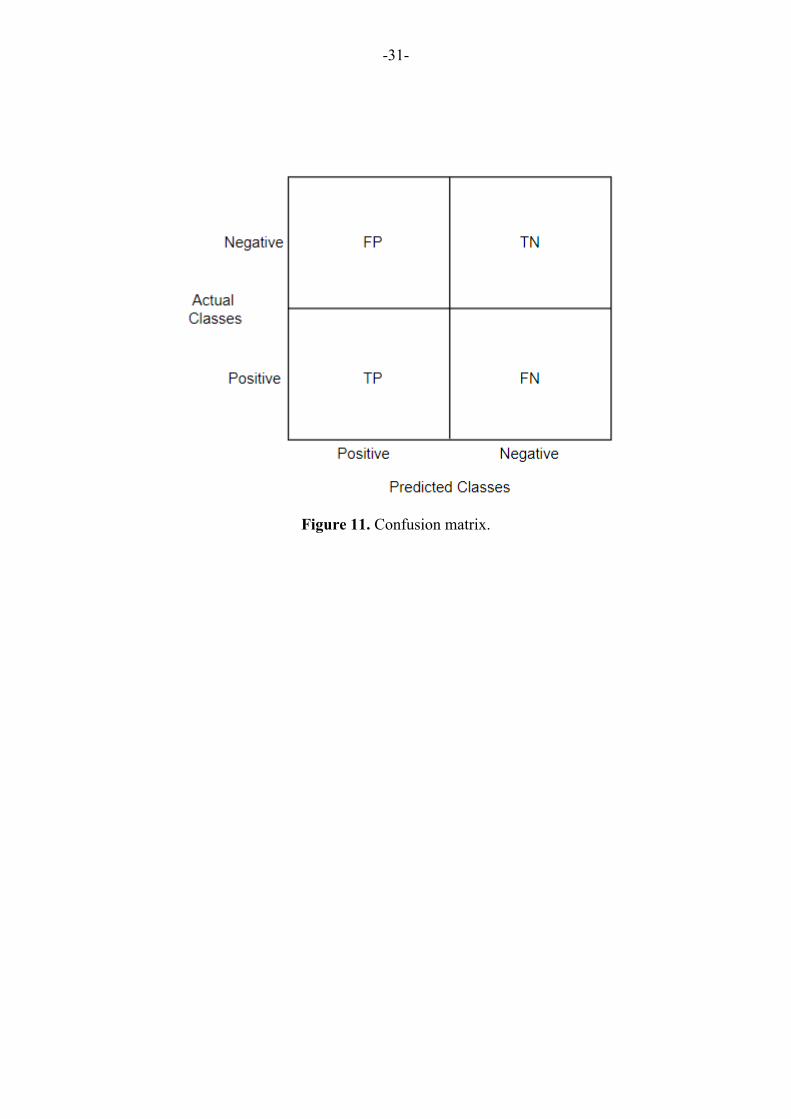
-31-
Figure 11. Confusion matrix.
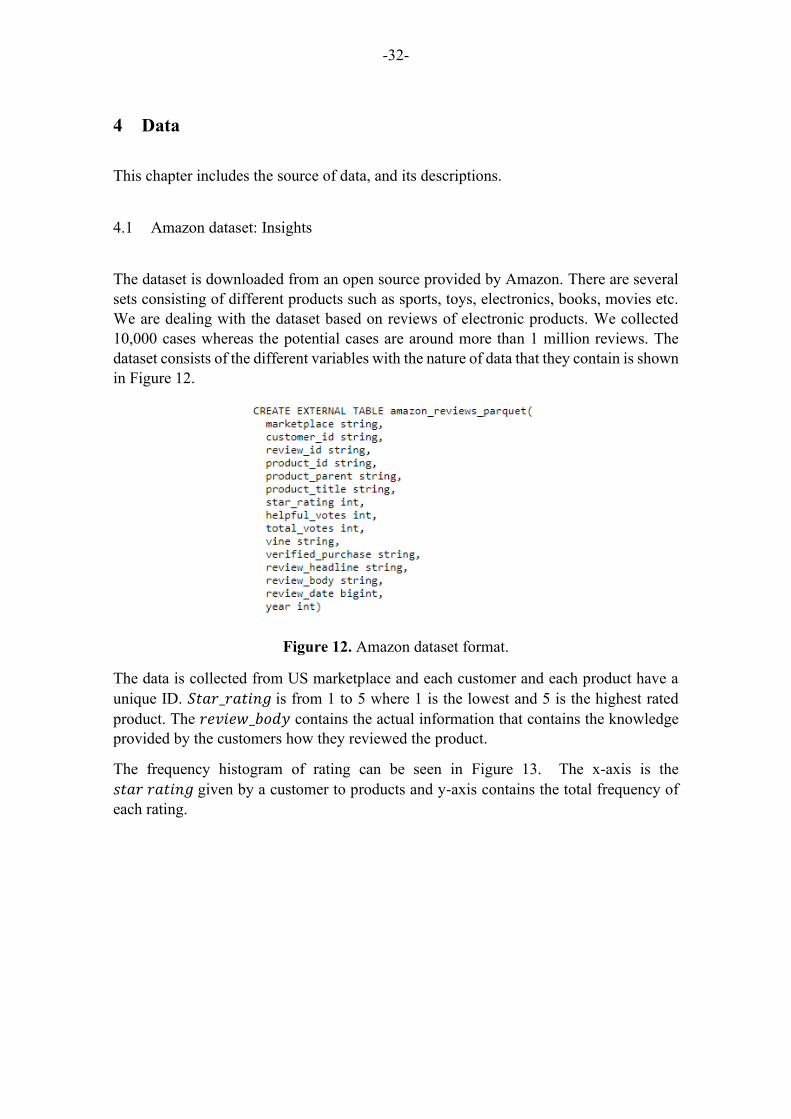
-32-
4 Data
This chapter includes the source of data, and its descriptions.
4.1 Amazon dataset: Insights
The dataset is downloaded from an open source provided by Amazon. There are several
sets consisting of different products such as sports, toys, electronics, books, movies etc.
We are dealing with the dataset based on reviews of electronic products. We collected
10,000 cases whereas the potential cases are around more than 1 million reviews. The
dataset consists of the different variables with the nature of data that they contain is shown
in Figure 12.
Figure 12. Amazon dataset format.
The data is collected from US marketplace and each customer and each product have a
unique ID. 𝑆𝑡𝑎𝑟_𝑟𝑎𝑡𝑖𝑛𝑔 is from 1 to 5 where 1 is the lowest and 5 is the highest rated
product. The 𝑟𝑒𝑣𝑖𝑒𝑤_𝑏𝑜𝑑𝑦 contains the actual information that contains the knowledge
provided by the customers how they reviewed the product.
The frequency histogram of rating can be seen in Figure 13. The x-axis is the
𝑠𝑡𝑎𝑟 𝑟𝑎𝑡𝑖𝑛𝑔 given by a customer to products and y-axis contains the total frequency of
each rating.
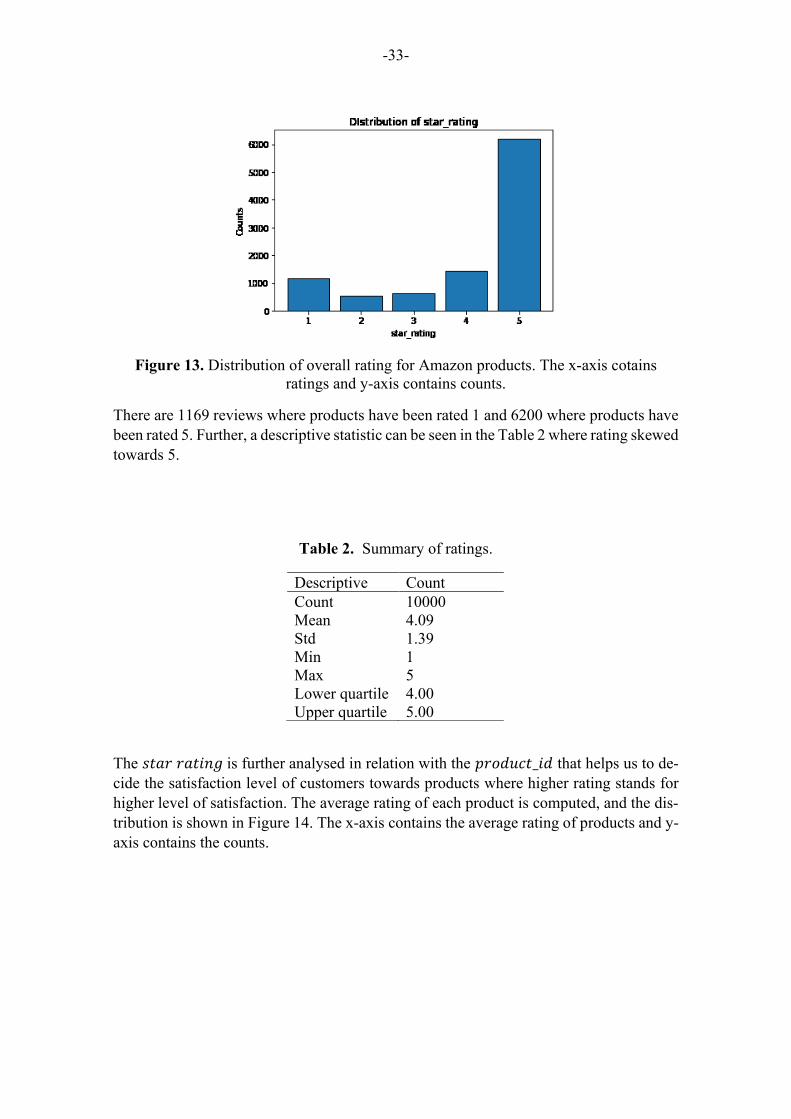
-33-
Figure 13. Distribution of overall rating for Amazon products. The x-axis cotains
ratings and y-axis contains counts.
There are 1169 reviews where products have been rated 1 and 6200 where products have
been rated 5. Further, a descriptive statistic can be seen in the Table 2 where rating skewed
towards 5.
Table 2. Summary of ratings.
The 𝑠𝑡𝑎𝑟 𝑟𝑎𝑡𝑖𝑛𝑔 is further analysed in relation with the 𝑝𝑟𝑜𝑑𝑢𝑐𝑡_𝑖𝑑 that helps us to de-
cide the satisfaction level of customers towards products where higher rating stands for
higher level of satisfaction. The average rating of each product is computed, and the dis-
tribution is shown in Figure 14. The x-axis contains the average rating of products and y-
axis contains the counts.
Descriptive Count
Count 10000
Mean 4.09
Std 1.39
Min 1
Max 5
Lower quartile 4.00
Upper quartile 5.00
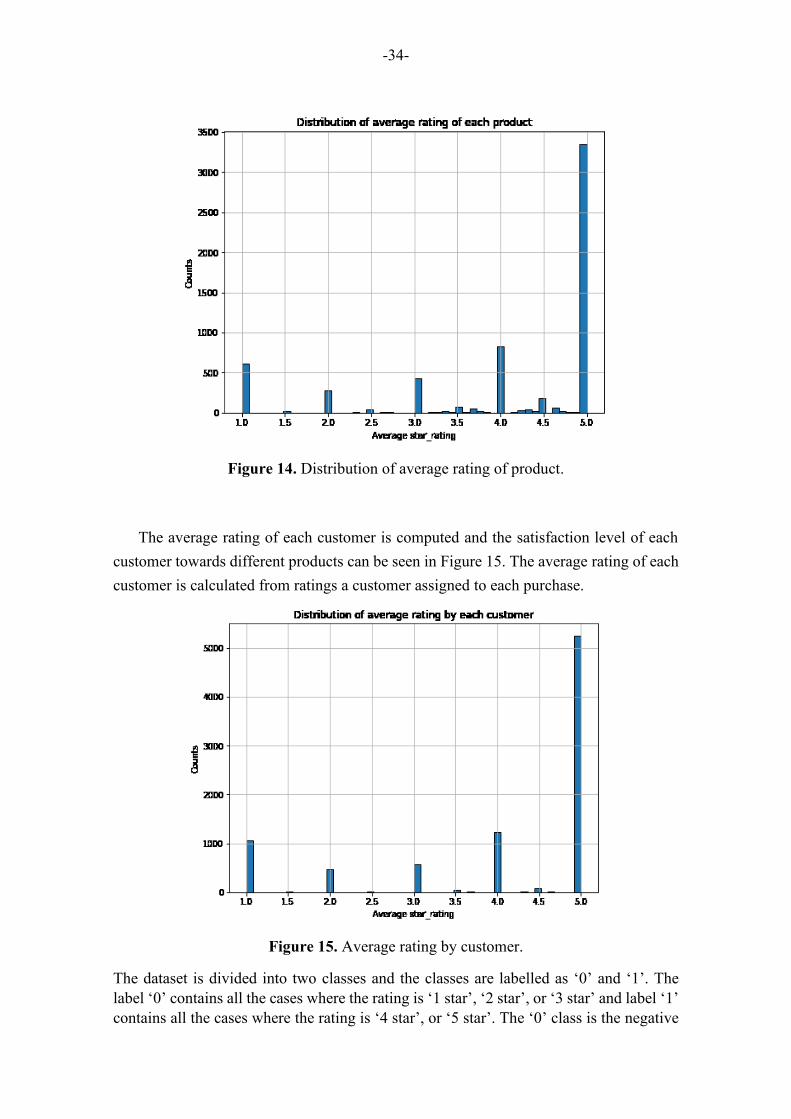
-34-
Figure 14. Distribution of average rating of product.
The average rating of each customer is computed and the satisfaction level of each
customer towards different products can be seen in Figure 15. The average rating of each
customer is calculated from ratings a customer assigned to each purchase.
Figure 15. Average rating by customer.
The dataset is divided into two classes and the classes are labelled as ‘0’ and ‘1’. The
label ‘0’ contains all the cases where the rating is ‘1 star’, ‘2 star’, or ‘3 star’ and label ‘1’
contains all the cases where the rating is ‘4 star’, or ‘5 star’. The ‘0’ class is the negative
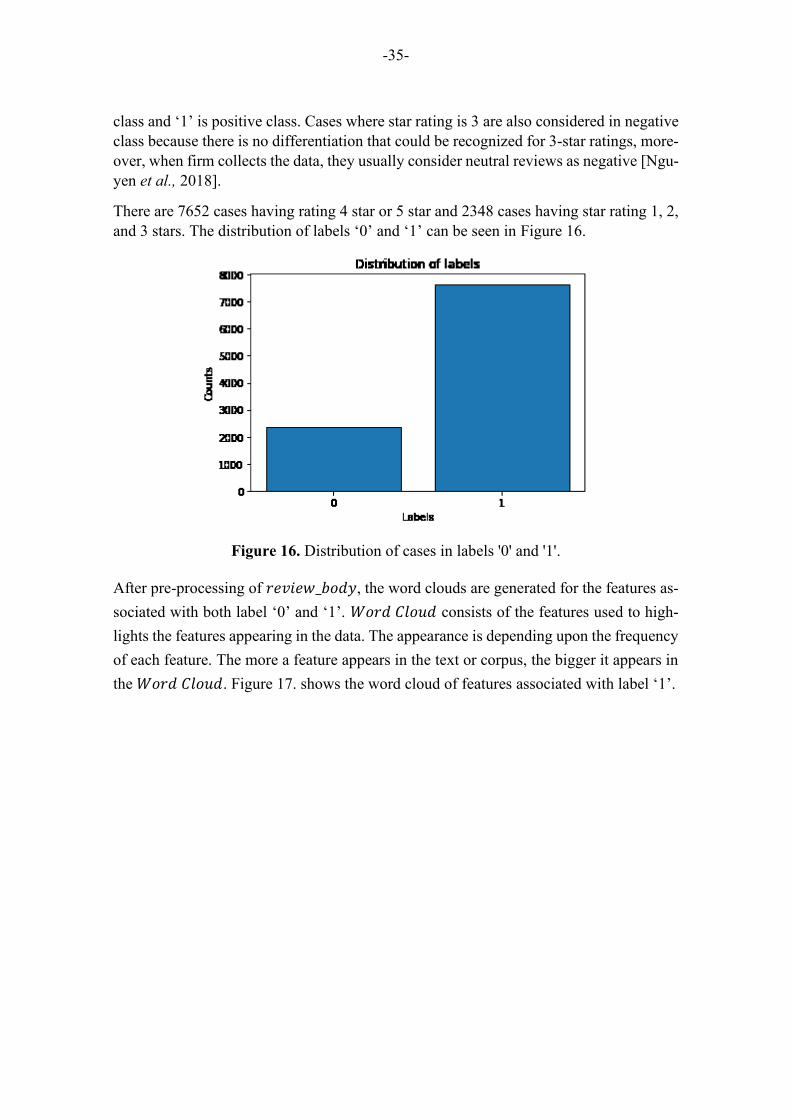
-35-
class and ‘1’ is positive class. Cases where star rating is 3 are also considered in negative
class because there is no differentiation that could be recognized for 3-star ratings, more-
over, when firm collects the data, they usually consider neutral reviews as negative [Ngu-
yen et al., 2018].
There are 7652 cases having rating 4 star or 5 star and 2348 cases having star rating 1, 2,
and 3 stars. The distribution of labels ‘0’ and ‘1’ can be seen in Figure 16.
Figure 16. Distribution of cases in labels '0' and '1'.
After pre-processing of 𝑟𝑒𝑣𝑖𝑒𝑤_𝑏𝑜𝑑𝑦, the word clouds are generated for the features as-
sociated with both label ‘0’ and ‘1’. 𝑊𝑜𝑟𝑑 𝐶𝑙𝑜𝑢𝑑 consists of the features used to high-
lights the features appearing in the data. The appearance is depending upon the frequency
of each feature. The more a feature appears in the text or corpus, the bigger it appears in
the 𝑊𝑜𝑟𝑑 𝐶𝑙𝑜𝑢𝑑. Figure 17. shows the word cloud of features associated with label ‘1’.
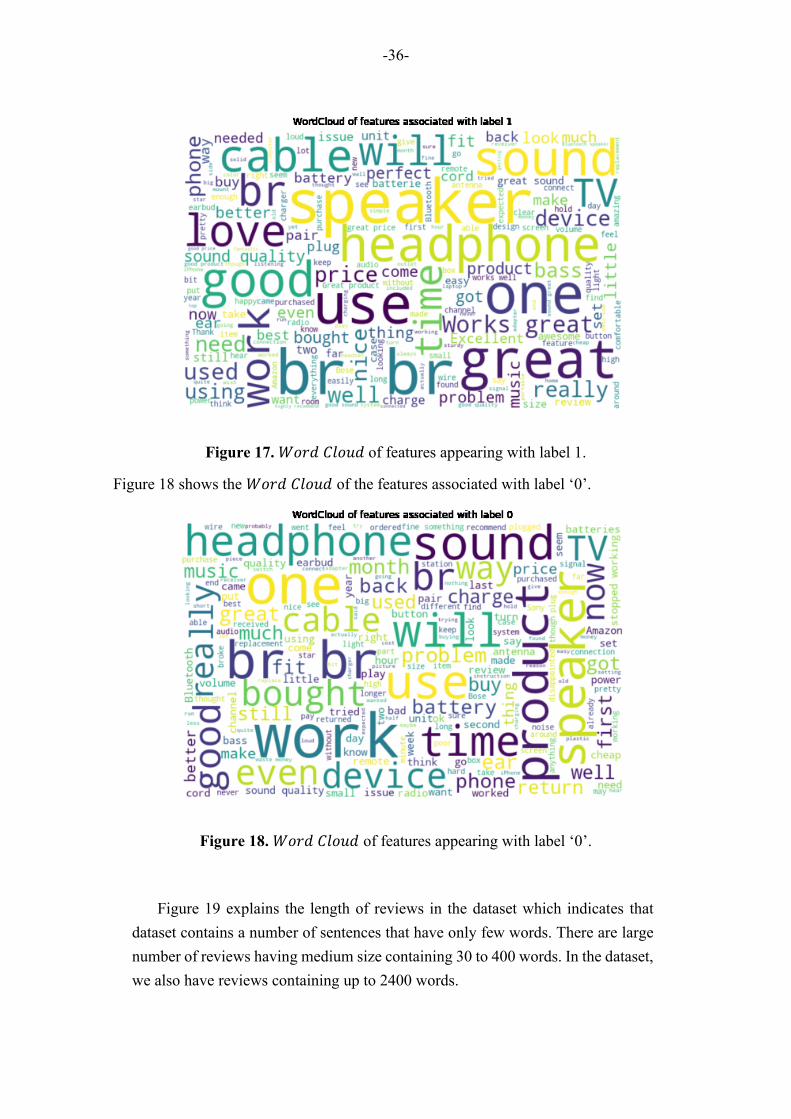
-36-
Figure 17. 𝑊𝑜𝑟𝑑 𝐶𝑙𝑜𝑢𝑑 of features appearing with label 1.
Figure 18 shows the 𝑊𝑜𝑟𝑑 𝐶𝑙𝑜𝑢𝑑 of the features associated with label ‘0’.
Figure 18. 𝑊𝑜𝑟𝑑 𝐶𝑙𝑜𝑢𝑑 of features appearing with label ‘0’.
Figure 19 explains the length of reviews in the dataset which indicates that
dataset contains a number of sentences that have only few words. There are large
number of reviews having medium size containing 30 to 400 words. In the dataset,
we also have reviews containing up to 2400 words.
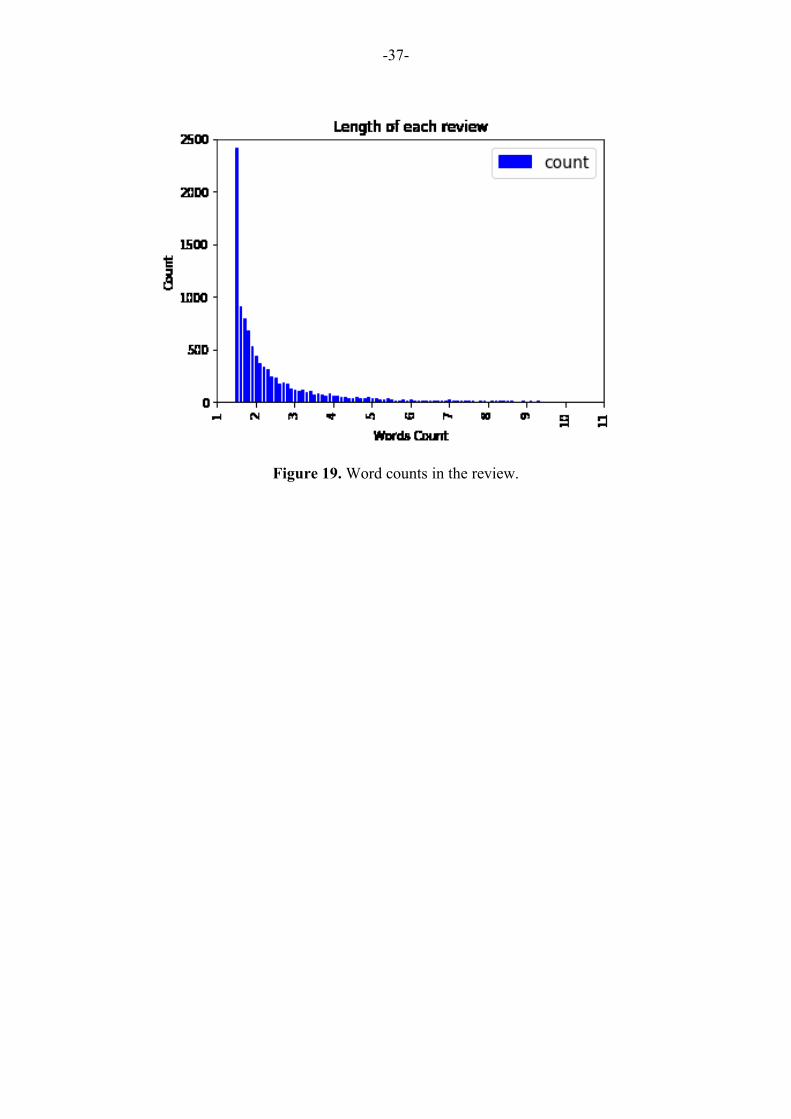
-37-
Figure 19. Word counts in the review.

-38-
5 Results and Discussion
Chapter 5 includes the results of all four techniques that we have used to analyse the
Amazon dataset to classify the customer’s state of satisfaction with the product. Table 3
shows our calculations.
Table 3. Summary of the results of all the classification techniques.
Model Dataset Accuracy Classes Preci-
sion
Recall F1-
Score
Naïve Bayes Amazon 0.82 Satisfied 0.81 0.97 0.88
Dissatisfied 0.86 0.35 0.50
Avg./Total 0.82 0.82 0.79
Support Vector
Machines
Amazon 0.83 Satisfied 0.84 0.95 0.89
Dissatisfied 0.79 0.49 0.61
Avg./Total 0.83 0.83 0.82
Logistic Regres-
sion
Amazon 0.78 Satisfied 0.85 0.85 0.85
Dissatisfied 0.58 0.58 0.58
Avg./Total 0.78 0.78 0.78
Decision Tree Amazon 0.76 Satisfied 0.83 0.85 0.84
Dissatisfied 0.55 0.54 0.55
Avg./Total 0.76 0.76 0.76
Every classifier predicts the labels exactly in the same form in which they are assigned.
Table 4 shows the actual and predicted labels “1” for “satisfied” and “0” for “unsatis-
fied” for each classifier for some test cases.
Table 4. Actual and predicted values by the models trained on dataset for some test
cases.
Actual NB SVM LR DT
1 1 1 1 1
1 1 1 1 1
1 1 1 1 1
1 1 0 0 1
0 1 1 1 1
1 0 0 0 1
1 1 1 1 1
1 1 1 1 1
0 1 1 1 1
1 1 1 1 1
0 0 0 0 0
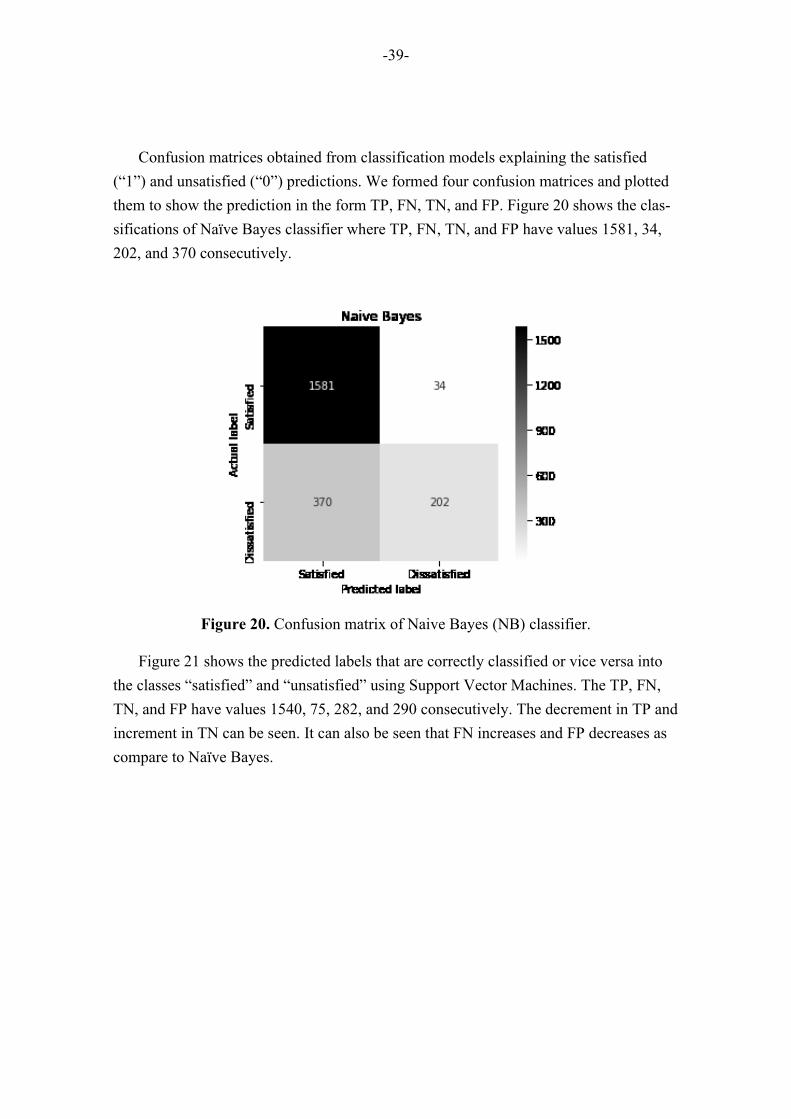
-39-
Confusion matrices obtained from classification models explaining the satisfied
(“1”) and unsatisfied (“0”) predictions. We formed four confusion matrices and plotted
them to show the prediction in the form TP, FN, TN, and FP. Figure 20 shows the clas-
sifications of Naïve Bayes classifier where TP, FN, TN, and FP have values 1581, 34,
202, and 370 consecutively.
Figure 20. Confusion matrix of Naive Bayes (NB) classifier.
Figure 21 shows the predicted labels that are correctly classified or vice versa into
the classes “satisfied” and “unsatisfied” using Support Vector Machines. The TP, FN,
TN, and FP have values 1540, 75, 282, and 290 consecutively. The decrement in TP and
increment in TN can be seen. It can also be seen that FN increases and FP decreases as
compare to Naïve Bayes.
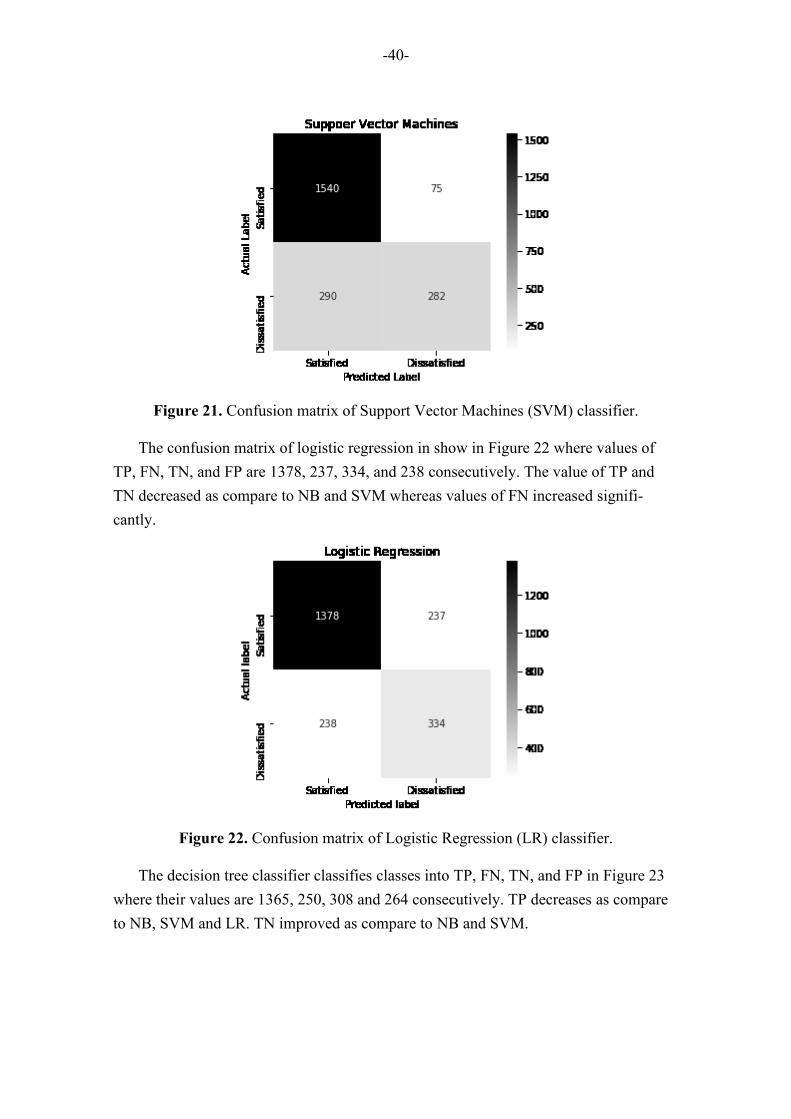
-40-
Figure 21. Confusion matrix of Support Vector Machines (SVM) classifier.
The confusion matrix of logistic regression in show in Figure 22 where values of
TP, FN, TN, and FP are 1378, 237, 334, and 238 consecutively. The value of TP and
TN decreased as compare to NB and SVM whereas values of FN increased signifi-
cantly.
Figure 22. Confusion matrix of Logistic Regression (LR) classifier.
The decision tree classifier classifies classes into TP, FN, TN, and FP in Figure 23
where their values are 1365, 250, 308 and 264 consecutively. TP decreases as compare
to NB, SVM and LR. TN improved as compare to NB and SVM.
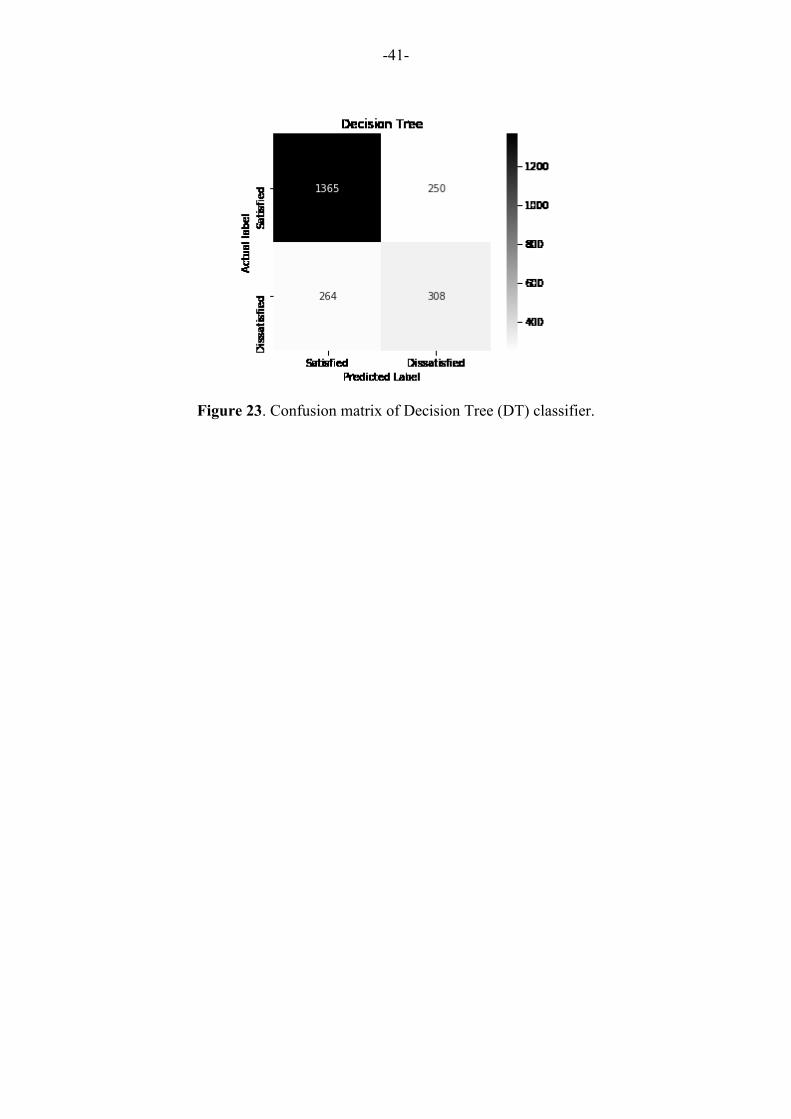
-41-
Figure 23. Confusion matrix of Decision Tree (DT) classifier.
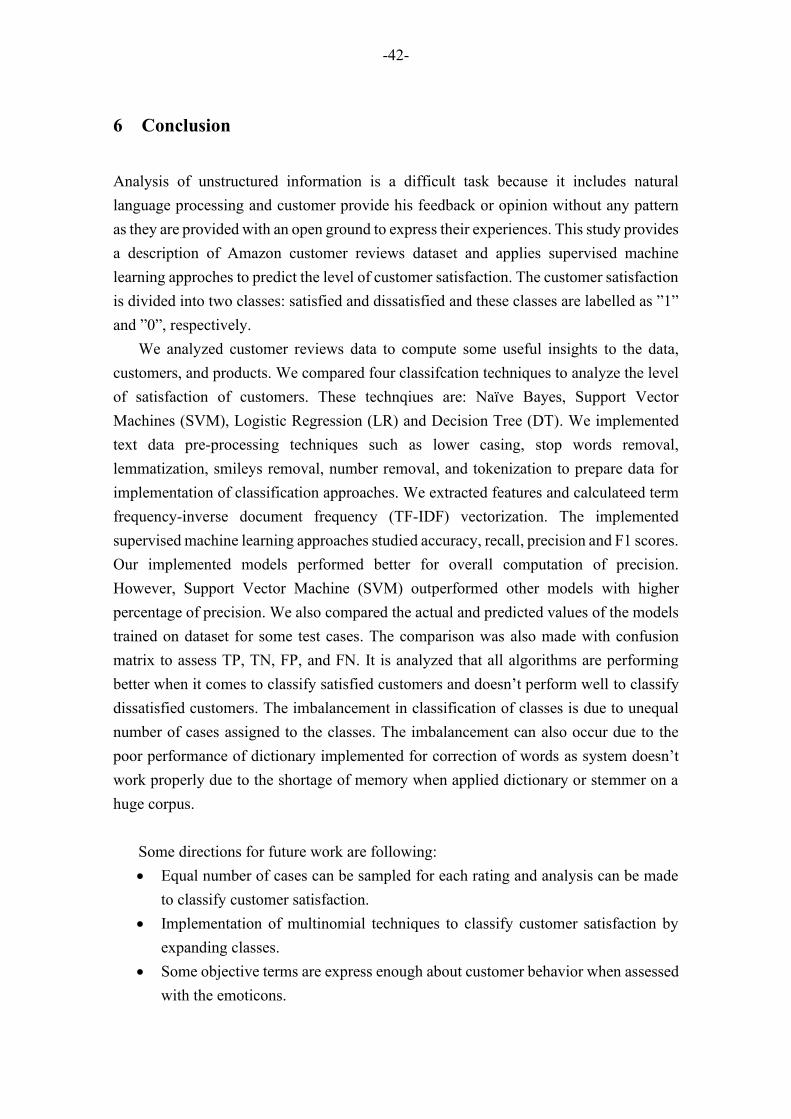
-42-
6 Conclusion
Analysis of unstructured information is a difficult task because it includes natural
language processing and customer provide his feedback or opinion without any pattern
as they are provided with an open ground to express their experiences. This study provides
a description of Amazon customer reviews dataset and applies supervised machine
learning approches to predict the level of customer satisfaction. The customer satisfaction
is divided into two classes: satisfied and dissatisfied and these classes are labelled as ”1”
and ”0”, respectively.
We analyzed customer reviews data to compute some useful insights to the data,
customers, and products. We compared four classifcation techniques to analyze the level
of satisfaction of customers. These technqiues are: Naïve Bayes, Support Vector
Machines (SVM), Logistic Regression (LR) and Decision Tree (DT). We implemented
text data pre-processing techniques such as lower casing, stop words removal,
lemmatization, smileys removal, number removal, and tokenization to prepare data for
implementation of classification approaches. We extracted features and calculateed term
frequency-inverse document frequency (TF-IDF) vectorization. The implemented
supervised machine learning approaches studied accuracy, recall, precision and F1 scores.
Our implemented models performed better for overall computation of precision.
However, Support Vector Machine (SVM) outperformed other models with higher
percentage of precision. We also compared the actual and predicted values of the models
trained on dataset for some test cases. The comparison was also made with confusion
matrix to assess TP, TN, FP, and FN. It is analyzed that all algorithms are performing
better when it comes to classify satisfied customers and doesn’t perform well to classify
dissatisfied customers. The imbalancement in classification of classes is due to unequal
number of cases assigned to the classes. The imbalancement can also occur due to the
poor performance of dictionary implemented for correction of words as system doesn’t
work properly due to the shortage of memory when applied dictionary or stemmer on a
huge corpus.
Some directions for future work are following:
• Equal number of cases can be sampled for each rating and analysis can be made
to classify customer satisfaction.
• Implementation of multinomial techniques to classify customer satisfaction by
expanding classes.
• Some objective terms are express enough about customer behavior when assessed
with the emoticons.
-43-
• Analyze the difference when features are extracted using TD-IDF,
CountVectorizers and Chi-square. Moreover, it can be implemneted with
multinomial classification approaches.
• Some unsupervised machine learning approaches to cluster features of each class
and compare techniques.
-44-
7 References
Aggarwal, C. C., & Zhai, C. 2012. A survey of text classification algorithms. In Mining
text data, 163-222. Springer, Boston, MA.
Aggarwal, C. C. 2018. Neural networks and deep learning. Cham: Springer International
Publishing.
alias Balamurugan, S. A., Rajaram, D. R., Athiappan, G., & Muthupandian, M. 2007.
Data mining techniques for suspicious email detection: A comparative study. In IADIS
European Conference Data Mining.
Aragon, C. R., Chen, N. C., Kroll, J. F., & Feldman, L. B. 2014. Emoticon and text
production in first and second languages in informal text communication. In International
Conference on Social Computing, Behavioral-Cultural Modeling, and Prediction. 223-
228. Springer, Cham.
Banerjee, S., & Chua, A. Y. 2016. In search of patterns among travellers' hotel ratings in
TripAdvisor. Tourism Management, 53, 125-131.
Bhavitha, B. K., Rodrigues, A. P., & Chiplunkar, N. N. 2017. Comparative study of
machine learning techniques in sentimental analysis. In proceedings of International
Conference on Inventive Communication and Computational Technologies (ICICCT),
216-221. IEEE.
Blair, D. C. 1979. Information retrieval, 2nd ed. C.J. van rijsbergen. london:
Butterworths; 1979: 208 pp. price: $32.50. Washington, D.C: Wiley Subscription
Services, Inc., A Wiley Company.
Cambero, A. 2016. A Comparative Study of Twitter Sentiment Analysis Methods for Live
Applications. M.Sc. Thesis Dissertation, Department of Computer Science, Rochester In-
stitute of Technology.
Chen, P. Y., Dhanasobhon, S., & Smith, M. D. 2006. All reviews are not created
equal. Available at SSRN 918083.
Chen, Z., Mukherjee, A., Liu, B., Hsu, M., Castellanos, M., & Ghosh, R. 2013. Exploiting
domain knowledge in aspect extraction. In Proceedings of the 2013 Conference on
Empirical Methods in Natural Language Processing, 1655-1667. Seattle, Washington,
USA
Chen, R. 2018. Automatic Keyphrase Extraction on Amazon Reviews, M.Sc. Thesis,
School of Information Sciences, University of Tampere.
Chevalier, J. A., & Mayzlin, D. 2006. The effect of word of mouth on sales: Online book
reviews. Journal of Marketing Research, 43(3), 345-354.
Colas, F., & Brazdil, P. 2006. Comparison of SVM and some older classification
algorithms in text classification tasks. In IFIP International Conference on Artificial
Intelligence in Theory and Practice, 169-178. Springer, Boston, MA.
-45-
Dellarocas, C. 2003. The digitization of word of mouth: Promise and challenges of online
feedback mechanisms. Management science, 49(10), 1407-1424.
Dhanasobhon, S., Chen, P. Y., Smith, M., & Chen, P. Y. 2007. An analysis of the
differential impact of reviews and reviewers at Amazon. com. Proceedings of 29th
International Conference on Information System 2007, pp. 94. Montreal, Canada.
Ekman, P. 1992. An argument for basic emotions. Cognition & emotion, 6(3-4), 169-200.
Engler, T. H., Winter, P., & Schulz, M. 2015. Understanding online product ratings: A
customer satisfaction model. Journal of Retailing and Consumer Services, 27, 113-120.
Farhadloo, M., Patterson, R. A., & Rolland, E. 2016. Modelling customer satisfaction
from unstructured data using a Bayesian approach. Decision Support Systems, 90, 1-11.
Fornell, C., Johnson, M. D., Anderson, E. W., Cha, J., & Bryant, B. E. 1996. The
American customer satisfaction index: nature, purpose, and findings. Journal of
marketing, 60(4), 7-18.
Geetha, M., Singha, P., & Sinha, S. 2017. Relationship between customer sentiment and
online customer ratings for hotels-An empirical analysis. Tourism Management, 61, 43-
54.
Ghose, A., & Ipeirotis, P. G. 2010. Estimating the helpfulness and economic impact of
product reviews: Mining text and reviewer characteristics. IEEE Transactions on
Knowledge and Data Engineering, 23(10), 1498-1512.
He, J., Tan, A. H., & Tan, C. L. 2000. A Comparative Study on Chinese Text
Categorization Methods. In proceedings of The Pacific Rim International Conference on
Artificial Intelligence workshop on text and web mining, Vol. 35.
Hennig-Thurau, T., Gwinner, K. P., Walsh, G., & Gremler, D. D. 2004. Electronic word-
of-mouth via consumer-opinion platforms: what motivates consumers to articulate
themselves on the internet?. Journal of interactive marketing, 18(1), 38-52.
Hmeidi, I., Al-Ayyoub, M., Abdulla, N. A., Almodawar, A. A., Abooraig, R., &
Mahyoub, N. A. 2015. Automatic Arabic text categorization: A comprehensive
comparative study. Journal of Information Science, 41(1), 114-124.
Hu, M. and Liu, B. 2004. Mining and summarizing customer reviews. Proceedings of the
tenth ACM SIGKDD International Conference on Knowledge Discovery and Data Min-
ing, 168-177.
Hu, N., Pavlou, P., & Zhang, J. 2006. Can online reviews reveal a product's true quality?:
Empirical findings and analytical modeling of online word-of-mouth communication. In
Proceedings of the 7th ACM conference on Electronic commerce, 324-330.
Islam, M., Jubayer, F. E. M., & Ahmed, S. I. 2017. A comparative study on different
types of approaches to Bengali document categorization. In Proceedings of the
International Conference on Engineering Research, Innovation and Education. arXiv
preprint arXiv:1701.08694
-46-
Jung, Y., & Suh, Y. 2019. Mining the voice of employees: A text mining approach to
identifying and analyzing job satisfaction factors from online employee
reviews. Decision Support Systems, 113074.
Koh, N. S., Hu, N., & Clemons, E. K. 2010. Do online reviews reflect a product’s true
perceived quality? An investigation of online movie reviews across cultures. Electronic
Commerce Research and Applications, 9(5), 374-385.
Kang, D., & Park, Y. 2014. Review-based measurement of customer satisfaction in
mobile service: Sentiment analysis and VIKOR approach. Expert Systems with
Applications, 41(4), 1041-1050.
Kobayashi, N., Iida, R., Inui, K., & Matsumoto, Y. 2005. Opinion mining as extraction
of attribute-value relations. In Annual Conference of the Japanese Society for Artificial
Intelligence. 470-481. Springer, Berlin, Heidelberg.
Korde, V., & Mahender, C. N. 2012. Text classification and classifiers: A
survey. International Journal of Artificial Intelligence & Applications, 3(2), 85.
Kwok, L., & Xie, K. L. 2016. Factors contributing to the helpfulness of online hotel
reviews: does manager response play a role?. International Journal of Contemporary
Hospitality Management, 28(10), 2156-2177.
Lilleberg, J., Zhu, Y., & Zhang, Y. 2015. Support vector machines and word2vec for text
classification with semantic features. In 2015 IEEE 14th International Conference on
Cognitive Informatics & Cognitive Computing (ICCI* CC), 136-140.
Lin, C. L., Lee, S. H., & Horng, D. J. 2011. The effects of online reviews on purchasing
intention: The moderating role of need for cognition. Social Behavior and Personality:
an international journal, 39(1), 71-81.
Mamoun, R., & Ahmed, M. A. 2014. A Comparative Study on Different Types of
Approaches to the Arabic text classification. In Proceedings of the 1st International
Conference of Recent Trends in Information and Technology,Vol. 2, No. 3. Universiti
Teknologi Malaysia, Johor, Malaysia.
Mäntylä, M. V., Graziotin, D., & Kuutila, M. 2018. The evolution of sentiment analysis—
A review of research topics, venues, and top cited papers. Computer Science
Review, 27,16-32.
Mauri, A. G., & Minazzi, R. 2013. Web reviews influence on expectations and purchasing
intentions of hotel potential customers. International Journal of Hospitality
Management, 34, 99-107.
Miao, C. 2011. Web data mining based on cloud computing. Computer Science, 38(10
A), 146-149.
Mudambi, S. M., & Schuff, D. 2010. What makes a helpful review? A study of customer
reviews on Amazon. com. Management Information Systems quarterly, 34(1),185-200.

-47-
Mullen, T., & Collier, N. 2004. Sentiment analysis using support vector machines with
diverse information sources. In Proceedings of the 2004 conference on empirical methods
in natural language processing, 412-418.
Mushtaq M. Adnan. 2017. Multilingual sentiments analysis as product reputation in-
sights. M.Sc. Thesis, Faculty Natural Sciences, University of Tampere.
Nguyen, H., Veluchamy, A., Diop, M., & Iqbal, R. 2018. Comparative Study of Sentiment
Analysis with Product Reviews Using Machine Learning and Lexicon-Based
Approaches. SMU Data Science Review, 1(4), 7.
Oliver, S. 1997. A model for the future of electronic commerce. Information Management
& Computer Security, 5(5), 166-169.
Pang, B., Lee, L., & Vaithyanathan, S. 2002. Thumbs up?: sentiment classification using
machine learning techniques. In Proceedings of the ACL-02 conference on Empirical
methods in natural language processing-Volume 10, 79-86. Stroudsburg, PA, USA.
Pang, B., & Lee, L. 2004. A sentimental education: Sentiment analysis using subjectivity
summarization based on minimum cuts. In Proceedings of the 42nd annual meeting on
Association for Computational Linguistics, 271. Association for Computational
Linguistics.
Pang, B., & Lee, L. 2008. Opinion mining and sentiment analysis. Foundations and
Trends® in Information Retrieval, 2(1–2), 1-135.
Porter, M. F. 1980. An algorithm for suffix stripping. program, 14(3), 130-137.
Rokach, L., & Maimon, O. Z. 2008. Data mining with decision trees: theory and
applications (Vol. 69). World scientific.
Schuckert, M., Liu, X., & Law, R. 2015. A segmentation of online reviews by language
groups: How English and non-English speakers rate hotels differently. International
Journal of Hospitality Management, 48, 143-149.
Scott, S., & Matwin, S. 1999. Feature engineering for text classification. In Proceedings
of ICML-99, 16th international conference on machine learning, 379–388. Bled,
Slovenia.
Sezgen, E., Mason, K. J., & Mayer, R. 2019. Voice of airline passenger: A text mining
approach to understand customer satisfaction. Journal of Air Transport Management, 77,
65-74.
Sidorova, A., Evangelopoulos, N., Valacich, J. S., & Ramakrishnan, T. 2008. Uncovering
the intellectual core of the information systems discipline. Management Information
Systems, 32(3), 467-482.
-48-
Söderlund, M. 1998. Customer satisfaction and its consequences on customer behaviour
revisited: The impact of different levels of satisfaction on word-of-mouth, feedback to
the supplier and loyalty. International journal of service industry management, 9(2), 169-
188.
Stąpor, K. 2017. Evaluating and comparing classifiers: review, some recommendations
and limitations. In proceedings of International Conference on Computer Recognition
Systems, 12-21. Springer, Cham.
Tan, C., Lee, L., Tang, J., Jiang, L., Zhou, M., & Li, P. 2011. User-level sentiment
analysis incorporating social networks. In Proceedings of the 17th ACM SIGKDD
international conference on Knowledge discovery and data mining, 1397-1405.
Thelwall, M., Wilkinson, D., & Uppal, S. 2010. Data mining emotion in social network
communication: Gender differences in MySpace. Journal of the American Society for
Information Science and Technology, 61(1), 190-199.
Ting, P. L., Chen, S., Chen, H., & Fang, W. 2017. Using big data and text analytics to
understand how customer experiences posted on yelp.com impact the hospitality
industry. Contemporary Management Research, 13(2), 107-130.
Turney, P. D. 2002. Thumbs up or thumbs down?: semantic orientation applied to
unsupervised classification of reviews. In Proceedings of the 40th annual meeting on
association for computational linguistics, 417-424. Association for Computational
Linguistics. Stroudsburg, PA, USA.
Vala, M., & Gandhi, J. 2015. Survey of Text Classification Technique and Compare
Classifier. International Journal of Innovative Research in Computer and
Communication Engineering, 3(11), 10809-10813.
Wilson, T., Wiebe, J., & Hwa, R. 2004. Just how mad are you? Finding strong and weak
opinion clauses. In Proceedings of AAAI-04, 21st Conference of the American
Association for Artificial Intelligence, 761–769. San Jose, US.
Wilson, T., Wiebe, J., & Hoffmann, P. 2005. Recognizing contextual polarity in phrase-
level sentiment analysis. In Proceedings of Human Language Technology Conference
and Conference on Empirical Methods in Natural Language Processing, 347-354.
Woolf, M. 2014. A Statistical Analysis of 1.2 Million Amazon Reviews unpublished
manuscript, June 17, 2014. Available at https://minimaxir.com/2014/06/reviewing-
reviews.
Xu, X., Li, Y., & Lu, A. C. C. 2019. A comparative study of the determinants of business
and leisure travellers' satisfaction and dissatisfaction. International Journal of Services
and Operations Management, 33(1), 87-112.
Xu, X., & Li, Y. 2016. The antecedents of customer satisfaction and dissatisfaction
toward various types of hotels: A text mining approach. International journal of
hospitality management, 55, 57-69.
-49-
Yang, Y., & Chute, C. G. 1994. An example-based mapping method for text
categorization and retrieval. In proceedings of ACM Transactions on Information Systems
(TOIS), 12(3), 252-277. New York, USA.
Yassine, M., & Hajj, H. 2010. A framework for emotion mining from text in online social
networks. In proceedings of IEEE International Conference on Data Mining Workshops,
1136-1142. IEEE.
Yi, Y. 1991. A Critical Review of Customer Satisfaction. In Review of Marketing.
Valarie A. Zeithmal, ed. pp. 68-123. Chicago: American Marketing Association.
Yi, J. and Niblack, W. 2005. Sentiment mining in WebFountain. Proceedings of the 21st
International Conference on Data Engineering, 1073-1083. IEEE.
Yoo, K., & Gretzel, U. 2011. Influence of personality on travel-related consumer-
generated media creation. Computers in Human Behavior, 27(2), 609-621.
Zhao, Y., Xu, X., & Wang, M. 2019. Predicting overall customer satisfaction: Big data
evidence from hotel online textual reviews. International Journal of Hospitality
Management, 76, 111-121.