predicting driver's hypovigilance on ... increases fatigue, however, the fatigue community has...
TRANSCRIPT
1
PREDICTING DRIVER'S HYPOVIGILANCE ON
MONOTONOUS ROADS LITERATURE REVIEW
Grégoire S. Larue1*, Andry Rakotonirainy
1 and Anthony N. Pettitt
2
1. Centre for Accident Research and Road Safety – Queensland, Australia
130 Victoria Park Road, Kelvin Grove Qld 4059, Australia;
Tel: +61 7 3138 4644; Fax: +61 7 3138 4907; E-mail: [email protected]
2. Queensland University of Technology, Australia
ABSTRACT
Drivers' ability to react to unpredictable events deteriorates when exposed to highly
predictable and uneventful driving tasks. Particularly, highway design reduces the driving
task mainly to a lane-keeping one. It contributes to hypovigilance and road crashes as drivers
are often not aware that their driving behaviour is impaired. Monotony increases fatigue,
however, the fatigue community has mainly focused on endogenous factors leading to fatigue
such as sleep deprivation. This paper focuses on the exogenous factor monotony which
contributes to hypovigilance. Objective measurements of the effects of monotonous driving
conditions on the driver and the vehicle's dynamics is systematically reviewed with the aim of
justifying the relevance of the need for a mathematical framework that could predict
hypovigilance in real-time. Although electroencephalography (EEG) is one of the most
reliable measures of vigilance, it is obtrusive. This suggests to predict from observable
variables the time when the driver is hypovigilant. Outlined is a vision for future research in
the modelling of driver vigilance decrement due to monotonous driving conditions. A
mathematical model for predicting drivers’ hypovigilance using information like lane
positioning, steering wheel movements and eye blinks is provided. Such a modelling of driver
vigilance should enable the future development of an in-vehicle device that detects driver
hypovigilance in advance, thus offering the potential to enhance road safety and prevent road
crashes.
KEYWORDS
Monotony, Fatigue, Vigilance, Driving, Hidden Markov Models
INTRODUCTION
Road traffic increased throughout the twentieth century, leading to unacceptable loss rates on
the road in the Seventies. From 1970, government policies were established and enforced,
resulting in safer roads. These improvements have largely been concerned with road design
and condition. Nevertheless, road safety is still an important issue since crashes are most often
due to human errors. Also new types of crashes have emerged from contemporary road safety
interventions which tend to over-simplify the driving task. For instance, the introduction of
assistive devices such as cruise control simplifies and reduces driving to a lane-keeping task
on highways. A lane-keeping task is not stimulating and can cause the driver to suffer from
drowsiness and hypovigilance.
2
Fatigue has been identified as one the major causes of road crashes globally and is estimated
to cause 20% to 30% of road crashes [1]. Furthermore fatigue-related crashes in Australia are
mainly located on motorways and rural roads, that is to say on good quality roads, with few
curvatures and designed to improve road safety [2], therefore raising the question of the role
of the monotony of the driving task in explaining fatigue-related crashes. Indeed, if the
driving task is highly predictable and uneventful then drivers' ability to react to unpredictable
events deteriorates. Fatigue is a constant hazard for any long-distance or professional driver.
It can affect one's judgement of their ability to continue performing the driving task safely [3]
therefore highlighting the necessity to better understand driver vigilance during the driving
task.
The purpose of this review is to highlight the role of monotony on hypovigilance while
driving and provide an Intelligent Transport System (ITS) based intervention to model and
predict hypovigilance due to monotony in real time. This paper will first present the driving
impairment observed on monotonous roads, and then review the current countermeasures
used against this impairment. Limitations of these countermeasures will lead to the review of
the methods to assess driver vigilance as well as the presentation of the method to assess
vigilance state with the most reliable one: the EEG. Finally a methodology to predict
hypovigilance in real time will be proposed, followed by a conclusion on the implications of
this review.
EFFECTS OF MONOTONY
Definitions
Vigilance is defined as the individual's ability to sustain attention and remain alert over
extended periods of time for the purpose of responding to critical signals or changes in
information or stimulus [4]. An increase of effort to maintain attention and performance
during continuous mental work leads to a physiological response: fatigue (also referred to as
drowsiness or sleepiness in the literature). As applied to the road environment, fatigue is a
general psychophysiological state which diminishes the ability to perform the driving task by
altering alertness and vigilance [2]. It has also been defined as a disinclination to continue
performing the task at hand and a progressive withdrawal of attention from road and traffic
demands [5].
Monotony is mainly defined as a task characteristic related to highly repetitive, constant or
infrequent stimuli. Monotony impacts the driver alertness and consequently decreases their
vigilance. In fact, quite rapidly the driver experiences boredom, drowsiness or loss of interest
in doing the driving task [5]. Monotony has been categorised as an exogenous factor in recent
psychological research, that is to say, the monotony of the task is not coupled with the mental
state of the person. As a consequence, as long as a task consists of infrequent stimuli, low
cognitive demand and low variance of task, it can be characterised as monotonous, regardless
of the effects of the task on the person.
Physiological effects
During vigilance tasks (such as driving) monotony results in a progressive decrease in arousal
and vigilance. Arousal and habituation theories are complementary in explaining the impact
3
of monotony on vigilance: repetitive stimulations elicit perceptual habituation which decrease
arousal and result in performance decrement. In terms of information processing theories, this
decrease is the consequence of a shift toward the automatic mode of information processing
[6].
Monotony and fatigue cause crashes characterised by an increased occurrence during the
night (10:00pm-6:00am) or the afternoon (2:00-4:00pm) as the circadian rhythm generates a
vigilance decrease at these times. It also involves most of the time only one vehicle going off
the road and hitting an obstacle without a reaction from the driver, which can be assessed by
the fact that no skid marks are present at the crash scene [2]. Monotony-related crashes take
place mainly on highways (predictable, straight lanes). This can be explained by the fact that
a hypovigilant driver is unable to react on time (or react at all) to critical events such as going
off the road. Thirty minutes of monotonous driving have been shown to induce fatigue during
driving [2].
Driving behaviour under monotonous conditions
Both performing a monotonous task and driving in a monotonous environment have
consequences on the driving ability. Monotonous situations lead to fatigue symptoms and
impaired driving behaviour (i.e. what the driver actually does [7]) although the drivers were
neither tired not sleep deprived prior to the driving task [8]. The effects on the behaviour
appeared on many types of measures: deterioration of steering wheel control over time,
significant increase in sleepiness and significant increases in heart rate variability. Monotony
can also lead to microsleeps during which the driver is asleep for a few seconds while their
eyes are still open. The problem in terms of road safety is that the driver is not aware that he
was driving for some distance while asleep [9].
Driver vigilance decline can be observed with in-vehicle devices that measure driver
behaviour. Indeed a fatigued driver shows characteristics that a non impaired driver has not.
Fatigued drivers have longer eyelid closures and reduced tracking performance. It has been
noticed that over long driving periods in monotonous environments blink durations increase.
Also during hypovigilance horizontal eye movement velocity decreases (and participants
report difficulty with fixation) [10]. During fatigue, fast eye movements and conventional
blinks are replaced by no eye movements and small fast rhythmic blinks. Then during deeper
drowsiness, slow blinks are observed in all subjects and many drivers have mannerisms such
as yawning and nodding. Impairment is also noticed in the steering wheel movements [11]. In
particular driver hypovigilance can be assessed by steering wheel movement variance. The
lateral position's accuracy decreases rapidly during monotonous driving (independently of
time on task). Steering wheel reversals are a reliable indicator of sleepiness, with both the
number and amplitude of these increasing with sleepiness [1,9].
CURRENT COUNTERMEASURES
When the driver feels tired, they try to cope with this situation by various means such as
listening to the radio, opening a window, following the lane markers, talking to a passenger or
drinking coffee. But most of these behaviours have their limitations in maintaining alertness
[12]. In the case of underload situations a possible countermeasure is to increase the cognitive
demand by adding an additional task (without distracting the driver from the primary task)

4
[8]. During overload no other task can be added so that the driver's ability to cope with high
cognitive demands should be improved. Unfortunately, adding a cognitive task is efficient in
terms of reducing drowsiness only when performed. As soon as it is stops, its effects
disappear. Its effect is only limited in time. Also designing roads with curves increases the
demands of the driving tasks and can help the driver to counteract fatigue [8].
Existing countermeasures such as “sleep and rest” are efficient for fatigue but would not be
successful in stopping the drowsiness felt on monotonous roads [8]. Unfortunately, to our
knowledge, no countermeasure exists to counteract the effects of task monotony on the
driver's alertness other than changing the road design (adding curves) to increase the demands
of the driving task.
One promising line of research into monotony is to present some stimuli to the driver to
regain their attention. A simulator experiment has been conducted to test the effectiveness of
breaking monotony by adding visual elements on the edge of the road, without changing the
road geometry [2]. Driver fatigue was monitored through the steering wheel movement, the
task being to stay in the middle of the lane when driving. This resulted in the observation of
rapid driver fatigue, even though stimuli had been added. This approach is efficient only for a
short time, since the driver is becoming habituated to the stimulus after a few repetitions. A
countermeasure against driver drowsiness and fatigue is exposure to sound, playing on
amplitude and frequency to increase wakefulness [13].
This highlights the necessity to develop a detector of driver vigilance impairment. Different
types of technologies are being researched, mainly using physiological devices such as the
EEG due to its good test and retest reliability and high reproductability [14]. Fatigue-related
crash can be predicted by observing an increase in the generation of grouped alpha waves and
informing the driver automatically [15]. Data from the driver and mechanical parameters
related to the vehicle can be integrated in a generalized Gaussian neural network to create an
automatic diagnosis of the driver states of vigilance [16]. Data can also be merged from
different sensors with belief theory to create better estimates of driver vigilance [17]. Systems
to detect hypovigilance in real-time are also under investigation using artificial intelligence
algorithms, such as in the AWAKE project [18].
METHODS TO ASSESS VIGILANCE LEVELS
Subjective assessments
Questionnaires can be useful in assessing the subjective component of vigilance. For instance
the Karolinska Sleepiness Scale is an index of the self reported alertness and sleepiness level
which has been used by the AWAKE project [18] to assess the past ten minutes of alertness.
They can provide information about fatigue such as the time it appears and contributing
factors. Their limit comes from the fact that questionnaires cannot provide real time
fluctuations of vigilance. In addition, self-report techniques are not objective measures of
sleepiness and in the case of monotonous tasks, individual ratings of drowsiness do not give
consistent results with the physiological alertness level of the person [3].
5
Behavioural measures (performance tests)
The most common behavioural assessment of vigilance is through the reaction time to detect a
target. An increase in reaction times highlights a decrease in vigilance. Reduced vigilance
appears also in the rate of correct detections of targets (missed targets are referred to as errors
of omission) and the rate of non-targets reported (errors of commission) [19]. Such reaction
times and accuracy are assessed through psychomotor tests, in which a reduction of
performance is interpreted as a vigilance decline. Indeed, the response to target can help in
quantifying the level of alertness of the subject. The limitation of such an estimator is that the
stimuli are presented at random times and are not available at each time (sparse sampling), so
that the error rate estimates are not obtained at each time. Another disadvantage of such tests
is that they create a secondary task that the driver has to perform, thereby raising the level of
cerebral activity. This can temporarily mask any possible signs of fatigue [20].
Physiological assessment
Many physiological methods and sensors are available to measure levels of fatigue or
alertness. Amongst them are electroencephalography (EEG), electroocculography (EOG),
electrocardiography (ECG), electromyography (EMG) and electrodermal activity (EDA).
EEG signals are quantitative measures of the electrical activity (rhythmic oscillations in
voltage) of the brain area at the location of the electrode. Research investigating attention with
EEG signals has mainly focused on the analysis of EEG rhythmicity, and the emergence of
sequences of regularly recurring waveforms of similar shape. Brain activity creates (brain)
waves in a narrow band of frequencies that cover 0 to 100 Hz. Only the 0 to 30 Hz band is
informative to study arousal [21]. Patterns are investigated into the frequency domain. Four
bands are widely used: alpha, beta, delta and theta bands [22]. Performance during a sustained
attention task is monotonically related to changes in the EEG power spectrum at several
frequencies. This relationship is relatively variable between subjects but stable within subjects
[23]. The main limitations of EEG are its obtrusiveness and its sensitivity to participants'
movements and surrounding magnetic fields.
EOG is a technique for measuring eye movements. EOG is considered as an indicator of the
onset of fatigue. Oculomotor activity during fatigue is mainly studied through eye blink
amplitude, duration, and frequency. Measuring eye movement allows the extraction of blink
rate and duration as well. Eye movements give valuable warning signs of drowsiness: fast eye
movement and conventional blinks in the alert state are replaced by no eye movement and
small, fast rhythmic blinks during transition to fatigue [9]. Also, as drowsiness arises, blink
duration increases, while blink amplitude decreases, and blinks occur more frequently [24].
Disappearance of blinks and mini-blinks and relative quiescence in eye movement are the
earliest reliable signs of drowsiness, preceding slow eye movement and EEG alpha frequency
and amplitude changes [25]. Following signs of driving fatigue does not absolutely require the
use of an EOG. Recording a video of the face of the driver can give the same information
through the study of facial tone, slow eyelid closure, and yawning. In particular, some
equipments furnish not only the video but all the measurements of interests (blinks, eye
position, etc.), and can therefore replace an EOG.
Heart rate can be monitored to assess individual drowsiness. It is a physiological measure of
workload. Most studies show that the metric heart rate, if it changes at all, increases and the
6
metric heart rate variability decreases during effortful mental processing [8]. It has also been
shown that heart rate decreases significantly during a monotonous driving task [14]. However,
further controlled experiments are required to assess the automatic consequences of driver
fatigue in terms of heart rate changes [9].
EDA is frequently used as an indirect measure of attention, cognitive effort, or emotional
arousal [26]. EDA can be distinguished into tonic and phasic parts. The skin conductance
level (SCL) is the tonic value and shows the continuity of activity over time. The skin
conductance response (SCR) is the phasic part and reveals changes in skin conductance
within a short time period [27]. SCR can be due to stimulus or non-specific causes. An
increase in tonic EDA indicates readiness for action and an increase of phasic EDA indicates
that one's attention is directed toward a stimulus [28,29]. Skin conductance, in both tonic and
phasic parts, is therefore expected to decrease during monotonous tasks, which is supported
by the Mackworth Clock Test [30].
The difficulty in assessing vigilance comes from the fact that states change more or less
gradually, which make it difficult to draw a clear dividing line between alert, drowsy, and
sleep. That is why adding electromyography (EMG) can be useful, since during sleep, muscle
activity decreases. Muscular tonus decreases throughout the process of alertness decrement
and reaches its minimum when asleep. This sensor is usually used complementary to EEG
recording [22].
Choice of the EEG as a reference
In view of predicting hypovigilance in real time it is necessary to be able to assess drivers'
vigilance while driving. Some criteria have to be reached: (i) the assessment must be
continuous, (ii) this assessment must be reliable, (iii) objective and (iv) non intrusive.
Questionnaires cannot be used as a reference as they do not detect real time fluctuations of
vigilance. Using psychomotor tests is difficult due to the introduction of a secondary task
which interferes with the primary task. This task may change the arousal of the participant
and therefore impact the reliability of the test. Physiological sensors (such as EEG, EOG, etc.)
can measure the vigilance level at each time of the experiment. These sensors are not
intrusive, but obtrusive and not practical if installed in a car (during everyday driving). They
give objective results, although their results vary from one person to another, which suggests
the necessity of personalised references for each participant. The most valid index of alertness
in the driver is the EEG [31], which has the advantage of furnishing an accurate, immediate
and real-time detection of vigilance and continuous monitoring of its different levels [23].
Although promising results about EDA have been found [30], no sufficient evidence exists to
use this sensor to characterise the state of vigilance. Cardiac activity has not been found to
change during monotonous tasks [30], but can be used as an indicator of difficulty to perform
a task since its variability decreases during mental tasks. Nevertheless, its sensitivity in
distinguishing different levels of task difficulty is insufficient [32]. EOG is not as reliable as
EEG, though it performs fairly well. This supports the idea of taking EEG as a reference when
assessing vigilance.
The main disadvantage of using EEG as a reference comes from the fact that EEG data is
highly sensitive to movement artefacts. The noise comes from the fact that the frequency
range of these artefacts overlaps with a strong influence on the informative range of the EEG
signal, so that filters cannot be used. The only solution is to avoid taking into account this
7
data. Then, such a device cannot be put in a vehicle for at least three reasons: the
inconvenience for the driver, the prohibitive cost and the corruption of data in the car due to
electromagnetic field interferences. Nevertheless, such a device can be used in a laboratory-
based experiment. This reference can objectively provide the occurrences of vigilance
decrement. Then correlation between the vigilance level and surrogate measurements can be
determined. This overcomes the disadvantage of using EEG as a reference.
VIGILANCE ASSESSMENT WITH AN EEG
Frequencies with vigilance information
Alpha activity ranges between 8 and 13 Hz. It is present during relaxed wakefulness and
during the transition to drowsiness and is highly attenuated during attention, concentration,
stimulation or visual fixation. When present, this activity reveals a reduced readiness to react
to stimuli during a relaxed condition, and should not be taken for a highly receptive state [9].
In fact it appears in individuals prone to sleepiness [21]. Alpha activity is particularly found
over the occipital cortex, where it emerges, before spreading more anteriorly. Nevertheless up
to 10% of the population does not show any alpha activity [33] and only around three fourths
of all individuals show alpha activity when they are awake and relaxed [9].
Beta activity ranges between 13 and 30 Hz. This activity is associated with increased
alertness, arousal, excitement and certain phases of drowsiness [22]. This activity decreases
during drowsiness [1]. During vigilance tasks, it has been shown that an increase in beta
activity is related to a performance improvement [34].
Delta activity ranges between 0.5 and 4 Hz. Such waves increase during transition to
drowsiness and are prominent during deep sleep [22,25] so that it is more related to sleep
proper. Therefore this activity is not expected to be found during a driving task [1].
Theta activity ranges between 4 and 7 Hz. Theta activity reveals access to memory and
internal focusing. The level of this frequency band increases during drowsiness and mainly
occurs at sleep stage I [1], replacing alpha waves at the onset of sleep [22]. Delta and theta
activities are the slow wave activities and are more likely to be present in the anterior, central
and parietal regions of the brain [9].
EEG characteristics for different vigilance levels
From the spectral analysis, different indices are created and can be used to assess vigilance
using an EEG device [1]:
• basic index, which is the relative power of a band. These indices have a tendency to
“contradict each other”
• ratio index, particularly to assess level of low and high frequencies
• burst index, to detect the increases in bands occurring relatively sparsely. It can
particularly be used to detect microsleep when following alpha and theta activities.
8
Different methods to detect fatigue through EEG signals have been proposed, such as the
detection of alpha spindles [35] and the following metrics: (i) β
θα + and (ii)
α
β [1] or (iii)
βα
θα
+
+ and (iv)
β
θ [14] or (v)
βα
δθ
+
+ and (vi)
α
θ [36]. The first four ratios have been
compared and (i) is the more reliable indicator of fatigue (when increasing), being the ratio
between slow and fast wave activities. (v) is another way to create a ratio of lower and higher
frequencies that has been linked to alertness (the higher the ratio, the less the arousal). Ratio
(vi) is created from (v) and is less sensitive to noise, especially when EEG signals are not
equal in quality in the different energy levels [8]. When increasing, these ratios between slow
and fast wave activities indicate decreased arousal [36]. Also the alpha band can be used on
its own to assess attention level. The power of alpha activity is lower during increased
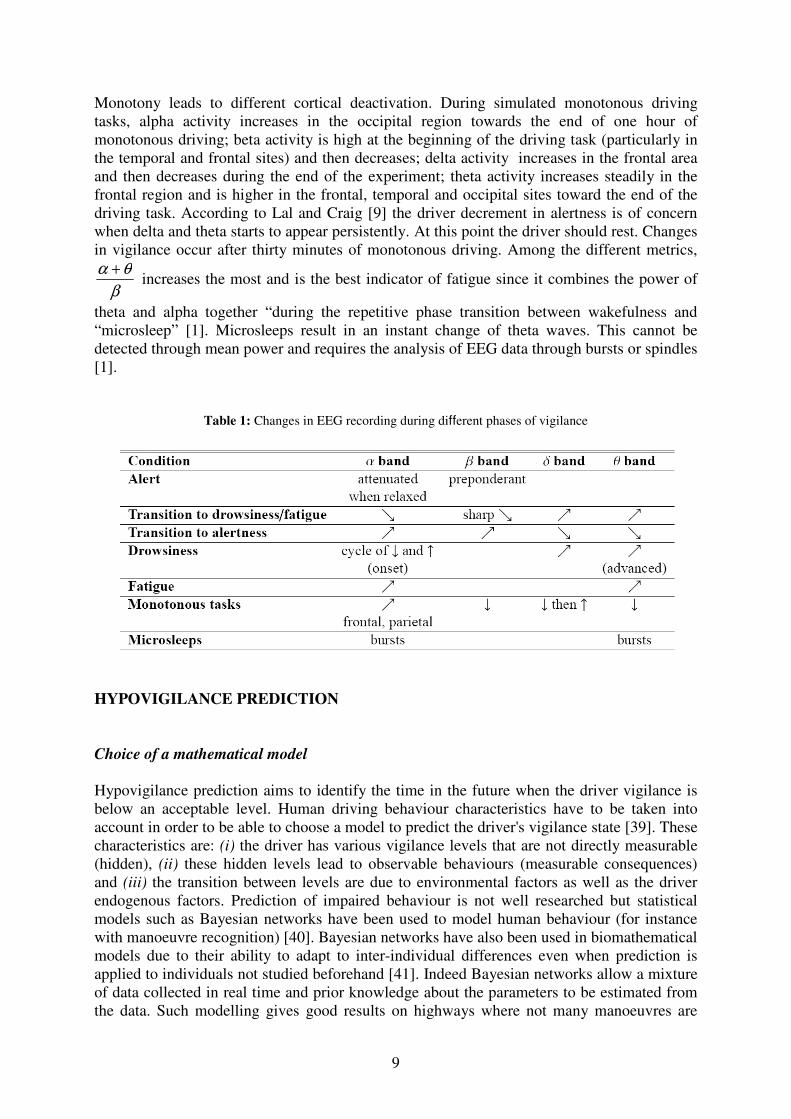
attention, particularly if this attention is visual. The changes of these indices in the different
levels of vigilance are detailed in the following paragraphs and are summarised in Table 1.
The EEG signal of an awake, alert and highly attentive individual is characterised by an EEG
signal largely composed of beta waves [22]. During attention (fully awake state) alpha waves
are highly attenuated. In the case of an individual still awake but very relaxed, alpha waves
may appear [9].
Lower frequencies, often associated with higher amplitude, reveal a lack of arousal, sleepiness
and unconsciousness. During a transition from waking to drowsy-sleep state, the individual
may lose the dominant beta, alpha frequencies and display theta activity. As a consequence,
an increase in activity in higher frequency bands (alpha, beta) can be interpreted as reflecting
a shift toward arousal and wakefulness, whereas an increase in activity in the lower
frequencies (theta, delta bands) would reveal a movement toward sleep [36]. For Belyavin
and Wright [37] the most useful indicator of reduced vigilance is the sharp decrease in beta.
At the onset of drowsiness, alpha activity attenuates or disappears, reappears in cycles until it
disappears at the onset of sleep [38]. This increase of the amplitude occurs in the centrofrontal
lobe lasting between one and ten seconds. This often occurs concurrently with a decrease in
the amplitude in the occipital alpha [25]. The drowsy state is characterised by an increase in
delta and theta activities. Theta activity is maximal in the central and frontal regions of the
brain. Mid or posterior temporal alpha appears for several seconds or persists after occipital
alpha have already disappeared [9]. Any increase in cognitive demands will be immediately
followed by an energy drop in the combined alpha and theta bands [8]. A decrease in
performance can be associated with increased activity in the theta band and changes in the
alpha activity, both reflecting decrease in cortical arousal, whereas efficient task performance
can be associated with attenuation of theta activity [21].
During the onset of fatigue, delta and theta activities occur mostly in the frontal, central and
parietal areas of the brain (with some anterior alpha and posterior beta). Alpha and theta
bands are most likely to indicate sleepiness. During a driving task the power of alpha and
theta increases as the level of alertness of the driver decreases [1]. Most of the increase seen
in the alpha band is due to longer duration of eye blinks. Alpha bands are sensitive to changes
in alertness while theta and delta bands are necessary to distinguish lower levels of arousal
[9]. An increase in the energy level of the alpha and theta bands and a reduction of beta waves
are an indication of states of weariness and sleepiness [9,21,22].
9
Monotony leads to different cortical deactivation. During simulated monotonous driving
tasks, alpha activity increases in the occipital region towards the end of one hour of
monotonous driving; beta activity is high at the beginning of the driving task (particularly in
the temporal and frontal sites) and then decreases; delta activity increases in the frontal area
and then decreases during the end of the experiment; theta activity increases steadily in the
frontal region and is higher in the frontal, temporal and occipital sites toward the end of the
driving task. According to Lal and Craig [9] the driver decrement in alertness is of concern
when delta and theta starts to appear persistently. At this point the driver should rest. Changes
in vigilance occur after thirty minutes of monotonous driving. Among the different metrics,
β
θα + increases the most and is the best indicator of fatigue since it combines the power of
theta and alpha together “during the repetitive phase transition between wakefulness and
“microsleep” [1]. Microsleeps result in an instant change of theta waves. This cannot be
detected through mean power and requires the analysis of EEG data through bursts or spindles
[1].
Table 1: Changes in EEG recording during different phases of vigilance
HYPOVIGILANCE PREDICTION
Choice of a mathematical model
Hypovigilance prediction aims to identify the time in the future when the driver vigilance is
below an acceptable level. Human driving behaviour characteristics have to be taken into
account in order to be able to choose a model to predict the driver's vigilance state [39]. These
characteristics are: (i) the driver has various vigilance levels that are not directly measurable
(hidden), (ii) these hidden levels lead to observable behaviours (measurable consequences)
and (iii) the transition between levels are due to environmental factors as well as the driver
endogenous factors. Prediction of impaired behaviour is not well researched but statistical
models such as Bayesian networks have been used to model human behaviour (for instance
with manoeuvre recognition) [40]. Bayesian networks have also been used in biomathematical
models due to their ability to adapt to inter-individual differences even when prediction is
applied to individuals not studied beforehand [41]. Indeed Bayesian networks allow a mixture
of data collected in real time and prior knowledge about the parameters to be estimated from
the data. Such modelling gives good results on highways where not many manoeuvres are
10
performed, suggesting its relevance for hypovigilance prediction on monotonous roads.
Among these, Bayesian networks and particularly Hidden Markov Models (HMMs) have
shown their ability to adapt to the driver when performing prediction [39]. A HMM models
the evolution of vigilance states with time and correlates these vigilance states (hidden
variables) to the surrogate objective measures of vigilance states.
Proposed implementation
Previous research suggests using (i) the reliability of EEG and different other metrics from the
car, the driver and the environment and (ii) the prediction capabilities of mathematical models
to be able to predict hypovigilance before its appearance and its possible impairments on
driving ability. Such requirements make HMMs appropriate for predicting lapses in vigilance.
Driver vigilance can be modelled as the state that is hidden and is correlated to different
surrogate variables obtained from driver physiological measures (EOG, skin conductance),
vehicle measures (speed, steering wheel movement) and the environment (lane position,
geometry of the road and particularly the road curvature). The vigilance at time t can be
estimated through EEG analysis during the training of the model.
Prediction can be done in two different ways: predicting in time by subject and modelling the
vigilance at each time for the population of participants and then predicting the vigilance in
future time. The main disadvantage of the latter is that the model is not tuned for the
participant and this should result in lower accuracy during the prediction. Therefore
prediction is performed for each participant. Only the known surrogate variables until present
time t are required to predict the vigilance evolution: with the Viterbi algorithm, the
probabilities to be in a vigilance state at time t can be found and then prediction is performed
using the transition probabilities between different states. Such a modelling could be
improved if required by adding factors impacting the hidden variable such as a level of
monotony of the road, a time effect (which could show the impact fatigue due the task
performing) or even a link of the previous values of the observable variables on the current
state or observable variable. A hierarchy between the different variables could also be
included to model the causal relationships between environment, driver and car variables.
CONCLUSION
This review shows that road monotony leads to driving behaviour impairment comparable to
the one observed when the driver is fatigued. This impairment is of concern since currently no
efficient countermeasure exists. We have shown that the most reliable method to assess driver
vigilance continuously is the use of an EEG, though it is not practical to deploy in a car.
Nevertheless EEG can be used as a reference during the training of a HMM and can result in
accurately predicting from surrogate variables the time when the driver is likely to become
hypovigilant (i.e. without the use of an EEG). This review outlines a vision for future research
in the modelling of driver vigilance decrement due to monotonous driving conditions. Such a
modelling of driver vigilance should enable the future development of an in-vehicle device
which detects in advance the early signs of inattentive driving, thus offering the potential to
enhance road safety and prevent road crashes.
11
REFERENCES
[1] Eoh, H.J., M.K. Chung, S.-H. Kim (2005). Electroencephalographic study of drowsiness
in simulated driving with sleep deprivation, International Journal of Industrial
Ergonomics,vol.35, pp.307-320.
[2] Thiffault, P., J. Bergeron (2003). Monotony of road environment and driver fatigue: a
simulator study, Accident Analysis & Prevention,vol.35, pp.381-391.
[3] Brown, I.D. (1997). Prospects for technological countermeasures against driver fatigue,
Accident Analysis & Prevention,vol.29, pp.525-531.
[4] Scerbo, M.W. (1998). What's so boring about vigilance?, in Viewing psychology as a
whole: The integrative science of William N. Dember., American Psychological
Association, pp. 145-166.
[5] Brown, I.D. (1994). Driver fatigue, Human Factors,vol.36, pp.298-314.
[6] Eysenck, M.W. (2005). Cognitive psychology : a student's handbook, Hove, Psychology
Press.
[7] Evans, L. (2004). Traffic safety, Bloomfield, Mich., Science Serving Society.
[8] Oron-Gilad, T., A. Ronen, D. Shinar (2008). Alertness maintaining tasks (AMTs) while
driving, Accident Analysis & Prevention,vol.40, pp.851-860.
[9] Lal, S.K.L., A. Craig (2001). A critical review of the psychophysiology of driver
fatigue, Biological Psychology,vol.55, pp.173-194.
[10] Healey, J. (2004). Road safety, Thirroul, N.S.W., Spinney Press.
[11] Philip, P., P. Sagaspe, N. Moore, J. Taillard, A. Charles, et al. (2005). Fatigue, sleep
restriction and driving performance, Accident Analysis & Prevention,vol.37, pp.473-
478.
[12] Horne, J., L. Reyner (1999). Vehicle accidents related to sleep: a review, Occupational
and environmental medicine,vol.56, pp.289-294.
[13] Landstrom, U., K. Englund, B. Nordstrom, A. Astrom (1999). Sound exposure as a
measure against driver drowsiness, Ergonomics,vol.42, pp.927-937.
[14] Jap, B.T., S. Lal, P. Fischer, E. Bekiaris (2009). Using EEG spectral components to
assess algorithms for detecting fatigue, Expert Systems with Applications,vol.36,
pp.2352-2359.
[15] Idogawa, K. (1991). On the brain waves activity of professional drivers during
monotonous work, Behaviormetrika,vol.30, pp.23-34.
[16] Khardi, S., N. Hernandez-Gress (2000). Validation d'un nouveau systeme hybride de
diagnostic de l'etat de vigilance du conducteur (Validation of a new hybrid system for
diagnosing driver state), Recherche - Transports - Securite,vol.66, pp.101-112.
[17] Gruyer, D., A. Rakotonirainy, J. Vrignon (2005). The use of belief theory to assess
driver’s vigilance, In Proceedings Australasian Road Safety Research, Policing and
Education Conference, Wellington, New Zealand.
[18] Bekiaris, E., A. Amditis, K. Wevers (2001). Advanced Driver Monitoring: The
AWAKE Project, In Proceedings 8th World Congress on ITS, Sydney, Australia.
12
[19] Davies, D.R., R. Parasuraman (1982). The psychology of vigilance, London, Academic
Press.
[20] Grandjean, E. (1979). Fatigue in industry, Br. J. Internal Med.,vol.36, pp.175-186.
[21] Duta, M., C. Alford, S. Wilson, L. Tarassenko (2004). Neural Network Analysis of the
Mastoid EEG for the Assessment of Vigilance, International Journal of Human-
Computer Interaction,vol.17, pp.171-195.
[22] Akin, M., M.B. Kurt, N. Sezgin, M. Bayram (2008). Estimating vigilance level by using
EEG and EMG signals, Neural Computing & Applications,vol.17, pp.227-236.
[23] Jung, T.-P., S. Makeig, M. Stensmo, T.J. Sejnowski (1997). Estimating alertness from
the EEG power spectrum, IEEE Transactions on Biomedical Engineering,vol.44, pp.60-
69.
[24] Svensson, U. (2004). Blink behaviour based drowsiness detection, National Swedish
Road & Traffic Research Institute.
[25] Santamaria, J., K.H. Chiappa (1987). The EEG of drowsiness in normal adults, J. Clin.
Neurophysiol.,vol.4.
[26] Critchley, H.D., R. Elliott, C.J. Mathias, R.J. Dolan (2000). Neural activity relating to
generation and representation of galvanic skin conductance responses: A functional
magnetic resonance imaging study, Journal of Neuroscience,vol.20, pp.3033-3040.
[27] Schmidt, S., H. Walach (2000). Electrodermal activity (EDA): State-of-the-art
measurement and techniques for parapsychological purposes, Journal of
Parapsychology,vol.64, pp.139-163.
[28] Schell, A.M., M.E. Dawson, K.H. Nuechterlein, K.L. Subotnik, J. Ventura (2002). The
temporal stability of electrodermal variables over a one-year period in patients with
recent-onset schizophrenia and in normal subjects, Psychophysiology,vol.39, pp.124-
132.
[29] Stanton, N., A. Hedge, K.A. Brookhuis, E. Salas, H.W. Hendrick (2004). Handbook of
Human Factors and Ergonomics Methods, London, CRC Press.
[30] Steele, T., T. Cutmore, D.A. James, A. Rakotonirainy (2004). An investigation into
peripheral physiological markers that predict monotony, 2004 Road Safety Research,
Policing and Education Conference (Perth).
[31] Horne, J., L. Reyner (1995). Driver sleepiness, Journal of Sleep Research,vol.4, pp.23-
29.
[32] Johansson, E., J. Engström, C. Cherry, E. Nodari, A. Toffetti, et al. (2005). Review of
existing techniques and metrics for IVIS and ADAS assessment, AIDE.
[33] Andreassi, J.L. (2000). Psychophysiology: Human behavior and physiological response,
Mahwah, NJ, US, Lawrence Erlbaum Associates Publishers.
[34] Scerbo, M.W., F.G. Freeman, P.J. Mikulka, R.W. Backs, W. Boucsein (2000). A
biocybernetic system for adaptive automation, in Engineering psychophysiology: Issues
and applications., Lawrence Erlbaum Associates Publishers, Mahwah, NJ, US, pp. 241-
253.
[35] Tietze, H. (2000). Stages of fatigue during long duration driving reflected in alpha
related events in the EEG, In Proceedings International Conference on Traffic and
Transport Psychology, Bern.
13
[36] Bastien, C.H., C. Ladouceur, K.B. Campbell (2000). EEG characteristics prior to and
following the evoked K-Complex, Canadian Journal of Experimental
Psychology,vol.54, pp.255-265.
[37] Belyavin, A., N.A. Wright (1987). Changes in electrical activity of the brain with
vigilance, Electroencephalography & Clinical Neurophysiology,vol.66, pp.137-144.
[38] Markand, O.N. (1990). Alpha rhythms, Clin. Neurophysiol.,vol.7, pp.163–189.
[39] Kumagai, T., M. Akamatsu (2006). Prediction of Human Driving Behavior Using
Dynamic Bayesian Networks, IEICE TRANS. INF. & SYST.,vol.E89–D, pp.857-860.
[40] Gerdes, A. (2006). Driving Manoeuvre Recognition, In Proceedings 13th World
Congress and Exhibition on Intelligent Transport Systems and Services, London, UK.
[41] Van Dongen, H., C. Mott, J. Huang, D. Mollicone, F. McKenzie, et al. (2007).
Optimization of biomathematical model predictions for cognitive performance
impairment in individuals: Accounting for unknown traits and uncertain states in
homeostatic and circadian processes, SLEEP,vol.30, pp.1129-1143.