predicting effect of varying load
TRANSCRIPT

International Journal of Mechanical Engineering Research and Development (IJMERD), ISSN 2248 –
9347(Print) ISSN 2248 – 9355(Online), Volume 1, Number 1, January - April (2011)
1
PREDICTING EFFECT OF VARYING LOAD, VELOCITY AND
NUMBER OF CYCLES ON DEPTH OF WEAR OF CUPB24SN4
METAL LINED BUSH BY ENDURANCE TEST
Sanjay Chikalthankar Department of Mechanical Engineering, Government College of Engineering
Aurangabad (M.S.), INDIA ([email protected])
V.M.Nandedkar
Department of Production Engineering, SGGS Institute of Engineering and Technology
Nanded (M.S.), INDIA ([email protected])
ABSTRACT
Hydrodynamic CuPb24Sn4 material Journal bearings are widely used in automobile and
industrial application because of its excellent compatibility, conformability, dirt embeddability,
efficiency and low cost. The bearing is often subjected to many stops and starts with unknown
load cycles. During this transient period friction is high and bushes become progressively worn-
out, thus inducting certain disabilities. The bushes are provided with a lining of CuPb24Sn4
material which is found in range of 450 to 600 micron. The bearing designers are not provided the
attention toward this dimension as in practice the failure of bushes observed by seizer, scoring,
pitting, cavitations, loss of Babbitt due to high fatigue loads etc. The total depth of wear of
healthy journal bearing is observed 150 to 180 micron up to 40000 kilometers run.
The aim of present experimental work to determine the effect of variable load, sliding
velocity of shaft and Number of cycles on depth of wear of lining thickness of CuPb24Sn4
material bush bearing under Endurance Test. The study predict sliding wear behavior of
CuPb24Sn4 material under a varying Load cycles which is combination of results of Engine
cylinder pressure at rated power, maximum torque idle speed. The endurance test run
continuously for 36 hours for speed ranges from 1200 rpm to 3600 rpm and load ranges from
9800 N 11883 N for a sample. The effect of number of cycles on depth of wear (dw) of lining
thickness is accounted for same load cycles and number of cycles varying from 2.52x10⁷
to
2.16x10⁸. The relationship between depth of wear of lining thickness (dw) versus Varying load,
shaft speed, and time is established by using the experimental results from endurance test and
good agreement between prediction and experimental results was obtained. The endurance results
indicate that the critical parameter affecting on depth of wear of lining thickness of bush material
is time followed by velocity and load. This study is helpful to finding practical life of bush
bearing under varying conditions for particular depth of lining material.
Keywords: crank shaft bush bearing, Endurance test, depth of wear, lining thickness
1. INTRODUCTION
Oil lubricated bearings employing sintered Cu-Pb24-Sn4 metal are widely used in many
automobile, industrial, marine, machine applications. Particularly in automobile single cylinder
engine the crankshaft supported by bushing of Cu-Pb24-Sn4 lining material because of its good
IJMERD
© PRJ PUBLICATION
International Journal of Mechanical Engineering Research and
Development (IJMERD), ISSN 2248 –9347(Print)
ISSN 2248 – 9355(Online), Volume 1, Number 1
January - April (2011), pp. 01-11
© PRJ Publication, http://www.prjpublication.com/IJMERD.asp
International Journal of Mechanical Engineering Research and Development (IJMERD), ISSN 2248 –
9347(Print) ISSN 2248 – 9355(Online), Volume 1, Number 1, January - April (2011)
2
fatigue strength and cavitation erosion resistance, compatibility and conformability. These
bearing are normally operated in stable hydrostatic condition wherein a proper oil-film thickness
is formed and maintained by using gear pump. The influencing parameters on wear of automobile
crankshaft bearing are studied in recent works due to fact that Manufacturers try to improve
performance of the journal bearing and reduce cost of bearing induced in manufacturing and
maintenance.
The most common form of wear is that damage to the surface, and is loss or displacement
of material which affect on performance of the part. Generally volume of material removed or
volume of material displaced is measured to account the wear but in case of wear of bushing
material lining the wear is in micron which increase in clearance and change the contour of
surface and geometry of surface. Hence in this experimentation wear is measured as depth of
wear at define point. The bush is marked circumferentially with the points a,b,c,d,e,f,g, from
“Front” and a’, b’, c’, d’, e’, f’, g’, from “Rear” side. Duckworth and Forrester [1] has analyze the
wear in lubricated bearing while Dufrane et al [2] proposed theoretical model of worn bearing
and analyzed wear pattern of steam turbine bearing and presented that wear occurred
symmetrically at the bottom of the bearing. Bouyer J and Filon M, [3] presented influence of
wear on steady state characteristics of bearings which concluded that wear defect could lead to an
increase in thermodynamic performances, wear defect lead to a significant fall in maximum
temperature and also to decrease in average operating temperature however the dissipated power
increases slightly. Bouyer J and et al.,[4] analyzed behaviors of two lobe worn hydrodynamic
journal bearing and presented that the influence of wear on operating condition is significant
when number of cycles more than 1000, even after wear depth reaches around 10% of bearing
operating radial clearance the worn bearing will remain usable and safe, while K.Tamura et al.,
[5] focused on effect of cyclic load and cyclic speed on sliding wear characteristics of bearing
lined with white metal that there is unique relationship between the mean stress and cut-off life
without depending on stress ratio, the cut-off life becomes shorter with increase in revolutions. Y.
Tachi et al., [6] presented a cumulative law for sliding wear which is useful for the prediction of
the effect of interferential shear stress on rate of steady state wear of tin based white metal, also
developed relationship between cut -off life, shaft revolutions and interferential shear stress.
The aim of present work was to analyze the influence of varying Load, Velocity and Number of
Cycles on depth of wear of CuPb24Sn4 metal lined bush by endurance test for real condition. The
sample of bush of Gl-400 engine of “PIAGGIO” auto rickshaw is dynamically tested on test bed
coupled with dynamometer and subjected to the defined “load-speed” cycles for 300 minutes to
1000 minutes. The experimental results compared with mathematical results and found good
agreement. Three samples of different lining thickness of same material were tested and the
numbers of trials for Load, Shaft speed and time variables were conducted as per “Taguchi
Method” [7] and it was observed as L9 orthogonal array.
2. TEST AND EXPERIMENTAL PROCEDURE
The chemical composition of lining material Cu-Pb24-Sn4 of bush used in endurance test
Rig is shown in Table1 and microstructure of material presented in figure 1. The test specimen
employed was a copper- lead- tin Bushing of GL-400 Engine used in “PIAGGIO Rickshaw”
Manufactured by Greaves limited. The schematic representation of bush with the specification is
shown in figure 3. The specification of engines was single cylinder GL-400 air cooled gasoline
engine, Bore : 86 mm, Stroke: 68 mm, Power output : 9 HP, Rated RPM : 3600
The Eddy Current type dynamometer measures torque produced by engine which can be
converted into power of the engine. The control panel of dynamometer was an interface through
which variables like load, engine rpm etc was set. The parameters like coolant temperature, oil
International Journal of Mechanical Engineering Research and Development (IJMERD), ISSN 2248 –
9347(Print) ISSN 2248 – 9355(Online), Volume 1, Number 1, January - April (2011)
3
temperature, oil pressure, exhaust back pressure, exhaust temperature, engine blow by etc. were
also measured.
Table 1: Chemical composition of lining material of bush bearing
Sr.
No.
Test Conducted Observations
1 Chemical Analysis
% Sn 4.64
% Pb 24.60
% P 0.008
% Fe 0.02
% Si 0.001
% Zn 0.003
% Cu Balance ( 70.80 )
2 Hardness in HV 1 70 – 75 HV 1
3 Micro Structure It shows Sn – Pb phase is having acicular in shape &
having uniform distribution in Copper matrix.
Magnification: 100X Magnification: 500X
Figure 1 : Microstructure of Lining Material
The Endurance test setup is shown in figure 2. The bush is marked circumferentially with the
points a, b, c, d, e, f, g, from “Front” and a’, b’, c’, d’, e’, f’, g’, from “Rear” side as shown in
developed view in figure 3. The surface roughness is measured specifically on these points by
using Taylor-Hobson Surtronic3+ Surface Roughness Measuring Instrument. The depth of cu-pb-
sn lining thickness of bush is measured specifically at above mentioned points in front and rear
side by using ultrasonic thickness measuring equipment before and after trial run. Load applied
while in test does not exceeding yield stress of the bush lining material. All measuring
instruments are calibrated as per IS standards. The oil viscosity, flow rate, was maintained as per
the given norms for the GL-400 Engine. The speed variation is 10 rpm, load variation is 0.2N,
Temperature variation is 0.5oc

International Journal of Mechanical Engineering Research and Development (IJMERD), ISSN 2248 –
9347(Print) ISSN 2248 – 9355(Online), Volume 1, Number 1, January - April (2011)
4
Figure 2: Engine Mounted on test bed Coupled with Dynamometer and control panel of
dynamometer
Figure 3 Schematic representation of bush
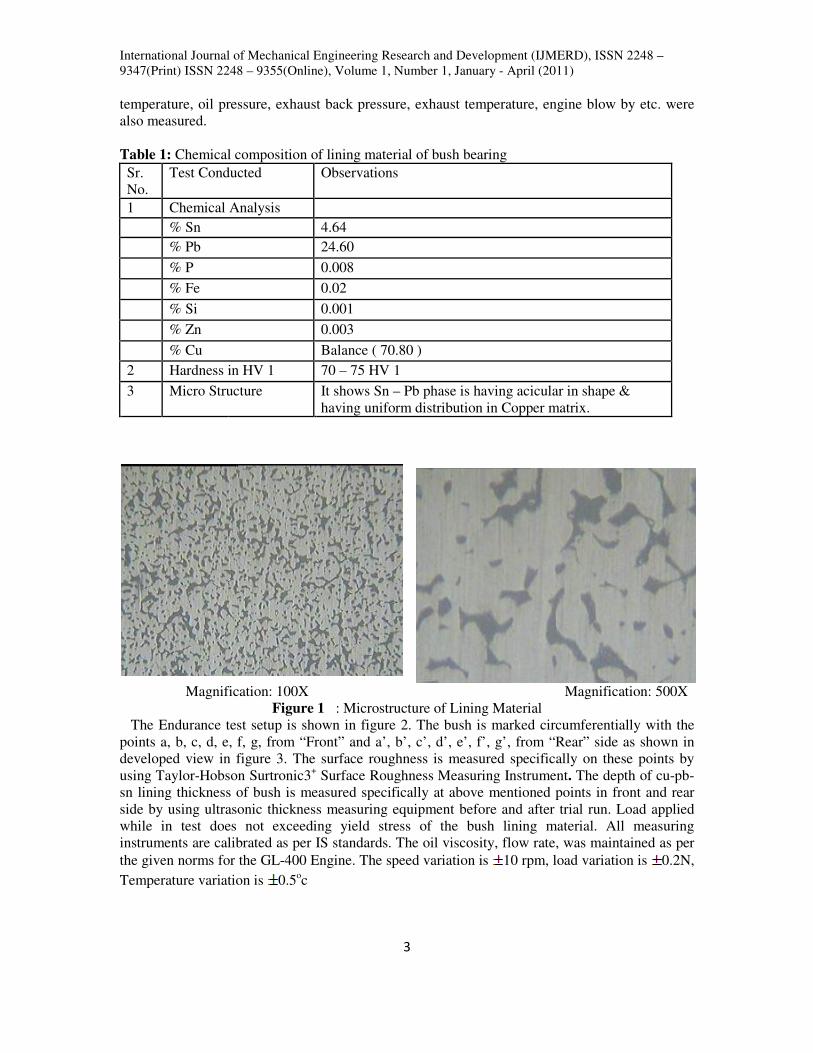
Load is influencing parameter on wear of bearing. The pressure developed in the hydrodynamic
action is function of load. P-theta diagram shows the inside cylinder pressure with respect to
crank angle. The cylinder pressure, exerted on piston produces force and same force is
transmitted to the crankshaft main bearings through the crank slider mechanism. It is necessary to
decide the load cycle of the bearing, to investigate it the P-theta diagram of engine was evaluated
for cylinder pressure at rated power rpm, max torque rpm, random point rpm and idle engine rpm.
The figure 4 representing all four conditions of P-theta diagram.
International Journal of Mechanical Engineering Research and Development (IJMERD), ISSN 2248 –
9347(Print) ISSN 2248 – 9355(Online), Volume 1, Number 1, January - April (2011)
5
Figure 4: P-Theta diagrams at different rpm
Above four cases are the key points considered from P-theta diagram to map the engine
performance and get the maximum pressure exerted on the piston. By using data force on bush
bearing is evaluated as Force = pressure x piston top area, it found 22.06 kN and hence on each
bearing it is treated as 11kN.
The detail bearing performance results obtained from software are same as theoretical
calculations. The Maximum load on each bearing observed in result is 11883.7 N because the
frictional losses and inertia forces are considered which are not accounted in theoretical
calculations.
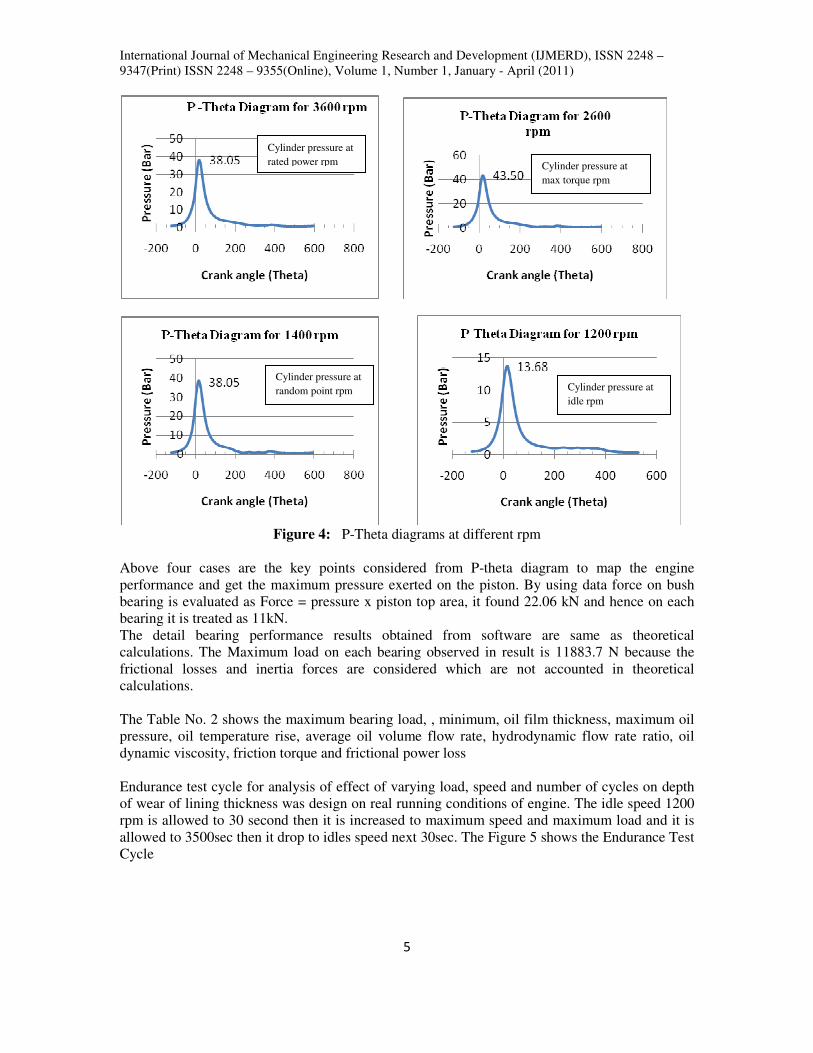
The Table No. 2 shows the maximum bearing load, , minimum, oil film thickness, maximum oil
pressure, oil temperature rise, average oil volume flow rate, hydrodynamic flow rate ratio, oil
dynamic viscosity, friction torque and frictional power loss
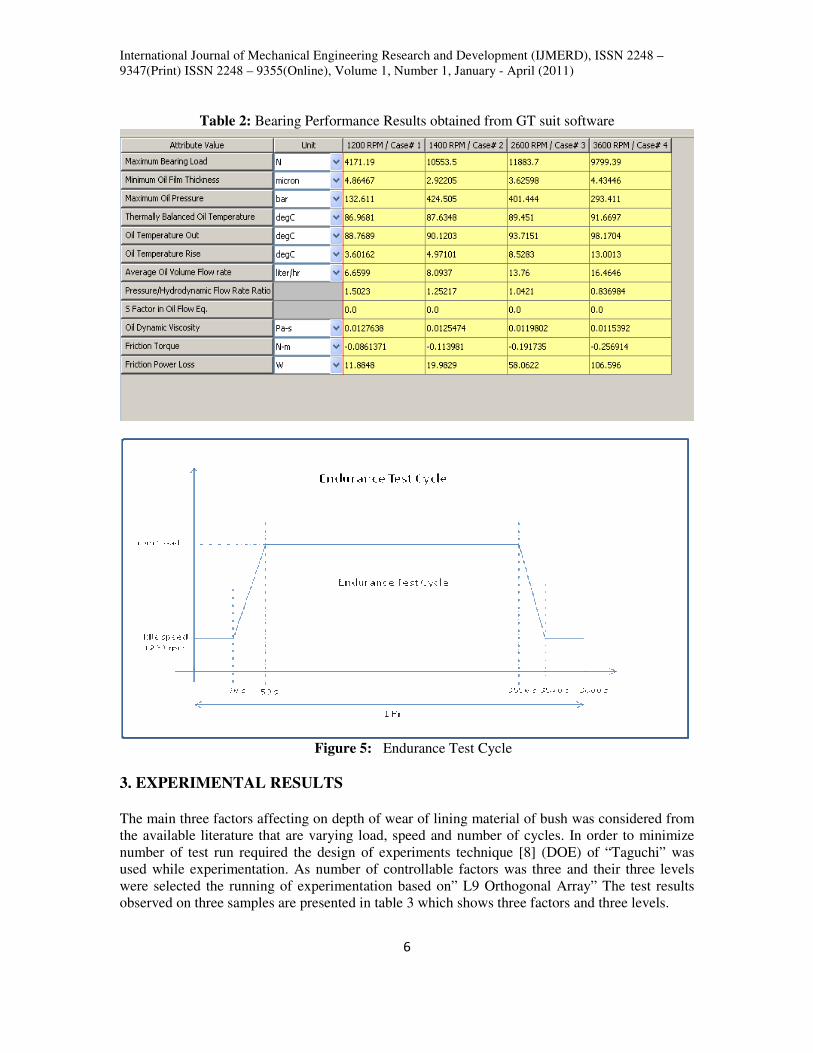
Endurance test cycle for analysis of effect of varying load, speed and number of cycles on depth
of wear of lining thickness was design on real running conditions of engine. The idle speed 1200
rpm is allowed to 30 second then it is increased to maximum speed and maximum load and it is
allowed to 3500sec then it drop to idles speed next 30sec. The Figure 5 shows the Endurance Test
Cycle
Cylinder pressure at
max torque rpm
Cylinder pressure at
rated power rpm
Cylinder pressure at
random point rpm Cylinder pressure at
idle rpm
International Journal of Mechanical Engineering Research and Development (IJMERD), ISSN 2248 –
9347(Print) ISSN 2248 – 9355(Online), Volume 1, Number 1, January - April (2011)
6
Table 2: Bearing Performance Results obtained from GT suit software
Figure 5: Endurance Test Cycle
3. EXPERIMENTAL RESULTS
The main three factors affecting on depth of wear of lining material of bush was considered from
the available literature that are varying load, speed and number of cycles. In order to minimize
number of test run required the design of experiments technique [8] (DOE) of “Taguchi” was
used while experimentation. As number of controllable factors was three and their three levels
were selected the running of experimentation based on” L9 Orthogonal Array” The test results
observed on three samples are presented in table 3 which shows three factors and three levels.

International Journal of Mechanical Engineering Research and Development (IJMERD), ISSN 2248 –
9347(Print) ISSN 2248 – 9355(Online), Volume 1, Number 1, January - April (2011)
7
Table 3: Summary of Endurance test data for crankshaft bearing of GL 400 engine (L9 OA)
Trial P (load) N V (Velocity of
journal) m/s T (Time) Min Wear (micron)
1 9800 2.93 300 20
2 9800 5.442 700 31
3 9800 7.536 1000 38
4 10553 2.93 700 30
5 10553 5.442 1000 37
6 10553 7.536 300 26
7 11883 2.93 1000 36
8 11883 5.442 300 23
9 11883 7.536 700 34
The combined relationship between cyclic load, speed of shaft and time and depth of wear of
lining material is decided by using regression analysis method. The combined effect of above
variables on depth of wear of lining thickness of bushing material is quantitatively modeled by
using above method [9]. Predicting depth of wear of lining thickness of bushing material is aim of
this experimental work under the influence of cyclic load, shaft speed and time.
Depth of wear for GL400 engine crank shaft bush Cu-Pb24-Sn4 material is calculated by using the
formula for calculating m1, m2 and m3
( ) ( ) ( ) ( ) ( )
( ) ( ) ( ) ( )
( ) ( ) ( ) ( ) ( )
( ) ( ) ( ) ( )
1,1 1 1,2 2 1,3 3 1,4 4 1,5 5
1,6 6 1,7 7 1,8 8 1,9 9
1 2 2 2 2 2
1,1 1,2 1,3 1,4 1,5
2 2 2 2
1,6 1,7 1,8 1,9
X Y X Y X Y X Y X Y
X Y X Y + X Y + X Ym =
X X + X + X + X
X + X + X + X
+ + + + +
+ + +
We get m1 = 0.0128, m2 = 0.032, m3 = 0.104
Therefore the wear rate equation becomes,
dw = K P 0.0128
V 0.032
T 0.104
Now K is found by substituting actual values of variables in the above equation for all nine
treatments and average was calculated as K = 13.146
Thus generalized depth of wear equation for PIAGGIO (GL400) Bush Cu-Pb24-Sn4 material is
given as dw = (13.146) P 0.0128
V 0.032
T 0.104
the mathematical relation between three variables is estimated by value of one variable with other
variables of distribution after fitting an equation by using regression statistic. Table 4 represents
regression statistics for Endurance test data.
Table 4: Regression Statistics for endurance test data
Multiple R 0.9743105
R Square 0.94928095
Adjusted R Square 0.91884952
Standard Error 0.027844467
Observations 9
International Journal of Mechanical Engineering Research and Development (IJMERD), ISSN 2248 –
9347(Print) ISSN 2248 – 9355(Online), Volume 1, Number 1, January - April (2011)
8
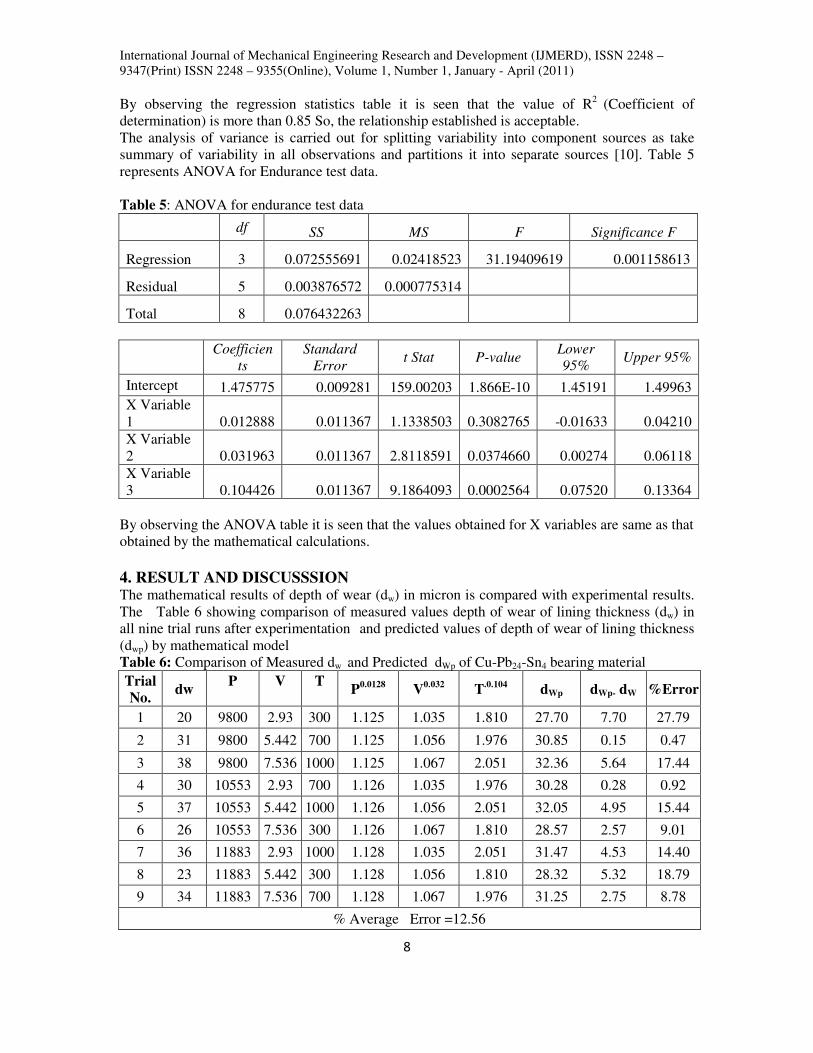
By observing the regression statistics table it is seen that the value of R2
(Coefficient of
determination) is more than 0.85 So, the relationship established is acceptable.
The analysis of variance is carried out for splitting variability into component sources as take
summary of variability in all observations and partitions it into separate sources [10]. Table 5
represents ANOVA for Endurance test data.
Table 5: ANOVA for endurance test data
df SS MS F Significance F
Regression 3 0.072555691 0.02418523 31.19409619 0.001158613
Residual 5 0.003876572 0.000775314
Total 8 0.076432263
By observing the ANOVA table it is seen that the values obtained for X variables are same as that
obtained by the mathematical calculations.
4. RESULT AND DISCUSSSION The mathematical results of depth of wear (dw) in micron is compared with experimental results.
The Table 6 showing comparison of measured values depth of wear of lining thickness (dw) in
all nine trial runs after experimentation and predicted values of depth of wear of lining thickness
(dwp) by mathematical model
Table 6: Comparison of Measured dw and Predicted dWp of Cu-Pb24-Sn4 bearing material
Trial
No. dw
P V T P
0.0128 V
0.032 T
.0.104 dWp dWp- dW %Error
1 20 9800 2.93 300 1.125 1.035 1.810 27.70 7.70 27.79
2 31 9800 5.442 700 1.125 1.056 1.976 30.85 0.15 0.47
3 38 9800 7.536 1000 1.125 1.067 2.051 32.36 5.64 17.44
4 30 10553 2.93 700 1.126 1.035 1.976 30.28 0.28 0.92
5 37 10553 5.442 1000 1.126 1.056 2.051 32.05 4.95 15.44
6 26 10553 7.536 300 1.126 1.067 1.810 28.57 2.57 9.01
7 36 11883 2.93 1000 1.128 1.035 2.051 31.47 4.53 14.40
8 23 11883 5.442 300 1.128 1.056 1.810 28.32 5.32 18.79
9 34 11883 7.536 700 1.128 1.067 1.976 31.25 2.75 8.78
% Average Error =12.56
Coefficien
ts
Standard
Error t Stat P-value
Lower
95% Upper 95%
Intercept 1.475775 0.009281 159.00203 1.866E-10 1.45191 1.49963
X Variable
1 0.012888 0.011367 1.1338503 0.3082765 -0.01633 0.04210
X Variable
2 0.031963 0.011367 2.8118591 0.0374660 0.00274 0.06118
X Variable
3 0.104426 0.011367 9.1864093 0.0002564 0.07520 0.13364

International Journal of Mechanical Engineering Research and Development (IJMERD), ISSN 2248 –
9347(Print) ISSN 2248 – 9355(Online), Volume 1, Number 1, January - April (2011)
9
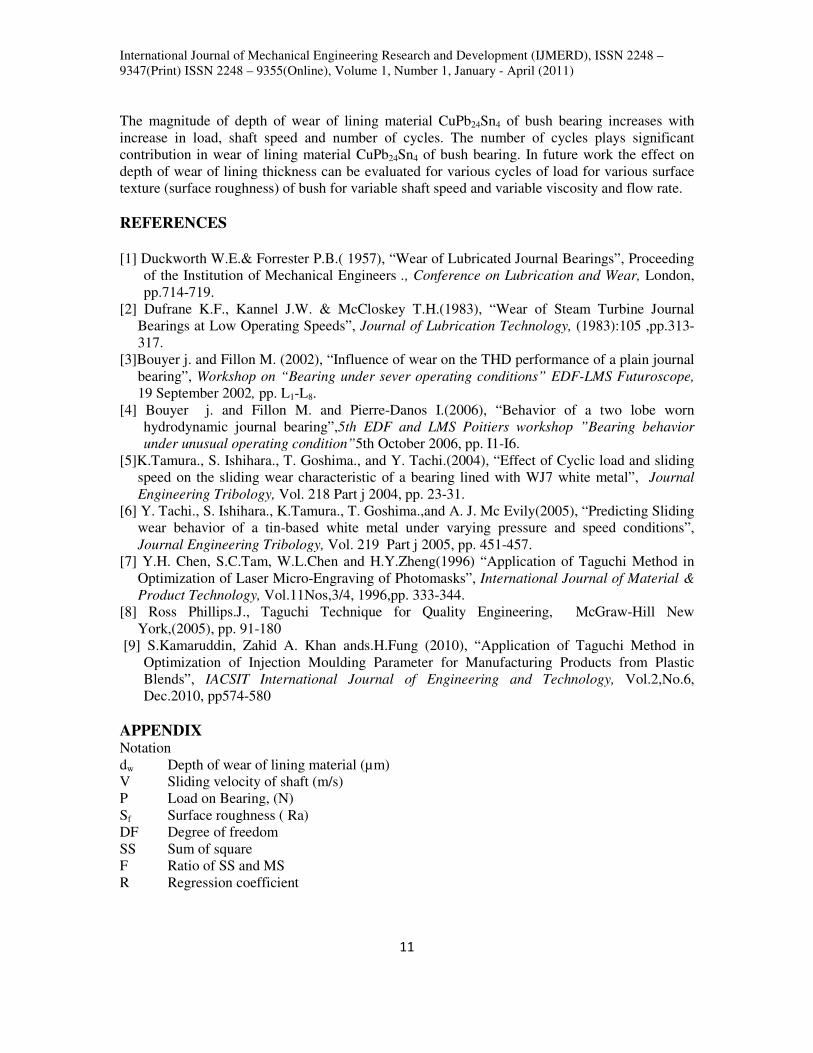
By comparing the experimentally measured depth of wear (dw) and mathematically predicted
depth of wear (dwp) for PIAGGIO (GL400) Rickshaw bush bearing Cu-Pb24-Sn4 lining material,
it is seen that average error is 12.56%.
The wear of lining thickness occurred symmetrically at the highest temperature zone in all three
samples. The evolution of wear based on load (P), shaft speed (v) and Time (T) of selected bush
samples. The depth of wear (dw) of lining thickness of bush particularly measured at front side on
points a,b,c,d,e,f,g,and at rear side on points a’,b’,c’,d’,e’,f’,g’, as bush might have been subjected
to small misalignment along width. The important finding is that circumferential point d and d’
found highest point of depth of wear which was also highest point of temperature. It is concluded
that depth of wear of lining thickness in all nine trail ranges from 20 to 37 microns while
predicted depth of wear was27.70 to-32.36 microns.
The operating characteristics of the bearing in real condition are nearly same as the endurance test
and there is no modification for any sample test. The each sample is subjected to rigorous 2.5x10⁷
cycles to8.4x107 cycles in order to get more significant effect on depth of wear. The pressure field
in bearing mid plane is slightly modified due to increase in wear thereby clearance. The trial
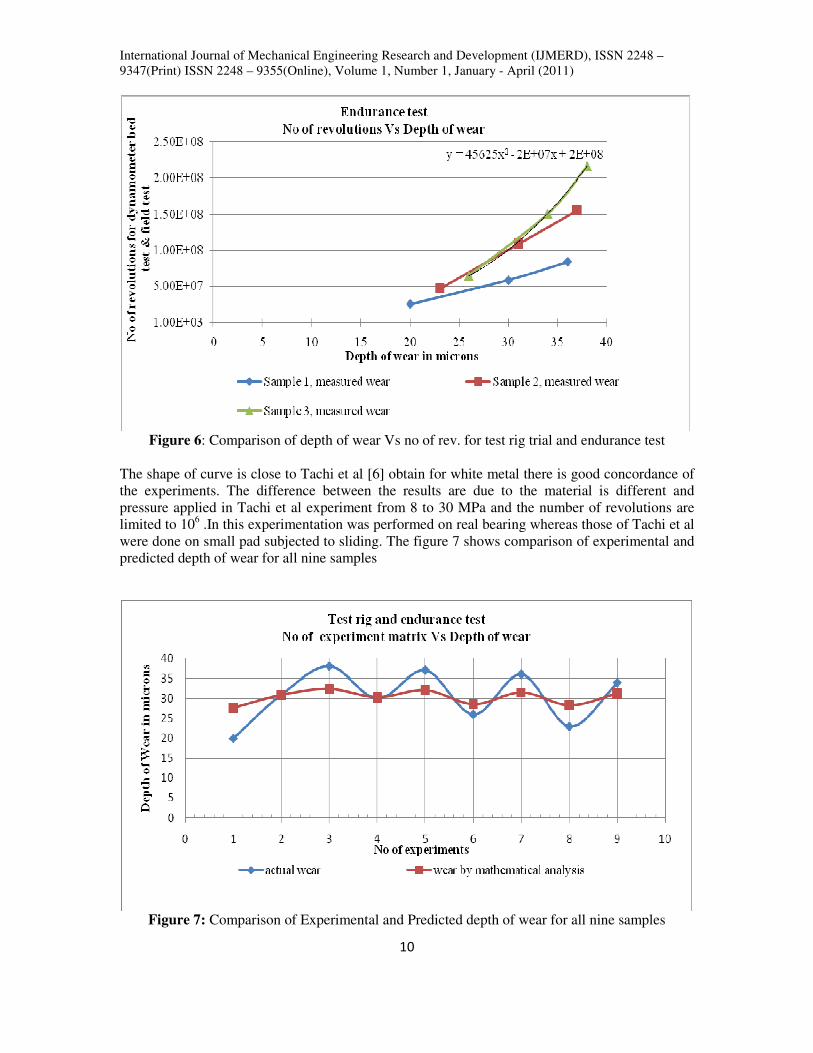
results of rpm and speed translated to number of revolution of shaft. The table 7 represents
endurance test data for number of revolutions of shaft, measured depth of wear and predicted
depth of wear of lining material and figure 6 shows comparison of all results.
Table 7: Endurance test data for number of revolution of shaft Vs Depth of wear
Time rpm No of rev Measured
wear Predicted wear
Sample 1 300 1400 2.52E+07 20 27.69
700 1400 5.88E+07 30 30.27
1000 1400 8.40E+07 36 31.47
Sample 2 300 2600 4.68E+07 23 28.32
700 2600 1.09E+08 31 30.85
1000 2600 1.56E+08 37 32.05
Sample3 300 3600 6.48E+07 26 28.57
700 3600 1.51E+08 34 31.25
1000 3600 2.16E+08 38 32.35
International Journal of Mechanical Engineering Research and Development (IJMERD), ISSN 2248 –
9347(Print) ISSN 2248 – 9355(Online), Volume 1, Number 1, January - April (2011)
10
Figure 6: Comparison of depth of wear Vs no of rev. for test rig trial and endurance test
The shape of curve is close to Tachi et al [6] obtain for white metal there is good concordance of
the experiments. The difference between the results are due to the material is different and
pressure applied in Tachi et al experiment from 8 to 30 MPa and the number of revolutions are
limited to 106 .In this experimentation was performed on real bearing whereas those of Tachi et al
were done on small pad subjected to sliding. The figure 7 shows comparison of experimental and
predicted depth of wear for all nine samples
Figure 7: Comparison of Experimental and Predicted depth of wear for all nine samples
International Journal of Mechanical Engineering Research and Development (IJMERD), ISSN 2248 –
9347(Print) ISSN 2248 – 9355(Online), Volume 1, Number 1, January - April (2011)
11
The magnitude of depth of wear of lining material CuPb24Sn4 of bush bearing increases with
increase in load, shaft speed and number of cycles. The number of cycles plays significant
contribution in wear of lining material CuPb24Sn4 of bush bearing. In future work the effect on
depth of wear of lining thickness can be evaluated for various cycles of load for various surface
texture (surface roughness) of bush for variable shaft speed and variable viscosity and flow rate.
REFERENCES
[1] Duckworth W.E.& Forrester P.B.( 1957), “Wear of Lubricated Journal Bearings”, Proceeding
of the Institution of Mechanical Engineers ., Conference on Lubrication and Wear, London,
pp.714-719.
[2] Dufrane K.F., Kannel J.W. & McCloskey T.H.(1983), “Wear of Steam Turbine Journal
Bearings at Low Operating Speeds”, Journal of Lubrication Technology, (1983):105 ,pp.313-
317.
[3]Bouyer j. and Fillon M. (2002), “Influence of wear on the THD performance of a plain journal
bearing”, Workshop on “Bearing under sever operating conditions” EDF-LMS Futuroscope,
19 September 2002, pp. L1-L8.
[4] Bouyer j. and Fillon M. and Pierre-Danos I.(2006), “Behavior of a two lobe worn
hydrodynamic journal bearing”,5th EDF and LMS Poitiers workshop ”Bearing behavior
under unusual operating condition”5th October 2006, pp. I1-I6.
[5]K.Tamura., S. Ishihara., T. Goshima., and Y. Tachi.(2004), “Effect of Cyclic load and sliding
speed on the sliding wear characteristic of a bearing lined with WJ7 white metal”, Journal
Engineering Tribology, Vol. 218 Part j 2004, pp. 23-31.
[6] Y. Tachi., S. Ishihara., K.Tamura., T. Goshima.,and A. J. Mc Evily(2005), “Predicting Sliding
wear behavior of a tin-based white metal under varying pressure and speed conditions”,
Journal Engineering Tribology, Vol. 219 Part j 2005, pp. 451-457.
[7] Y.H. Chen, S.C.Tam, W.L.Chen and H.Y.Zheng(1996) “Application of Taguchi Method in
Optimization of Laser Micro-Engraving of Photomasks”, International Journal of Material &
Product Technology, Vol.11Nos,3/4, 1996,pp. 333-344.
[8] Ross Phillips.J., Taguchi Technique for Quality Engineering, McGraw-Hill New
York,(2005), pp. 91-180
[9] S.Kamaruddin, Zahid A. Khan ands.H.Fung (2010), “Application of Taguchi Method in
Optimization of Injection Moulding Parameter for Manufacturing Products from Plastic
Blends”, IACSIT International Journal of Engineering and Technology, Vol.2,No.6,
Dec.2010, pp574-580
APPENDIX Notation
dw Depth of wear of lining material (µm)
V Sliding velocity of shaft (m/s)
P Load on Bearing, (N)
Sf Surface roughness ( Ra)
DF Degree of freedom
SS Sum of square
F Ratio of SS and MS
R Regression coefficient