predicting match using speed dating data
TRANSCRIPT

Business Analytics Projectfor Friendship & Relationship Connection
INFO 577
Francesca Jean-BaptisteRicha Girdhar
2
AGENDA
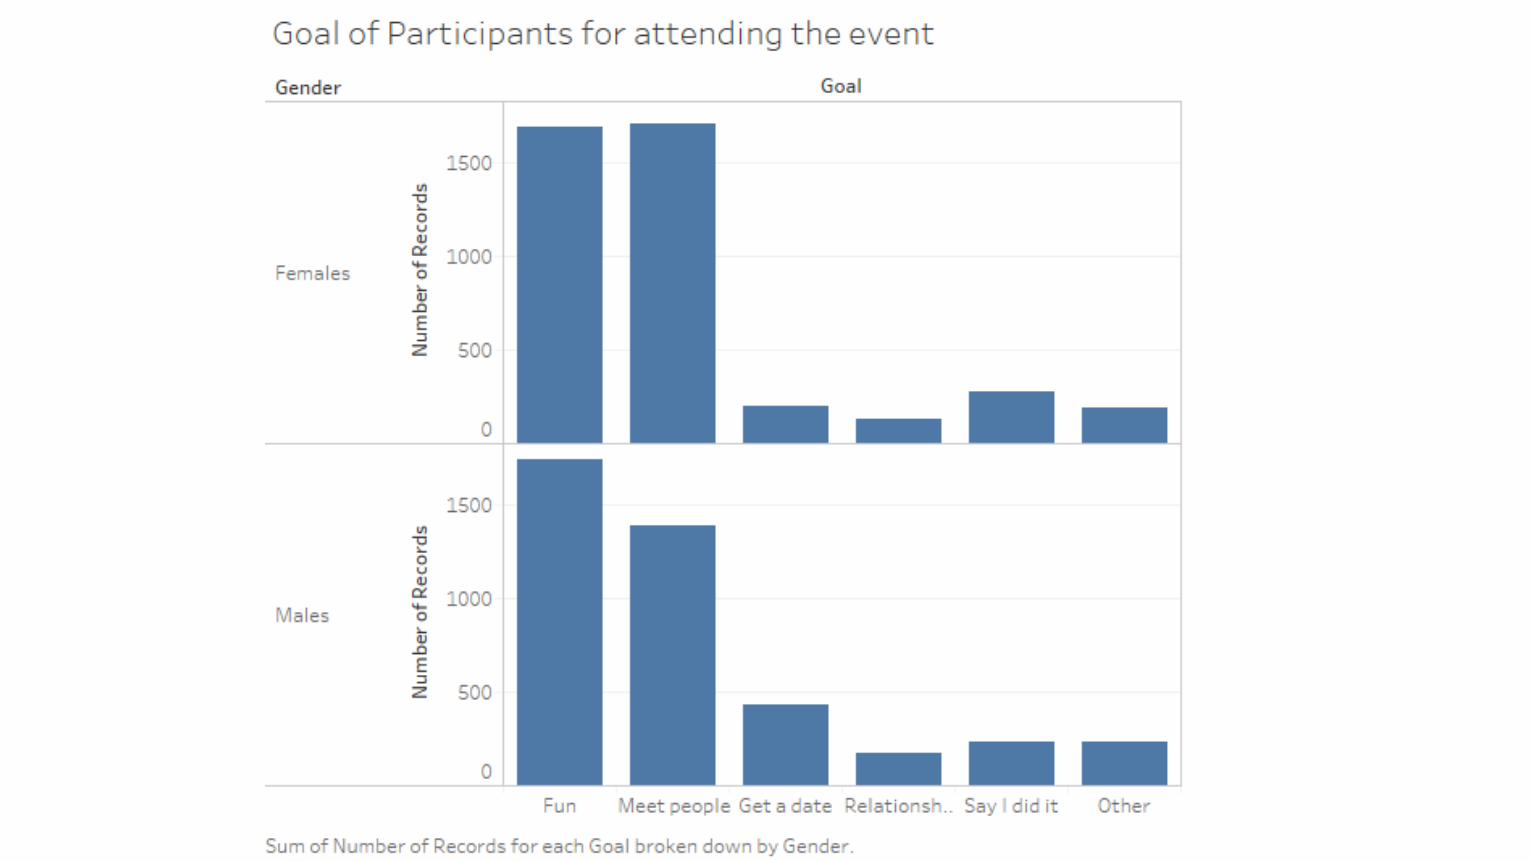
• Business Case
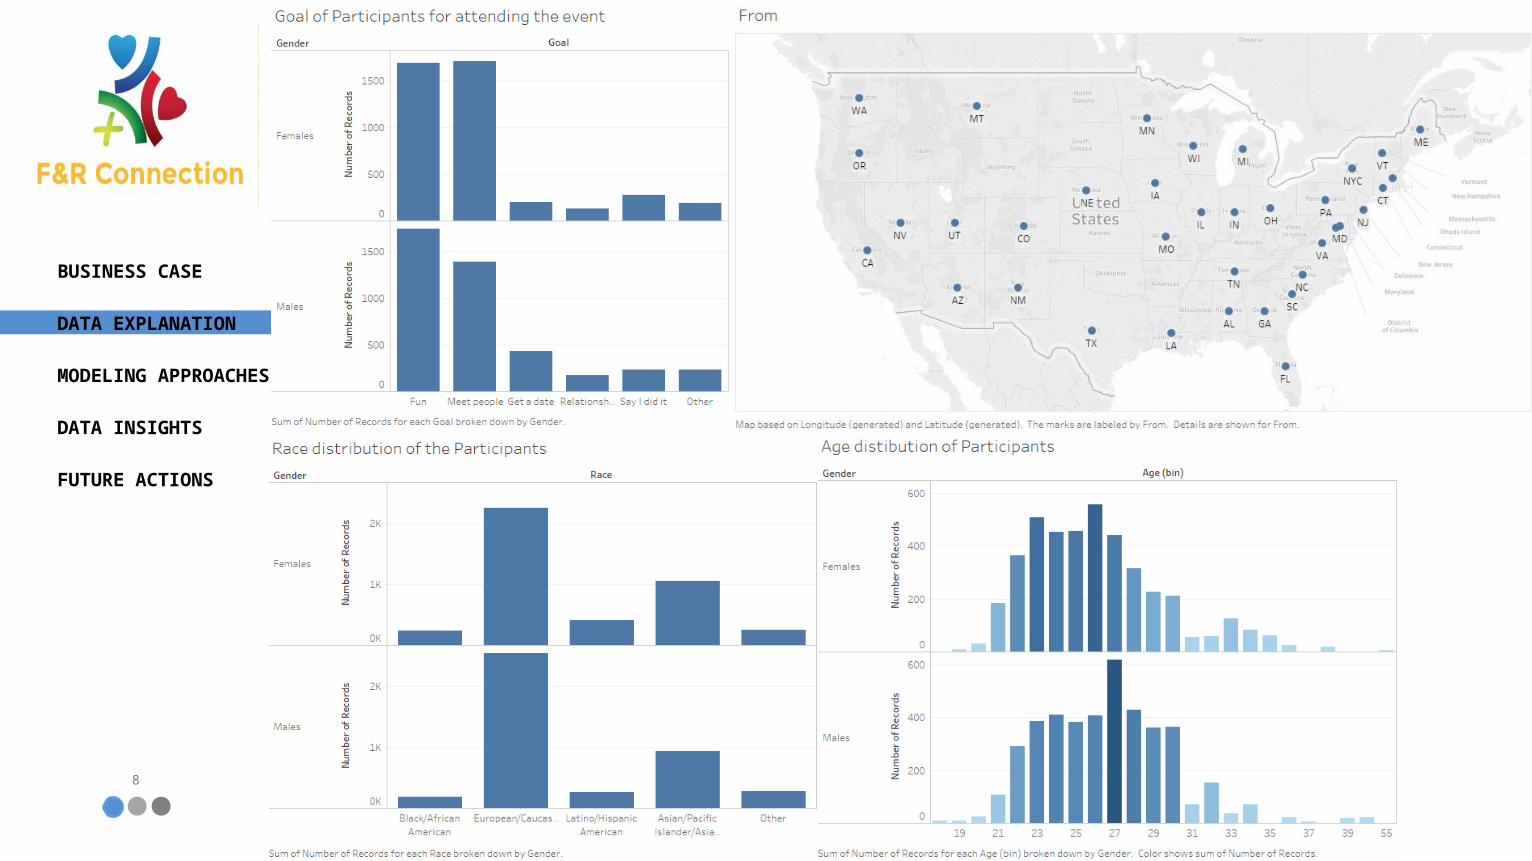
• Data Explanation
• Modeling Approaches
• Data Insights
• Future Actions
3
BUSINESS CASE
DATA EXPLANATION
MODELING APPROACHES
DATA INSIGHTS
FUTURE ACTIONS
As of today the dating industry is worth approximately $2.4 billion; of that $1.1 billion is from online dating. About 10% of the U.S. population visits dating sites every month which equates to approximately 30 million unique users (with either profiles/subscriptions). We are trying to tap into the online dating segment by introducing speed dating virtually to a customer.
BUSINESS CASE

4
BUSINESS CASE
DATA EXPLANATION
MODELING APPROACHES
DATA INSIGHTS
FUTURE ACTIONS
5
BUSINESS CASE
FINANCIAL IMPLICATIONSSOCIAL IMPLICATIONS
DATA EXPLANATION
MODELING APPROACHES
DATA INSIGHTS
FUTURE ACTIONS
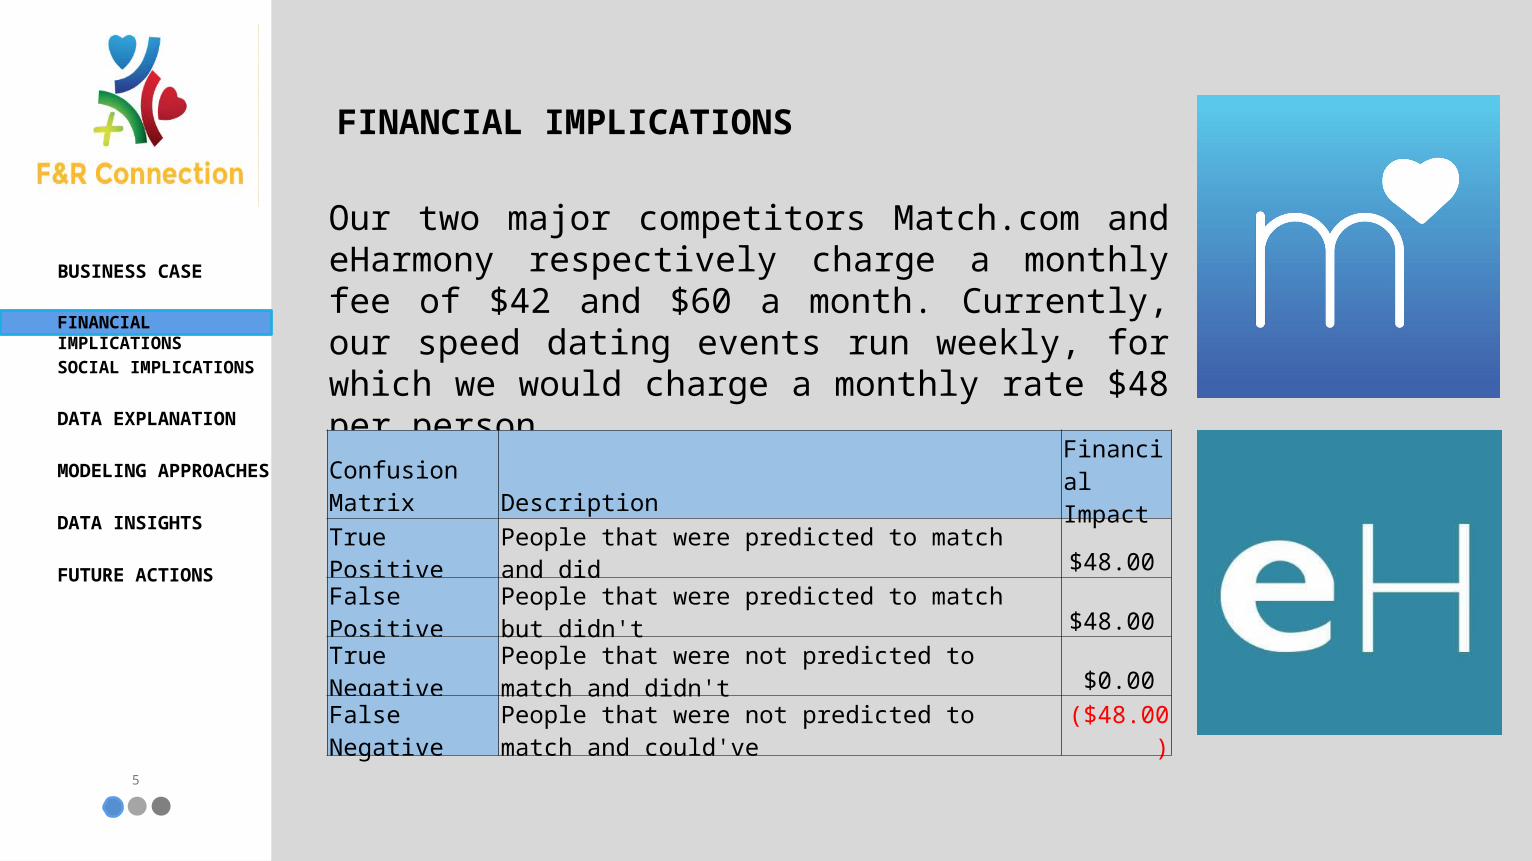
Our two major competitors Match.com and eHarmony respectively charge a monthly fee of $42 and $60 a month. Currently, our speed dating events run weekly, for which we would charge a monthly rate $48 per person.
FINANCIAL IMPLICATIONS
Confusion Matrix Description Financial Impact
True Positive People that were predicted to match and did $48.00
False Positive People that were predicted to match but didn't $48.00
True Negative People that were not predicted to match and didn't $0.00
False Negative People that were not predicted to match and could've ($48.00)
6
Over the last decade, individuals prefer to find a partner through a preselection process because of certain variables such as:
• Values • Demographics• Safety
SOCIAL IMPLICATIONS BUSINESS CASE
FINANCIAL IMPLICATIONSSOCIAL IMPLICATIONS
DATA EXPLANATION
MODELING APPROACHES
DATA INSIGHTS
FUTURE ACTIONS

7
BUSINESS CASE
DATA EXPLANATION
MODELING APPROACHES
DATA INSIGHTS
FUTURE ACTIONS
8
BUSINESS CASE
DATA EXPLANATION
MODELING APPROACHES
DATA INSIGHTS
FUTURE ACTIONS
13
BUSINESS CASE
DATA EXPLANATION
MODELING APPROACHES
DATA INSIGHTS
FUTURE ACTIONS
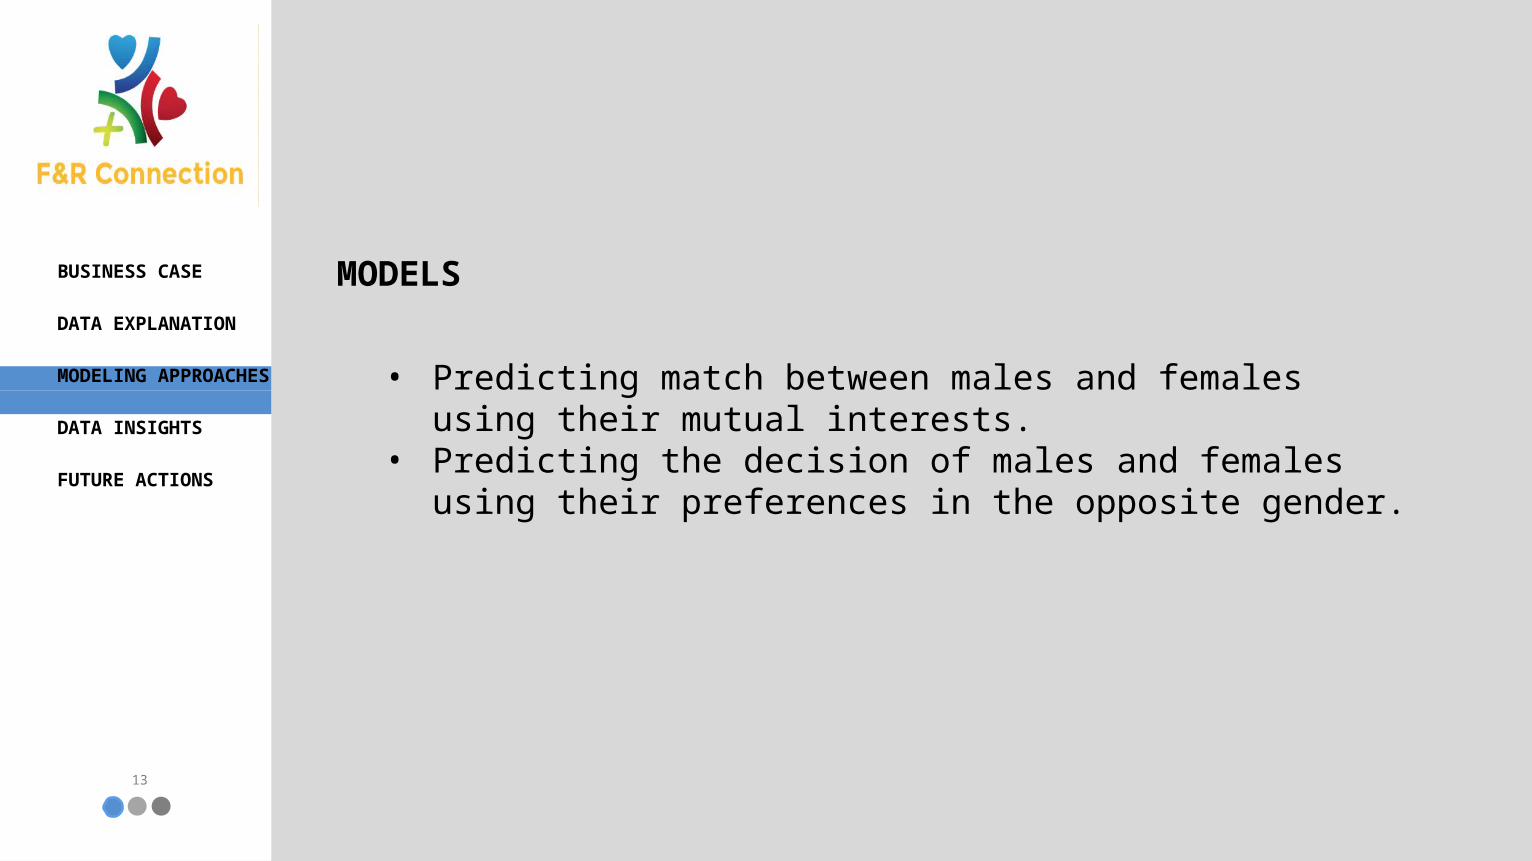
MODELS
• Predicting match between males and females using their mutual interests.
• Predicting the decision of males and females using their preferences in the opposite gender.
14
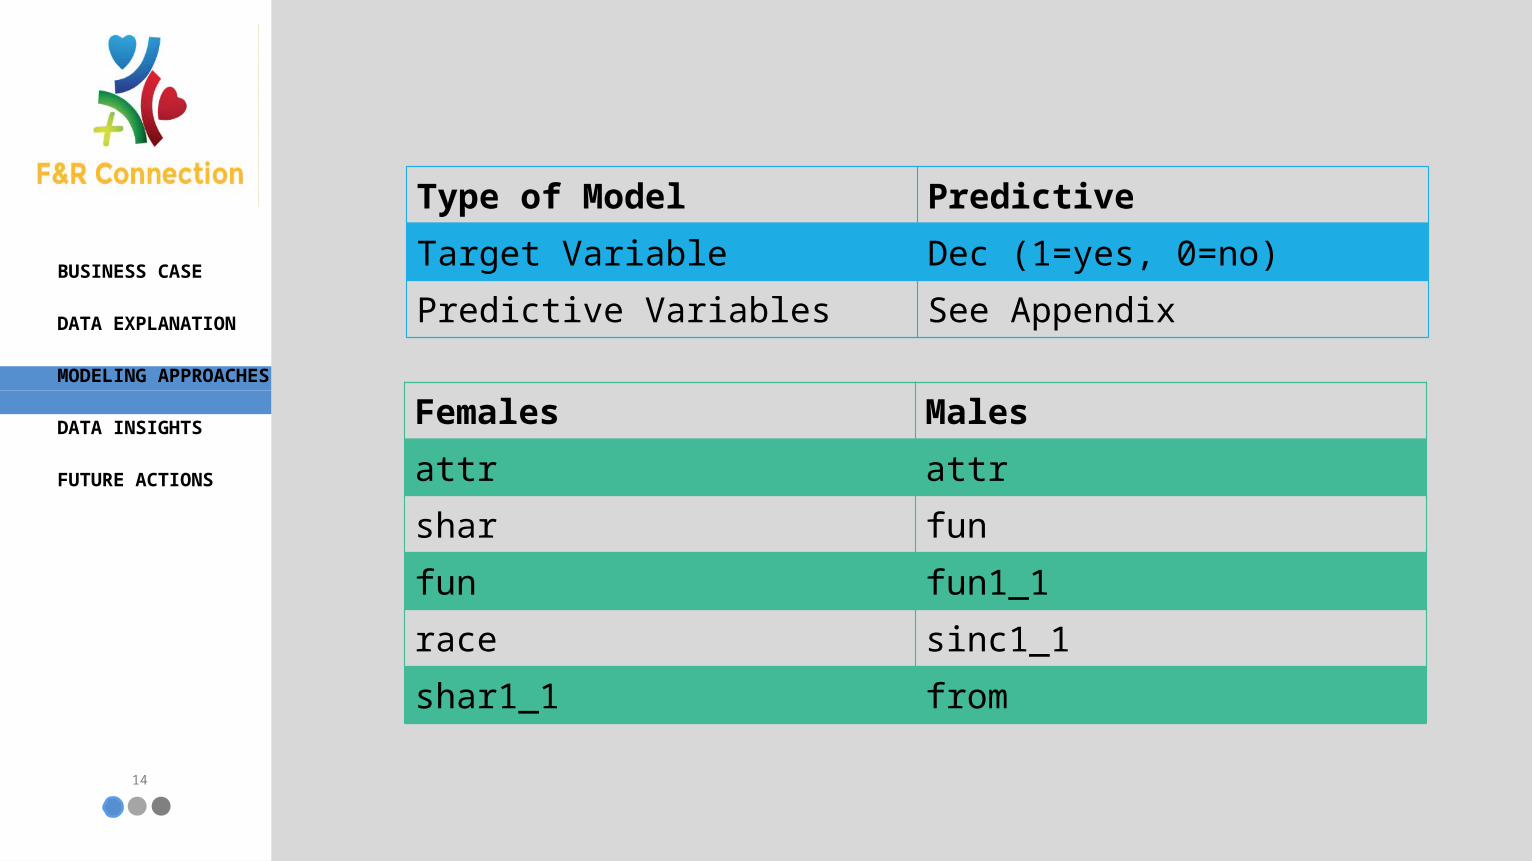
Type of Model PredictiveTarget Variable Dec (1=yes, 0=no)Predictive Variables See Appendix
Females Malesattr attrshar funfun fun1_1race sinc1_1shar1_1 from
BUSINESS CASE
DATA EXPLANATION
MODELING APPROACHES
DATA INSIGHTS
FUTURE ACTIONS
15
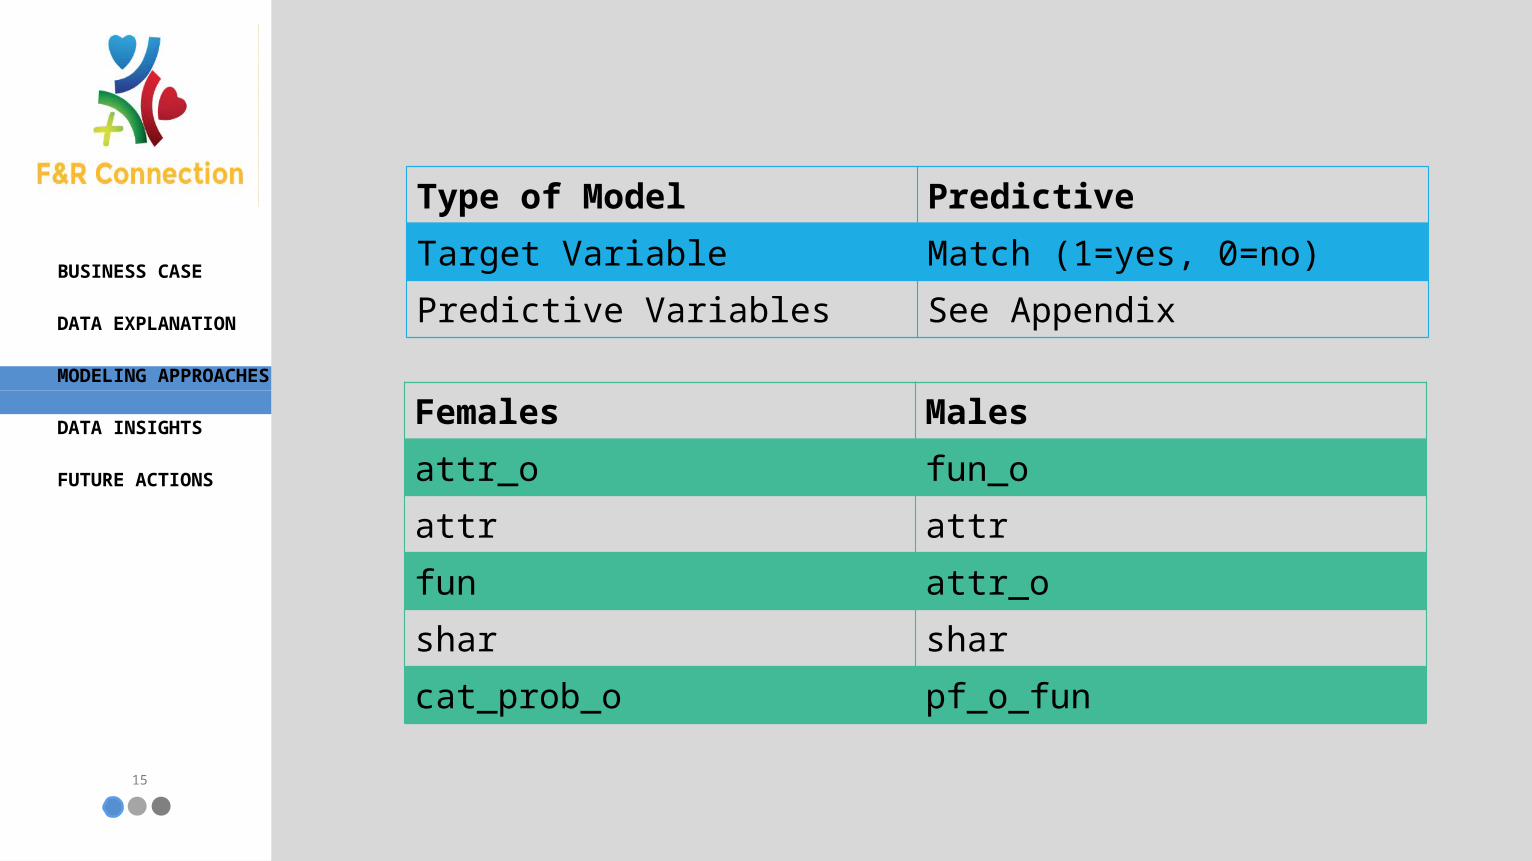
Type of Model PredictiveTarget Variable Match (1=yes, 0=no)Predictive Variables See Appendix
Females Malesattr_o fun_oattr attrfun attr_oshar sharcat_prob_o pf_o_fun
BUSINESS CASE
DATA EXPLANATION
MODELING APPROACHES
DATA INSIGHTS
FUTURE ACTIONS
16
BUSINESS CASE
DATA EXPLANATION
MODELING APPROACHES
DATA INSIGHTS
FUTURE ACTIONS
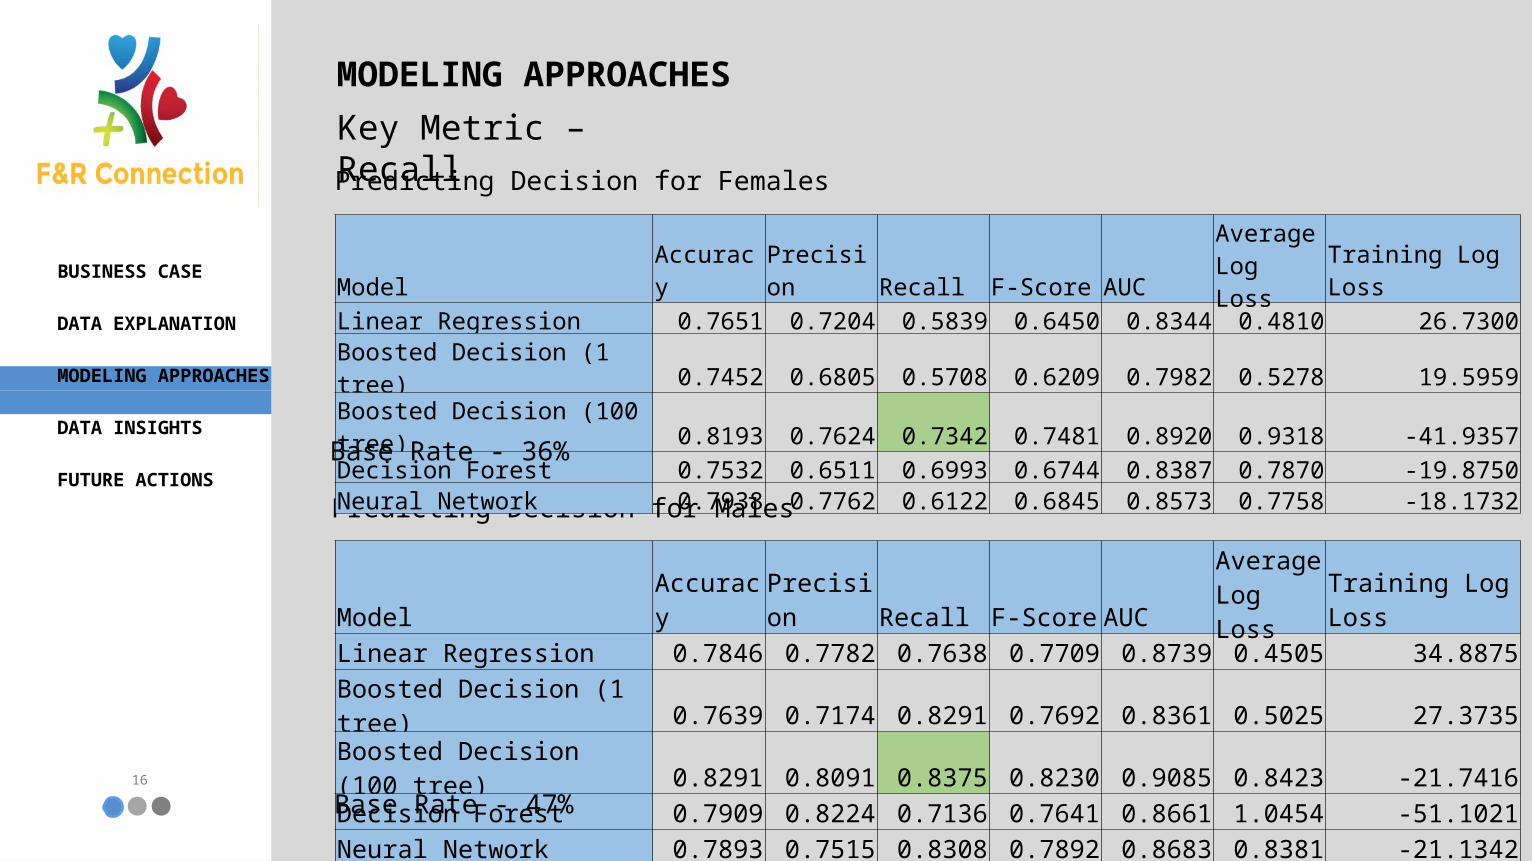
MODELING APPROACHES
Predicting Decision for Females
Predicting Decision for Males
Model Accuracy Precision Recall F-Score AUCAverage Log Loss Training Log Loss
Linear Regression 0.7651 0.7204 0.5839 0.6450 0.8344 0.4810 26.7300Boosted Decision (1 tree) 0.7452 0.6805 0.5708 0.6209 0.7982 0.5278 19.5959Boosted Decision (100 tree) 0.8193 0.7624 0.7342 0.7481 0.8920 0.9318 -41.9357Decision Forest 0.7532 0.6511 0.6993 0.6744 0.8387 0.7870 -19.8750Neural Network 0.7938 0.7762 0.6122 0.6845 0.8573 0.7758 -18.1732
Model Accuracy Precision Recall F-Score AUCAverage Log Loss Training Log Loss
Linear Regression 0.7846 0.7782 0.7638 0.7709 0.8739 0.4505 34.8875Boosted Decision (1 tree) 0.7639 0.7174 0.8291 0.7692 0.8361 0.5025 27.3735Boosted Decision (100 tree) 0.8291 0.8091 0.8375 0.8230 0.9085 0.8423 -21.7416Decision Forest 0.7909 0.8224 0.7136 0.7641 0.8661 1.0454 -51.1021Neural Network 0.7893 0.7515 0.8308 0.7892 0.8683 0.8381 -21.1342
Key Metric – Recall
Base Rate - 47%
Base Rate - 36%
17
BUSINESS CASE
DATA EXPLANATION
MODELING APPROACHES
DATA INSIGHTS
FUTURE ACTIONS
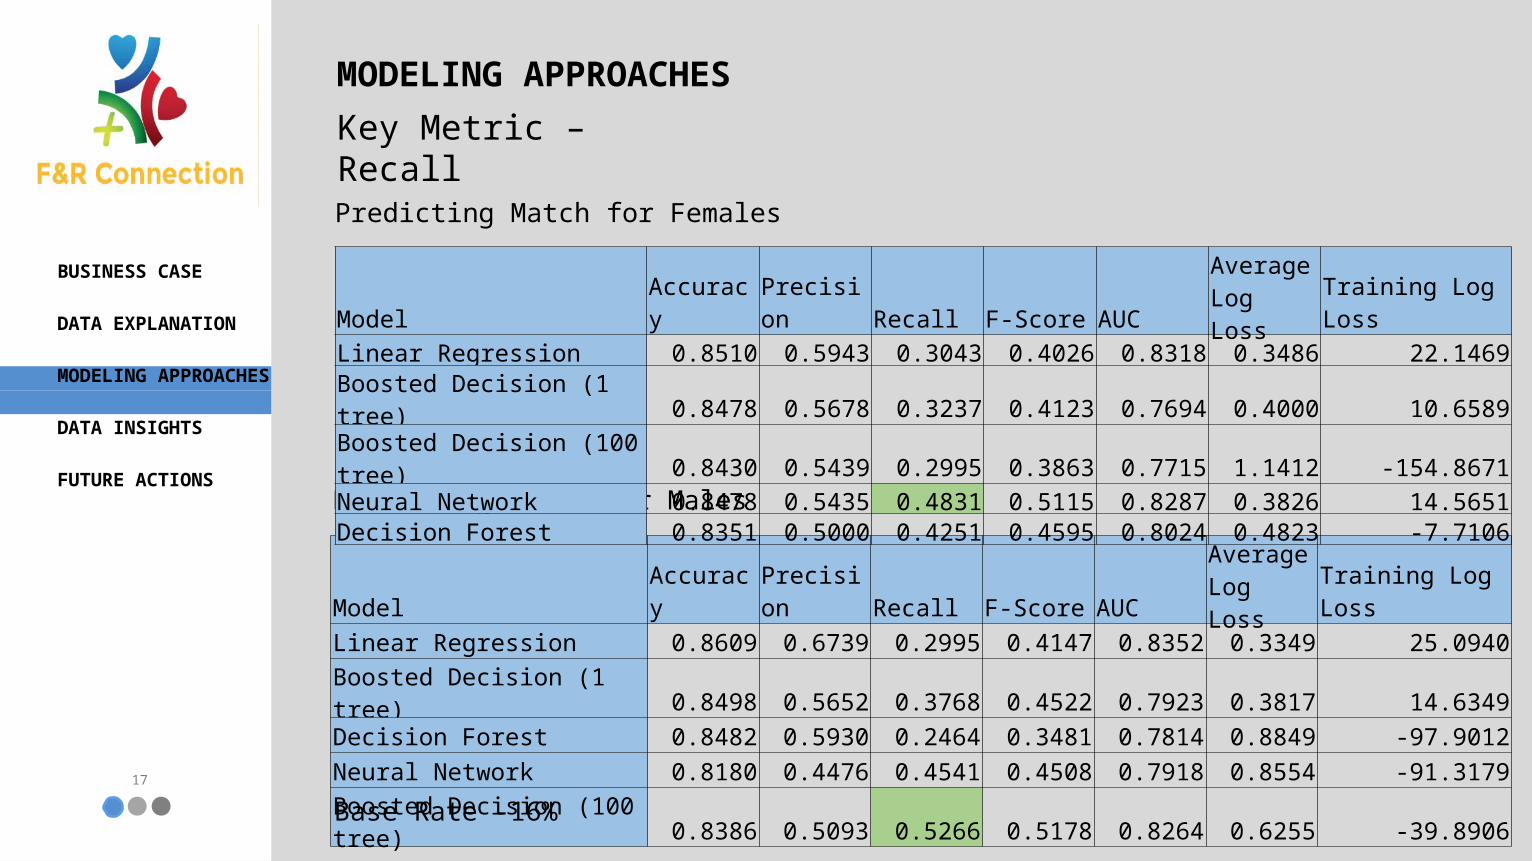
MODELING APPROACHESKey Metric – Recall Predicting Match for Females
Predicting Match for Males
Model Accuracy Precision Recall F-Score AUCAverage Log Loss Training Log Loss
Linear Regression 0.8609 0.6739 0.2995 0.4147 0.8352 0.3349 25.0940Boosted Decision (1 tree) 0.8498 0.5652 0.3768 0.4522 0.7923 0.3817 14.6349Decision Forest 0.8482 0.5930 0.2464 0.3481 0.7814 0.8849 -97.9012Neural Network 0.8180 0.4476 0.4541 0.4508 0.7918 0.8554 -91.3179Boosted Decision (100 tree) 0.8386 0.5093 0.5266 0.5178 0.8264 0.6255 -39.8906
Model Accuracy Precision Recall F-Score AUCAverage Log Loss Training Log Loss
Linear Regression 0.8510 0.5943 0.3043 0.4026 0.8318 0.3486 22.1469Boosted Decision (1 tree) 0.8478 0.5678 0.3237 0.4123 0.7694 0.4000 10.6589Boosted Decision (100 tree) 0.8430 0.5439 0.2995 0.3863 0.7715 1.1412 -154.8671Neural Network 0.8478 0.5435 0.4831 0.5115 0.8287 0.3826 14.5651Decision Forest 0.8351 0.5000 0.4251 0.4595 0.8024 0.4823 -7.7106
Base Rate -16%
18
BUSINESS CASE
DATA EXPLANATION
MODELING APPROACHES
DATA INSIGHTS
FUTURE ACTIONS
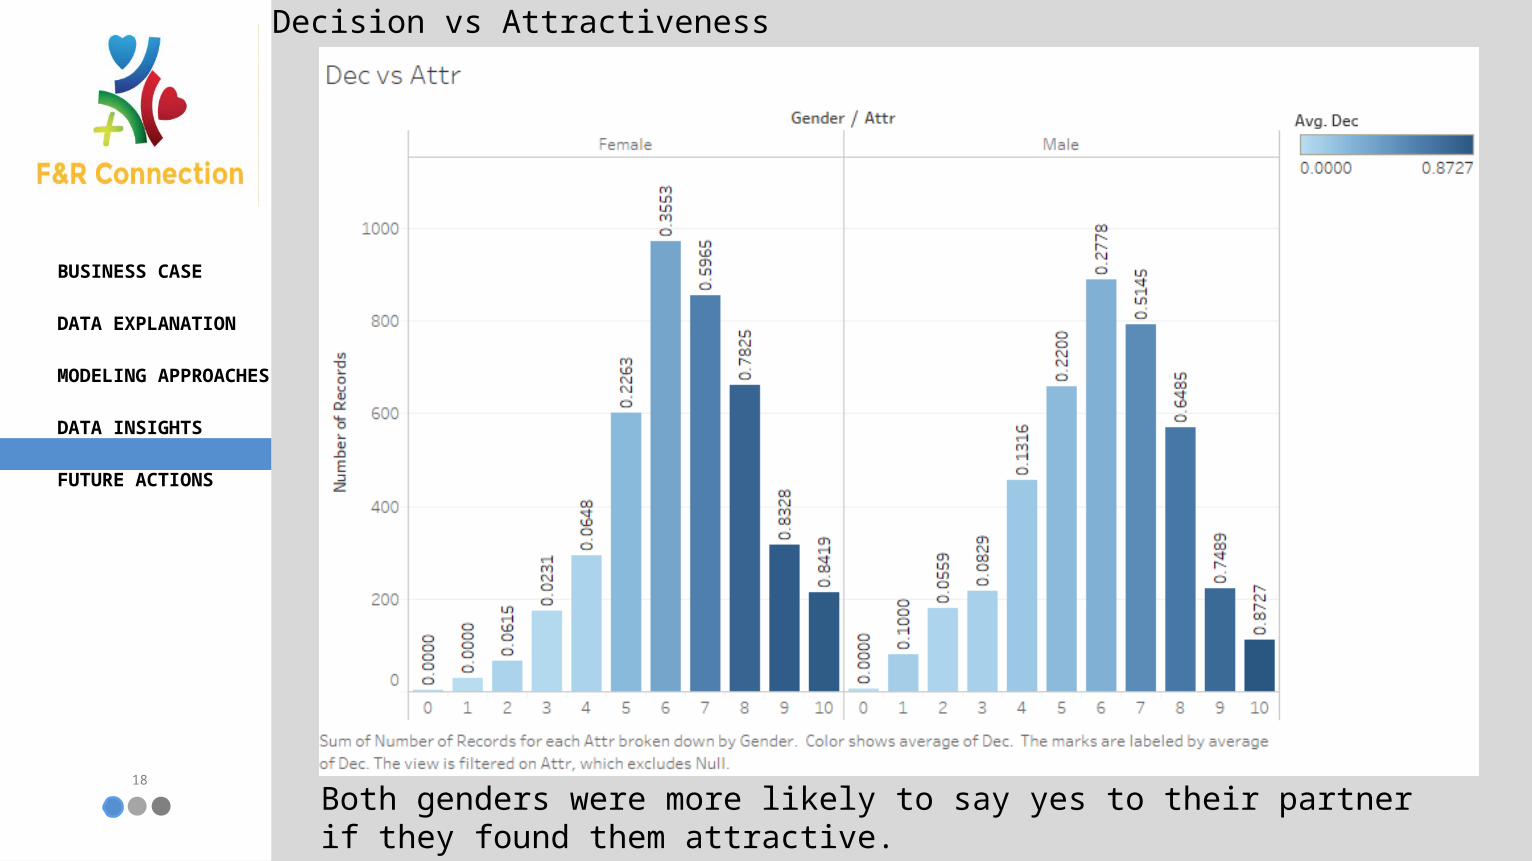
Both genders were more likely to say yes to their partner if they found them attractive.
Decision vs Attractiveness
19
BUSINESS CASE
DATA EXPLANATION
MODELING APPROACHES
DATA INSIGHTS
FUTURE ACTIONS
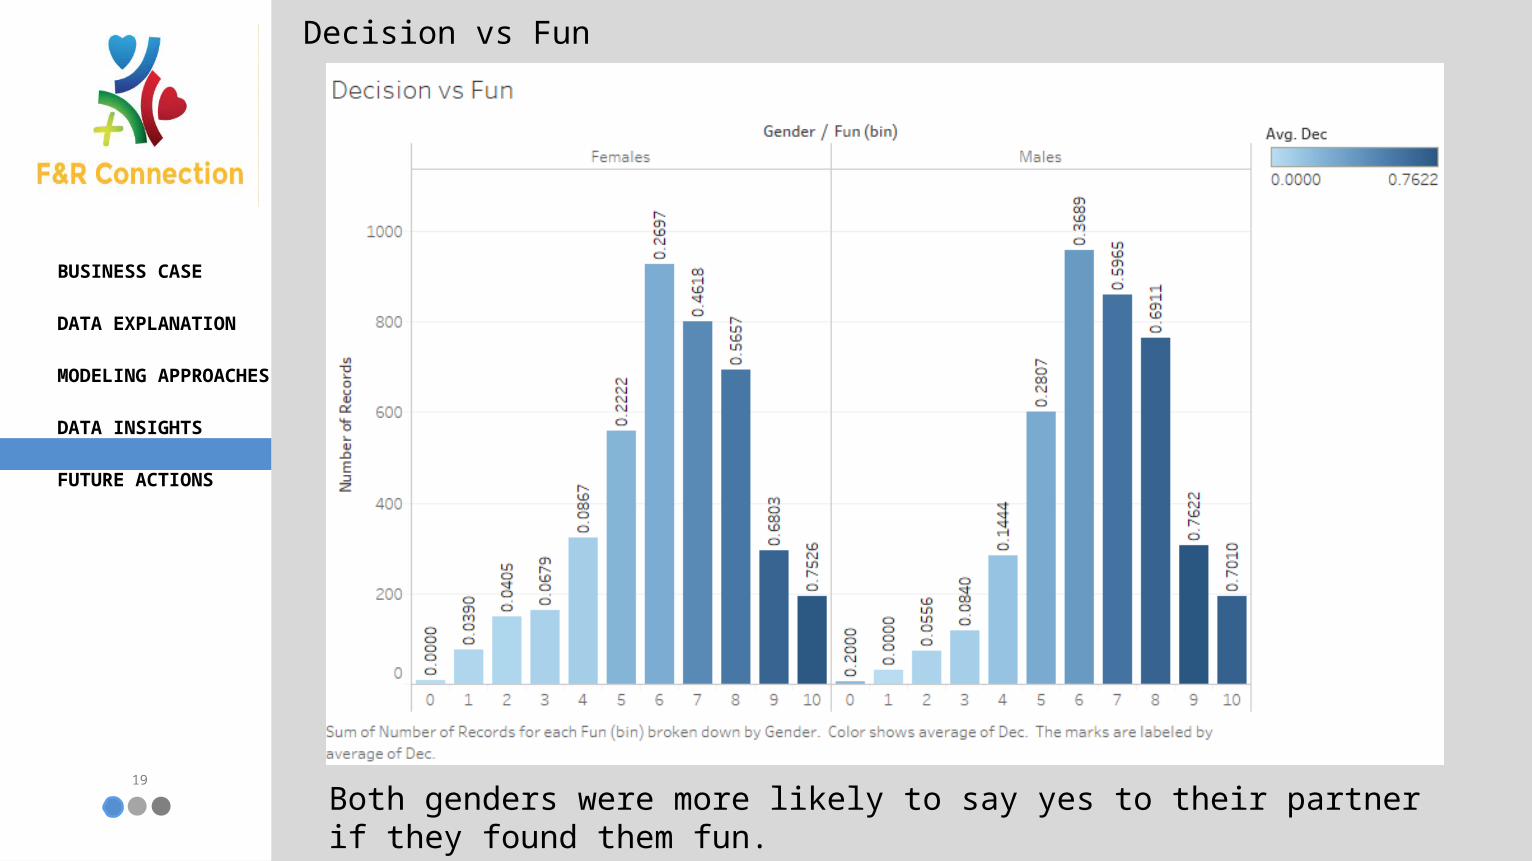
Both genders were more likely to say yes to their partner if they found them fun.
Decision vs Fun
20
BUSINESS CASE
DATA EXPLANATION
MODELING APPROACHES
DATA INSIGHTS
FUTURE ACTIONS
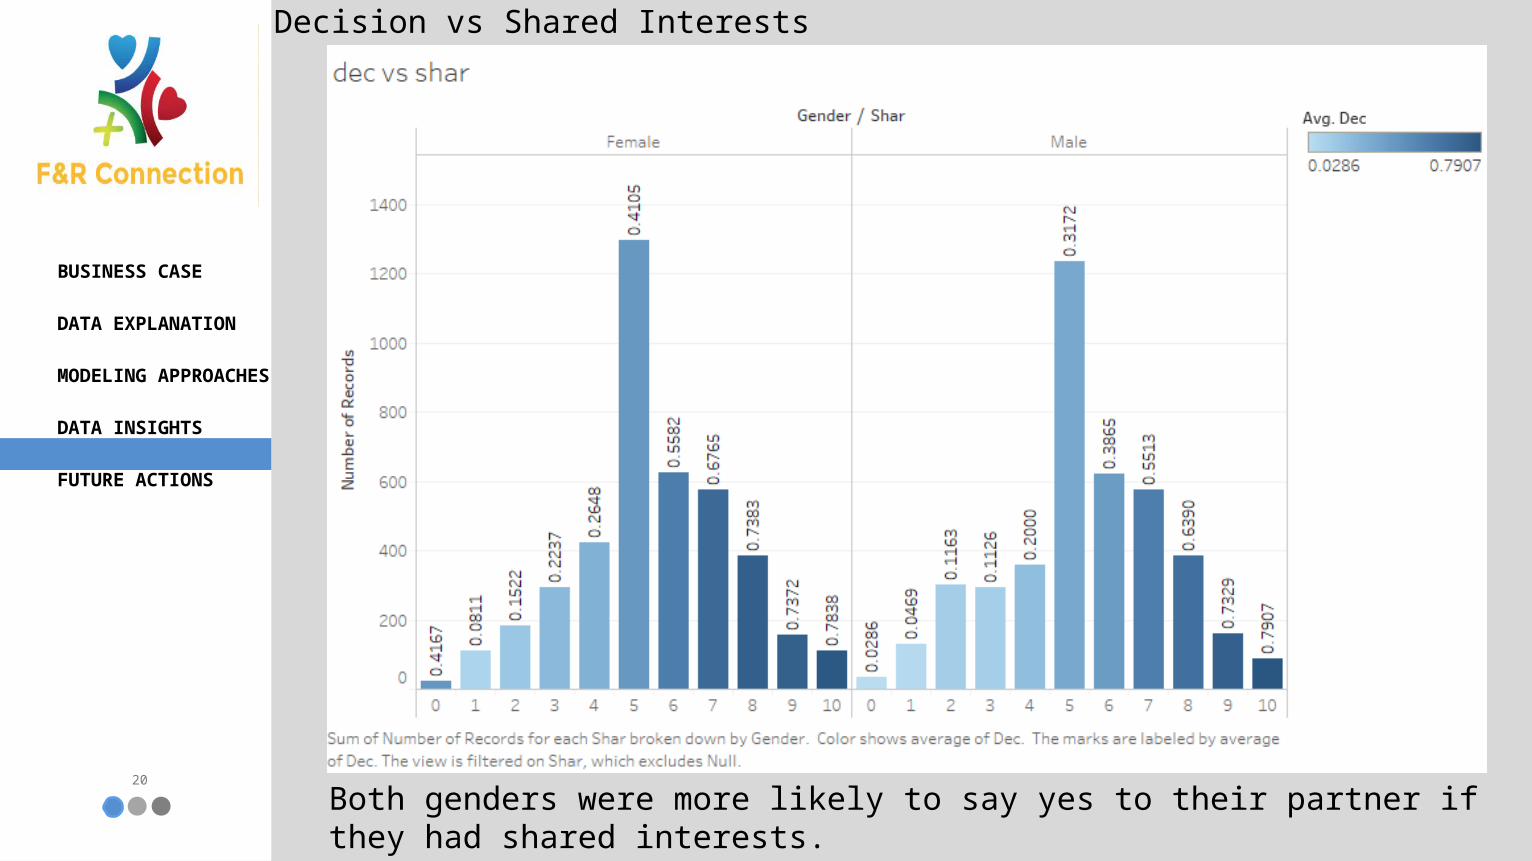
Both genders were more likely to say yes to their partner if they had shared interests.
Decision vs Shared Interests
21
BUSINESS CASE
DATA EXPLANATION
MODELING APPROACHES
DATA INSIGHTS
FUTURE ACTIONS
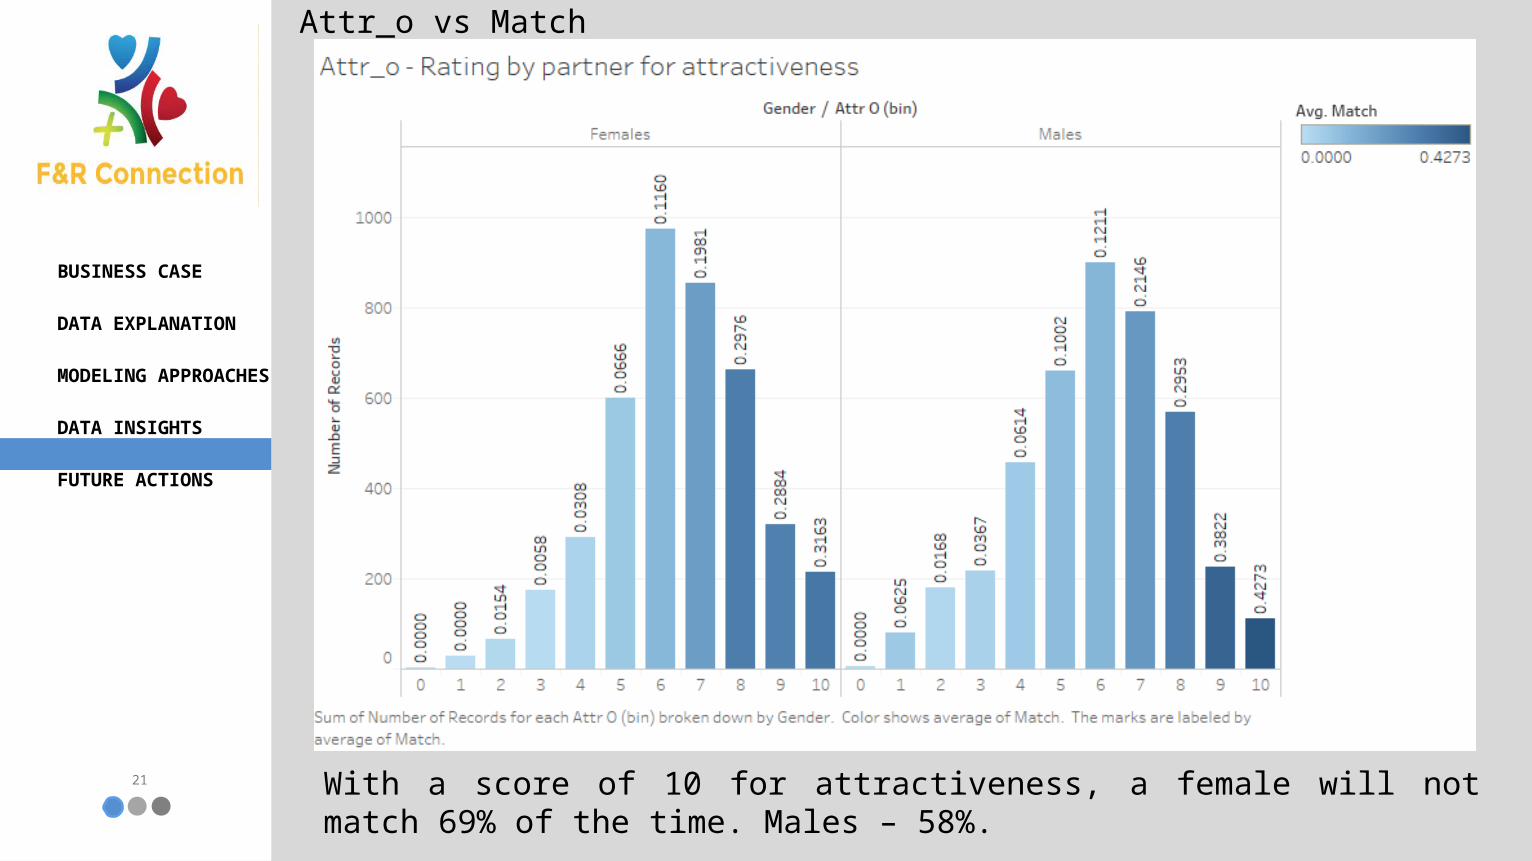
With a score of 10 for attractiveness, a female will not match 69% of the time. Males – 58%.
Attr_o vs Match
22
BUSINESS CASE
DATA EXPLANATION
MODELING APPROACHES
DATA INSIGHTS
FUTURE ACTIONS
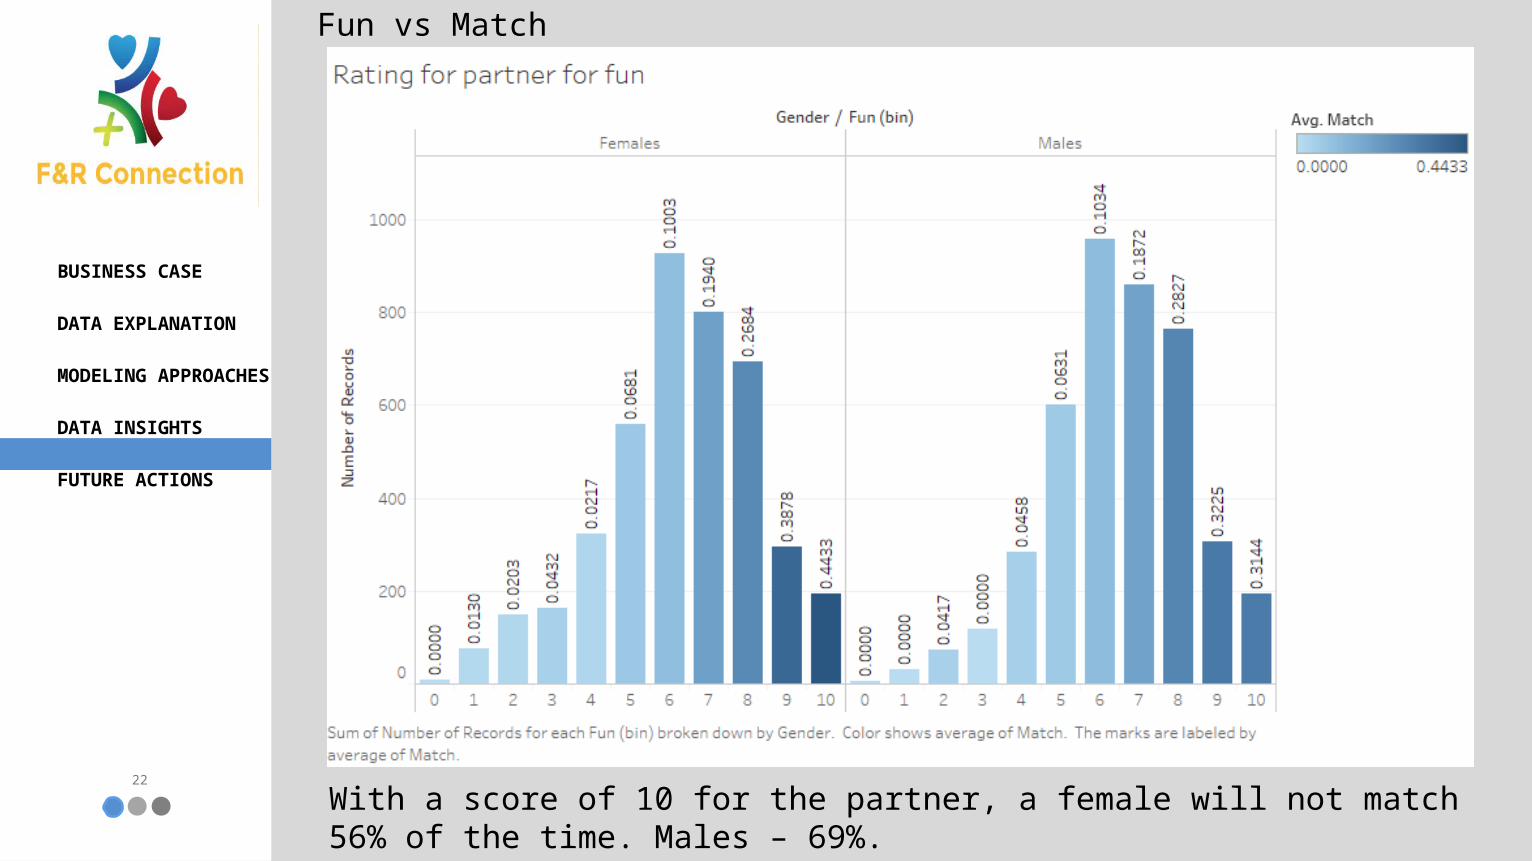
With a score of 10 for the partner, a female will not match 56% of the time. Males – 69%.
Fun vs Match
23
BUSINESS CASE
DATA EXPLANATION
MODELING APPROACHES
DATA INSIGHTS
FUTURE ACTIONS
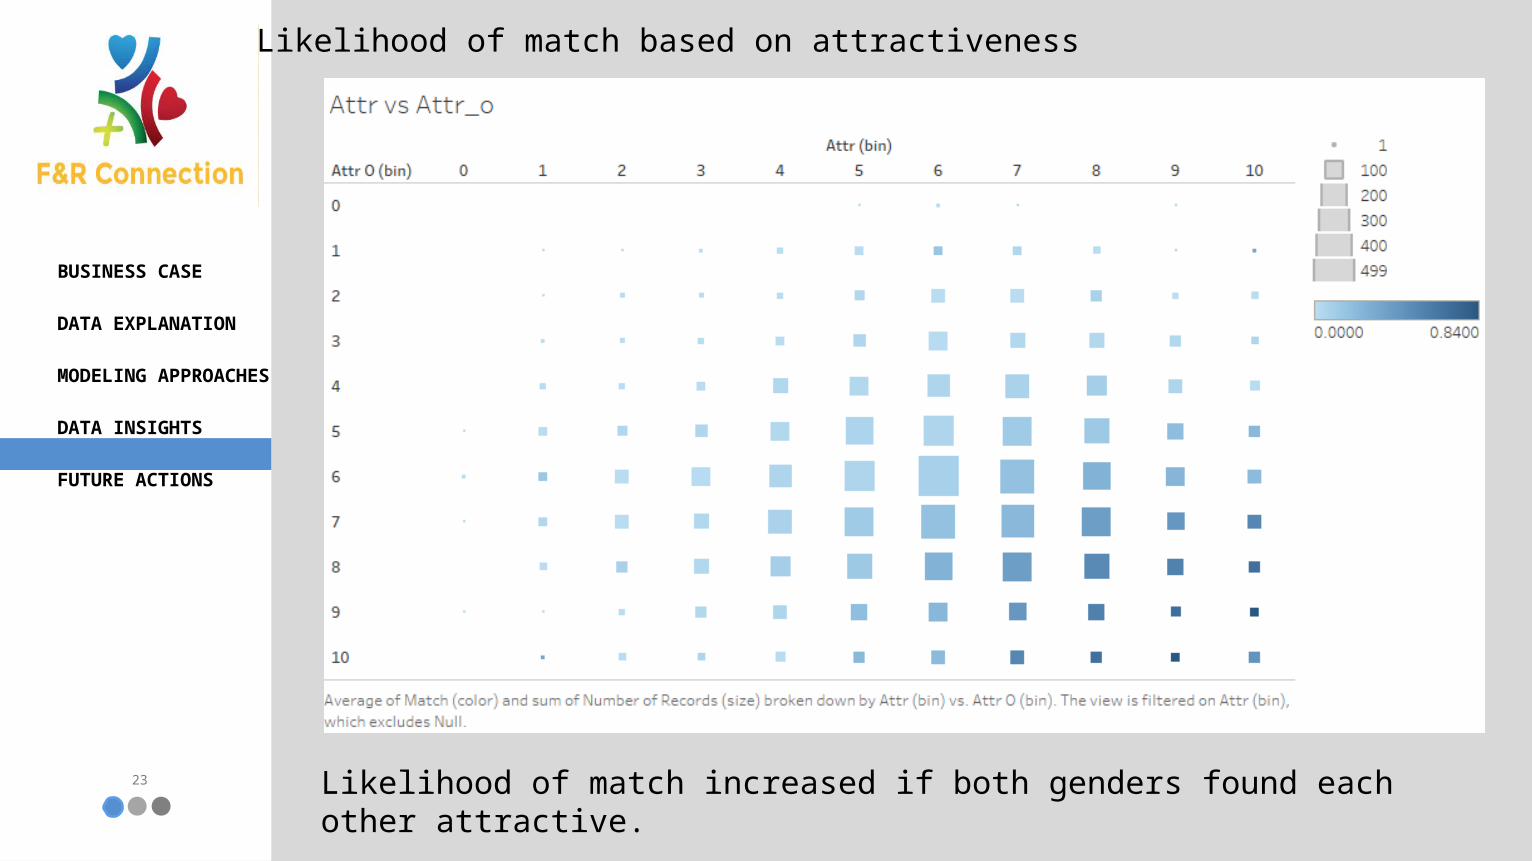
Likelihood of match based on attractiveness
Likelihood of match increased if both genders found each other attractive.
24
BUSINESS CASE
DATA EXPLANATION
MODELING APPROACHES
DATA INSIGHTS
FUTURE ACTIONS
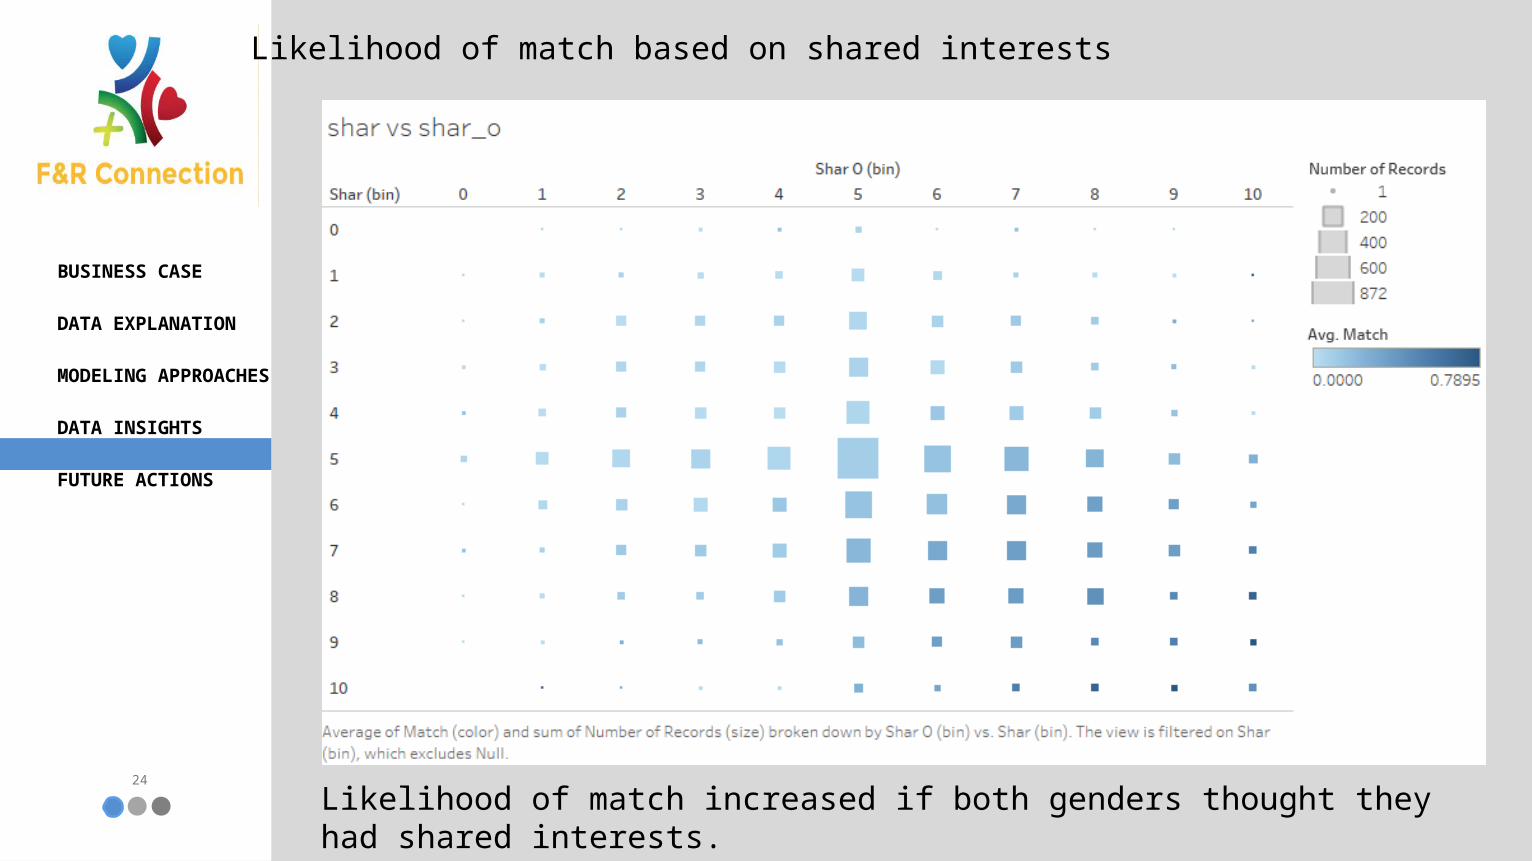
Likelihood of match increased if both genders thought they had shared interests.
Likelihood of match based on shared interests
25
BUSINESS CASE
DATA EXPLANATION
MODELING APPROACHES
DATA INSIGHTS
FUTURE ACTIONS
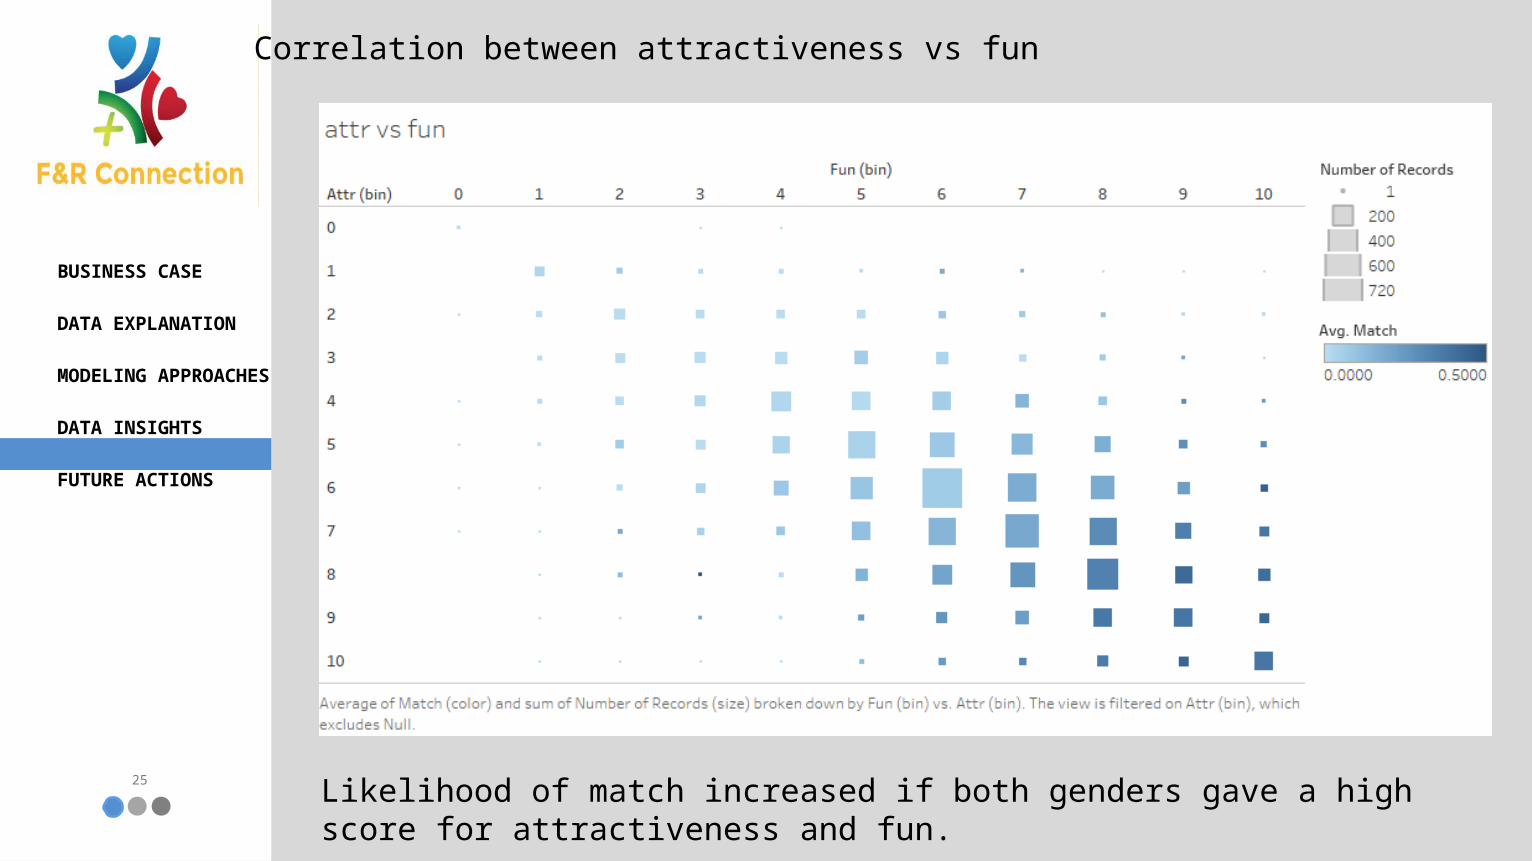
Likelihood of match increased if both genders gave a high score for attractiveness and fun.
Correlation between attractiveness vs fun
26
BUSINESS CASE
DATA EXPLANATION
MODELING APPROACHES
DATA INSIGHTS
FUTURE ACTIONS
Body Language Monitor
Time Extension Option
+2

THANK YOU