predicting stock market movements of india using … · models, inspired by the ... could forecast...
TRANSCRIPT
Academy of Strategic Management Journal Volume 17, Issue 2, 2018
1 1939-6104-17-2-189
PREDICTING STOCK MARKET MOVEMENTS OF
INDIA USING DATA DETERMINISTIC APPROACH
Marxia Oli Sigo, Bharathidasan University
Murugesan Selvam, Bharathidasan University
Sankaran Venkateswar, Trinity University
Kasilingam Lingaraja, Bharathiar University
Sankarkumar Amirdhavasani, Bharathidasan University
Chinnadurai Kathiravan, Bharathidasan University
ABSTRACT
In the aftermath of Globalization, several trade barriers, which hindered the organic
growth of business enterprises, were removed. The world tends to become borderless, in terms of
trade transactions and market operations, facilitates the maximization of wealth. The stock
market movements are influenced by micro as well as macro-economic variables, corporate
environment, the legal framework and taxation policies pertinent to each economy. The real
issue lies in accurately predicting the future stock price/index movements, due to persistence of
stochastic behavior in the stock markets. This paper discusses non-linear movement pattern of
two vibrant stock indices of India, BSE-Sensex and NSE-Nifty, using the data deterministic
method. Ten technical indicators were used to validate the stock market data. The findings would
help the investors, to make informed investment decisions to optimize the stock returns.
Keywords: Behavioral Finance, Capital Market, Predictive Analytics, Stochastic, Stock Index.
JEL Codes: C45, C53, E27, E44, G1
INTRODUCTION
Forecasting the stock price movement of a company and stock index is a classic problem.
Efficient Market Hypothesis clearly asserts that it is not possible to exactly predict the stock
prices of corporate entities, due to the existence of random walk behavior in stock markets
(Fama, 1970). The movements of stock prices and stock indices are influenced by many macro-
economic variables such as political events, policies of the corporate enterprises, general
economic conditions, commodity price index, bank rate, loan rates, foreign exchange rates,
investors’ expectations, investors’ choices and the human psychology of stock market investors
(Miao et al., 2007). Neural networks are a class of generalized, non-linear and non-parametric
models, inspired by the studies of human brain. The feed-forward networks are the most widely
used (Ou & Wang, 2009). Prediction of stock market movements has become increasingly
difficult due to uncertainties, involved with the probable future outcomes. At a particular point of
time, there could be trends, cycles and random walk or a combination of three cases/events
(Robert & David, 2011). Closing price of a stock/index has been used, as one of the important
statistical data, to derive useful information about the current and probable future movement
pattern of stock market (Defu et al., 2005). In data deterministic approach, a layer is employed to
convert each of the technical indicator’s continuous value, from +1 to -1, indicating the probable
Academy of Strategic Management Journal Volume 17, Issue 2, 2018
2 1939-6104-17-2-189
future growth/decline movements. This layer explains the manner of stock market movements,
on both upwards and downwards direction, across the time periods (Shuai & Wei, 2014). The
data deterministic approach could forecast the future trend of stock market and to provide stock
information signs, for taking better investment decision of buying and selling of stocks by the
investors (Jigar et al., 2015a).
REVIEW OF LITERATURE
An extensive review of literature, in the area of prediction of stock indices, has been done
by the researchers. Prediction of stock price movements of individual stocks and stock market
indices is explained by Amitai (1976), who also explained the difficulties involved in making
specific and accurate forecasting of financial markets. Wang & Leu (1996) forecasted six week
stock price trend, based on past four years stock price movements of Taiwan stock market, by
using recurrent neural network. Hansen & Nelson (2003) applied a time-delay neural network to
predict the stock price movements and the results of future trend prediction, using the hybrid
system, proved to be promising. Kim (2003) used twelve technical indicators, to make prediction
of daily stock price changes and stock index movements of Korea Composite Stock Price Index
(KOSPI). Simulation results of Shanghai Composite Index show that neural networks could be
applied to maximize the returns of stock market investment (Defu et al., 2005). Franklin Kuo
classified the networks into linear, passive, reciprocal, causal and time invariant and each
network approaches has unique and different inherent characteristic properties accordingly. Teo
& Douglas (2006) calculated the profitability of stock indices, based on daily trades of S&P 500
(India), DAX (Germany), Topix (Japan) and FTSE (UK). Andre & Beatriz (2008) adopted neural
network, to forecast the stock market returns of emerging economies. Ou & Wang (2009) tried
out ten different data mining techniques, in order to predict the stock price movements of Hang
Seng index of Hong Kong stock market. According to Robin & Ryan (2009), novelty,
complexity and anonymity of forecasting the stock markets, influenced the observers to have
reservations about the prediction outcome of stock price movements. Nair et al. (2011) predicted
the closing value of next day, for five international stock indices, using an adaptive artificial
neural network system. Garg et al. (2013) analyzed the model selection criteria, for two data
transmission models of the stocks, indexed in New York Stock Exchange. Jigar et al. (2015a)
used regression method to predict the trends. Prediction performance of BSE-Sensex, NSE-Nifty,
Reliance Industries and Infosys Limited were measured and compared in a group of stock indices
and individual stocks respectively. Shin & Shie (2015) used the Box-Jenkins model, spectral
analysis and Markov process, to forecast the stock prices. Based on the above reviews, the
researchers applied one of the neural network methods i.e., data deterministic approach is used in
this study, to predict the robust growing Indian stock market.
STATEMENT OF THE PROBLEM
Prediction of the movements of financial markets is one of the classic issues. Profit
making in stock market investments is, linked to the level of financial literacy, financial
intelligence and financial investment practice. Less exposure to these aspects, among the
financial investors and absence of proven forecasting techniques, to exactly predict the probable
futuristic movement pattern of stock price/index values, cause the magnitude and severity of this
issue which also vindicates this kind of study (Melek & Derya, 2010).
Academy of Strategic Management Journal Volume 17, Issue 2, 2018
3 1939-6104-17-2-189
NEED OF THE STUDY
This study would help the investors, ranging from domestic retail investors, financial
institutions, mutual funds, investment banks, to foreign institutional investors, to take timely and
well-informed investment decisions, based on scientific thinking and rational approach (Amitai,
1976). Availability of alternate investment options, absence of prudent prediction methods and
incidence of lower level of financial literacy reiterate this kind of study.
OBJECTIVE
The primary objective is to find out the existing stock index movement pattern and to
predict the probable future movements of BSE-Sensex and NSE-Nifty.
HYPOTHESES
NH1: There is no corresponding relationship between the upward/downward movements of BSE-Sensex
and NSE-Nifty, during the pre-global financial crisis period.
NH2: There is no corresponding relationship between the upward/downward movements of BSE-Sensex
and NSE-Nifty, during the post-global financial crisis period.
RESEARCH METHODOLOGY
Sampling Design of the Study
Based on the free-float market capitalization, as on 07/02/2017, S&P BSE-Sensex (Rs.
53, 88, 277 Crores) and CNX NSE-Nifty (Rs. 49, 27, 183 Crores) were considered, since these
two stock indices signify the overall direction of the stock market movements in India.
Sources of Data
The secondary data of the daily closing stock index values of BSE-Sensex and NSE-Nifty
were collected from respective websites of Bombay Stock Exchange (www.bseindia.com) and
the National Stock Exchange of India (www.nseindia.com).
Period of the Study
The study focused on the behavior of stock price/index movements of eighteen years
from 01st January 1999 to 31
st December 2016, before and after the global financial crisis.
Statistical Tools Used in the Study
To forecast the movements of BSE-Sensex and NSE-Nifty, ten technical indicators
(Simple Moving Average, Weighted Moving Average, Momentum, Stochastic K%, Stochastic
D%, Relative Strength Index, Moving Average Convergence and Divergence, Larry Williams R,
A/D Oscillator and Commodity Channel Index) were used.
Academy of Strategic Management Journal Volume 17, Issue 2, 2018
4 1939-6104-17-2-189
Limitations of the Study
Each technical indicator has its own optimization about the stock price movements. Only
two stock indices, BSE-Sensex and NSE-Nifty, were used as sample.
DATA ANALYSIS AND INTERPRETATION
The daily closing values of stock indices of BSE-Sensex and NSE-Nifty, which were
collected and analyzed for this study, were as follows:
The Observations of the Total Dataset
Observation of BSE-Sensex
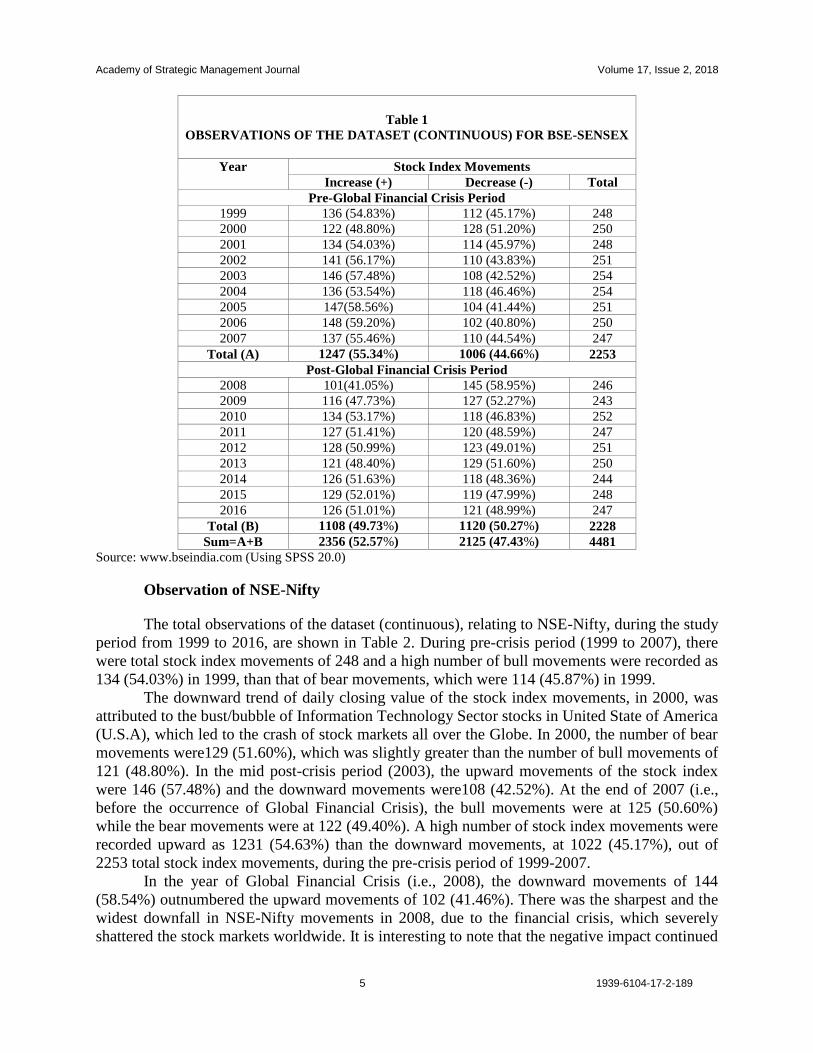
Table 1 exhibits the observations of the total dataset (continuous), relating to BSE-
Sensex, during the study period from 1999 to 2016. The analysis of pre-crisis period (i.e., 1999
to 2007) shows that in 1999, the number of bull movements was recorded as 136, which
represented 54.83% while there were 112 bear movements, which accounted for 45.17%, out of
total stock index movements of 248. In the next year (i.e., 2000), the bear movements of 128
(51.20%) outnumbered the occurrence of bull movements of 122 (48.80%) and this symbolized
downward trend of the stock index (BSE-Sensex) movements, due to the dotcom bust/bubble in
the stock markets of United States of America (U.S.A), caused by the Information Technology
Sector, which led to the crash of stock markets all over the Globe.
In the mid pre-crisis period (during 2003), of the stock index upward movements were
recorded as 146 (57.48%) whereas the index downward movements of BSE-Sensex were
recorded as 108 (42.52%). Out of 2253 (total stock index movements), during the pre-crisis
period of nine years (1999-2007), a high number of upward stock index movements were
registered as 1247 (55.34%), than that of downward stock index movements of 1006 (44.66%).
In the year of Global Financial Crisis (i.e., 2008), the downward movements of 145, at
58.95%, outnumbered the upward movements of 101, at 41.05%. This clearly indicated, due to
the global financial crisis, which highly shattered the stock markets worldwide. Similar trend
was registered in 2009, that the bear movements of 127 (52.27%) were more than the bull
movements of 116 (47.73%). In the mid post-crisis period (2012), the upward movements of
stock index were recorded as 128 (50.99%), while the downward movements were recorded as
123 (49.01%). In 2016, the upward movements of 126 (51.01%) were marginally greater than
downward movements of 121 (48.99%).
The analysis of post-crisis period of nine years (2008-2016) brought out the fact that the
downward stock index movements of 1120 (50.27%) were more than the upward stock index
movements of 1108 (49.73%) and this clearly indicated the negative impact of the crisis.
According to Table 1, the total observations, for the entire study period of 18 years
(1999-2016), were registered as 4481, out of which, 2356 incidents (52.57%) were recorded as
upward movements while 2125 incidents (47.43%) were registered as downward movements. It
is suggested that investors could observe and study these movements of stock markets so as to
devise their investment strategies in such a way to earn higher returns in the stock market.
Academy of Strategic Management Journal Volume 17, Issue 2, 2018
5 1939-6104-17-2-189
Table 1
OBSERVATIONS OF THE DATASET (CONTINUOUS) FOR BSE-SENSEX
Year Stock Index Movements
Increase (+) Decrease (-) Total
Pre-Global Financial Crisis Period
1999 136 (54.83%) 112 (45.17%) 248
2000 122 (48.80%) 128 (51.20%) 250
2001 134 (54.03%) 114 (45.97%) 248
2002 141 (56.17%) 110 (43.83%) 251
2003 146 (57.48%) 108 (42.52%) 254
2004 136 (53.54%) 118 (46.46%) 254
2005 147(58.56%) 104 (41.44%) 251
2006 148 (59.20%) 102 (40.80%) 250
2007 137 (55.46%) 110 (44.54%) 247
Total (A) 1247 (55.34%) 1006 (44.66%) 2253
Post-Global Financial Crisis Period
2008 101(41.05%) 145 (58.95%) 246
2009 116 (47.73%) 127 (52.27%) 243
2010 134 (53.17%) 118 (46.83%) 252
2011 127 (51.41%) 120 (48.59%) 247
2012 128 (50.99%) 123 (49.01%) 251
2013 121 (48.40%) 129 (51.60%) 250
2014 126 (51.63%) 118 (48.36%) 244
2015 129 (52.01%) 119 (47.99%) 248
2016 126 (51.01%) 121 (48.99%) 247
Total (B) 1108 (49.73%) 1120 (50.27%) 2228
Sum=A+B 2356 (52.57%) 2125 (47.43%) 4481
Source: www.bseindia.com (Using SPSS 20.0)
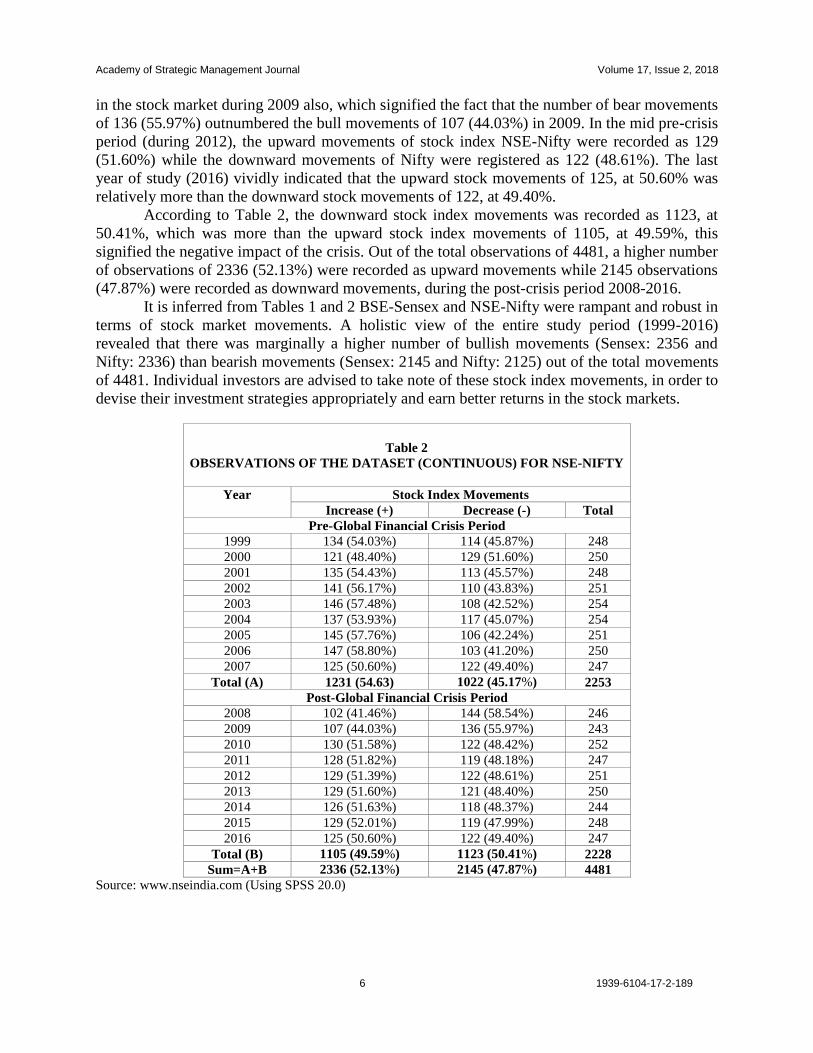
Observation of NSE-Nifty
The total observations of the dataset (continuous), relating to NSE-Nifty, during the study
period from 1999 to 2016, are shown in Table 2. During pre-crisis period (1999 to 2007), there
were total stock index movements of 248 and a high number of bull movements were recorded as
134 (54.03%) in 1999, than that of bear movements, which were 114 (45.87%) in 1999.
The downward trend of daily closing value of the stock index movements, in 2000, was
attributed to the bust/bubble of Information Technology Sector stocks in United State of America
(U.S.A), which led to the crash of stock markets all over the Globe. In 2000, the number of bear
movements were129 (51.60%), which was slightly greater than the number of bull movements of
121 (48.80%). In the mid post-crisis period (2003), the upward movements of the stock index
were 146 (57.48%) and the downward movements were108 (42.52%). At the end of 2007 (i.e.,
before the occurrence of Global Financial Crisis), the bull movements were at 125 (50.60%)
while the bear movements were at 122 (49.40%). A high number of stock index movements were
recorded upward as 1231 (54.63%) than the downward movements, at 1022 (45.17%), out of
2253 total stock index movements, during the pre-crisis period of 1999-2007.
In the year of Global Financial Crisis (i.e., 2008), the downward movements of 144
(58.54%) outnumbered the upward movements of 102 (41.46%). There was the sharpest and the
widest downfall in NSE-Nifty movements in 2008, due to the financial crisis, which severely
shattered the stock markets worldwide. It is interesting to note that the negative impact continued
Academy of Strategic Management Journal Volume 17, Issue 2, 2018
6 1939-6104-17-2-189
in the stock market during 2009 also, which signified the fact that the number of bear movements
of 136 (55.97%) outnumbered the bull movements of 107 (44.03%) in 2009. In the mid pre-crisis
period (during 2012), the upward movements of stock index NSE-Nifty were recorded as 129
(51.60%) while the downward movements of Nifty were registered as 122 (48.61%). The last
year of study (2016) vividly indicated that the upward stock movements of 125, at 50.60% was
relatively more than the downward stock movements of 122, at 49.40%.
According to Table 2, the downward stock index movements was recorded as 1123, at
50.41%, which was more than the upward stock index movements of 1105, at 49.59%, this
signified the negative impact of the crisis. Out of the total observations of 4481, a higher number
of observations of 2336 (52.13%) were recorded as upward movements while 2145 observations
(47.87%) were recorded as downward movements, during the post-crisis period 2008-2016.
It is inferred from Tables 1 and 2 BSE-Sensex and NSE-Nifty were rampant and robust in
terms of stock market movements. A holistic view of the entire study period (1999-2016)
revealed that there was marginally a higher number of bullish movements (Sensex: 2356 and
Nifty: 2336) than bearish movements (Sensex: 2145 and Nifty: 2125) out of the total movements
of 4481. Individual investors are advised to take note of these stock index movements, in order to
devise their investment strategies appropriately and earn better returns in the stock markets.
Table 2
OBSERVATIONS OF THE DATASET (CONTINUOUS) FOR NSE-NIFTY
Year Stock Index Movements
Increase (+) Decrease (-) Total
Pre-Global Financial Crisis Period
1999 134 (54.03%) 114 (45.87%) 248
2000 121 (48.40%) 129 (51.60%) 250
2001 135 (54.43%) 113 (45.57%) 248
2002 141 (56.17%) 110 (43.83%) 251
2003 146 (57.48%) 108 (42.52%) 254
2004 137 (53.93%) 117 (45.07%) 254
2005 145 (57.76%) 106 (42.24%) 251
2006 147 (58.80%) 103 (41.20%) 250
2007 125 (50.60%) 122 (49.40%) 247
Total (A) 1231 (54.63) 1022 (45.17%) 2253
Post-Global Financial Crisis Period
2008 102 (41.46%) 144 (58.54%) 246
2009 107 (44.03%) 136 (55.97%) 243
2010 130 (51.58%) 122 (48.42%) 252
2011 128 (51.82%) 119 (48.18%) 247
2012 129 (51.39%) 122 (48.61%) 251
2013 129 (51.60%) 121 (48.40%) 250
2014 126 (51.63%) 118 (48.37%) 244
2015 129 (52.01%) 119 (47.99%) 248
2016 125 (50.60%) 122 (49.40%) 247
Total (B) 1105 (49.59%) 1123 (50.41%) 2228
Sum=A+B 2336 (52.13%) 2145 (47.87%) 4481
Source: www.nseindia.com (Using SPSS 20.0)
Academy of Strategic Management Journal Volume 17, Issue 2, 2018
7 1939-6104-17-2-189
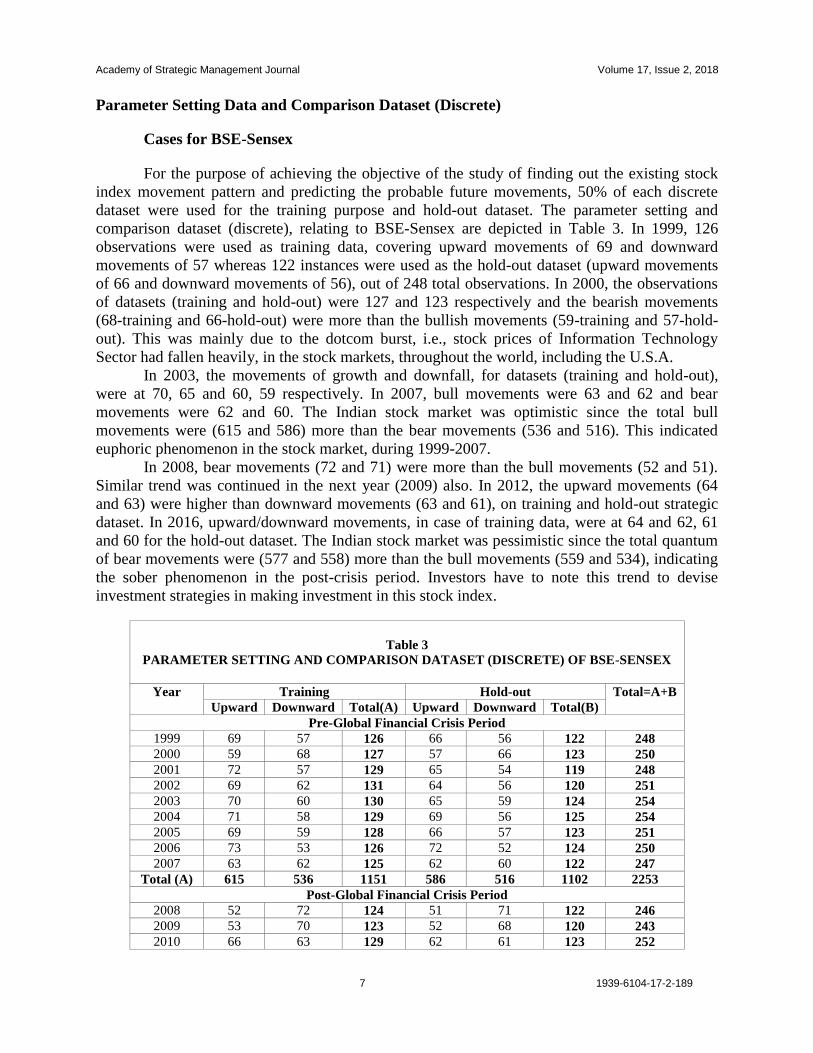
Parameter Setting Data and Comparison Dataset (Discrete)
Cases for BSE-Sensex
For the purpose of achieving the objective of the study of finding out the existing stock
index movement pattern and predicting the probable future movements, 50% of each discrete
dataset were used for the training purpose and hold-out dataset. The parameter setting and
comparison dataset (discrete), relating to BSE-Sensex are depicted in Table 3. In 1999, 126
observations were used as training data, covering upward movements of 69 and downward
movements of 57 whereas 122 instances were used as the hold-out dataset (upward movements
of 66 and downward movements of 56), out of 248 total observations. In 2000, the observations
of datasets (training and hold-out) were 127 and 123 respectively and the bearish movements
(68-training and 66-hold-out) were more than the bullish movements (59-training and 57-hold-
out). This was mainly due to the dotcom burst, i.e., stock prices of Information Technology
Sector had fallen heavily, in the stock markets, throughout the world, including the U.S.A.
In 2003, the movements of growth and downfall, for datasets (training and hold-out),
were at 70, 65 and 60, 59 respectively. In 2007, bull movements were 63 and 62 and bear
movements were 62 and 60. The Indian stock market was optimistic since the total bull
movements were (615 and 586) more than the bear movements (536 and 516). This indicated
euphoric phenomenon in the stock market, during 1999-2007.
In 2008, bear movements (72 and 71) were more than the bull movements (52 and 51).
Similar trend was continued in the next year (2009) also. In 2012, the upward movements (64
and 63) were higher than downward movements (63 and 61), on training and hold-out strategic
dataset. In 2016, upward/downward movements, in case of training data, were at 64 and 62, 61
and 60 for the hold-out dataset. The Indian stock market was pessimistic since the total quantum
of bear movements were (577 and 558) more than the bull movements (559 and 534), indicating
the sober phenomenon in the post-crisis period. Investors have to note this trend to devise
investment strategies in making investment in this stock index.
Table 3
PARAMETER SETTING AND COMPARISON DATASET (DISCRETE) OF BSE-SENSEX
Year Training Hold-out Total=A+B
Upward Downward Total(A) Upward Downward Total(B)
Pre-Global Financial Crisis Period
1999 69 57 126 66 56 122 248
2000 59 68 127 57 66 123 250
2001 72 57 129 65 54 119 248
2002 69 62 131 64 56 120 251
2003 70 60 130 65 59 124 254
2004 71 58 129 69 56 125 254
2005 69 59 128 66 57 123 251
2006 73 53 126 72 52 124 250
2007 63 62 125 62 60 122 247
Total (A) 615 536 1151 586 516 1102 2253
Post-Global Financial Crisis Period
2008 52 72 124 51 71 122 246
2009 53 70 123 52 68 120 243
2010 66 63 129 62 61 123 252
Academy of Strategic Management Journal Volume 17, Issue 2, 2018
8 1939-6104-17-2-189
Table 3
PARAMETER SETTING AND COMPARISON DATASET (DISCRETE) OF BSE-SENSEX
2011 65 61 126 61 60 121 247
2012 64 63 127 63 61 124 251
2013 67 61 128 62 60 122 250
2014 63 62 125 60 59 119 244
2015 65 63 128 62 58 120 248
2016 64 62 126 61 60 121 247
Total (B) 559 577 1136 534 558 1092 2228
Sum=A+B 1174 1113 2287 1120 1074 2194 4481
Source: www.bseindia.com (Using SPSS 20.0)
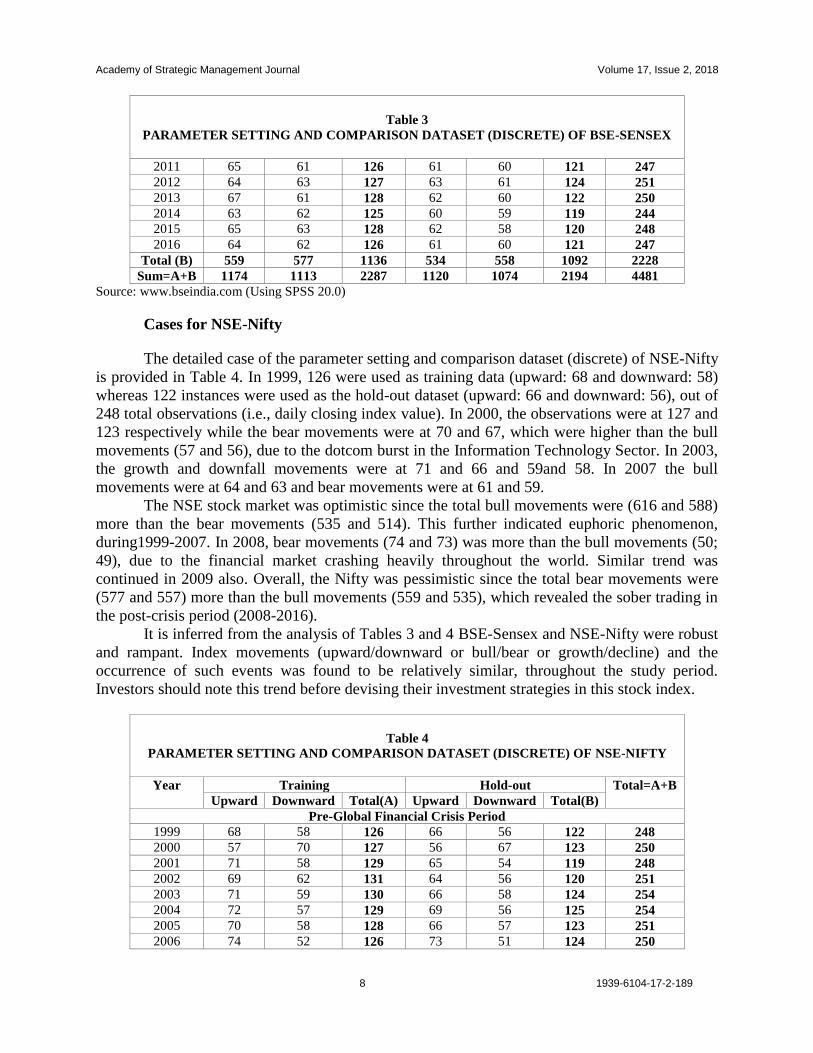
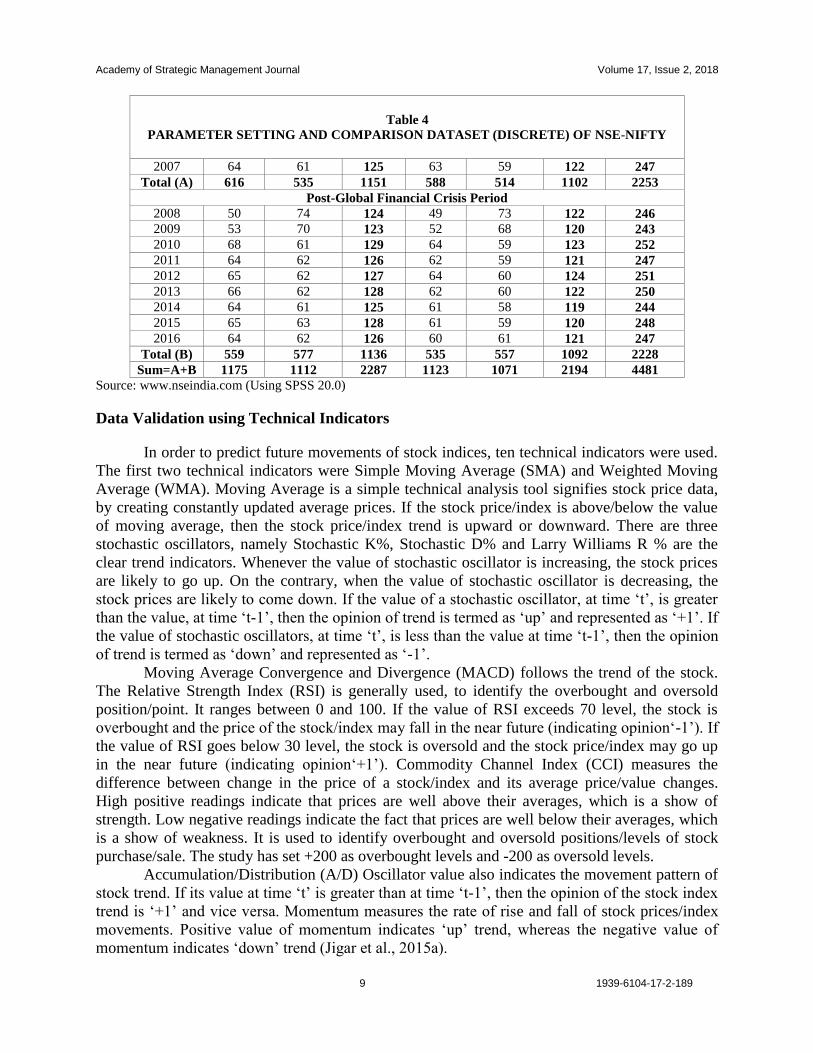
Cases for NSE-Nifty
The detailed case of the parameter setting and comparison dataset (discrete) of NSE-Nifty
is provided in Table 4. In 1999, 126 were used as training data (upward: 68 and downward: 58)
whereas 122 instances were used as the hold-out dataset (upward: 66 and downward: 56), out of
248 total observations (i.e., daily closing index value). In 2000, the observations were at 127 and
123 respectively while the bear movements were at 70 and 67, which were higher than the bull
movements (57 and 56), due to the dotcom burst in the Information Technology Sector. In 2003,
the growth and downfall movements were at 71 and 66 and 59and 58. In 2007 the bull
movements were at 64 and 63 and bear movements were at 61 and 59.
The NSE stock market was optimistic since the total bull movements were (616 and 588)
more than the bear movements (535 and 514). This further indicated euphoric phenomenon,
during1999-2007. In 2008, bear movements (74 and 73) was more than the bull movements (50;
49), due to the financial market crashing heavily throughout the world. Similar trend was
continued in 2009 also. Overall, the Nifty was pessimistic since the total bear movements were
(577 and 557) more than the bull movements (559 and 535), which revealed the sober trading in
the post-crisis period (2008-2016).
It is inferred from the analysis of Tables 3 and 4 BSE-Sensex and NSE-Nifty were robust
and rampant. Index movements (upward/downward or bull/bear or growth/decline) and the
occurrence of such events was found to be relatively similar, throughout the study period.
Investors should note this trend before devising their investment strategies in this stock index.
Table 4
PARAMETER SETTING AND COMPARISON DATASET (DISCRETE) OF NSE-NIFTY
Year Training Hold-out Total=A+B
Upward Downward Total(A) Upward Downward Total(B)
Pre-Global Financial Crisis Period
1999 68 58 126 66 56 122 248
2000 57 70 127 56 67 123 250
2001 71 58 129 65 54 119 248
2002 69 62 131 64 56 120 251
2003 71 59 130 66 58 124 254
2004 72 57 129 69 56 125 254
2005 70 58 128 66 57 123 251
2006 74 52 126 73 51 124 250
Academy of Strategic Management Journal Volume 17, Issue 2, 2018
9 1939-6104-17-2-189
Table 4
PARAMETER SETTING AND COMPARISON DATASET (DISCRETE) OF NSE-NIFTY
2007 64 61 125 63 59 122 247
Total (A) 616 535 1151 588 514 1102 2253
Post-Global Financial Crisis Period
2008 50 74 124 49 73 122 246
2009 53 70 123 52 68 120 243
2010 68 61 129 64 59 123 252
2011 64 62 126 62 59 121 247
2012 65 62 127 64 60 124 251
2013 66 62 128 62 60 122 250
2014 64 61 125 61 58 119 244
2015 65 63 128 61 59 120 248
2016 64 62 126 60 61 121 247
Total (B) 559 577 1136 535 557 1092 2228
Sum=A+B 1175 1112 2287 1123 1071 2194 4481
Source: www.nseindia.com (Using SPSS 20.0)
Data Validation using Technical Indicators
In order to predict future movements of stock indices, ten technical indicators were used.
The first two technical indicators were Simple Moving Average (SMA) and Weighted Moving
Average (WMA). Moving Average is a simple technical analysis tool signifies stock price data,
by creating constantly updated average prices. If the stock price/index is above/below the value
of moving average, then the stock price/index trend is upward or downward. There are three
stochastic oscillators, namely Stochastic K%, Stochastic D% and Larry Williams R % are the
clear trend indicators. Whenever the value of stochastic oscillator is increasing, the stock prices
are likely to go up. On the contrary, when the value of stochastic oscillator is decreasing, the
stock prices are likely to come down. If the value of a stochastic oscillator, at time ‘t’, is greater
than the value, at time ‘t-1’, then the opinion of trend is termed as ‘up’ and represented as ‘+1’. If
the value of stochastic oscillators, at time ‘t’, is less than the value at time ‘t-1’, then the opinion
of trend is termed as ‘down’ and represented as ‘-1’.
Moving Average Convergence and Divergence (MACD) follows the trend of the stock.
The Relative Strength Index (RSI) is generally used, to identify the overbought and oversold
position/point. It ranges between 0 and 100. If the value of RSI exceeds 70 level, the stock is
overbought and the price of the stock/index may fall in the near future (indicating opinion‘-1’). If
the value of RSI goes below 30 level, the stock is oversold and the stock price/index may go up
in the near future (indicating opinion‘+1’). Commodity Channel Index (CCI) measures the
difference between change in the price of a stock/index and its average price/value changes.
High positive readings indicate that prices are well above their averages, which is a show of
strength. Low negative readings indicate the fact that prices are well below their averages, which
is a show of weakness. It is used to identify overbought and oversold positions/levels of stock
purchase/sale. The study has set +200 as overbought levels and -200 as oversold levels.
Accumulation/Distribution (A/D) Oscillator value also indicates the movement pattern of
stock trend. If its value at time ‘t’ is greater than at time ‘t-1’, then the opinion of the stock index
trend is ‘+1’ and vice versa. Momentum measures the rate of rise and fall of stock prices/index
movements. Positive value of momentum indicates ‘up’ trend, whereas the negative value of
momentum indicates ‘down’ trend (Jigar et al., 2015a).
Academy of Strategic Management Journal Volume 17, Issue 2, 2018
10 1939-6104-17-2-189
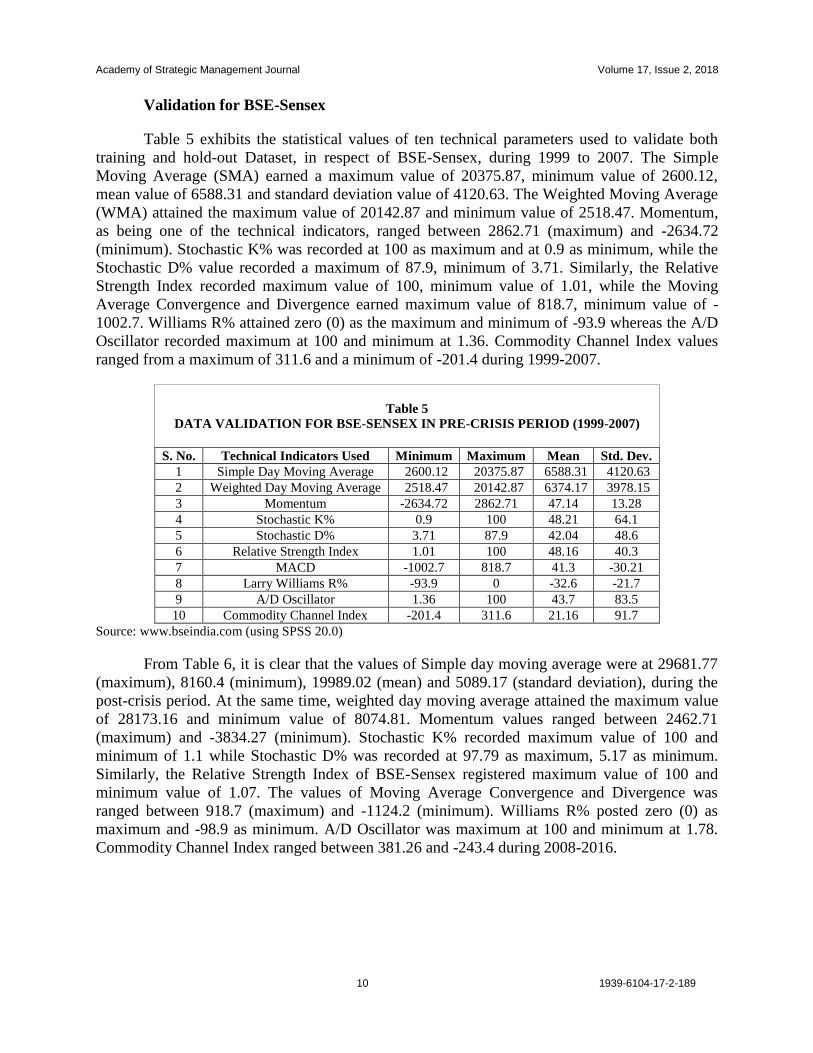
Validation for BSE-Sensex
Table 5 exhibits the statistical values of ten technical parameters used to validate both
training and hold-out Dataset, in respect of BSE-Sensex, during 1999 to 2007. The Simple
Moving Average (SMA) earned a maximum value of 20375.87, minimum value of 2600.12,
mean value of 6588.31 and standard deviation value of 4120.63. The Weighted Moving Average
(WMA) attained the maximum value of 20142.87 and minimum value of 2518.47. Momentum,
as being one of the technical indicators, ranged between 2862.71 (maximum) and -2634.72
(minimum). Stochastic K% was recorded at 100 as maximum and at 0.9 as minimum, while the
Stochastic D% value recorded a maximum of 87.9, minimum of 3.71. Similarly, the Relative
Strength Index recorded maximum value of 100, minimum value of 1.01, while the Moving
Average Convergence and Divergence earned maximum value of 818.7, minimum value of -
1002.7. Williams R% attained zero (0) as the maximum and minimum of -93.9 whereas the A/D
Oscillator recorded maximum at 100 and minimum at 1.36. Commodity Channel Index values
ranged from a maximum of 311.6 and a minimum of -201.4 during 1999-2007.
Table 5
DATA VALIDATION FOR BSE-SENSEX IN PRE-CRISIS PERIOD (1999-2007)
S. No. Technical Indicators Used Minimum Maximum Mean Std. Dev.
1 Simple Day Moving Average 2600.12 20375.87 6588.31 4120.63
2 Weighted Day Moving Average 2518.47 20142.87 6374.17 3978.15
3 Momentum -2634.72 2862.71 47.14 13.28
4 Stochastic K% 0.9 100 48.21 64.1
5 Stochastic D% 3.71 87.9 42.04 48.6
6 Relative Strength Index 1.01 100 48.16 40.3
7 MACD -1002.7 818.7 41.3 -30.21
8 Larry Williams R% -93.9 0 -32.6 -21.7
9 A/D Oscillator 1.36 100 43.7 83.5
10 Commodity Channel Index -201.4 311.6 21.16 91.7
Source: www.bseindia.com (using SPSS 20.0)
From Table 6, it is clear that the values of Simple day moving average were at 29681.77
(maximum), 8160.4 (minimum), 19989.02 (mean) and 5089.17 (standard deviation), during the
post-crisis period. At the same time, weighted day moving average attained the maximum value
of 28173.16 and minimum value of 8074.81. Momentum values ranged between 2462.71
(maximum) and -3834.27 (minimum). Stochastic K% recorded maximum value of 100 and
minimum of 1.1 while Stochastic D% was recorded at 97.79 as maximum, 5.17 as minimum.
Similarly, the Relative Strength Index of BSE-Sensex registered maximum value of 100 and
minimum value of 1.07. The values of Moving Average Convergence and Divergence was
ranged between 918.7 (maximum) and -1124.2 (minimum). Williams R% posted zero (0) as
maximum and -98.9 as minimum. A/D Oscillator was maximum at 100 and minimum at 1.78.
Commodity Channel Index ranged between 381.26 and -243.4 during 2008-2016.

Academy of Strategic Management Journal Volume 17, Issue 2, 2018
11 1939-6104-17-2-189
Table 6
DATA VALIDATION FOR BSE-SENSEX IN POST-CRISIS PERIOD (2008-2016)
S. No. Technical Indicators Used Minimum Maximum Mean Std. Dev.
1 Simple Day Moving Average 8160.40 29681.77 19989.02 5089.17
2 Weighted Day Moving Average 8074.81 28173.16 18976.21 4993.17
3 Momentum -3834.27 2462.71 57.14 19.28
4 Stochastic K% 1.1 100 59.03 75.1
5 Stochastic D% 5.17 97.79 60.04 58.6
6 Relative Strength Index 1.07 100 54.84 43.6
7 MACD -1124.2 918.7 45.51 -31.21
8 Larry Williams R% -98.9 0 -39.96 -24.9
9 A/D Oscillator 1.78 100 50.79 91.35
10 Commodity Channel Index -243.4 381.26 24.16 96.17
Source: www.bseindia.com (using SPSS 20.0)
Validation for NSE-Nifty
Table 7 reveals the statistical values of ten technical parameters, used to validate both
training and hold-out dataset, in respect of NSE-Nifty, during 1999-2007. Simple day moving
average posted the maximum value of 6513.25, minimum value of 2573.15 and mean value of
3618.26 and standard deviation of 1247.35, during the pre-crisis period. The value of weighted
day moving average was registered at 5941.71 as maximum and 2138.45 as minimum.
Momentum values ranged between 687.4 (maximum) and -110.7 (minimum). Stochastic K%
recorded the maximum value of 91.6 and minimum value of 1.24. Similarly, Stochastic D%
attained a value of 89.4 as maximum, 3.89 as minimum. Relative Strength Index posted the
maximum value of 100, minimum value of 1.03. Moving average convergence and divergence
attained the maximum value of 218.3, minimum value of -276.13. Williams R% earned the
maximum value of -0.68 and minimum value of -89.16. But the A/D Oscillator recorded
maximum value as 87.24 and the value of minimum as 1.78. Commodity channel index ranged
between 319.1 (maximum) and -217.3 (minimum), during the pre-crisis period.
Table 7
DATA VALIDATION FOR NSE-NIFTY IN PRE-CRISIS PERIOD (1999-2007)
S. No. Technical Indicators Used Minimum Maximum Mean Std. Dev.
1 Simple Day Moving Average 2573.15 6513.25 3618.26 1247.35
2 Weighted Day Moving Average 2138.45 5914.71 3179.69 1072.51
3 Momentum -110.7 687.4 119.91 6.85
4 Stochastic K% 1. 24 91. 6 53.15 62.81
5 Stochastic D% 3.89 89.4 52.7 49.71
6 Relative Strength Index 1.03 100 46.03 40.1 8
7 MACD -276.13 218.3 10.2 -11. 9
8 Larry Williams R% -89.16 -0.68 -36. 4 -20.7
9 A/D Oscillator 1.78 87.24 49.12 80.94
10 Commodity Channel Index -217.3 319. 1 20.4 87. 71
Source: www.nseindia.com (using SPSS 20.0)
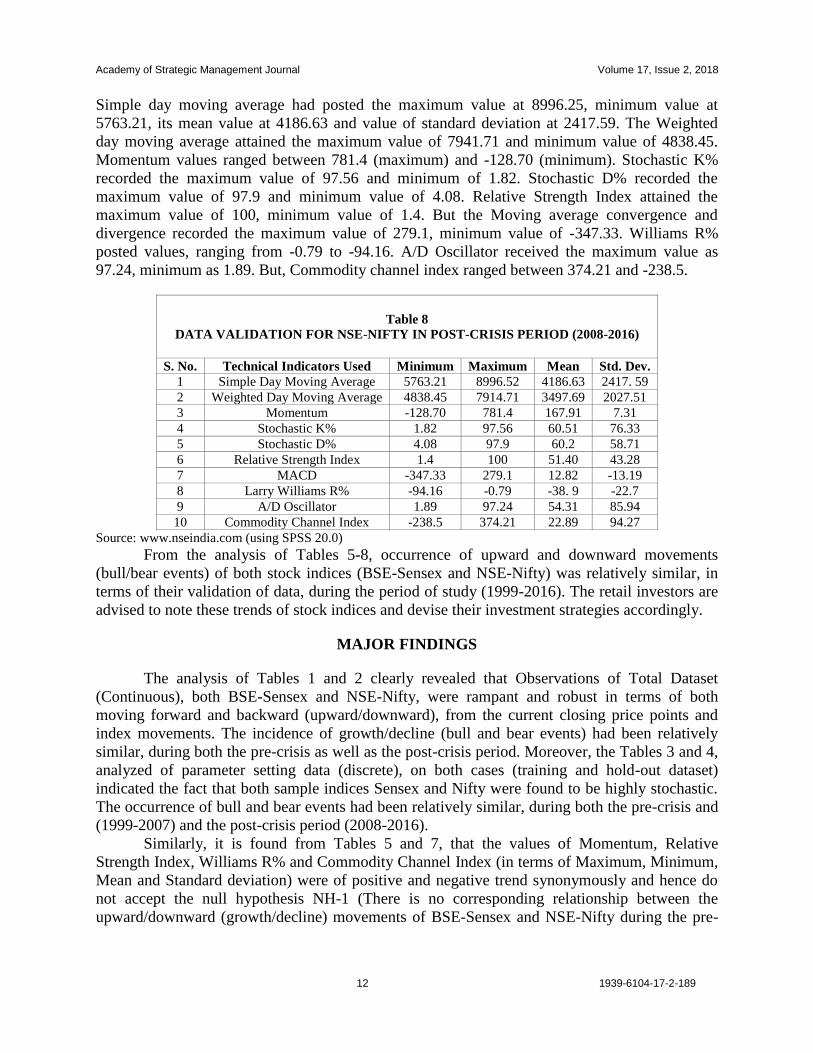
The statistical values of ten technical parameters, used to validate both training and hold-
out dataset in respect of NSE-Nifty, for the post-crisis period (2008-2016), are given in Table 8.
Academy of Strategic Management Journal Volume 17, Issue 2, 2018
12 1939-6104-17-2-189
Simple day moving average had posted the maximum value at 8996.25, minimum value at
5763.21, its mean value at 4186.63 and value of standard deviation at 2417.59. The Weighted
day moving average attained the maximum value of 7941.71 and minimum value of 4838.45.
Momentum values ranged between 781.4 (maximum) and -128.70 (minimum). Stochastic K%
recorded the maximum value of 97.56 and minimum of 1.82. Stochastic D% recorded the
maximum value of 97.9 and minimum value of 4.08. Relative Strength Index attained the
maximum value of 100, minimum value of 1.4. But the Moving average convergence and
divergence recorded the maximum value of 279.1, minimum value of -347.33. Williams R%
posted values, ranging from -0.79 to -94.16. A/D Oscillator received the maximum value as
97.24, minimum as 1.89. But, Commodity channel index ranged between 374.21 and -238.5.
Table 8
DATA VALIDATION FOR NSE-NIFTY IN POST-CRISIS PERIOD (2008-2016)
S. No. Technical Indicators Used Minimum Maximum Mean Std. Dev.
1 Simple Day Moving Average 5763.21 8996.52 4186.63 2417. 59
2 Weighted Day Moving Average 4838.45 7914.71 3497.69 2027.51
3 Momentum -128.70 781.4 167.91 7.31
4 Stochastic K% 1.82 97.56 60.51 76.33
5 Stochastic D% 4.08 97.9 60.2 58.71
6 Relative Strength Index 1.4 100 51.40 43.28
7 MACD -347.33 279.1 12.82 -13.19
8 Larry Williams R% -94.16 -0.79 -38. 9 -22.7
9 A/D Oscillator 1.89 97.24 54.31 85.94
10 Commodity Channel Index -238.5 374.21 22.89 94.27
Source: www.nseindia.com (using SPSS 20.0)
From the analysis of Tables 5-8, occurrence of upward and downward movements
(bull/bear events) of both stock indices (BSE-Sensex and NSE-Nifty) was relatively similar, in
terms of their validation of data, during the period of study (1999-2016). The retail investors are
advised to note these trends of stock indices and devise their investment strategies accordingly.
MAJOR FINDINGS
The analysis of Tables 1 and 2 clearly revealed that Observations of Total Dataset
(Continuous), both BSE-Sensex and NSE-Nifty, were rampant and robust in terms of both
moving forward and backward (upward/downward), from the current closing price points and
index movements. The incidence of growth/decline (bull and bear events) had been relatively
similar, during both the pre-crisis as well as the post-crisis period. Moreover, the Tables 3 and 4,
analyzed of parameter setting data (discrete), on both cases (training and hold-out dataset)
indicated the fact that both sample indices Sensex and Nifty were found to be highly stochastic.
The occurrence of bull and bear events had been relatively similar, during both the pre-crisis and
(1999-2007) and the post-crisis period (2008-2016).
Similarly, it is found from Tables 5 and 7, that the values of Momentum, Relative
Strength Index, Williams R% and Commodity Channel Index (in terms of Maximum, Minimum,
Mean and Standard deviation) were of positive and negative trend synonymously and hence do
not accept the null hypothesis NH-1 (There is no corresponding relationship between the
upward/downward (growth/decline) movements of BSE-Sensex and NSE-Nifty during the pre-
Academy of Strategic Management Journal Volume 17, Issue 2, 2018
13 1939-6104-17-2-189
global financial crisis period). The prediction of stock index movements of Sensex and Nifty, has
recorded similar index movements (upward/downward) during the pre-crisis period.
The results of Tables 6 and 8, shows that the values of Momentum, Relative Strength
Index, Williams R% and Commodity Channel Index (in terms of Maximum, Minimum, Mean
and Standard deviation) indicated positive and negative trend to be synonymous for both BSE-
Sensex and NSE-Nifty indices. Hence reject NH-2 (There is no corresponding relationship
between the upward/downward (growth/decline) movements of BSE-Sensex and NSE-Nifty
during post global financial crisis period). The results indicated that the prediction of index
movements of Sensex and Nifty, witnessed similar movements (upward and downward) during
the post-crisis period. Hence, retail investors should note these trends of stock indices and devise
their investment strategies accordingly.
CONCLUSION
The analysis of this study clearly showed that both BSE-Sensex and NSE-Nifty were
rampant and robust, in terms of index movements, moving forward and backward, from the
current/existing points of daily closing prices. At the same time, the incidences of stochastic
movements of both the indices were found to be similar, during the study period. Further, the
values of Momentum, Relative Strength Index, Williams R% and Commodity Channel Index
values (in terms of Maximum, Minimum, Mean and Standard Deviation) indicated both positive
and negative trend and it implied the prediction of stock index movements of Sensex and Nifty
recorded similar trends (upward/downward), during both the pre-crisis and post-crisis periods.
SCOPE FOR FUTURE RESEARCH
1. Researchers could attempt to forecast sectorial indices of BSE and NSE.
2. Efforts could be made, to study the movements of stock indices of developed economies, DJIA, S&P-500
(U.S.A), Nikkei-225 (Japan) and FTSE-100 (U.K).
3. A comparative analysis of global stock indices, with the Indian stock indices, could also be made, by
applying the neural network methods.
REFERENCES
Amitai, E. (1976). Future analysis. Analysen & Prognosen, 19-20.
Andre, C. & Beatriz, V.M.M. (2008). Evaluating the forecast accuracy of emerging market stock returns. Emerging
Markets Finance and Trade, 44(1), 21-40.
Defu, Z., Qingshan, J. & Xin, L. (2005). Application of neural networks in financial data mining. World Academy of
Science, Engineering and Technology, 1, 136-139.
Fama, E. (1970). Efficient capital markets. Journal of Finance, 25(2), 383-417.
Garg, A., Sriram, S. & Tai, K. (2013). Empirical analysis for model selection criteria for genetic programming in
modeling oftime series system. IEEE Conference on Computational Intelligence (CIFE).
Hansen, J.V. & Nelson, R.D. (2003). Forecasting and recombining time-series components by using neural
networks. Journal of the Operational Research Society, 54(3), 307-317.
Jigar, P., Sahil, S., Priyank, T. & Kotecha, K. (2015a). Predicting stock and stock price index movement using trend
deterministic data preparation and machine learning techniques. Expert Systems with Applications, 42, 259-
268.
Jigar, P., Sahil, S., Priyank, T. & Kotecha, K. (2015b). Predicting stock market index using fusion of machine
learning techniques. Expert Systems with Applications, 42, 2162-2172.
Kim, K.J. (2003). Financial time series forecasting using support vector machines. Neurocomputing, 55, 307-319.
Academy of Strategic Management Journal Volume 17, Issue 2, 2018
14 1939-6104-17-2-189
Melek, A.B. & Derya, A. (2010). An Adaptive Network-Based Fuzzy Inference System (ANFIS) for the prediction
of stock market return: The case of the Istanbul stock exchange. Expert Systems with Applications, 37,
7908-7912.
Miao, K., Chen, F. & Zhao, Z.G. (2007). Stock price forecast based on bacterial colony RBF neural network.
Journal of Qingdao University (Natural Science Edition), 2, 11.
Nair, B.B., Sai, S.G., Naveen, A., Lakshmi, A., Venktesh, G. & Mohandas, V. (2011). A ga-artificial neural network
hybrid system for financial time series forecasting. Information Technology and Mobile Communication,
499-506.
Ou, P. & Wang, H. (2009). Prediction of stock market index movements by ten data mining techniques. Modern
Applied Science, 3, 28.
Robert, S. & David, W. (2011). A network value theory of a market and puzzles. Financial Analysts Journal, 67(5),
69-85.
Robin, H. & Ryan, O. (2009). A manipulator can aid prediction market accuracy. Economica, 76(302), 304-314.
Shin, F.W. & Shie, J.L. (2015). Employing local modeling in machine learning based methods for time-series
prediction. Expert Systems with Applications, 42, 341-354.
Shuai, W. & Wei, S. (2014). Forecasting direction of China security index 300 movement with least squares support
vector machine. Procedia Computer Science, 31, 869-874.
Spanning tree algorithm. Quantitative Economics, 12(2), 44-89.
Teo, J. & Douglas, W. (2006). The profitability of daily stock market indices trades based on neural network
predictions: Case study for the S&P 500, the DAX, the TOPIX & the FTSE in1965-1999. Applied
Financial Economics, 14(4), 285-297.
Wang, J.H. & Leu, J.Y. (1996). Stock market trend protection using arima-based neural networks. IEEE
International Conference of Neural Networks.