predicting suicide attacks - rand corporation
TRANSCRIPT

HOMELAND SECURITY AND DEFENSE CENTER
For More InformationVisit RAND at www.rand.orgExplore the RAND Homeland Security and Defense CenterView document details
Support RANDPurchase this documentBrowse Reports & BookstoreMake a charitable contribution
Limited Electronic Distribution RightsThis document and trademark(s) contained herein are protected by law as indicated in a notice appearing later in this work. This electronic representation of RAND intellectual property is provided for non-commercial use only. Unauthorized posting of RAND electronic documents to a non-RAND website is prohibited. RAND electronic documents are protected under copyright law. Permission is required from RAND to reproduce, or reuse in another form, any of our research documents for commercial use. For information on reprint and linking permissions, please see RAND Permissions.
Skip all front matter: Jump to Page 16
The RAND Corporation is a nonprofit institution that helps improve policy and decisionmaking through research and analysis.
This electronic document was made available from www.rand.org as a public service of the RAND Corporation.
CHILDREN AND FAMILIES
EDUCATION AND THE ARTS
ENERGY AND ENVIRONMENT
HEALTH AND HEALTH CARE
INFRASTRUCTURE AND TRANSPORTATION
INTERNATIONAL AFFAIRS
LAW AND BUSINESS
NATIONAL SECURITY
POPULATION AND AGING
PUBLIC SAFETY
SCIENCE AND TECHNOLOGY
TERRORISM AND HOMELAND SECURITY

This product is part of the RAND Corporation monograph series. RAND monographs present major research findings that address the challenges facing the public and private sectors. All RAND mono-graphs undergo rigorous peer review to ensure high standards for research quality and objectivity.
C O R P O R A T I O N
Predicting Suicide AttacksIntegrating Spatial, Temporal, and Social Features of Terrorist Attack Targets
Walter L. Perry, Claude Berrebi, Ryan Andrew Brown,
John Hollywood, Amber Jaycocks, Parisa Roshan, Thomas Sullivan,
Lisa Miyashiro


HOMELAND SECURITY AND DEFENSE CENTER
Predicting Suicide AttacksIntegrating Spatial, Temporal, and Social Features of Terrorist Attack Targets
Walter L. Perry, Claude Berrebi, Ryan Andrew Brown,
John Hollywood, Amber Jaycocks, Parisa Roshan, Thomas Sullivan,
Lisa Miyashiro
Sponsored by the Naval Research LaboratoryApproved for public release; distribution unlimited
The RAND Corporation is a nonprofit institution that helps improve policy and decisionmaking through research and analysis. RAND’s publications do not necessarily reflect the opinions of its research clients and sponsors.
R® is a registered trademark.
© Copyright 2013 RAND Corporation
Permission is given to duplicate this document for personal use only, as long as it is unaltered and complete. Copies may not be duplicated for commercial purposes. Unauthorized posting of RAND documents to a non-RAND website is prohibited. RAND documents are protected under copyright law. For information on reprint and linking permissions, please visit the RAND permissions page (http://www.rand.org/publications/permissions.html).
Published 2013 by the RAND Corporation1776 Main Street, P.O. Box 2138, Santa Monica, CA 90407-2138
1200 South Hayes Street, Arlington, VA 22202-50504570 Fifth Avenue, Suite 600, Pittsburgh, PA 15213-2665
RAND URL: http://www.rand.orgTo order RAND documents or to obtain additional information, contact
Distribution Services: Telephone: (310) 451-7002; Fax: (310) 451-6915; Email: [email protected]
This research was sponsored by the Naval Research Laboratory and conducted within the RAND Homeland Security and Defense Center, a joint center of RAND Justice, Infrastructure, and Environment, and the RAND National Defense Research Institute, a federally funded research and development center sponsored by the Office of the Secretary of Defense, the Joint Staff, the Unified Combatant Commands, the Navy, the Marine Corps, the defense agencies, and the defense Intelligence Community.
Library of Congress Cataloging-in-Publication Data is available for this publication.
ISBN: 978-0-8330-7800-1

iii
Preface
This monograph documents the results of RAND’s assessment of the benefits of considering sociocultural, economic, and political factors to augment geospatial methods of predicting suicide bombings. This was a proof-of-principle effort done in conjunction with the Naval Research Laboratory and supplements its work documented in U.S. Naval Research Laboratory, 2010a. The work was conducted for the Department of Homeland Security.
This research was sponsored by the Naval Research Laboratory and conducted within the RAND Homeland Security and Defense Center, a joint center of RAND Justice, Infrastructure, and Environ-ment and the RAND National Defense Research Institute, a federally funded research and development center sponsored by the Office of the Secretary of Defense, the Joint Staff, the Unified Combatant Com-mands, the Navy, the Marine Corps, the defense agencies, and the defense Intelligence Community.
Questions or comments about this monograph should be sent to the project leaders, Walter Perry ([email protected]) and Claude Ber-rebi ([email protected]). For more information on the RAND Home-land Security and Defense Center, see http://www.rand.org/multi/ homeland-security-and-defense or contact the director (contact infor-mation is provided on the web page).

v
Contents
Preface . . . . . . . . . . . . . . . . . . . . . . . . . . . . . . . . . . . . . . . . . . . . . . . . . . . . . . . . . . . . . . . . . . . . . . . . . . . . . iiiFigures . . . . . . . . . . . . . . . . . . . . . . . . . . . . . . . . . . . . . . . . . . . . . . . . . . . . . . . . . . . . . . . . . . . . . . . . . . . . . viiTables . . . . . . . . . . . . . . . . . . . . . . . . . . . . . . . . . . . . . . . . . . . . . . . . . . . . . . . . . . . . . . . . . . . . . . . . . . . . . . ixSummary . . . . . . . . . . . . . . . . . . . . . . . . . . . . . . . . . . . . . . . . . . . . . . . . . . . . . . . . . . . . . . . . . . . . . . . . . . xiAcknowledgments . . . . . . . . . . . . . . . . . . . . . . . . . . . . . . . . . . . . . . . . . . . . . . . . . . . . . . . . . . . . xxiiiAbbreviations . . . . . . . . . . . . . . . . . . . . . . . . . . . . . . . . . . . . . . . . . . . . . . . . . . . . . . . . . . . . . . . . . . . xxv
ChAPTer One
Introduction and Overview . . . . . . . . . . . . . . . . . . . . . . . . . . . . . . . . . . . . . . . . . . . . . . . . . . . . . 1Background . . . . . . . . . . . . . . . . . . . . . . . . . . . . . . . . . . . . . . . . . . . . . . . . . . . . . . . . . . . . . . . . . . . . . . . . . 1About This Report . . . . . . . . . . . . . . . . . . . . . . . . . . . . . . . . . . . . . . . . . . . . . . . . . . . . . . . . . . . . . . . . . 4
ChAPTer TwO
Quantitative Data and Methods . . . . . . . . . . . . . . . . . . . . . . . . . . . . . . . . . . . . . . . . . . . . . . . 5Quantitative Data . . . . . . . . . . . . . . . . . . . . . . . . . . . . . . . . . . . . . . . . . . . . . . . . . . . . . . . . . . . . . . . . . . 5
Socioeconomic Characteristics . . . . . . . . . . . . . . . . . . . . . . . . . . . . . . . . . . . . . . . . . . . . . . . . . 6Demographic Characteristics . . . . . . . . . . . . . . . . . . . . . . . . . . . . . . . . . . . . . . . . . . . . . . . . . . . 7Electoral Data . . . . . . . . . . . . . . . . . . . . . . . . . . . . . . . . . . . . . . . . . . . . . . . . . . . . . . . . . . . . . . . . . . . . 7Proximity to Terrorist Safe Houses . . . . . . . . . . . . . . . . . . . . . . . . . . . . . . . . . . . . . . . . . . . . 8Sociocultural Precipitants . . . . . . . . . . . . . . . . . . . . . . . . . . . . . . . . . . . . . . . . . . . . . . . . . . . . . . . 9
Principal Component Analysis and Logistic Regression . . . . . . . . . . . . . . . . . . . . . 12Logistic Regression . . . . . . . . . . . . . . . . . . . . . . . . . . . . . . . . . . . . . . . . . . . . . . . . . . . . . . . . . . . . . 12Dimension Reduction . . . . . . . . . . . . . . . . . . . . . . . . . . . . . . . . . . . . . . . . . . . . . . . . . . . . . . . . . . 14
Classification and Regression Trees . . . . . . . . . . . . . . . . . . . . . . . . . . . . . . . . . . . . . . . . . . . . . 15Sociocultural Precipitants Analysis . . . . . . . . . . . . . . . . . . . . . . . . . . . . . . . . . . . . . . . . . . . . . 16Results of Quantitative Data Analysis . . . . . . . . . . . . . . . . . . . . . . . . . . . . . . . . . . . . . . . . . . 17

vi Predicting Suicide Attacks
Principal Components Analysis . . . . . . . . . . . . . . . . . . . . . . . . . . . . . . . . . . . . . . . . . . . . . . . 17Logistic Regression Models . . . . . . . . . . . . . . . . . . . . . . . . . . . . . . . . . . . . . . . . . . . . . . . . . . . . 19Classification and Regression Trees . . . . . . . . . . . . . . . . . . . . . . . . . . . . . . . . . . . . . . . . . . . 32Sociocultural Precipitants . . . . . . . . . . . . . . . . . . . . . . . . . . . . . . . . . . . . . . . . . . . . . . . . . . . . . . 35
Summing Up . . . . . . . . . . . . . . . . . . . . . . . . . . . . . . . . . . . . . . . . . . . . . . . . . . . . . . . . . . . . . . . . . . . . . . 37
ChAPTer Three
Qualitative Analysis . . . . . . . . . . . . . . . . . . . . . . . . . . . . . . . . . . . . . . . . . . . . . . . . . . . . . . . . . . . . . 39Methodology . . . . . . . . . . . . . . . . . . . . . . . . . . . . . . . . . . . . . . . . . . . . . . . . . . . . . . . . . . . . . . . . . . . . . . 39Hypotheses Driving the Use of the Methodology . . . . . . . . . . . . . . . . . . . . . . . . . . . . 41Assumptions in Using the Methodology . . . . . . . . . . . . . . . . . . . . . . . . . . . . . . . . . . . . . . 42
Restrictions . . . . . . . . . . . . . . . . . . . . . . . . . . . . . . . . . . . . . . . . . . . . . . . . . . . . . . . . . . . . . . . . . . . . . 42Timing . . . . . . . . . . . . . . . . . . . . . . . . . . . . . . . . . . . . . . . . . . . . . . . . . . . . . . . . . . . . . . . . . . . . . . . . . . 43
Results of Qualitative Data Analysis . . . . . . . . . . . . . . . . . . . . . . . . . . . . . . . . . . . . . . . . . . . 43Identification of Codes . . . . . . . . . . . . . . . . . . . . . . . . . . . . . . . . . . . . . . . . . . . . . . . . . . . . . . . . 44Distribution of Codes . . . . . . . . . . . . . . . . . . . . . . . . . . . . . . . . . . . . . . . . . . . . . . . . . . . . . . . . . 44Retargeting of Previously Attacked Locations . . . . . . . . . . . . . . . . . . . . . . . . . . . . . . . 47Dispersion of Attacks over Time . . . . . . . . . . . . . . . . . . . . . . . . . . . . . . . . . . . . . . . . . . . . . 48Assessment of Transportation Targets . . . . . . . . . . . . . . . . . . . . . . . . . . . . . . . . . . . . . . . 50Comparison of Codes to a Subject-Matter Expert Hypothesis . . . . . . . . . . . 50
ChAPTer FOur
Conclusions and recommendations . . . . . . . . . . . . . . . . . . . . . . . . . . . . . . . . . . . . . . . . . 53Conclusions from Quantitative Data Analysis . . . . . . . . . . . . . . . . . . . . . . . . . . . . . . . . 53Conclusions from Qualitative Data Analysis . . . . . . . . . . . . . . . . . . . . . . . . . . . . . . . . . 54Recommendations for Further Research . . . . . . . . . . . . . . . . . . . . . . . . . . . . . . . . . . . . . . . 55
Regression Analyses and Classification . . . . . . . . . . . . . . . . . . . . . . . . . . . . . . . . . . . . . . . 55Sociocultural Precipitants . . . . . . . . . . . . . . . . . . . . . . . . . . . . . . . . . . . . . . . . . . . . . . . . . . . . . . 57Transferability . . . . . . . . . . . . . . . . . . . . . . . . . . . . . . . . . . . . . . . . . . . . . . . . . . . . . . . . . . . . . . . . . . . 57
APPenDIxeS
A. Sociocultural Precipitant Database . . . . . . . . . . . . . . . . . . . . . . . . . . . . . . . . . . . . . . . 59B. Logistic regression Output . . . . . . . . . . . . . . . . . . . . . . . . . . . . . . . . . . . . . . . . . . . . . . . . 71
About the Authors . . . . . . . . . . . . . . . . . . . . . . . . . . . . . . . . . . . . . . . . . . . . . . . . . . . . . . . . . . . . . . 77Bibliography . . . . . . . . . . . . . . . . . . . . . . . . . . . . . . . . . . . . . . . . . . . . . . . . . . . . . . . . . . . . . . . . . . . . . . 83
vii
Figures
1.1. Maps of Jerusalem Areas at Increased Risk of Suicide Attack . . . . . . . . . . . . . . . . . . . . . . . . . . . . . . . . . . . . . . . . . . . . . . . . . . . . . . . . . . . . . . . . . . 2
2.1. Change in Predicted Probability of Attack for the Low- Income and High-Wealth Indices . . . . . . . . . . . . . . . . . . . . . . . . . . . . . . . . 26
2.2. Change in Predicted Probability of Attack for the Demographic Indices . . . . . . . . . . . . . . . . . . . . . . . . . . . . . . . . . . . . . . . . . . . . . . . 28
2.3. Change in Predicted Probability of Attack for the Political Indices . . . . . . . . . . . . . . . . . . . . . . . . . . . . . . . . . . . . . . . . . . . . . . . . . . . . . . 29
2.4. Change in Predicted Probability of Attack for the All Variable Indices . . . . . . . . . . . . . . . . . . . . . . . . . . . . . . . . . . . . . . . . . . . . . . . . . . . . . . 31
2.5. Regression Tree for Attacks in Jerusalem Neighborhoods . . . . . . 33 2.6. Combined Geospatial and Sociocultural Risk Map,
Jerusalem . . . . . . . . . . . . . . . . . . . . . . . . . . . . . . . . . . . . . . . . . . . . . . . . . . . . . . . . . . . . . 36 3.1. Using Coding to Identify Small Areas at High Risk of
Attack . . . . . . . . . . . . . . . . . . . . . . . . . . . . . . . . . . . . . . . . . . . . . . . . . . . . . . . . . . . . . . . . 40 3.2. Distribution of Codes for Suicide Bombings in Israel . . . . . . . . . . 46 3.3. Distribution of Codes for Suicide Bombings in Israel . . . . . . . . . . . 47 3.4. Migration from Iconic and Main Street Targets . . . . . . . . . . . . . . . . . 49


ix
Tables
2.1. Precipitants, Associated Time Lags, and Rationale . . . . . . . . . . . . . . 10 2.2. Socioeconomic PCA results . . . . . . . . . . . . . . . . . . . . . . . . . . . . . . . . . . . . . . . . 19 2.3. Demographic PCA Results . . . . . . . . . . . . . . . . . . . . . . . . . . . . . . . . . . . . . . . . 20 2.4. Political PCA Results . . . . . . . . . . . . . . . . . . . . . . . . . . . . . . . . . . . . . . . . . . . . . . . . 21 2.5. Sociocultural, All Variable, PCA Results . . . . . . . . . . . . . . . . . . . . . . . . 22 2.6. Correlations Among Principal Components, NRL
Geospatial Risk Assessment Score . . . . . . . . . . . . . . . . . . . . . . . . . . . . . . . . . 25 2.7. Evaluation of the Socioeconomic Logistic Regressions . . . . . . . . . 27 2.8. Evaluation of the Demographic Logistic Regressions . . . . . . . . . . . 29 2.9. Evaluation of the Political Logistic Regressions . . . . . . . . . . . . . . . . . 30 2.10. Evaluation of the All Variable Logistic Regressions . . . . . . . . . . . . . 31 2.11. Logistic Regression with Terrorist Safe Houses in Close
Proximity . . . . . . . . . . . . . . . . . . . . . . . . . . . . . . . . . . . . . . . . . . . . . . . . . . . . . . . . . . . . . 32 2.12. Negative Binomial Regression with Sociocultural
Precipitants . . . . . . . . . . . . . . . . . . . . . . . . . . . . . . . . . . . . . . . . . . . . . . . . . . . . . . . . . . . 37 3.1. Periods for Israeli Suicide Bombings . . . . . . . . . . . . . . . . . . . . . . . . . . . . . 43 3.2. Inferred Codes for Israeli Suicide Bombings . . . . . . . . . . . . . . . . . . . . . 45 3.3. Locations in Israel Attacked More Than Once . . . . . . . . . . . . . . . . . . 48 3.4. Comparing Hypothesized Target Attributes with
Inferred Attributes for Suicide Bombings in Israel . . . . . . . . . . . . . . 52 A.1. Precipitants Identified . . . . . . . . . . . . . . . . . . . . . . . . . . . . . . . . . . . . . . . . . . . . . . . 59 A.2. Jewish and Islamic Religious Calendars . . . . . . . . . . . . . . . . . . . . . . . . . . 65 B.1. Logistic Regression with Socioeconomic Indices . . . . . . . . . . . . . . . . 71 B.2. Logistic Regression with Socioeconomic and NRL Risk
Indices . . . . . . . . . . . . . . . . . . . . . . . . . . . . . . . . . . . . . . . . . . . . . . . . . . . . . . . . . . . . . . . . . 72 B.3. Logistic Regression with Demographic Indices . . . . . . . . . . . . . . . . . . 72

x Predicting Suicide Attacks
B.4. Logistic Regression with Demographic and NRL Risk Indices . . . . . . . . . . . . . . . . . . . . . . . . . . . . . . . . . . . . . . . . . . . . . . . . . . . . . . . . . . . . . . . . . 73
B.5. Logistic Regression with Political Indices . . . . . . . . . . . . . . . . . . . . . . . . . 73 B.6. Logistic Regression with Political and NRL Risk Indices . . . . . . 74 B.7. Logistic Regression with All Variable Indices . . . . . . . . . . . . . . . . . . . . 74 B.8. Logistic Regression with All Variable and NRL Risk
Indices . . . . . . . . . . . . . . . . . . . . . . . . . . . . . . . . . . . . . . . . . . . . . . . . . . . . . . . . . . . . . . . . . 75
xi
Summary
The threat of suicide bombings in the United States and elsewhere prompted the Department of Homeland Security to commission the Naval Research Laboratory (NRL) to develop a method for predicting the determinants of suicide bombing attacks. As a test case, NRL chose to study suicide bombings in four Israeli cities: Jerusalem, Haifa, Tel Aviv, and Netanya. They focused on three terrorist groups: Hamas, Al-Aqsa Martyrs’ Brigade, and the Palestinian Islamic Jihad.
NRL designed a two-part study aimed at discovering terrorist group target preferences in suicide terrorism. The first part focused on examining spatial preference patterns: how the different terrorist groups develop target preferences and how these preference patterns can be transferred. Part 2 of the study focused on the sociocultural, socioeconomic, demographic, and political aspects of the suicide bomber attacks. The rationale is that looking at purely spatial attri-butes ignores the broader social context in which the attack occurred and that proper analysis of this social context can provide additional clues about the risk of future attacks. This monograph documents the results of incorporating these sociocultural, demographic, and political features in the analysis. This work should be considered an exploratory pilot study, designed simply to examine whether sociocultural features of the environment can add explanatory power to models and data sets that focus more on geospatial features.
RAND was asked to explore the ability of sociocultural, political, economic, and demographic variables to add value to the prediction of the timing and locations of suicide attacks in Israel. We did this in two ways. First, we conducted a quantitative analysis using socio-

xii Predicting Suicide Attacks
cultural, economic, and political variables to model areas at increased risk, then examined the value this added to NRL’s geospatial predictive techniques. Second, we drilled down more deeply into qualitative data on known attack sites to identify specific types and attributes of loca-tions that may put them at increased risk. These efforts were designed to develop a methodology that could be used to create a short list of at-risk areas for future attacks. NRL’s end goal was to produce such a list for the U.S. environment, drawing on the most useful aspects of the methodological and analytic work from this test case.
Quantitative Methodology and Data
The data we analyzed came from multiple sources. Our basic unit of analysis was the statistical area defined by the Israeli Central Bureau of Statistics, which we refer to as “neighborhoods.” The analysis included the following categories of data:
• Socioeconomic characteristics. We conjectured that it is possi-ble for the socioeconomic characteristics of Israeli neighborhoods to make them more or less attractive as suicide bombing targets. The Israeli census collects detailed socioeconomic information by statistical areas that have roughly the size and population of a U.S. census tract. The Israeli Central Bureau of Statistics collects multiple socioeconomic indicators (average income, high school graduation rate, unemployment, housing density, etc.) for every neighborhood in Israel.
• Demographic characteristics. The key targets of suicide bomb-ing in Israel are people (rather than, for example, infrastructure), so it is important to examine whether population variation in the religious, racial-ethnic, and other demographic features of a neighborhood affects suicide bombing targeting preferences.
• electoral data. Past research has shown that political leanings of the Israeli electorate are responsive to terror attacks and that the reigning political party has an effect on the expected number and frequency of attacks. As a result, we expected that terrorist plan-
Summary xiii
ners might be attuned to the political leanings of neighborhoods and might select targets based on perceived Israeli partisanship. We obtained 1999 voting data for the Knesset by polling station and aggregated the data to the neighborhood level.
• Proximity to terrorist safe houses. We collected coordinates for all known Palestinian Islamic Jihad, Hamas, and Al-Aqsa terror-ist safe houses in the region. We calculated both Euclidean and driving distances to the nearest terrorist safe house, as well as the number of safe houses in close proximity to each neighborhood centroid.
• Sociocultural precipitants. We compiled a list of precipitants that have been theorized to be associated with the timing of suicide bombing attacks. Existing research has identified reli-gious holidays, political events, and other occurrences as poten-tial precipitants that trigger suicide bombing attacks. Martyr-dom videos made by suicide bombers have explicitly referred to political negotiations and high-profile meetings, such as the Arab League Summit. We created temporal variables from information on Jewish religious holidays, political negotiations, and Israeli Defense Force (IDF) operations.
Principal Component Analysis Results
Having collected a large data set, our first task was to narrow the list of variables and create a series of scales. We performed separate prin-cipal component analyses for socioeconomic, demographic, and elec-toral data. The objective was to account for the maximum portion of the variance present in the original set of variables with a minimum number of composite variables. Throughout the analysis, we consid-ered components until they no longer contributed more than 10 per-cent of the total variance or once the cumulative proportion of variance was 80 percent or more.
• Socioeconomic Variables. Analysis yielded two indices that col-lectively accounted for 69 percent of the variance: Low Income
xiv Predicting Suicide Attacks
accounted for 54 percent, and High Wealth accounted for 15 per-cent.
• Demographic variables. Our analysis yielded four indices that accounted for 85 percent of the variance: Aging accounted for 30 percent; Jewish accounted for 23 percent; Asia/Africa Origin accounted for 22 percent; and Nonimmigrant accounted for 10 percent.
• Political variables. Analysis of political variables yielded two indices that collectively accounted for 82 percent of the variance: Orthodox accounted for 58 percent, and Non-Arab accounted for 24 percent.
• All variables. Using variables from all three domains, we con-structed six indices representing 85 percent of the variance.
Logistic Regression Results
We used binomial logistic regression to test the association of indices from each category of variables (socioeconomic, demographic, politi-cal) with the probability of attack in particular neighborhoods. In each case, we examined the added value of these indices for predicting attack site probability by neighborhood in addition to NRL’s geospatial predictors.
Socioeconomic, Demographic, and Political Model Regression Results
According to the two socioeconomic indices, lower-income neighbor-hoods were at higher risk, while neighborhoods with higher material wealth were at higher risk than those with lower. The demographic scales indicated neighborhoods with more immigrants of Asian or African origin were at higher risk of attack. Neither political index was significant, but both Orthodox and non-Arab were associated with decreased likelihood of attack.
Socioeconomic, Demographic, and Political Models with NRL Risk Index Regression Results
When the indices from each of the domains were combined with the NRL Risk Index, the index that was trained off of the attack data
Summary xv
absorbs the predictive ability from the other indices. However, the combined models yielded better false positive and false negative rates.
All-Variable Logistic Regression
Next, we used the six indices from the principal components analy-sis that employed all the variables across the three categories (socio-economic, demographic, and political). All indices are associated with slightly higher odds of attack. Most notable are the Older/Non-Jewish index and Educated Israeli/Non–Right Wing voters.
Proximity to Terrorist Safe Houses
To test whether tactical accessibility to target sites might affect the strategic planning and operational activity of terrorist groups, we cal-culated both Euclidean and driving distances (Manhattan1) between known terrorist safe houses for Hamas, the Al-Aqsa Martyrs’ Brigade, and Palestinian Islamic Jihad and all neighborhood centroids. The models did not reach significance, either for Jerusalem alone or for all cities combined. However, a model examining the number of terror-ist safe houses in close proximity (below the median distance) to the neighborhood was marginally significant (p-value < 0.1)
Classification and Regression Trees (CART)
We generated a decision tree that categorized neighborhoods in Jerusa-lem by risk level. The classification tree model used 12 socioeconomic, 11 demographic, and five political variables to create hierarchical trees generating the most efficient categorization of neighborhoods by risk level while minimizing the variance in each category. This produced four neighborhood profiles, two of which were low risk (0–17 percent probability of attack), one was categorized as moderate risk (55 percent probability of attack), and one was high risk (67 percent probability of attack). The two low-risk profiles contained most of the neighbor-
1 The Manhattan distance is the distance between two points in a grid based a strictly on vertical and/or horizontal path (that is, along the grid lines), as opposed to the diagonal or “as the crow flies” distance. The Manhattan distance is the simple sum of the horizontal and vertical components, whereas the diagonal distance might be computed by applying the Pythagorean theorem.
xvi Predicting Suicide Attacks
hoods in Jerusalem (104 out of 129 neighborhoods). Thus, there was considerable specificity for the remaining neighborhoods categorized as moderate to high risk.
Sociocultural Precipitants
We assigned temporal variables to all neighborhoods in Jerusalem for Jewish religious holidays, political negotiations, and IDF operations. We examined the association between the occurrence of a sociocultural precipitant and attack frequency. Results indicated that the political variable was most important; that is, there was an association between the proximity of political negotiations and the expected frequency of attack.
Qualitative Analysis
We conducted a qualitative analysis to identify and code themes common to suicide bombing sites in Israel. The themes reflected both target location types and attributes. The concept was to use the hybrid NRL-RAND model to identify areas at increased risk of attack, then use the themes we had identified to identify specific locations at increased risk of attack. This approach was intended to reduce areas treated as high risk from city regions to more manageable lists of sites.
Methodology
The first step was to review open-source articles about the attacks and target sites. We specifically considered articles on suicide bombings in the four study cities (Jerusalem, Tel Aviv, Haifa, and Netanya). We identified key words and phrases stating target characteristics (the themes) in attack descriptions, target descriptions, and descriptions of areas with visually apparent bombing clusters. The second step was to look for similarities in target characteristics across the events, identify-ing commonality.
The themes are captured through codes—a standard set of labels identifying whether the target site possesses that theme. The codes were derived from observations of the data and reflect both target types and

Summary xvii
attributes. The presence or absence of the codes can be treated as 0–1 indicator variables, which in turn permit various types of statistical analyses.
The third step was to assess the numbers and timing of attacks having the codes in common. We identified patterns in the codes, including discernible clusters, correlations, and trends. For codes that larger numbers of cases shared, the analysis identified statistically sig-nificant findings about target characteristics.
Hypotheses
First, we hypothesized the existence of certain targets that a would-be terrorist would think of attacking. These would be places where it is commonly known that crowds of Jewish Israelis congregate and/or have some special meaning to Jewish Israelis.
Second, we hypothesized that suicide bombing plotters are fairly rational and will select targets that provide reasonably easy access to crowds of people to attack. However, we further hypothesized that, in doing so, would-be terrorists are simply seeking “satisfactory” attacks—identifying “obvious” targets that, at first thought, seem to offer a “good-enough” combination of crowds and easy access.
Since the qualitative methodology was intended to infer the attacking organizations’ underlying targeting preferences, we analyzed a location only if a suicide bomber reached his or her intended target. They need not have fully reached their target, but the location they were trying to strike had to be clear. Our research yielded 55 attack cases that were independent and had a clear target.
Results
Codes
Using qualitative data analysis, we identified 12 codes that appeared in at least two cases each: disco or club, hotel, main street, main shop-ping, alternative, beachfront, children or youth, crowded, easy access, iconic, Jewish and/or Arab, and military.
xviii Predicting Suicide Attacks
Distribution of the Codes
The most frequent code, crowded, applied to all cases. This code does not refer strictly to a large crowd, tens of hundreds of people. It means that there was a fairly large group of people at the scene, who were rea-sonably accessible to the bomber. The frequency of this code implies that the notion that suicide bombers attack targets featuring groups of people that are readily accessible is accurate. Of the remaining 11 codes, the top three were main shopping, iconic, and main street. Almost 70 percent of the cases had at least one of these three codes. The prevalence of these codes is consistent with both a crime pattern theory hypothesis on choosing “obvious” places and a choice to target locations with accessible crowds
Retargeting
Terrorist organizations were very conservative in attacking targets with suicide bombers; targets hit once were at extremely high risk to be struck again. Over one-third (36 percent) of suicide bombings were restrikes of prior targets. Once an organization finds a site that meets its criteria and has attacked it successfully, the site becomes an easy choice for additional attacks. Sites attacked more than once include the following:
• in Jerusalem: central bus station, the Jaffa Road–King George Street intersection, Mahane Yehuda market, Ben Yehuda street (pedestrian mall), and the French Hill bus junction
• in Tel Aviv: Neve Sha’ana market and shopping areas near the central bus station
• in netanya: Hasharon Mall entrances and immediately sur-rounding areas, such as nearby bus stops.
Dispersion of Attacks over Time
From reviewing attack descriptions and point maps showing attack locations, we found that target selection migrated from iconic and cen-trally located targets over time. Such a migration would be consistent with the notion that terrorist organizations choose alternative sites in response to increased security at preferred sites. We assessed whether
Summary xix
this initial impression was quantitatively justified. Our approach was to group the attack sites into clusters by similarities in their codes.
We found two clusters that were highly meaningful, dividing tar-gets that were iconic and/or on a main street from other types of tar-gets. In particular, in the iconic–main street cluster, 82 percent of sites had the iconic code, and 73 percent of sites had the main street code; in the other cluster, zero sites had either of these two codes. The data show a strong migration away from iconic and main street targets over time.
Assessment of Transportation Targets
Twenty-three suicide bombings in the Suicide Terrorism Database were attacks on transportation (bus lines or bus stops). We identified three types of transportation targets within these cases:
• on-target direct: These included seven attacks on the transporta-tion system itself.
• on-target indirect: These included 13 attacks on a specific loca-tion that indirectly involved transportation.
• not on target: These included three attacks that were premature detonations while on bus lines.
Conclusions
Quantitative analysis established that socioeconomic, demographic, and political variables have meaningful relationships with the odds of attack within specific neighborhoods and that this added to the explanatory power of geospatial variables.
Demographically, both having a heavily Jewish population and a large number of immigrants (particularly from Asia and Africa) were related to greater risk of attack. Voting for right-wing or Orthodox par-ties in 1999 was related to lower neighborhood risk of attack.
The relationships between socioeconomic, demographic, and political variables and attack probability held even when controlling for geospatial factors, so they seem to confer risk for reasons beyond their association with geospatial features of neighborhoods.

xx Predicting Suicide Attacks
Perhaps the most striking finding was the robust relationship between multiple types of sociocultural precipitants and attack fre-quency in Jerusalem. Jewish religious holidays, political negotiations, and IDF operations were all associated with a greater likelihood of attack within the time windows specified for each type of event.
Attackers would trade off between risk (carrying out the attack) and reward (numbers of casualties). Suicide bombers targeted accessible crowds.
However, attackers were not simply targeting groups of people at random. First, they were very repetitive in making target decisions. Over one-third of attacks were repeat strikes on locations attacked pre-viously. Locations that have been targeted need to be considered very high risk for future attacks.
Next, attacks most often targeted not just places where people congregate but places that were well known. The three most frequent characteristics of attacked sites were that they were the city’s principal shopping locations, on one of a city’s main streets for shopping and entertainment, and/or were iconic locations in the city.
Recommendations
The study documented here was essentially a proof of principle aimed at suggesting that sociocultural, economic, and political factors have a role in predicting suicide attacks by providing the needed context for NRL’s geospatial analyses. We have indeed demonstrated that these factors enhance our ability to predict these attacks. However, there are several ways to further improve our results.
Regression Analyses
The regression analyses we performed were all cross-sectional. How-ever, sociocultural, geospatial, and even precipitant event determinants of suicide bomb attack sites likely change over time. Multiple years of data exist for voting patterns (1996, 1999, and 2003), and the Israeli census has 2008 data available in addition to the 1995 census data used in our analyses. Furthermore, geospatial data are available in specific

Summary xxi
years, which would enable modeling of changing road networks and other geospatial features. A panel regression using multiple years of data would allow us to model the influence of changes in the social and geospatial context relative to patterns of suicide bombing attacks over time.
Neighborhoods are also likely to be spatially correlated. The regression models presented in the quantitative analyses did not exam-ine or account for this correlation. Future analysis should consider the spatially correlated regression residuals and apply a spatial smoothing variable to the regression models. This would spatially smooth the esti-mates and adjust for spatial correlation, providing the ability to reduce the residuals, which would result in smaller prediction errors and ulti-mately improve model fits.
For the quantitative analyses in this monograph, we focused on attacks in the city of Jerusalem. Further analyses could make use of attack data not only from all four cities, Jerusalem, Haifa, Netanya, and Tel Aviv, but also data on suicide bombing attacks beyond these cities. Furthermore, analyses could model other types of terrorism, such as shooting attacks and nonsuicide bomb attacks.
Sociocultural Precipitants
We specified the relevant time window for sociocultural precipitants a priori, rather than using an infinite time window or developing a set of models to pinpoint the most optimal or influential time window of influence. Future analytic efforts could focus on taking a more-flexible approach to the proximity of sociocultural precipitants to attacks in time and could also consider additional precipitants.
Furthermore, future analyses could take a “neighborhood free” time series approach to all suicide bombing attacks in the region (or even nonsuicide terrorism) to determine how sociocultural precipitants influence terrorism more broadly.
Finally, future analyses could take a more-nuanced approach to linking sociocultural precipitants to types of neighborhoods. For exam-ple, one could hypothesize that Jewish religious holidays would be a more relevant precipitant for heavily religious neighborhoods, where
xxii Predicting Suicide Attacks
the target population will congregate in greater numbers to prepare for and observe the holiday.
Transferability
The analysis in this report, and in other NRL and University of Okla-homa research, is limited to preferences of Palestinian suicide bombers in Israel. There is some evidence to suggest that there may be a great deal of similarity between attacked sites in Israel and elsewhere. In brief, the suicide bombings in Israel took place during open hostilities between Israel and Palestinians, and the Palestinian terrorist organi-zations have long espoused ideologies that glorify suicide operations. Neither condition is likely to apply to plots in the United States and other Western countries. Therefore, we believe that directly transfer-ring the target preference results from Israel to other countries has lim-ited value.
However, the methods used to assess target preferences in Israel could be transferred to the United States and other countries. Qualita-tive data analysis can be applied directly to data for the United States and other countries; the quantitative techniques need to be restructured slightly, but the underlying methods and theory will still apply. We rec-ommend applying the methods that NRL, RAND, and the University of Oklahoma have developed to targeted sites in the United States and other Western countries. Results, if proven to be robust, could be used to develop recommendations for heightened public awareness or pre-paredness drills in certain areas.

xxiii
Acknowledgments
The authors wish to thank the geospatial research team at the Naval Research laboratory for their assistance in providing access to the data needed to conduct this study and for their technical support. In par-ticular, we express our gratitude to Ruth Willis, Director of the NRL suicide bomber research project, and project manager Brian Sandberg. Others on the team who provided guidance and assistance include Joel Alejandre, Carol Chang, and Paul Levy. We also wish to recog-nize the contributions of May Yuan at the University of Oklahoma. Finally, the authors wish to thank Greg Ridgeway and Nigel Waters for their thoughtful review of this work. Their comments and suggestions greatly strengthened the monograph.


xxv
Abbreviations
AIC Akaike’s information criterion
CART classification and regression trees
EVIL DONE exposed, vital, iconic, legitimate, destructible, occupied, near, easy
IDF Israeli Defense Forces
NRL Naval Research Laboratory
PA Palestinian Authority
PCA principal components analysis
SES socioeconomic status

1
ChAPter One
Introduction and Overview
The threat of suicide bombings in the United States and elsewhere prompted the Department of Homeland Security to commission the Naval Research Laboratory (NRL) to develop a method for predict-ing the determinants of suicide bombing attacks. NRL chose to study suicide bombings in four Israeli cities: Jerusalem, Haifa, Tel Aviv, and Netanya during and after the Second Intifada (1993–2006). In addi-tion, NRL focused on three terrorist groups: Hamas, the Al-Aqsa Mar-tyrs’ Brigade, and the Palestinian Islamic Jihad. Because of Israel’s long struggle to combat suicide bombings, it possesses a larger data set suit-able for quantitative analysis than does the United States. A further rationale for using the Israeli data is that suicide bombers are more imitative than innovative.1 Hence, studying suicide bombing tactics in Israel has the potential to tell us quite a bit about such attacks in the United States and elsewhere.
Background
NRL designed a two-part study aimed at discovering the target pref-erences of terrorist groups for suicide attacks. The first part focused on examining spatial preference patterns: how the different terrorist groups develop target preferences and how these preference patterns can be transferred. The results of the first part of the study are docu-
1 This comment is attributable to Bruce Hoffman, a terrorism expert at Georgetown Uni-versity, as reported in Berrebi, 2007.
2 Predicting Suicide Attacks
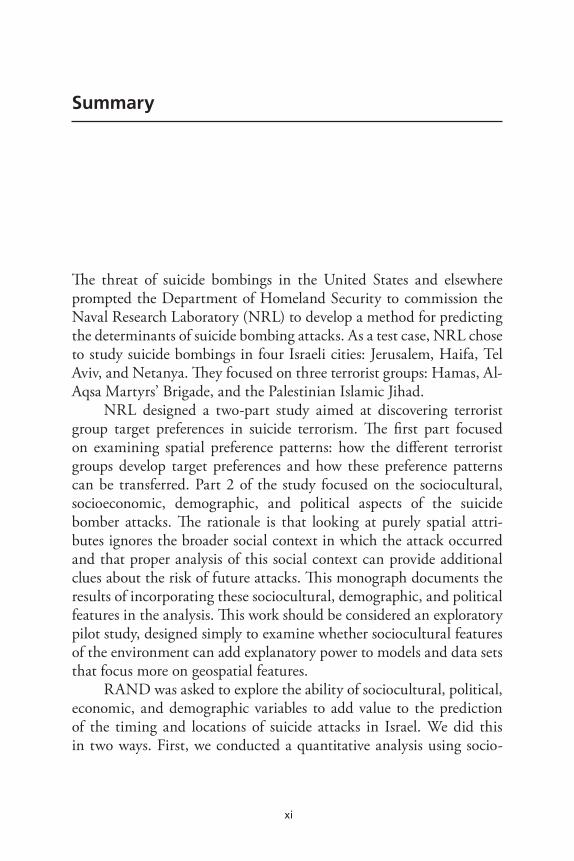
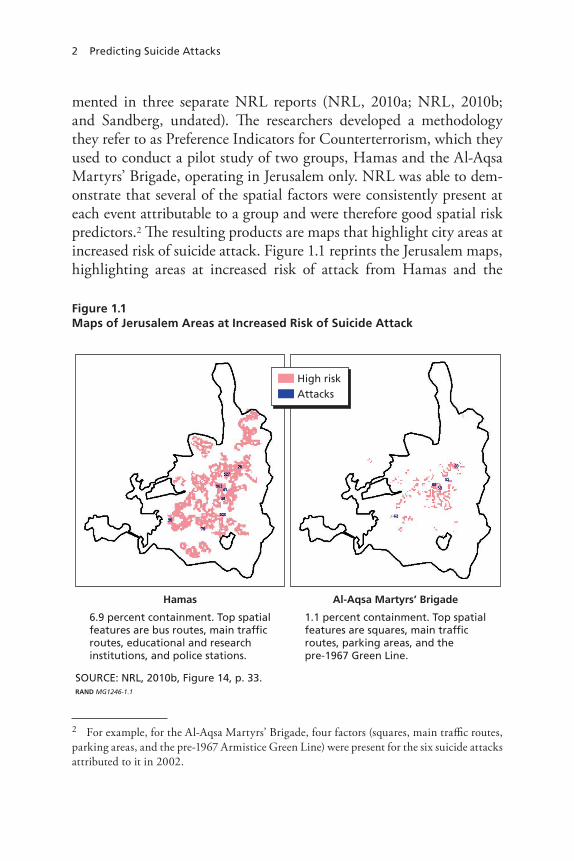
mented in three separate NRL reports (NRL, 2010a; NRL, 2010b; and Sandberg, undated). The researchers developed a methodology they refer to as Preference Indicators for Counterterrorism, which they used to conduct a pilot study of two groups, Hamas and the Al-Aqsa Martyrs’ Brigade, operating in Jerusalem only. NRL was able to dem-onstrate that several of the spatial factors were consistently present at each event attributable to a group and were therefore good spatial risk predictors.2 The resulting products are maps that highlight city areas at increased risk of suicide attack. Figure 1.1 reprints the Jerusalem maps, highlighting areas at increased risk of attack from Hamas and the
2 For example, for the Al-Aqsa Martyrs’ Brigade, four factors (squares, main traffic routes, parking areas, and the pre-1967 Armistice Green Line) were present for the six suicide attacks attributed to it in 2002.
Figure 1.1Maps of Jerusalem Areas at Increased Risk of Suicide Attack
SOURCE: NRL, 2010b, Figure 14, p. 33.RAND MG1246-1.1
6.9 percent containment. Top spatialfeatures are bus routes, main trafficroutes, educational and researchinstitutions, and police stations.
1.1 percent containment. Top spatialfeatures are squares, main trafficroutes, parking areas, and thepre-1967 Green Line.
High riskAttacks
Hamas Al-Aqsa Martyrs’ Brigade

Introduction and Overview 3
Al-Aqsa Martyrs’ Brigade, respectively. The shaded areas have increased risk. The maps also reveal suicide bombing locations, and these are consistently inside the shaded areas. Shaded areas without attacks are areas at possible risk of future attack, given their geospatial characteris-tics. The figure also shows the types of geospatial features that were the strongest contributors to the predictive models.
Part 2 of the study focused on the, socioeconomic, demographic, and political aspects of the suicide bomber attacks. This analysis drew from the planning, strategic and operational, and advertising efforts of terrorist organizations themselves, as well as detailed data about the characteristics of neighborhoods that have been targeted or hit with suicide bombing attacks. The rationale here was that looking at purely spatial attributes ignores the broader social context in which the attack occurred and that proper analysis of this social context could provide additional clues about the risk of future attacks. In the conclusions of its report on the pilot study, NRL offers this reasoning for examining the predictive value of non-geospatial factors:
While different Palestinian factions may have similar strategic objectives, they each have unique tactical objectives and distinc-tive cultural and social preferences. In fact, these factions are often fierce rivals and hold different ideological positions with regard to the role of religion and politics. (NRL, 2010a, p. 39)
This monograph documents the results of incorporating these socioeconomic, demographic, and political features in the analysis. The work should be considered exploratory because the time involved in and the difficulty of obtaining sociocultural data limited the final data set. Future analytic efforts could augment this data set, and Chap-ter Five describes potential future directions for data collection and analysis. Nevertheless, as we will show later, there is compelling evi-dence that sociocultural analysis improves the prediction of risk for suicide bombing attacks. When coupled with the geospatial predictors, the combination provides a more-precise predictive tool that accounts more fully for the multitude of causal factors associated with suicide bombing attacks.
4 Predicting Suicide Attacks
The RAND Corporation’s task was to test the ability of socio-cultural, political, economic, and demographic variables to improve the ability to predict the locations of suicide attacks. We tested this two ways. We first conducted a quantitative analysis to model areas at increased risk using sociocultural variables and examined the value this information added to NRL’s geospatial predictive techniques. Second, we drilled down more deeply into qualitative data on known attack sites to identify specific types and attributes of locations that may put them at increased risk. The combination of geospatial and social pro-files of risk can ultimately be used to develop a reasonably short list of likely target sites, which can then be transferred to U.S. or other con-texts to aid in risk prediction and in targeting detection and prevention efforts.
For the quantitative analysis, following NRL’s lead, we focused on Jerusalem as a test case. NRL supplied the geospatial data, and the non-geospatial data came from various other sources (see Chapter Two).
For the qualitative analysis, we assessed the types and characteris-tics of suicide bombing locations for the four Israeli cities in the Suicide Terrorism Database: Jerusalem, Tel Aviv, Haifa, and Netanya.
About This Report
Chapter Two describes the methodologies and data for the quantitative sociocultural analysis. Chapter Three describes the results of the quan-titative assessments. Chapter Four discusses the methodologies, data, and results for the qualitative assessments analysis. Chapter Five sum-marizes conclusions and offers recommendations for further research. Appendix A describes the precipitant data collected to support the quantitative analyses and includes a compact disk with the data set used for the quantitative analyses. Appendix B records the results of the logistic regressions used to support the analysis in Chapter Two.

5
ChAPter twO
Quantitative Data and Methods
We took a three-stage approach to the quantitative analysis of socio-cultural data to augment the geospatial prediction of suicide bombing targeting. First, we used socioeconomic, demographic, and political data at the neighborhood level to examine neighborhood characteris-tics associated with the likelihood of attack. We used principal com-ponents analysis (PCA) to reduce data dimensions and logistic regres-sion to model the likelihood of attack by neighborhood (Abdi and Williams, 2010; Pearson, 1901). Second, we used classification and regression trees (CART) (Brieman et al., 1984; Gruenewald et al., 2006; Therneau, Atkinson, and Ripley, 2008) to model higher-order combi-nations of variables associated with high-risk neighborhoods, produc-ing profiles of neighborhoods at high and low risk. Third, we used negative binomial regression to analyze the association of sociocultural precipitants—events hypothesized to increase the number of suicide bombing attacks and the probability of attack by neighborhood over time.
Quantitative Data
This section details the data we analyzed. The Israeli Central Bureau of Statistics has defined statistical areas we refer to as neighborhoods and use as the unit of analysis for determining the most likely targets for terror attacks. Data for all variables of our analysis exist for 113 of the neighborhoods, which have populations ranging from 1,965 to
6 Predicting Suicide Attacks
194,420. The median population is 3,430, and only one neighborhood has a population greater than 7,000.
Socioeconomic Characteristics
Although socioeconomic status and poverty are neither root causes of terrorism (Atran, 2004) nor good predictors of which Palestinians become suicide bombers (Berrebi, 2007), it is possible that the socio-economic characteristics of Israeli neighborhoods make them more or less attractive as suicide bombing targets. For example, low socio-economic status (SES) neighborhoods might be attractive because of the population density associated with such neighborhoods. Suicide bombers and planners might be attracted to high SES neighborhoods because of their symbolic relationship with relative Israeli prosperity.
The Israeli census collects detailed socioeconomic information by statistical areas that are roughly the size and population of a U.S. census tract. The Israeli Central Bureau of Statistics collects multiple socioeconomic indicators (average income, high school graduation rate, unemployment, housing density, etc.) for every neighborhood in Israel. We used the 1995 Central Bureau of Statistics data on the following individual SES variables (the full set available to us) in a PCA1:
• housing density• average persons per household• percentage of households with a computer• average motor vehicles per household• average income per capita• percentage of households with a holder of an academic degree• average years of schooling for those aged 26–50• percentage aged 17–20 holding a high school degree• percentage of unemployed persons• percentage of women not in the civilian labor force• percentage of workers in prestigious occupations• percentage of sub–minimum wage earners.
1 A few variables whose values did not make logical sense were omitted (e.g., variables that are percentages when numerous neighborhoods exceeded 100 percent or were negative).
Quantitative Data and Methods 7
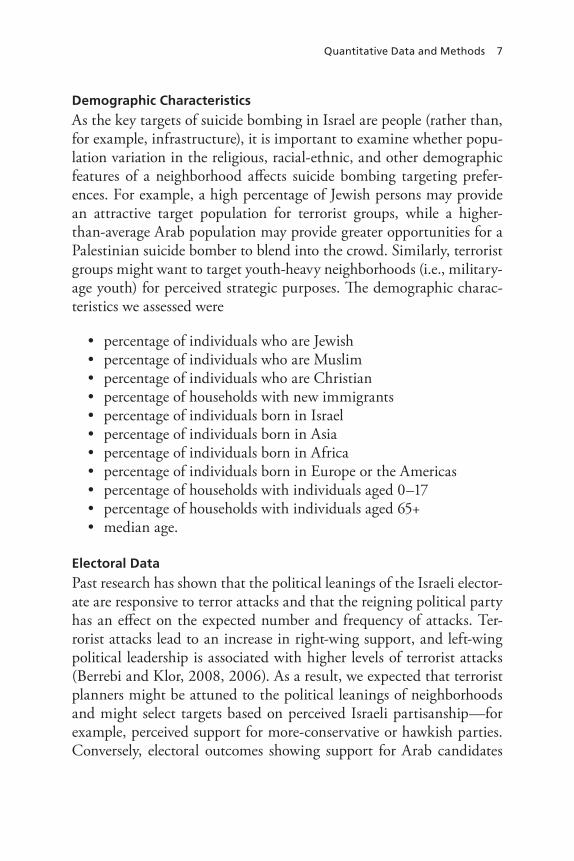
Demographic Characteristics
As the key targets of suicide bombing in Israel are people (rather than, for example, infrastructure), it is important to examine whether popu-lation variation in the religious, racial-ethnic, and other demographic features of a neighborhood affects suicide bombing targeting prefer-ences. For example, a high percentage of Jewish persons may provide an attractive target population for terrorist groups, while a higher-than-average Arab population may provide greater opportunities for a Palestinian suicide bomber to blend into the crowd. Similarly, terrorist groups might want to target youth-heavy neighborhoods (i.e., military-age youth) for perceived strategic purposes. The demographic charac-teristics we assessed were
• percentage of individuals who are Jewish• percentage of individuals who are Muslim• percentage of individuals who are Christian• percentage of households with new immigrants• percentage of individuals born in Israel• percentage of individuals born in Asia• percentage of individuals born in Africa• percentage of individuals born in Europe or the Americas• percentage of households with individuals aged 0–17• percentage of households with individuals aged 65+• median age.
Electoral Data
Past research has shown that the political leanings of the Israeli elector-ate are responsive to terror attacks and that the reigning political party has an effect on the expected number and frequency of attacks. Ter-rorist attacks lead to an increase in right-wing support, and left-wing political leadership is associated with higher levels of terrorist attacks (Berrebi and Klor, 2008, 2006). As a result, we expected that terrorist planners might be attuned to the political leanings of neighborhoods and might select targets based on perceived Israeli partisanship—for example, perceived support for more-conservative or hawkish parties. Conversely, electoral outcomes showing support for Arab candidates
8 Predicting Suicide Attacks
might indicate areas or neighborhoods that terrorists are less likely to target.
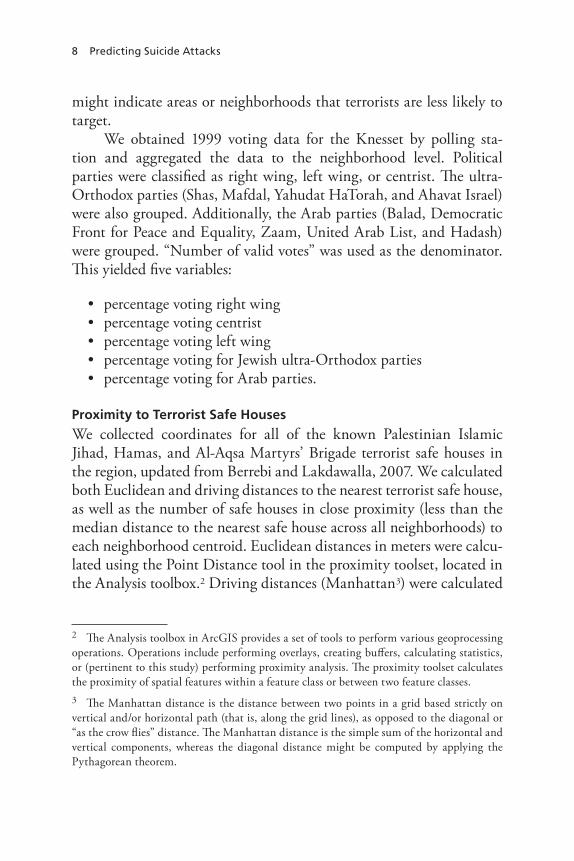
We obtained 1999 voting data for the Knesset by polling sta-tion and aggregated the data to the neighborhood level. Political parties were classified as right wing, left wing, or centrist. The ultra- Orthodox parties (Shas, Mafdal, Yahudat HaTorah, and Ahavat Israel) were also grouped. Additionally, the Arab parties (Balad, Democratic Front for Peace and Equality, Zaam, United Arab List, and Hadash) were grouped. “Number of valid votes” was used as the denominator. This yielded five variables:
• percentage voting right wing• percentage voting centrist• percentage voting left wing• percentage voting for Jewish ultra-Orthodox parties• percentage voting for Arab parties.
Proximity to Terrorist Safe Houses
We collected coordinates for all of the known Palestinian Islamic Jihad, Hamas, and Al-Aqsa Martyrs’ Brigade terrorist safe houses in the region, updated from Berrebi and Lakdawalla, 2007. We calculated both Euclidean and driving distances to the nearest terrorist safe house, as well as the number of safe houses in close proximity (less than the median distance to the nearest safe house across all neighborhoods) to each neighborhood centroid. Euclidean distances in meters were calcu-lated using the Point Distance tool in the proximity toolset, located in the Analysis toolbox.2 Driving distances (Manhattan3) were calculated
2 The Analysis toolbox in ArcGIS provides a set of tools to perform various geoprocessing operations. Operations include performing overlays, creating buffers, calculating statistics, or (pertinent to this study) performing proximity analysis. The proximity toolset calculates the proximity of spatial features within a feature class or between two feature classes.3 The Manhattan distance is the distance between two points in a grid based strictly on vertical and/or horizontal path (that is, along the grid lines), as opposed to the diagonal or “as the crow flies” distance. The Manhattan distance is the simple sum of the horizontal and vertical components, whereas the diagonal distance might be computed by applying the Pythagorean theorem.
Quantitative Data and Methods 9
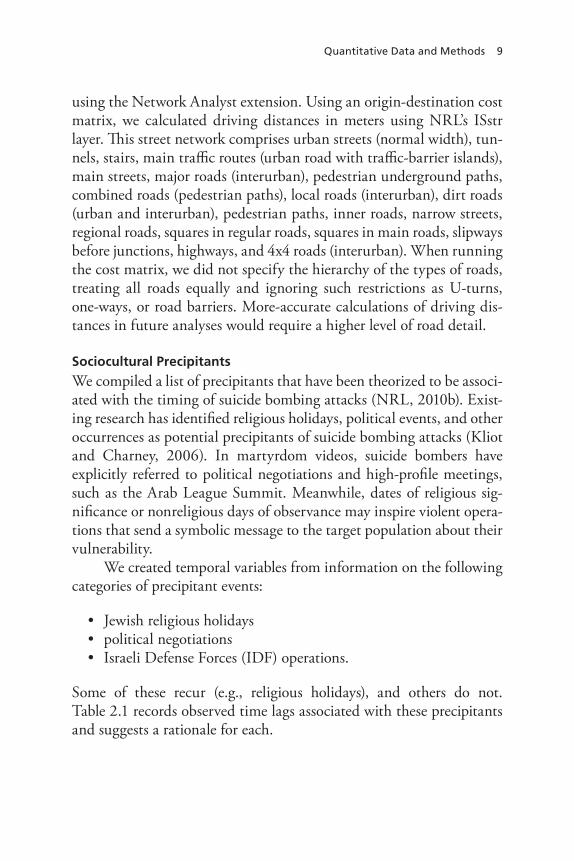
using the Network Analyst extension. Using an origin-destination cost matrix, we calculated driving distances in meters using NRL’s ISstr layer. This street network comprises urban streets (normal width), tun-nels, stairs, main traffic routes (urban road with traffic-barrier islands), main streets, major roads (interurban), pedestrian underground paths, combined roads (pedestrian paths), local roads (interurban), dirt roads (urban and interurban), pedestrian paths, inner roads, narrow streets, regional roads, squares in regular roads, squares in main roads, slipways before junctions, highways, and 4x4 roads (interurban). When running the cost matrix, we did not specify the hierarchy of the types of roads, treating all roads equally and ignoring such restrictions as U-turns, one-ways, or road barriers. More-accurate calculations of driving dis-tances in future analyses would require a higher level of road detail.
Sociocultural Precipitants
We compiled a list of precipitants that have been theorized to be associ-ated with the timing of suicide bombing attacks (NRL, 2010b). Exist-ing research has identified religious holidays, political events, and other occurrences as potential precipitants of suicide bombing attacks (Kliot and Charney, 2006). In martyrdom videos, suicide bombers have explicitly referred to political negotiations and high-profile meetings, such as the Arab League Summit. Meanwhile, dates of religious sig-nificance or nonreligious days of observance may inspire violent opera-tions that send a symbolic message to the target population about their vulnerability.
We created temporal variables from information on the following categories of precipitant events:
• Jewish religious holidays• political negotiations• Israeli Defense Forces (IDF) operations.
Some of these recur (e.g., religious holidays), and others do not. Table 2.1 records observed time lags associated with these precipitants and suggests a rationale for each.

10 Predicting Suicide Attacks
Jewish Religious Holidays
Jewish holidays include the Yamim Nora’im [Days of Awe] (Rosh Hashanah and Yom Kippur) and the more communal celebrations of Purim, Passover, Sukkot, and Hanukkah. We included Tisha B’Av and Simchat Torah/Shemini Atzeret as well, in addition to several observed days of Sabbath, a weekly observance that lasts for 25 hours every Friday evening through Saturday night. The analysis excluded the rela-tively minor Jewish holidays that are not typically afforded the same degree of observance as the holidays we did include. For example, Tu Bishevat and the monthly Rosh Chodesh [New Month] observances are relatively minor and thus are not in the analysis. For Jewish reli-gious holidays, a temporal variable was assigned if the attack took place on the holiday itself or on the day prior (when individuals gather to prepare for the holiday).
Political Negotiations
The political negotiations included in the timeline are both Israeli- Palestinian negotiations and negotiations with extraregional involve-ment. Low-level or routine talks between Palestinian and Israeli offi-cials were excluded. For political negotiations, which are highly publi-cized, a temporal variable was assigned if the attack took place in the
Table 2.1Precipitants, Associated Time Lags, and Rationale
Precipitant Event Characteristics Time Lag Rationale
Jewish religious holidays
• Population clustering
• Symbolic importance
1 day prior eve of preparation
Political negotiations
• Perception of defeat
• terrorist “need” for conflict
• Martyrdom videos
1 week prior to 1 week after
Accounts for• Build-up
period• enduring
effect
IDF operations • Casualties in territories
• trauma and anger• revenge for tar-
geted killings
Up to 2 weeks following the event
each day of the operation produces cumulative effect
Quantitative Data and Methods 11
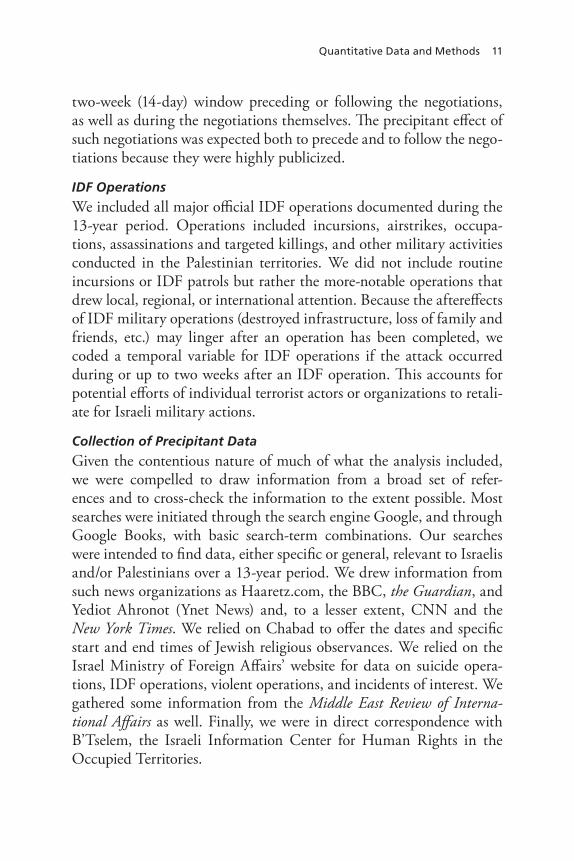
two-week (14-day) window preceding or following the negotiations, as well as during the negotiations themselves. The precipitant effect of such negotiations was expected both to precede and to follow the nego-tiations because they were highly publicized.
IDF Operations
We included all major official IDF operations documented during the 13-year period. Operations included incursions, airstrikes, occupa-tions, assassinations and targeted killings, and other military activities conducted in the Palestinian territories. We did not include routine incursions or IDF patrols but rather the more-notable operations that drew local, regional, or international attention. Because the aftereffects of IDF military operations (destroyed infrastructure, loss of family and friends, etc.) may linger after an operation has been completed, we coded a temporal variable for IDF operations if the attack occurred during or up to two weeks after an IDF operation. This accounts for potential efforts of individual terrorist actors or organizations to retali-ate for Israeli military actions.
Collection of Precipitant Data
Given the contentious nature of much of what the analysis included, we were compelled to draw information from a broad set of refer-ences and to cross-check the information to the extent possible. Most searches were initiated through the search engine Google, and through Google Books, with basic search-term combinations. Our searches were intended to find data, either specific or general, relevant to Israelis and/or Palestinians over a 13-year period. We drew information from such news organizations as Haaretz.com, the BBC, the Guardian, and Yediot Ahronot (Ynet News) and, to a lesser extent, CNN and the New York Times. We relied on Chabad to offer the dates and specific start and end times of Jewish religious observances. We relied on the Israel Ministry of Foreign Affairs’ website for data on suicide opera-tions, IDF operations, violent operations, and incidents of interest. We gathered some information from the Middle East Review of Interna-tional Affairs as well. Finally, we were in direct correspondence with B’Tselem, the Israeli Information Center for Human Rights in the Occupied Territories.
12 Predicting Suicide Attacks
Principal Component Analysis and Logistic Regression
A predictive approach to suicide bombing site analysis must do more than describe the patterns in known suicide bombing attempts; it also must include the locations of “nonevents”—areas that were either not selected for or were not successfully targeted with suicide bombing attacks. Jerusalem neighborhood data are used in health and criminol-ogy to predict outcomes (Browning, Cagney, and Wen, 2003; Samp-son, Morenoff, and Gannon-Rowley, 2002). For each neighborhood, we used PCA to derive indices in the socioeconomic, demographic, and political domains. These indices represent linear combinations of variables in each domain. Using the neighborhood as the unit of analy-sis, we ran regression analyses using the PCA output (as the indepen-dent variable). These regressions allowed us to estimate the likelihood of Jerusalem neighborhoods’ being attacked based on their socioeco-nomic, demographic, and political characteristics and to test whether the additional dimensions are relevant to predicting an attack beyond the utility of geospatial predictors.
We also performed a PCA using all variables, across the three domains, and used these indices in a regression. Defining a meaning-ful construct for these components was difficult since they comprise variables crossing many domains. However, one component represents the entire sociocultural domain and can still be used as a predicting variable.
The analyses took a cross-sectional approach, with the key out-come (dependent) variable being whether or not a neighborhood was attacked over the 13-year time span under consideration (1994–2007). To perform the PCAs, we used the prcomp routine in the “stats” pack-age of the R statistical software (R Development Core Team, 2011). We also used the R computing environment for the logistic regressions (R Development Core Team, 2011).
Logistic Regression
The probability of attack is a Bernoulli variable and can take the value 1 with a probability of attack q, or the value 0 with probability of no attack 1 – q. The relationship between the predictor and response vari-ables is based on the logistic regression function
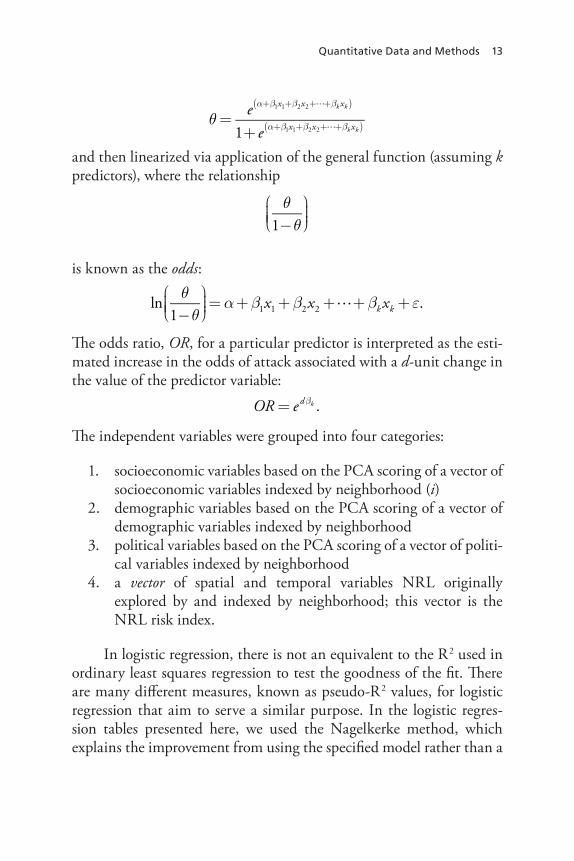
Quantitative Data and Methods 13
and then linearized via application of the general function (assuming k predictors), where the relationship
is known as the odds:
The odds ratio, OR, for a particular predictor is interpreted as the esti-mated increase in the odds of attack associated with a d-unit change in the value of the predictor variable:
The independent variables were grouped into four categories:
1. socioeconomic variables based on the PCA scoring of a vector of socioeconomic variables indexed by neighborhood (i)
2. demographic variables based on the PCA scoring of a vector of demographic variables indexed by neighborhood
3. political variables based on the PCA scoring of a vector of politi-cal variables indexed by neighborhood
4. a vector of spatial and temporal variables NRL originally explored by and indexed by neighborhood; this vector is the NRL risk index.
In logistic regression, there is not an equivalent to the R2 used in ordinary least squares regression to test the goodness of the fit. There are many different measures, known as pseudo-R2 values, for logistic regression that aim to serve a similar purpose. In the logistic regres-sion tables presented here, we used the Nagelkerke method, which explains the improvement from using the specified model rather than a
θ=e α+β1x1+β2x2++βk xk( )
1+ e α+β1x1+β2x2++βk xk( )
θ1−θ⎛⎝⎜⎜⎜
⎞⎠⎟⎟⎟
ln θ1−θ⎛⎝⎜⎜⎜
⎞⎠⎟⎟⎟=α+β1x1+β2x2++βk xk +ε.
OR = e dβk .

14 Predicting Suicide Attacks
model with just the intercept (the null model). This method calculates pseudo-R2 as follows:
where L(Mnull ) is the likelihood of the null model, L(Mspecified ) is the likelihood of the specified (full) model, and N is the number of obser-vations. The pseudo-R2 values aim to help us understand how much of the variance is accounted for by the predictors.
In addition to examining the fit based upon variance, we also looked at the false negative and false positive rates. We define a false positive as a neighborhood without an attack that has a predicted prob-ability above the 75th percentile and a false negative as a neighbor-hood that has been attacked yet has a predicted probability below the 75th percentile. A false negative (predicting no attack when an attack occurred) is a worse offense than a false positive (predicting an attack when no attack occurred). With a false positive, a neighborhood might be at high risk for an attack yet not have previously been attacked. Additionally, the cost of an attack is very high, so we want to be able to account for as many actual attacks as possible.
Two main statistics are used to compare across models and to select models: (1) Akaike’s information criterion (AIC) and (2) the Bayesian information criterion. We used the AIC, since the Bayesian information criterion is generally better for large sample sizes and a small number of predictors. A small AIC is preferred, meaning that a model with a smaller AIC is a better fit for the data or that, among a set of models, the model having the minimum AIC is the best.
Dimension Reduction
Because the number of original socioeconomic, demographic, and political variables was large and the number of observations (attacks) relatively small, we faced a degrees-of-freedom problem requiring the application of a dimension-reduction technique. We used PCA to build
R 2 =
1− L(Mnull )L(Mspecified )
⎧⎨⎪⎪
⎩⎪⎪
⎫⎬⎪⎪
⎭⎪⎪
2/N
1−L(Mnull )2/N ,

Quantitative Data and Methods 15
composite indices that summarize dimensions of the socioeconomic, demographic, and political variables. We retained the indices (prin-cipal components) that explained the most variance within the data, specifically where the eigenvalues were greater than one (Kaiser, 1960). We then used these indices as independent variables in logistic regres-sions for each domain and combined across the socioeconomic, demo-graphic, and political domains.
To test the value of adding sociocultural data to geospatial data in suicide bombing target site prediction, we obtained the maximum risk assessment score from individual neighborhoods, based on the NRL geospatial campaign model for Jerusalem (NRL, 2010a). We then used logistic regression to model the association between maximum geospa-tial risk assessment scores and neighborhood risk of attack. Since the NRL risk assessment scores were created using attack data, we expected the NRL risk assessment scores to be a significant predictor of attacks.
Classification and Regression Trees
While regression analyses produce coefficients that describe the gradi-ent of association between characteristics of neighborhoods and attack risks, they are less adept at describing the particular combinations (i.e., higher-order interactions) of individual social, demographic, and polit-ical variables that are associated with high neighborhood risk. One way to specify combinations of these variables, which together are associ-ated with high (or low) risk of attack, is to use a classification tree—a common data-mining technique—to predict the odds of a neighbor-hood being attacked or not attacked. Classification trees are particu-larly adept at handling “wide” data—that is, many independent vari-ables—and also make no assumptions regarding the distribution or intercorrelation of these variables. As a result, CART is ideal for syn-thesizing data from multiple domains, including highly correlated vari-ables, and factors on different levels (e.g., spatial and social). Addition-ally, CART can handle different types of data and is robust to outliers, and the classification has a simple form. Ultimately, classification trees produce profiles of neighborhoods with low, medium, and high risk of

16 Predicting Suicide Attacks
attack based on combinations of certain values of neighborhood char-acteristics. These profiles are particularly useful for planning purposes because they can be used to characterize groups of neighborhoods at potential risk of future attack.
While CART has many advantages, it also has drawbacks. Most notably, the trees produced can be unstable, and small changes in the sample can significantly alter the structure. Secondly, it is possible to have different structures produce the same outcome. And even though each split of the tree is optimal, the tree might not be globally optimal. To mitigate some of these issues, we later show an example tree but also perform a random forest analysis (Liaw and Wiener, 2002). The random forest analysis creates many trees and introduces randomness into the structures that is able to provide a profile of the most influen-tial variables. Both the CART and random forest analyses were per-formed using the statistical computing software R (R Development Core Team, 2011). For CART, we used the “rpart” package (Therneau and Atkinson, 2011); for the random forests, we used the “randomFor-est” package (Liaw and Wiener, 2002).
Sociocultural Precipitants Analysis
We also tested whether certain events in time cause an overall increase in the risk of suicide bombing attacks occurring, regardless of the spe-cific neighborhood in which attacks occur. These are events that have been theorized to be precipitants of suicide bombing attacks—events that cause terrorist groups to respond with an increased frequency and intensity of suicide bombing efforts against Israel (NRL, 2010b). As with logistic regression and CART analyses, we used suicide bomb-ing events in Jerusalem as a test case for precipitant analysis. To make full use of data on suicide bombing frequency, we employed a negative binomial regression to describe the association between the presence of
Quantitative Data and Methods 17
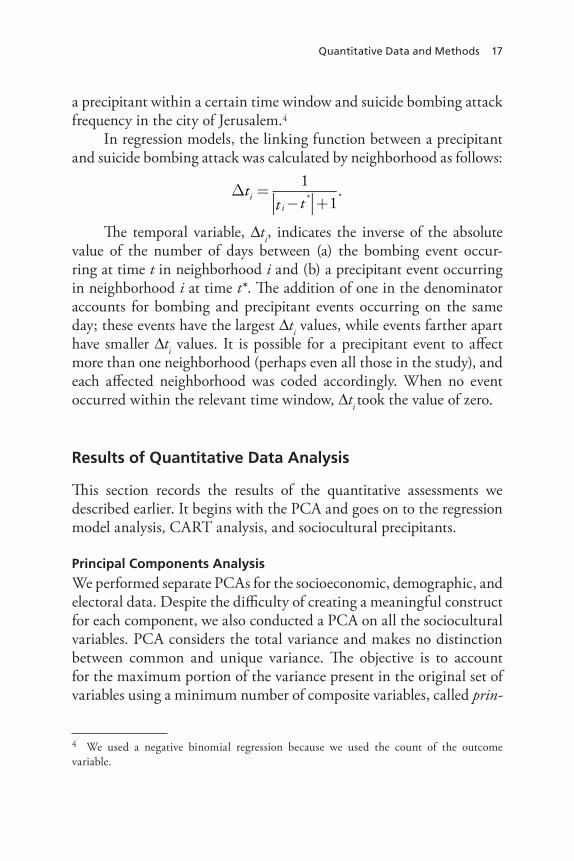
a precipitant within a certain time window and suicide bombing attack frequency in the city of Jerusalem.4
In regression models, the linking function between a precipitant and suicide bombing attack was calculated by neighborhood as follows:
The temporal variable, ∆ti, indicates the inverse of the absolute value of the number of days between (a) the bombing event occur-ring at time t in neighborhood i and (b) a precipitant event occurring in neighborhood i at time t*. The addition of one in the denominator accounts for bombing and precipitant events occurring on the same day; these events have the largest ∆ti values, while events farther apart have smaller ∆ti values. It is possible for a precipitant event to affect more than one neighborhood (perhaps even all those in the study), and each affected neighborhood was coded accordingly. When no event occurred within the relevant time window, ∆ti took the value of zero.
Results of Quantitative Data Analysis
This section records the results of the quantitative assessments we described earlier. It begins with the PCA and goes on to the regression model analysis, CART analysis, and sociocultural precipitants.
Principal Components Analysis
We performed separate PCAs for the socioeconomic, demographic, and electoral data. Despite the difficulty of creating a meaningful construct for each component, we also conducted a PCA on all the sociocultural variables. PCA considers the total variance and makes no distinction between common and unique variance. The objective is to account for the maximum portion of the variance present in the original set of variables using a minimum number of composite variables, called prin-
4 We used a negative binomial regression because we used the count of the outcome variable.
Δti =1
it −t * +1.
18 Predicting Suicide Attacks
cipal components. While multiple heuristic and statistical methods exist to determine the relevant number of principal components to retain, we used the Kaiser Rule (Kaiser, 1960). Throughout the analysis, we considered components that had eigenvalues greater than one, which approximately corresponds to each component contributing to at least 10 percent of the variance and a cumulative proportion of variance that is about 80 percent. To aid in the interpretation of the retained principal components, we examined the loadings or coefficients of all variables and used the magnitudes and directionality of the variables to identify a construct that best represented the principal component (e.g., low-income or nonimmigrant).
Socioeconomic PCA
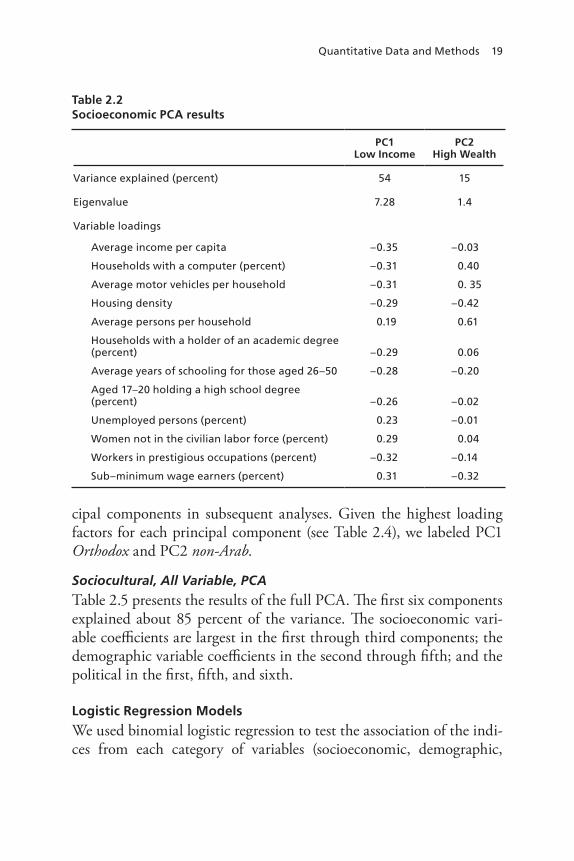
A PCA of socioeconomic data yielded a first principal component that explained 54 percent of the variance and a second one that explained an additional 15. These two scales explained 73 percent of the total variance, and we considered only these two socioeconomic principal components in subsequent analyses. Given the highest loading vari-ables for each principal component (see Table 2.2), we named PC1 low income and PC2 high wealth.
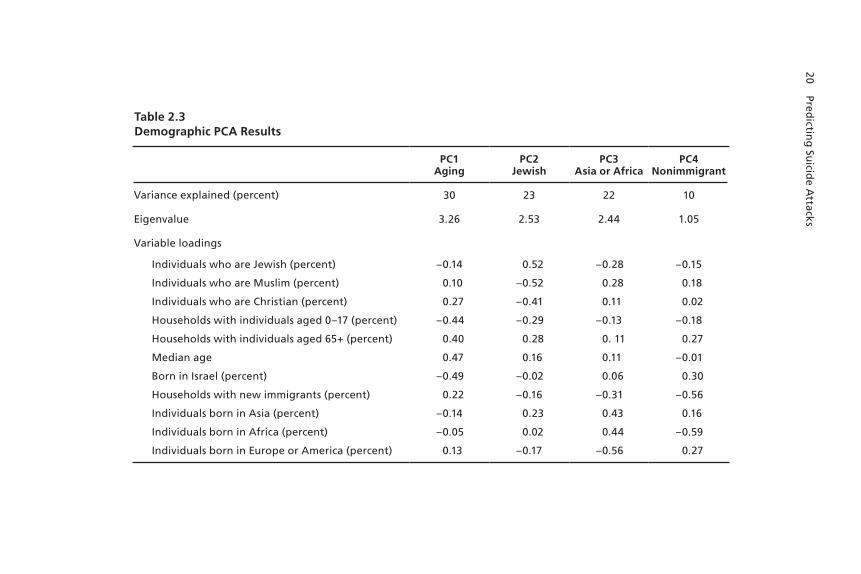
Demographic PCA
A PCA of demographic data yielded a first principal component that explained 30 percent of the variance, a second that explained an addi-tional 23 percent, a third that explained an additional 22 percent, and a fourth explaining an additional 10 percent of variance. Thus, the first four principal components explained 85 percent of the total variance, and we considered only these four demographic principal components in subsequent analyses. Given the highest loading variables for each principal component (see Table 2.3), we named PC1 aging, PC2 Jewish, PC3 Asia or Africa, and PC4 nonimmigrant.
Political PCA
A PCA of electoral data yielded a first principal component that explained 58 percent of the variance and a second that explained an additional 24. Thus, the first two factors explained 83 percent of the total variance, and we considered only these two socioeconomic prin-
Quantitative Data and Methods 19
cipal components in subsequent analyses. Given the highest loading factors for each principal component (see Table 2.4), we labeled PC1 Orthodox and PC2 non-Arab.
Sociocultural, All Variable, PCA
Table 2.5 presents the results of the full PCA. The first six components explained about 85 percent of the variance. The socioeconomic vari-able coefficients are largest in the first through third components; the demographic variable coefficients in the second through fifth; and the political in the first, fifth, and sixth.
Logistic Regression Models
We used binomial logistic regression to test the association of the indi-ces from each category of variables (socioeconomic, demographic,
Table 2.2Socioeconomic PCA results
PC1Low Income
PC2High Wealth
Variance explained (percent) 54 15
eigenvalue 7.28 1.4
Variable loadings
Average income per capita –0.35 –0.03
households with a computer (percent) –0.31 0.40
Average motor vehicles per household –0.31 0. 35
housing density –0.29 –0.42
Average persons per household 0.19 0.61
households with a holder of an academic degree (percent) –0.29 0.06
Average years of schooling for those aged 26–50 –0.28 –0.20
Aged 17–20 holding a high school degree (percent) –0.26 –0.02
Unemployed persons (percent) 0.23 –0.01
women not in the civilian labor force (percent) 0.29 0.04
workers in prestigious occupations (percent) –0.32 –0.14
Sub–minimum wage earners (percent) 0.31 –0.32
20 Predictin
g Su
icide A
ttacks
Table 2.3Demographic PCA Results
PC1Aging
PC2Jewish
PC3Asia or Africa
PC4Nonimmigrant
Variance explained (percent) 30 23 22 10
eigenvalue 3.26 2.53 2.44 1.05
Variable loadings
Individuals who are Jewish (percent) –0.14 0.52 –0.28 –0.15
Individuals who are Muslim (percent) 0.10 –0.52 0.28 0.18
Individuals who are Christian (percent) 0.27 –0.41 0.11 0.02
households with individuals aged 0–17 (percent) –0.44 –0.29 –0.13 –0.18
households with individuals aged 65+ (percent) 0.40 0.28 0. 11 0.27
Median age 0.47 0.16 0.11 –0.01
Born in Israel (percent) –0.49 –0.02 0.06 0.30
households with new immigrants (percent) 0.22 –0.16 –0.31 –0.56
Individuals born in Asia (percent) –0.14 0.23 0.43 0.16
Individuals born in Africa (percent) –0.05 0.02 0.44 –0.59
Individuals born in europe or America (percent) 0.13 –0.17 –0.56 0.27
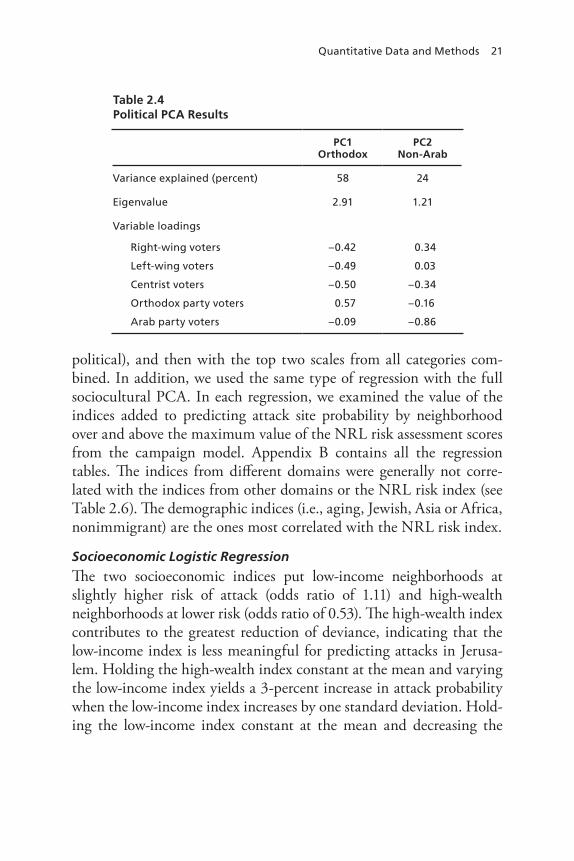
Quantitative Data and Methods 21
political), and then with the top two scales from all categories com-bined. In addition, we used the same type of regression with the full sociocultural PCA. In each regression, we examined the value of the indices added to predicting attack site probability by neighborhood over and above the maximum value of the NRL risk assessment scores from the campaign model. Appendix B contains all the regression tables. The indices from different domains were generally not corre-lated with the indices from other domains or the NRL risk index (see Table 2.6). The demographic indices (i.e., aging, Jewish, Asia or Africa, nonimmigrant) are the ones most correlated with the NRL risk index.
Socioeconomic Logistic Regression
The two socioeconomic indices put low-income neighborhoods at slightly higher risk of attack (odds ratio of 1.11) and high-wealth neighborhoods at lower risk (odds ratio of 0.53). The high-wealth index contributes to the greatest reduction of deviance, indicating that the low-income index is less meaningful for predicting attacks in Jerusa-lem. Holding the high-wealth index constant at the mean and varying the low-income index yields a 3-percent increase in attack probability when the low-income index increases by one standard deviation. Hold-ing the low-income index constant at the mean and decreasing the
Table 2.4Political PCA Results
PC1Orthodox
PC2Non-Arab
Variance explained (percent) 58 24
eigenvalue 2.91 1.21
Variable loadings
right-wing voters –0.42 0.34
Left-wing voters –0.49 0.03
Centrist voters –0.50 –0.34
Orthodox party voters 0.57 –0.16
Arab party voters –0.09 –0.86
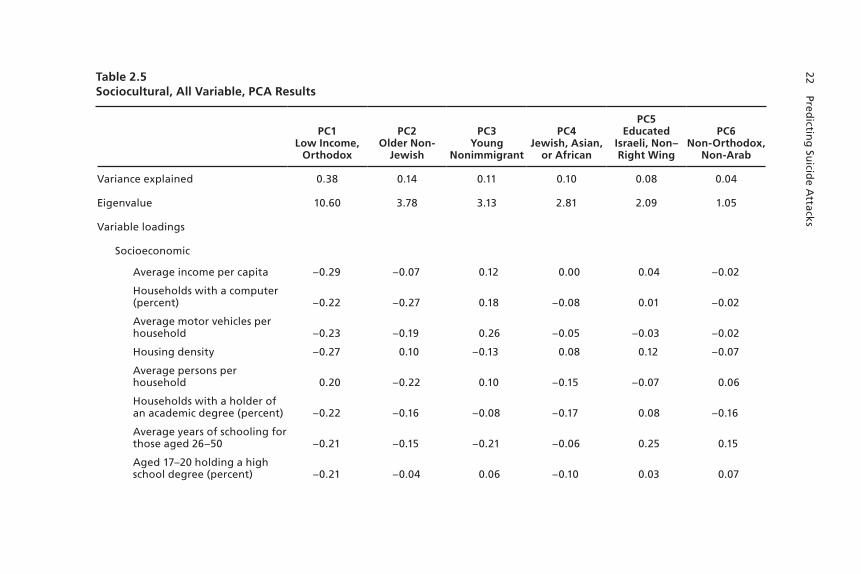
22 Predictin
g Su
icide A
ttacks
Table 2.5Sociocultural, All Variable, PCA Results
PC1Low Income,
Orthodox
PC2Older Non-
Jewish
PC3Young
Nonimmigrant
PC4Jewish, Asian,
or African
PC5Educated
Israeli, Non–Right Wing
PC6Non-Orthodox,
Non-Arab
Variance explained 0.38 0.14 0.11 0.10 0.08 0.04
eigenvalue 10.60 3.78 3.13 2.81 2.09 1.05
Variable loadings
Socioeconomic
Average income per capita –0.29 –0.07 0.12 0.00 0.04 –0.02
households with a computer (percent) –0.22 –0.27 0.18 –0.08 0.01 –0.02
Average motor vehicles per household –0.23 –0.19 0.26 –0.05 –0.03 –0.02
housing density –0.27 0.10 –0.13 0.08 0.12 –0.07
Average persons per household 0.20 –0.22 0.10 –0.15 –0.07 0.06
households with a holder of an academic degree (percent) –0.22 –0.16 –0.08 –0.17 0.08 –0.16
Average years of schooling for those aged 26–50 –0.21 –0.15 –0.21 –0.06 0.25 0.15
Aged 17–20 holding a high school degree (percent) –0.21 –0.04 0.06 –0.10 0.03 0.07
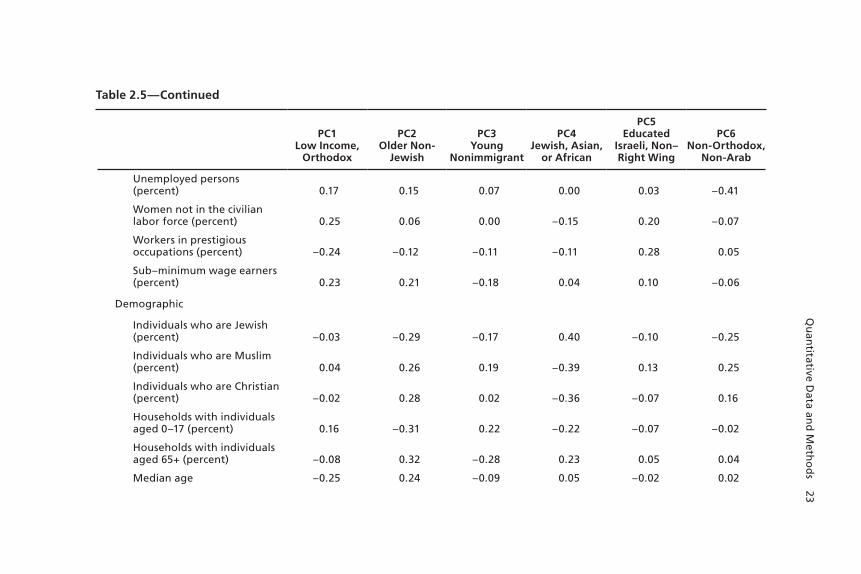
Qu
antitative D
ata and
Meth
od
s 23
PC1Low Income,
Orthodox
PC2Older Non-
Jewish
PC3Young
Nonimmigrant
PC4Jewish, Asian,
or African
PC5Educated
Israeli, Non–Right Wing
PC6Non-Orthodox,
Non-Arab
Unemployed persons (percent) 0.17 0.15 0.07 0.00 0.03 –0.41
women not in the civilian labor force (percent) 0.25 0.06 0.00 –0.15 0.20 –0.07
workers in prestigious occupations (percent) –0.24 –0.12 –0.11 –0.11 0.28 0.05
Sub–minimum wage earners (percent) 0.23 0.21 –0.18 0.04 0.10 –0.06
Demographic
Individuals who are Jewish (percent) –0.03 –0.29 –0.17 0.40 –0.10 –0.25
Individuals who are Muslim (percent) 0.04 0.26 0.19 –0.39 0.13 0.25
Individuals who are Christian (percent) –0.02 0.28 0.02 –0.36 –0.07 0.16
households with individuals aged 0–17 (percent) 0.16 –0.31 0.22 –0.22 –0.07 –0.02
households with individuals aged 65+ (percent) –0.08 0.32 –0.28 0.23 0.05 0.04
Median age –0.25 0.24 –0.09 0.05 –0.02 0.02
Table 2.5—Continued

24 Predictin
g Su
icide A
ttacks
PC1Low Income,
Orthodox
PC2Older Non-
Jewish
PC3Young
Nonimmigrant
PC4Jewish, Asian,
or African
PC5Educated
Israeli, Non–Right Wing
PC6Non-Orthodox,
Non-Arab
Individuals born in Israel (percent) 0.19 –0.22 0.17 0.08 0.29 –0.01
households with new immigrants (percent) –0.03 0.04 –0.16 –0.20 –0.56 –0.14
Individuals born in Asia (percent) 0.04 0.09 0.25 0.36 0.10 0.23
Individuals born in Africa (percent) –0.01 0.14 0.38 0.14 –0.07 0.04
Individuals born in europe or America (percent) –0.03 –0.15 –0.41 –0.33 –0.02 –0.18
Political
right-wing voters –0.17 0.10 0.16 0.03 –0.48 0.01
Left-wing voters –0.27 0.10 0.02 –0.02 0.20 0.03
Centrist voters –0.21 0.08 0.24 0.04 0.06 –0.49
Orthodox party voters 0.28 –0.13 –0.13 0.02 0.09 –0.03
Arab party voters 0.04 0.26 0.18 –0.17 0.22 –0.51
Table 2.5—Continued
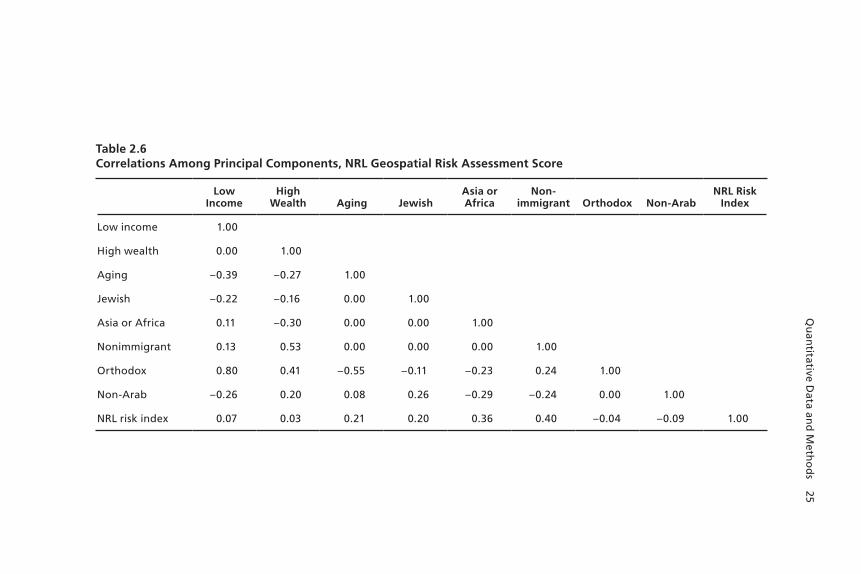
Qu
antitative D
ata and
Meth
od
s 25
Table 2.6Correlations Among Principal Components, NRL Geospatial Risk Assessment Score
Low Income
High Wealth Aging Jewish
Asia or Africa
Non- immigrant Orthodox Non-Arab
NRL Risk Index
Low income 1.00
high wealth 0.00 1.00
Aging –0.39 –0.27 1.00
Jewish –0.22 –0.16 0.00 1.00
Asia or Africa 0.11 –0.30 0.00 0.00 1.00
nonimmigrant 0.13 0.53 0.00 0.00 0.00 1.00
Orthodox 0.80 0.41 –0.55 –0.11 –0.23 0.24 1.00
non-Arab –0.26 0.20 0.08 0.26 –0.29 –0.24 0.00 1.00
nrL risk index 0.07 0.03 0.21 0.20 0.36 0.40 –0.04 –0.09 1.00
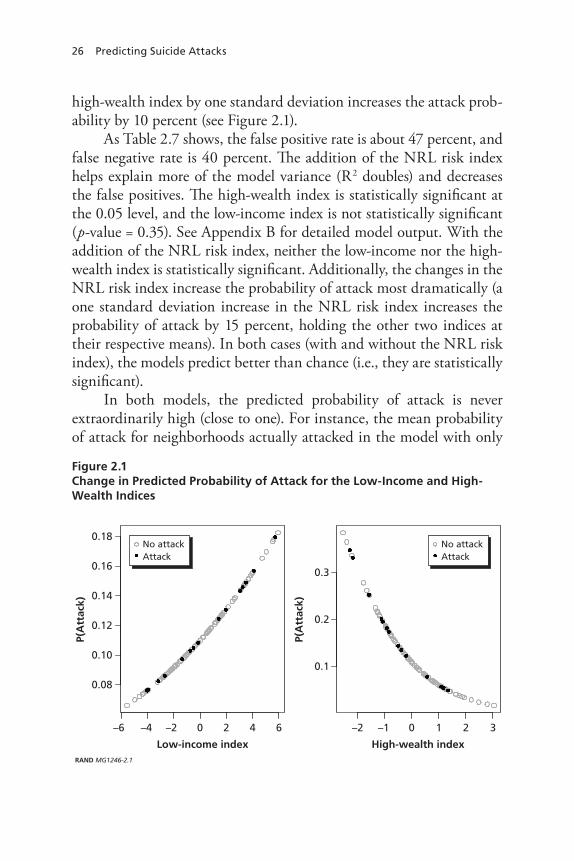
26 Predicting Suicide Attacks
high-wealth index by one standard deviation increases the attack prob-ability by 10 percent (see Figure 2.1).
As Table 2.7 shows, the false positive rate is about 47 percent, and false negative rate is 40 percent. The addition of the NRL risk index helps explain more of the model variance (R2 doubles) and decreases the false positives. The high-wealth index is statistically significant at the 0.05 level, and the low-income index is not statistically significant (p-value = 0.35). See Appendix B for detailed model output. With the addition of the NRL risk index, neither the low-income nor the high-wealth index is statistically significant. Additionally, the changes in the NRL risk index increase the probability of attack most dramatically (a one standard deviation increase in the NRL risk index increases the probability of attack by 15 percent, holding the other two indices at their respective means). In both cases (with and without the NRL risk index), the models predict better than chance (i.e., they are statistically significant).
In both models, the predicted probability of attack is never extraordinarily high (close to one). For instance, the mean probability of attack for neighborhoods actually attacked in the model with only
Figure 2.1Change in Predicted Probability of Attack for the Low-Income and High-Wealth Indices
RAND MG1246-2.1
P(A
ttac
k)
Low-income index
–6 –4 –2 0 2 4 6
0.08
0.10
0.12
0.14
0.16
0.18
–2 –1 0 1 2 3
P(A
ttac
k)
0.1
0.2
0.3
High-wealth index
No attackAttack
No attackAttack
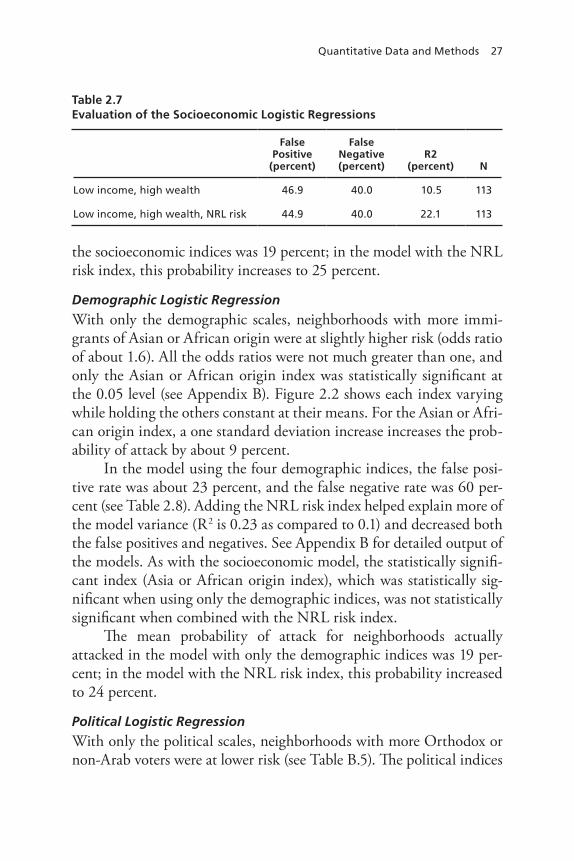
Quantitative Data and Methods 27
the socioeconomic indices was 19 percent; in the model with the NRL risk index, this probability increases to 25 percent.
Demographic Logistic Regression
With only the demographic scales, neighborhoods with more immi-grants of Asian or African origin were at slightly higher risk (odds ratio of about 1.6). All the odds ratios were not much greater than one, and only the Asian or African origin index was statistically significant at the 0.05 level (see Appendix B). Figure 2.2 shows each index varying while holding the others constant at their means. For the Asian or Afri-can origin index, a one standard deviation increase increases the prob-ability of attack by about 9 percent.
In the model using the four demographic indices, the false posi-tive rate was about 23 percent, and the false negative rate was 60 per-cent (see Table 2.8). Adding the NRL risk index helped explain more of the model variance (R2 is 0.23 as compared to 0.1) and decreased both the false positives and negatives. See Appendix B for detailed output of the models. As with the socioeconomic model, the statistically signifi-cant index (Asia or African origin index), which was statistically sig-nificant when using only the demographic indices, was not statistically significant when combined with the NRL risk index.
The mean probability of attack for neighborhoods actually attacked in the model with only the demographic indices was 19 per-cent; in the model with the NRL risk index, this probability increased to 24 percent.
Political Logistic Regression
With only the political scales, neighborhoods with more Orthodox or non-Arab voters were at lower risk (see Table B.5). The political indices
Table 2.7Evaluation of the Socioeconomic Logistic Regressions
False Positive
(percent)
False Negative (percent)
R2 (percent) N
Low income, high wealth 46.9 40.0 10.5 113
Low income, high wealth, nrL risk 44.9 40.0 22.1 113
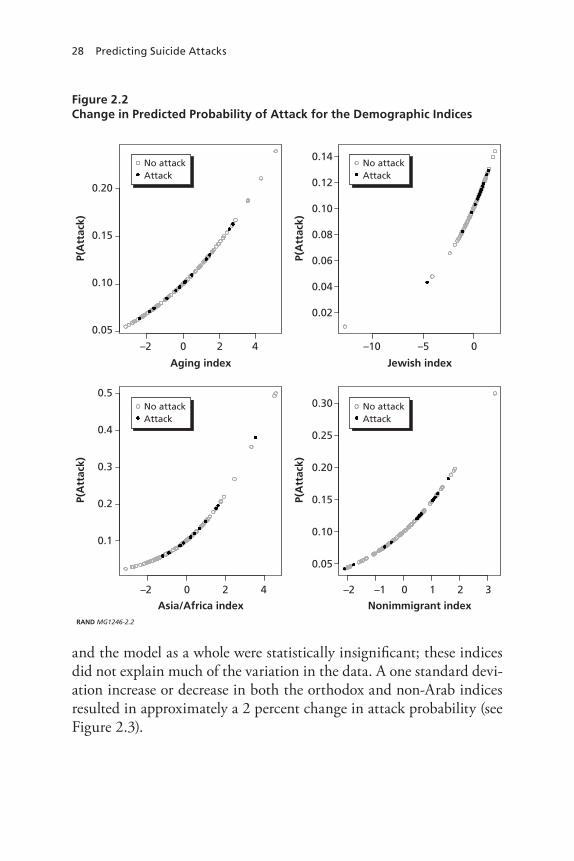
28 Predicting Suicide Attacks
and the model as a whole were statistically insignificant; these indices did not explain much of the variation in the data. A one standard devi-ation increase or decrease in both the orthodox and non-Arab indices resulted in approximately a 2 percent change in attack probability (see Figure 2.3).
Figure 2.2Change in Predicted Probability of Attack for the Demographic Indices
RAND MG1246-2.2
–2 0 2 4
0.05
0.10
0.15
0.20
–10 –5 0
0.02
0.04
0.06
0.08
0.10
0.12
0.14
0.1
0.2
0.3
0.4
0.5
–2 0 2 4
0.05
0.10
0.15
0.20
0.25
0.30
–2 –1 0 1 2 3
No attackAttack
No attackAttack
No attackAttack
No attackAttack
Asia/Africa index
Jewish indexAging index
Nonimmigrant index
P(A
ttac
k)
P(A
ttac
k)
P(A
ttac
k)
P(A
ttac
k)

Quantitative Data and Methods 29
In the model using the Orthodox and non-Arab indices, the false positive rate was about 21 percent, and the false negative rate was 53 percent (see Table 2.9). Adding the NRL risk index to the political indices helped explain significantly more of the model variance (R2 is 0.22 as compared to 0.02) and decreased both the false positives and negatives. See Appendix B for detailed output of the models. In the model with only the political indices, the mean probability of attack for neighborhoods actually attacked was 14 percent; in the model with the NRL risk index, this probability increased to 24 percent. The odds ratio is extremely large for the NRL risk index, and a one standard
Table 2.8Evaluation of the Demographic Logistic Regressions
False Positive
(percent)
False Negative (percent)
R2 (percent) N
Demographic indices only 22.5 60.0 14.2 113
Demographic indices and nrL risk 17.3 26.7 22.8 113
Figure 2.3Change in Predicted Probability of Attack for the Political Indices
RAND MG1246-2.3
P(A
ttac
k)
Orthodox index
P(A
ttac
k)
Non-Arab index
0.10
0.11
0.12
0.13
0.14
0.15
0.15
0.20
0.25
0.30
0.35
0.40
–2 –1 0 1 2 3 –10 –8 –6 –4 –2 0
No attackAttack
No attackAttack
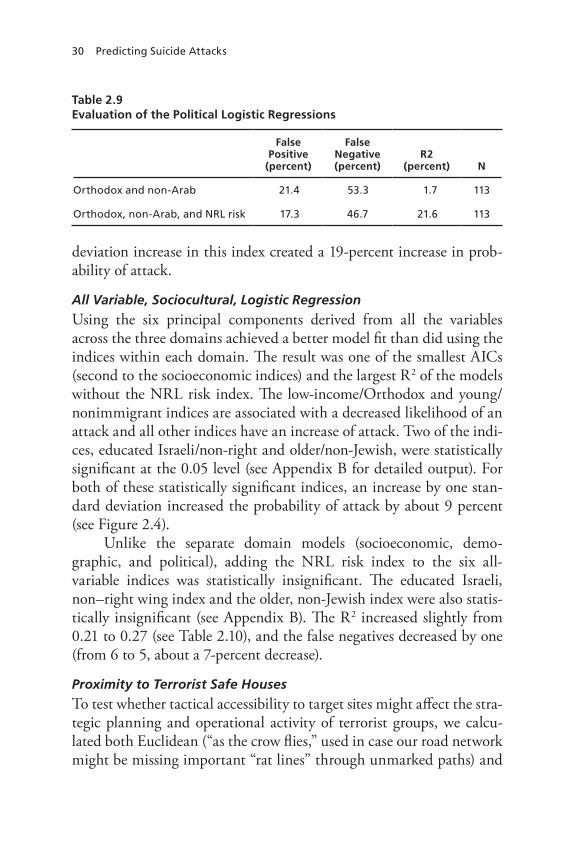
30 Predicting Suicide Attacks
deviation increase in this index created a 19-percent increase in prob-ability of attack.
All Variable, Sociocultural, Logistic Regression
Using the six principal components derived from all the variables across the three domains achieved a better model fit than did using the indices within each domain. The result was one of the smallest AICs (second to the socioeconomic indices) and the largest R2 of the models without the NRL risk index. The low-income/Orthodox and young/nonimmigrant indices are associated with a decreased likelihood of an attack and all other indices have an increase of attack. Two of the indi-ces, educated Israeli/non-right and older/non-Jewish, were statistically significant at the 0.05 level (see Appendix B for detailed output). For both of these statistically significant indices, an increase by one stan-dard deviation increased the probability of attack by about 9 percent (see Figure 2.4).
Unlike the separate domain models (socioeconomic, demo-graphic, and political), adding the NRL risk index to the six all- variable indices was statistically insignificant. The educated Israeli, non–right wing index and the older, non-Jewish index were also statis-tically insignificant (see Appendix B). The R2 increased slightly from 0.21 to 0.27 (see Table 2.10), and the false negatives decreased by one (from 6 to 5, about a 7-percent decrease).
Proximity to Terrorist Safe Houses
To test whether tactical accessibility to target sites might affect the stra-tegic planning and operational activity of terrorist groups, we calcu-lated both Euclidean (“as the crow flies,” used in case our road network might be missing important “rat lines” through unmarked paths) and
Table 2.9Evaluation of the Political Logistic Regressions
False Positive
(percent)
False Negative (percent)
R2 (percent) N
Orthodox and non-Arab 21.4 53.3 1.7 113
Orthodox, non-Arab, and nrL risk 17.3 46.7 21.6 113

Quantitative Data and Methods 31
traveling distance over known roads and pathways between known locations of terrorist safe houses for Hamas, the Al-Aqsa Martyrs’ Bri-gade, and Palestinian Islamic Jihad and all neighborhood centroids. Models examining the association between distance to the nearest safe house and neighborhood centroids (Euclidean and driving distance) did not reach significance, either for Jerusalem alone or for all cities combined. However, a model examining the number of terrorist safe houses in close proximity (below the median distance) to the neighbor-hood was marginally significant (p-value < 0.1). Given that barriers, checkpoints, and road closures are common in Israel and the Palestin-
Figure 2.4Change in Predicted Probability of Attack for the All Variable Indices
RAND MG1246-2.4
P(A
ttac
k)
Older, non-Jewish index
P(A
ttac
k)
Educated Israeli,non–right wing index
No attackAttack
No attackAttack
0
0.2
0.4
0.6
0.8
0
0.1
0.2
0.3
0.4
–4 –2 0 2–4 –2 0 2 4 6 8
Table 2.10Evaluation of the All Variable Logistic Regressions
False Positive
(percent)
False Negative (percent)
R2 (percent) N
All variable, sociocultural 19.4 40.0 21.3 113
All variable, sociocultural, and nrL risk 18.4 33.3 27.0 113

32 Predicting Suicide Attacks
ian territories and that these change constantly, finding a significant association without taking these factors into account is remarkable and suggests that future analyses that consider these factors might bear additional analytic fruit (see Table 2.11). The odds ratio is extremely close to one, however, which means that there is only a slight increase in the likelihood of attack.
Classification and Regression Trees
We fit a classification tree categorizing neighborhoods in Jerusalem by risk level (probability of suicide bombing attack). The classification tree model used 12 socioeconomic, 11 demographic, and five political variables to create a hierarchical tree generating the most efficient cat-egorization of neighborhoods by risk level while minimizing the vari-ance in each category. It is important to remember that different trees can produce similar results and that, even though each split is opti-mal, the tree may not be globally optimal. To avoid overfitting, we pruned the tree using tenfold cross-validation and used one standard deviation from the minimum complexity parameter (Breiman et al., 1984; Ripley, 1996). The tree produced four neighborhood profiles, of which two were low risk (ranging from 0–17 percent probability of attack), one moderate risk (55 percent probability of attack), and one high risk (67 percent probability of attack). The two low-risk pro-files contained most of the neighborhoods in Jerusalem (109 out of
Table 2.11Logistic Regression with Terrorist Safe Houses in Close Proximity
Coeff. SE ORWald
z valuep-valuep(>|z|)
Intercept –2.79 0.22 0.06 –12.84 0.001**
Safe houses in proximity 0.07 0.04 1.08 1.67 0.090
nOteS:
AIC: 270.18
Pseudo-r2 (nagelkerke): 0.01
Lr χ (1): 2.5 ; prob > χ2 : 0.11
n = 129
Significance: 0.0001***, 0.001**, 0.05*
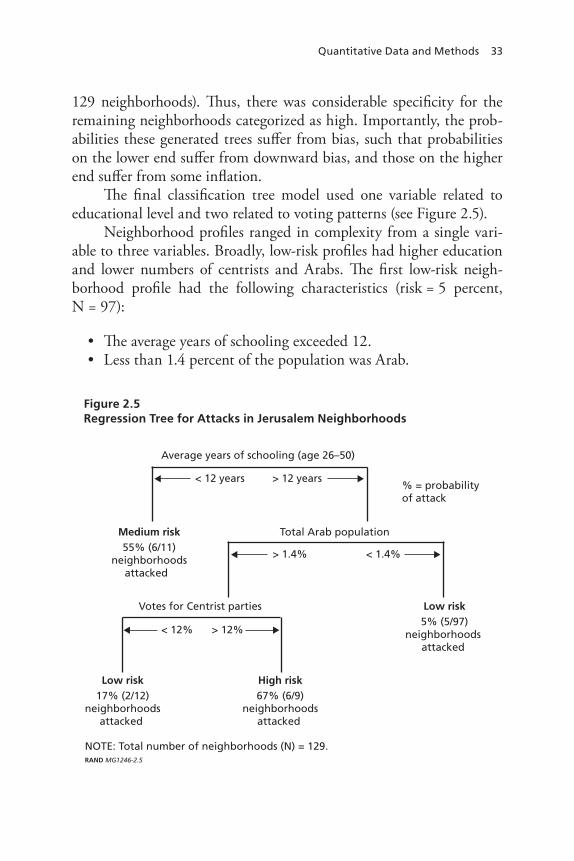
Quantitative Data and Methods 33
129 neighborhoods). Thus, there was considerable specificity for the remaining neighborhoods categorized as high. Importantly, the prob-abilities these generated trees suffer from bias, such that probabilities on the lower end suffer from downward bias, and those on the higher end suffer from some inflation.
The final classification tree model used one variable related to educational level and two related to voting patterns (see Figure 2.5).
Neighborhood profiles ranged in complexity from a single vari-able to three variables. Broadly, low-risk profiles had higher education and lower numbers of centrists and Arabs. The first low-risk neigh-borhood profile had the following characteristics (risk = 5 percent, N = 97):
• The average years of schooling exceeded 12.• Less than 1.4 percent of the population was Arab.
Figure 2.5Regression Tree for Attacks in Jerusalem Neighborhoods
NOTE: Total number of neighborhoods (N) = 129.RAND MG1246-2.5
Medium risk55% (6/11)
neighborhoodsattacked
Average years of schooling (age 26–50)
< 12 years > 12 years
Votes for Centrist parties
> 1.4% < 1.4%
Total Arab population
< 12% > 12%
Low risk5% (5/97)
neighborhoods attacked
Low risk17% (2/12)
neighborhoodsattacked
High risk67% (6/9)
neighborhoodsattacked
% = probabilityof attack

34 Predicting Suicide Attacks
The second low-risk neighorhood had the following characteristics (risk = 17 percent, N = 12):
• The average years of schooling exceeded 12.• More than 1.4 percent of the population was Arab.• Less than 12 percent of the population voted centrist.
Meanwhile, high-risk profiles were more highly educated and had more Arab and centrist voters. These represent one type of neighbor-hood at risk of suicide bombing attack in Jerusalem. This high-risk neighborhood profile had the following characteristics (risk = 67 per-cent, N = 9):
• The average years of schooling exceeded 12.• More than 1.4 percent of the population was Arab.• More than 12 percent voted centrist.
If the tree were not pruned, it would have had more leaves and more high-risk neighborhoods. There is a moderate-risk neighborhood characterized solely by education (risk = 55 percent, N = 11), averaging fewer than 12 years of schooling.
It is important to note that classification trees are notoriously unstable in their specific form and are thus well suited for prediction. However, one should be cautious about reading specific cause-and-effect meanings into the results (Breiman, 1994). To detect important variables, we performed a random forest analysis, creating many trees and introducing randomness into them. The results indicate which variables were most important in reducing error. The ten most impor-tant variables were
1. average years of schooling of those aged 26 to 502. percentage Orthodox3. percentage of households with new immigrants4. percentage left wing5. percentage of sub–minimum wage earners6. percentage right wing7. percentage of workers in prestigious occupations
Quantitative Data and Methods 35
8. percentage of households with a computer9. percentage Arab10. percentage centrist.
The three variables used for the tree presented in Figure 2.5, variables 1, 9, and 10, were all on this top-ten list of most important variables.
One method of integrating geospatial and sociocultural predic-tive modeling is to merge the results of predictive models from each analysis. Figure 2.6 illustrates Jerusalem neighborhoods, with the pink to red shading indicating neighborhoods with different maximum NRL risk assessment scores from the campaign assessment for Jerusa-lem (NRL, 2010a). Overlaid on this shading are yellow lines indicat-ing the 21 neighborhoods falling into profiles of high sociocultural risk, as indicated by regression trees. As the figure shows, these high sociocultural risk neighborhoods were all located near the center of Jerusalem. The convergent evidence from different lines of analysis of high future probability of attack thus suggest that, for the purposes of targeting prevention, intervention, and training efforts, neighborhoods with both dark red (geospatial risk) and yellow lines (sociocultural risk) could be considered to have the highest priority.
Sociocultural Precipitants
We assigned temporal variables to all neighborhoods in Jerusalem for Jewish religious holidays, political negotiations, and IDF opera-tions. Neighborhoods received a 0 if attacks within the neighborhood boundary over the 13-year period did not fall within the time window of an associated precipitant event. Otherwise, the temporal variable was constructed as described in “Quantitative Methodology.” Fifteen neighborhoods in Jerusalem were coded with at least one nonzero tem-poral variable.
To use the count variable, we employed a negative binomial regression to examine the association between the occurrence of a sociocultural precipitant and attack frequency (Cameron and Trivedi, 1998); see Table 2.12. Coefficients for the religious holiday and politi-cal negotiations of precipitants were significant (at the 0.001 and 0.07 levels, respectively) and in the positive direction, indicating an associa-
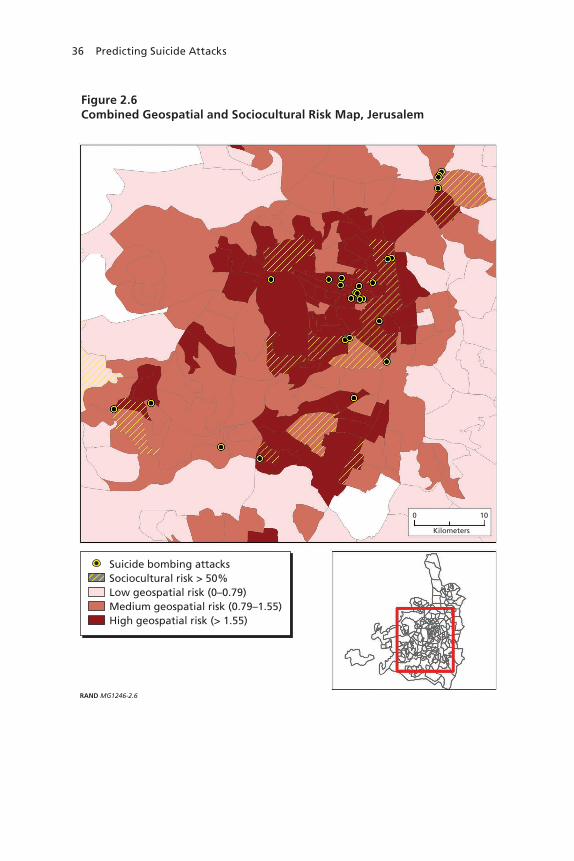
36 Predicting Suicide Attacks
Figure 2.6Combined Geospatial and Sociocultural Risk Map, Jerusalem
RAND MG1246-2.6
Kilometers
0 10
Suicide bombing attacksSociocultural risk > 50%Low geospatial risk (0–0.79)Medium geospatial risk (0.79–1.55)High geospatial risk (> 1.55)
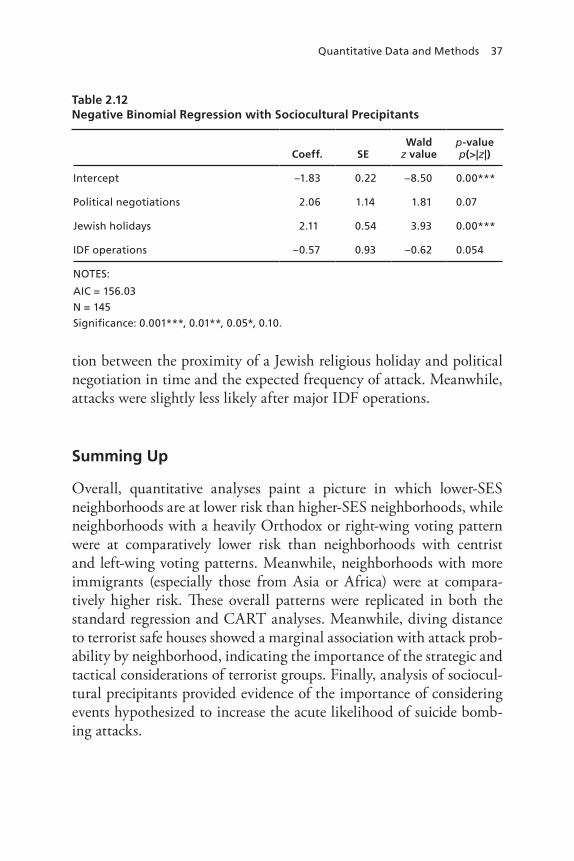
Quantitative Data and Methods 37
tion between the proximity of a Jewish religious holiday and political negotiation in time and the expected frequency of attack. Meanwhile, attacks were slightly less likely after major IDF operations.
Summing Up
Overall, quantitative analyses paint a picture in which lower-SES neighborhoods are at lower risk than higher-SES neighborhoods, while neighborhoods with a heavily Orthodox or right-wing voting pattern were at comparatively lower risk than neighborhoods with centrist and left-wing voting patterns. Meanwhile, neighborhoods with more immigrants (especially those from Asia or Africa) were at compara-tively higher risk. These overall patterns were replicated in both the standard regression and CART analyses. Meanwhile, diving distance to terrorist safe houses showed a marginal association with attack prob-ability by neighborhood, indicating the importance of the strategic and tactical considerations of terrorist groups. Finally, analysis of sociocul-tural precipitants provided evidence of the importance of considering events hypothesized to increase the acute likelihood of suicide bomb-ing attacks.
Table 2.12Negative Binomial Regression with Sociocultural Precipitants
Coeff. SEWald
z valuep-valuep(>|z|)
Intercept –1.83 0.22 –8.50 0.00***
Political negotiations 2.06 1.14 1.81 0.07
Jewish holidays 2.11 0.54 3.93 0.00***
IDF operations –0.57 0.93 –0.62 0.054
nOteS:
AIC = 156.03
n = 145
Significance: 0.001***, 0.01**, 0.05*, 0.10.
38 Predicting Suicide Attacks
All results should be interpreted with caution, as they represent only a single city and collapse the analysis across a long period, often using data for a single time point (e.g., 1999 election data, 1995 census data). However, the simple existence of associations with the small number of attacks (and attacked neighborhoods) is notable and sug-gests the value of future research on socioeconomic, political, demo-graphic, and other sociocultural predictors of suicide bombing attacks. Indeed, the purpose of this demonstration exercise was to explore the value of incorporating sociocultural, economic, political, and demo-graphic data to enhance the predictive capacity of the timing and loca-tion of suicide bombing attacks. The findings, of course, cannot be directly transferred to other contexts. Indeed, the methods themselves are exploratory and preliminary and would need thorough testing for robustness before any application in real world to produce specific advisories about high-risk areas. The (thankfully) sparse data on suicide attacks in Western contexts, however, limit such testing.
It is important to note that we designed all the quantitative analy-ses to be a proof-of-principle exploration of the potential utility of sociocultural variables in predicting suicide bombing attack locations. As such, we did not intend these analyses to provide the final say on any of the factors explored. As outlined in more detail in “Recommen-dations for Further Research” (Chapter Four), future analyses would include more regions in Israel; would explore several alternative model specifications; and would explore a host of additional mediating and moderating factors, such as the terrorist group involved in each attack.
39
ChAPter three
Qualitative Analysis
The purpose of the qualitative methodology was to identify and code themes reflecting target location types and attributes common to sui-cide bombing sites in Israel. We used the hybrid NRL-RAND model to identify areas at increased risk of attack, then used the themes from the qualitative analysis to identify specific locations at increased risk of attack. The intention was to make the problem more manageable by reducing the high-risk areas from broad city regions to lists of sites. Figure 3.1 shows a notional example of how we used qualitative analy-sis to do this for areas of Jerusalem that the NRL geospatial model identified as high risk. The pink spots in each diagram represent areas the geospatial analysis identified as being at risk. The smaller orange ovals illustrate the smaller risk space attributable to both geospatial and sociocultural analyses.
In addition to reducing high-risk areas, the methodology can also help drive further sociocultural research in targeting preferences by identifying trends and patterns in attacks (and nonattacks).
Methodology
In the first step in the methodology for this project, identification, we reviewed open-source articles about the attacks and target sites. We specifically considered articles on suicide bombings in four cities, such as the ones included in the Suicide Terrorism Database: Jerusalem, Tel Aviv, Haifa, and Netanya. The reviews looked for key words and phrases identifying target characteristics (the themes) in descriptions of
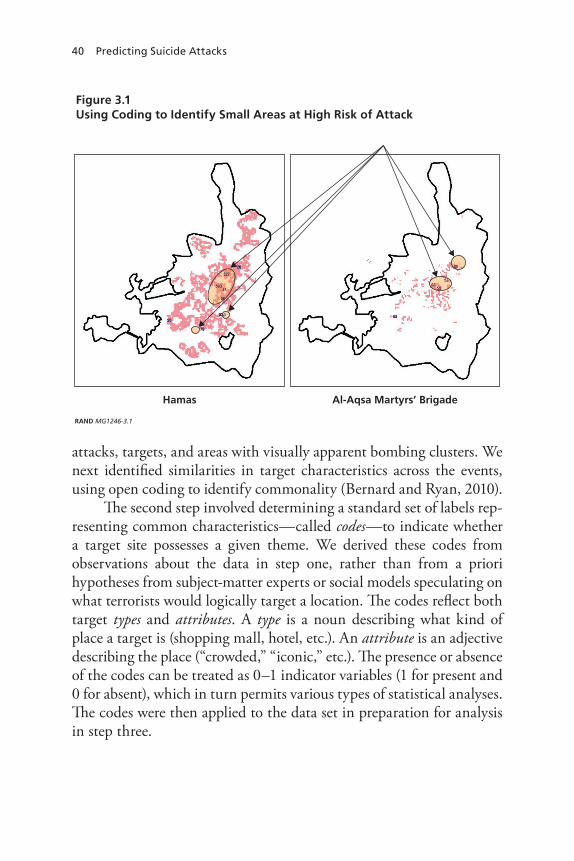
40 Predicting Suicide Attacks
attacks, targets, and areas with visually apparent bombing clusters. We next identifi ed similarities in target characteristics across the events, using open coding to identify commonality (Bernard and Ryan, 2010).
Th e second step involved determining a standard set of labels rep-resenting common characteristics—called codes—to indicate whether a target site possesses a given theme. We derived these codes from observations about the data in step one, rather than from a priori hypotheses from subject-matter experts or social models speculating on what terrorists would logically target a location. Th e codes refl ect both target types and attributes. A type is a noun describing what kind of place a target is (shopping mall, hotel, etc.). An attribute is an adjective describing the place (“crowded,” “iconic,” etc.). Th e presence or absence of the codes can be treated as 0–1 indicator variables (1 for present and 0 for absent), which in turn permits various types of statistical analyses. Th e codes were then applied to the data set in preparation for analysis in step three.
Figure 3.1Using Coding to Identify Small Areas at High Risk of Attack
RAND MG1246-3.1
Hamas Al-Aqsa Martyrs’ Brigade
Qualitative Analysis 41
The third step, pattern and trend analysis, assessed the numbers and timing of attacks having codes in common. In this step, we identi-fied patterns in the codes, including discernible clusters, correlations, and trends. The power of the pattern analysis depends on the number of attack cases sharing the codes. For codes a few cases share, the analy-sis helps identify candidate factors that may help explain why a target-ing site was chosen. For codes more cases share, the analysis may iden-tify statistically significant findings about target characteristics.
Hypotheses Driving the Use of the Methodology
While the selection of codes is not based on hypotheses, the use of this approach is grounded in social science theory in several ways. First, we hypothesized, in accordance with the crime pattern theory of criminol-ogy (Brantingham and Brantingham, 1984 and 2010), that a would-be terrorist would naturally know about and think of attacking cer-tain targets just by being part of the local environment, carrying out daily activities, and interacting daily with both Palestinians and Israelis (Jewish and Arab). These would be places where crowds of Jewish Israe-lis are commonly known to congregate and/or that have some special meaning to Jewish Israelis.
Second, we hypothesized that suicide bombing plotters are fairly rational and will select targets that provide reasonably easy access to crowds of people to attack, trading off between killing large numbers of Jewish Israelis and having a high likelihood of success. However, we hypothesized that, in making such a choice, would-be attackers would take a bounded rationality approach (Simon, 1955). Here, would-be terrorists simply seek “satisfactory” attacks—identifying “obvious” tar-gets that, at first thought, seem to offer a “good-enough” combination of crowds and easy access (van Um, 2011). As an example, attendees of the December 8–9, 2010, Department of Homeland Security Risk Pre-diction Workshop were informally asked to quickly name a DC Metro station that they would think to attack first. Union Station quickly emerged as a consensus choice, for both symbolic and rational reasons.
42 Predicting Suicide Attacks
We further hypothesized that terrorists would generally choose such obvious targets for their attacks, that obvious targets have common characteristics, and that these characteristics can be detected via quali-tative analysis of the attack location descriptions.
The inferential approach also provides for testing of earlier subject-matter expert and modeling hypotheses about what terrorists might target. For example, this monograph compares the inferred codes for suicide bombing locations with Clarke and Newman’s “exposed, vital, iconic, legitimate, destructible, occupied, near, easy (EVIL DONE)” rubric for target attractiveness (2006). This rubric was specifically developed to identify facilities most at risk from being hit by jet aircraft in another 9/11-type attack but can be adapted to other major types of terrorist attacks.
Assumptions in Using the Methodology
Restrictions
Since the qualitative methodology is intended to infer the attacking organizations’ underlying targeting preferences, we analyzed a location only if a suicide bomber reached his or her intended target. They need not have fully reached their target, but the location they were trying to strike had to be clear. For example, a suicide bomber attempting to enter a club who detonated after being detected by security was clearly attempting to strike the club, so that attack would have been counted. Conversely, a suicide bomber traveling on a bus who detonated after being detected by passengers or security forces was likely just using the bus to get to a target; that attack would not have been counted.
In a number of cases, the same target was hit by multiple bombers in a coordinated assault. The Suicide Terrorism Database counts such attacks multiple times, with one record for each detonation. Since our focus is on individual target preferences, we counted such attacks only once.
Using these restrictions, our research yielded 55 attack cases that were independent and had a clear target.

Qualitative Analysis 43
Timing
The numbers of attacks showed a great deal of volatility across months, and even across quarters. To support trend analysis, we identified six periods for the attacks, based roughly on equal numbers of attacks occurring in the period and to reflect visible changes in attack timings and frequencies. Table 3.1 shows the resulting periods.
The largest single spike in attacks occurred from January through April 2002. We considered making this period cover January through March 2002 because Israel’s Operation Defensive Shield—which appears to have started the major decline in terrorist attacks—began on March 29, 2002. However, the attack data appear to show that it took several weeks for the operation to ramp up. The spike in attacks did not end until mid-April, and there was also a spike later in that year.
Results of Qualitative Data Analysis
This section presents the results of our qualitative data analysis of attack site descriptions. It first describes the codes identified, then examines the distributions of the codes. We then consider several additional analyses. The first addresses a major trend in the attacks—the same locations being attacked multiple times. The second considers larger trends in the types of locations attacked over time. The third is a special
Table 3.1Periods for Israeli Suicide Bombings
Period Defining Event
1994 to 2000 Peace process
2001 Second Intifada
January–April 2002 Second Intifada; spike in attacks
May–December 2002 Second Intifada; spike in attacks
2003 Second Intifada
2004–present tail-off and end of Second Intifada
44 Predicting Suicide Attacks
characterization of transportation-related attacks. The last is a com-parison of the descriptive codes to those predicted in a subject-matter expert analysis of likely terror targets.
Identification of Codes
Using the qualitative data analysis methodology, we identified 12 codes that appeared in at least two cases each. Table 3.2 presents these in alphabetical order.
Distribution of Codes
The most frequent code, crowded, applied to all cases. Note that crowded does not refer strictly to a large crowd (tens of hundreds of people). Instead, it means that there was a fairly large group of people at the scene, who were reasonably accessible to the bomber. Exam-ples of accessible include groups of people who are on an open street, right inside an establishment, or on a bus who either were the target or appeared to be the intended target. The frequency of this code implies that a rational choice hypothesis—suicide bombers attack targets fea-turing groups of people that are readily accessible—is accurate.
Figure 3.2 shows the distribution of the 11 other codes across the 55 analyzed suicide bombing cases. Of these codes, the top three were main shopping, iconic, and main street. Almost 70 percent of the cases had at least one of these three codes. This prevalence is consistent with both a crime pattern theory hypothesis on choosing obvious places (as places with these attributes would be well known) and a bounded rational choice hypothesis on choosing locations with accessible crowds (these places would be very likely to have numbers of accessible crowds).
The other codes are more tentative. The children and youth code applied to disco and club bombings and to several attacks on buses carrying crowds of young people; youth was a more prevalent theme than children. That said, it was unclear from the descriptions whether youth were deliberately being targeted or just happened to be part of an accessible crowd.
The Easy Access code takes the bounded rationality hypothesis further, focusing almost entirely on the “ease” side of the trade-off. The code applies to several bus bombings with no obvious rationale for the
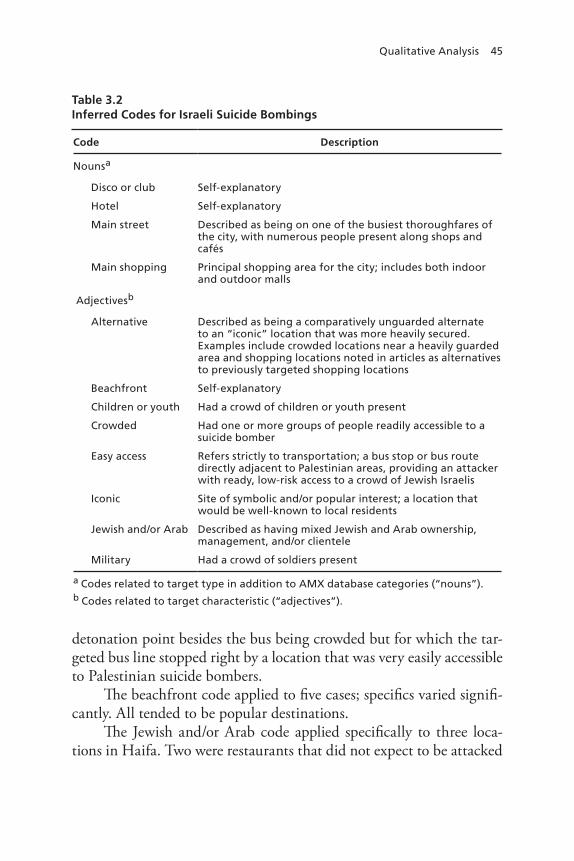
Qualitative Analysis 45
detonation point besides the bus being crowded but for which the tar-geted bus line stopped right by a location that was very easily accessible to Palestinian suicide bombers.
The beachfront code applied to five cases; specifics varied signifi-cantly. All tended to be popular destinations.
The Jewish and/or Arab code applied specifically to three loca-tions in Haifa. Two were restaurants that did not expect to be attacked
Table 3.2Inferred Codes for Israeli Suicide Bombings
Code Description
nounsa
Disco or club Self-explanatory
hotel Self-explanatory
Main street Described as being on one of the busiest thoroughfares of the city, with numerous people present along shops and cafés
Main shopping Principal shopping area for the city; includes both indoor and outdoor malls
Adjectivesb
Alternative Described as being a comparatively unguarded alternate to an “iconic” location that was more heavily secured. examples include crowded locations near a heavily guarded area and shopping locations noted in articles as alternatives to previously targeted shopping locations
Beachfront Self-explanatory
Children or youth had a crowd of children or youth present
Crowded had one or more groups of people readily accessible to a suicide bomber
easy access refers strictly to transportation; a bus stop or bus route directly adjacent to Palestinian areas, providing an attacker with ready, low-risk access to a crowd of Jewish Israelis
Iconic Site of symbolic and/or popular interest; a location that would be well-known to local residents
Jewish and/or Arab Described as having mixed Jewish and Arab ownership, management, and/or clientele
Military had a crowd of soldiers present
a Codes related to target type in addition to AMX database categories (“nouns”).b Codes related to target characteristic (“adjectives”).
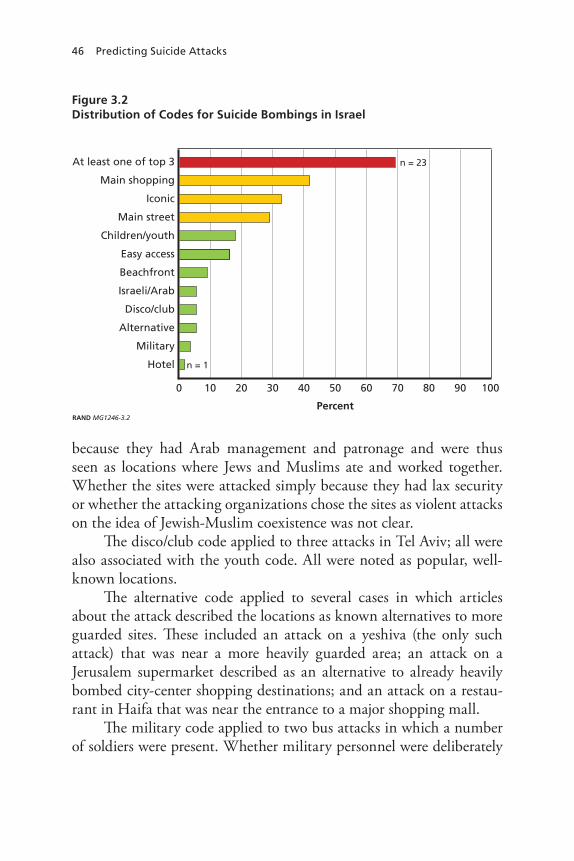
46 Predicting Suicide Attacks
because they had Arab management and patronage and were thus seen as locations where Jews and Muslims ate and worked together. Whether the sites were attacked simply because they had lax security or whether the attacking organizations chose the sites as violent attacks on the idea of Jewish-Muslim coexistence was not clear.
The disco/club code applied to three attacks in Tel Aviv; all were also associated with the youth code. All were noted as popular, well-known locations.
The alternative code applied to several cases in which articles about the attack described the locations as known alternatives to more guarded sites. These included an attack on a yeshiva (the only such attack) that was near a more heavily guarded area; an attack on a Jerusalem supermarket described as an alternative to already heavily bombed city-center shopping destinations; and an attack on a restau-rant in Haifa that was near the entrance to a major shopping mall.
The military code applied to two bus attacks in which a number of soldiers were present. Whether military personnel were deliberately
Figure 3.2Distribution of Codes for Suicide Bombings in Israel
RAND MG1246-3.2
Percent
0 10 20 90807060504030 100
Hotel
Military
Alternative
Disco/club
Israeli/Arab
Beachfront
Easy access
Children/youth
Main street
Iconic
Main shopping
At least one of top 3 n = 23
n = 1
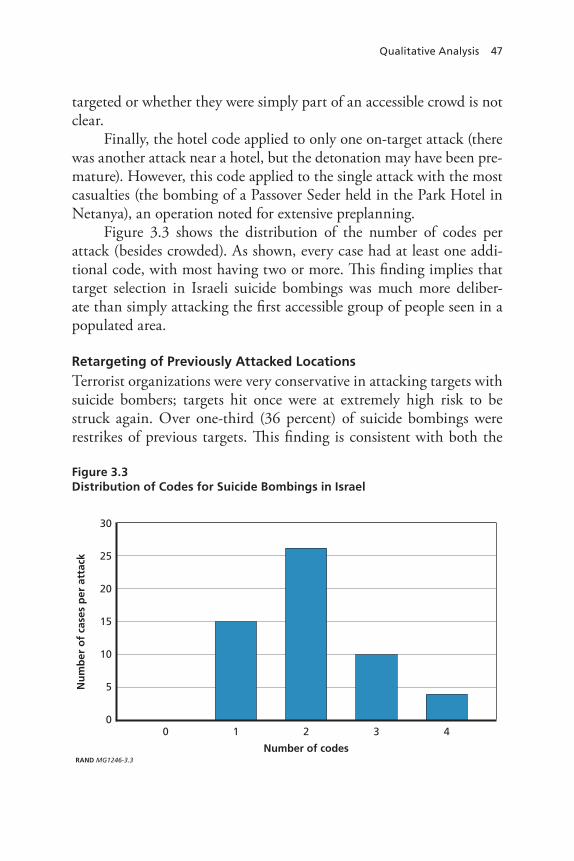
Qualitative Analysis 47
targeted or whether they were simply part of an accessible crowd is not clear.
Finally, the hotel code applied to only one on-target attack (there was another attack near a hotel, but the detonation may have been pre-mature). However, this code applied to the single attack with the most casualties (the bombing of a Passover Seder held in the Park Hotel in Netanya), an operation noted for extensive preplanning.
Figure 3.3 shows the distribution of the number of codes per attack (besides crowded). As shown, every case had at least one addi-tional code, with most having two or more. This finding implies that target selection in Israeli suicide bombings was much more deliber-ate than simply attacking the first accessible group of people seen in a populated area.
Retargeting of Previously Attacked Locations
Terrorist organizations were very conservative in attacking targets with suicide bombers; targets hit once were at extremely high risk to be struck again. Over one-third (36 percent) of suicide bombings were restrikes of previous targets. This finding is consistent with both the
Figure 3.3Distribution of Codes for Suicide Bombings in Israel
RAND MG1246-3.3
Nu
mb
er o
f ca
ses
per
att
ack
Number of codes
0
5
10
15
20
30
25
0 1 2 3 4

48 Predicting Suicide Attacks
crime pattern and bounded rational choice hypotheses—once an orga-nization finds a site that meets its criteria and attacks it successfully, the site becomes an easy choice for additional attacks.
Table 3.3 identifies locations in Israel that suicide bombers have attacked more than once. As shown, these tended to be locations for which the top three codes (main shopping, iconic, and main street) typically applied.
Dispersion of Attacks over Time
From reviewing attack descriptions and point maps showing attack locations, we found target selection to migrate from iconic and centrally located targets over time. Such a migration would be consistent with a rational choice hypothesis, in that terrorist organizations would choose alternative sites in response to increased security at preferred sites. We assessed whether this initial impression is quantitatively justified.
Our approach was to group the attack sites into clusters by simi-larities in their codes (recall the 0–1 indicator variables for whether each site has a specified code) using the K-means clustering algorithm, as applied using the open-source data mining software KNIME, the Konstanz Information Miner (2010). K-means is a standard data mining algorithm for clustering (Lloyd, 1982; LaRose, 2005; Hastie Tibshirani, and Friedman, 2009). This algorithm is iterative; starting with a random selection of cluster “centers,” it assigns each record to
Table 3.3Locations in Israel Attacked More Than Once
City Targets Attacked More Than Once
Jerusalem Central Bus StationJaffa road–King George Street intersectionMahane Yehuda MarketBen Yehuda Street (pedestrian mall)French hill bus junction
tel Aviv neve Sha’ana market and shopping areas near the Central Bus Station
netanya hasharon Mall entrances and immediately surrounding areas, such as nearby bus stops
haifa none
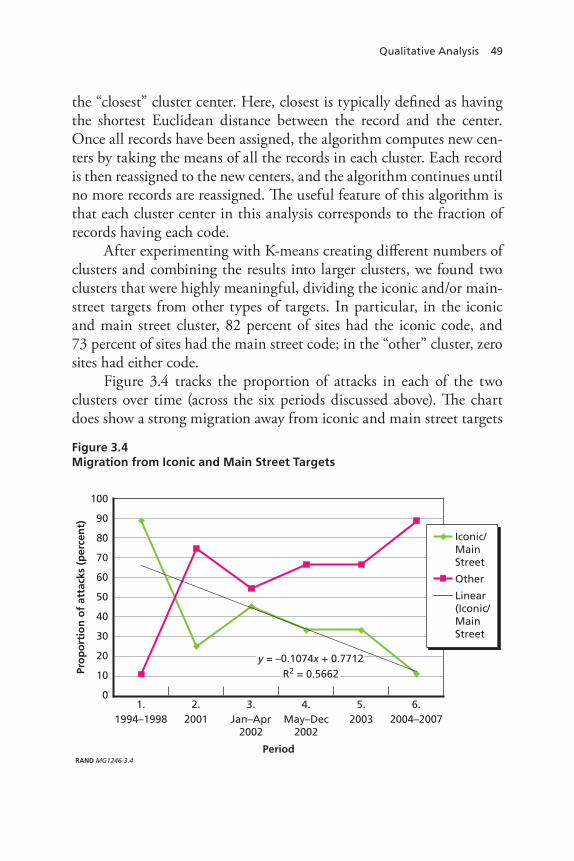
Qualitative Analysis 49
the “closest” cluster center. Here, closest is typically defined as having the shortest Euclidean distance between the record and the center. Once all records have been assigned, the algorithm computes new cen-ters by taking the means of all the records in each cluster. Each record is then reassigned to the new centers, and the algorithm continues until no more records are reassigned. The useful feature of this algorithm is that each cluster center in this analysis corresponds to the fraction of records having each code.
After experimenting with K-means creating different numbers of clusters and combining the results into larger clusters, we found two clusters that were highly meaningful, dividing the iconic and/or main-street targets from other types of targets. In particular, in the iconic and main street cluster, 82 percent of sites had the iconic code, and 73 percent of sites had the main street code; in the “other” cluster, zero sites had either code.
Figure 3.4 tracks the proportion of attacks in each of the two clusters over time (across the six periods discussed above). The chart does show a strong migration away from iconic and main street targets
Figure 3.4Migration from Iconic and Main Street Targets
RAND MG1246-3.4
Pro
po
rtio
n o
f at
tack
s (p
erce
nt)
Period
0
10
20
30
40
100
90
80
70
60
50
1.1994–1998
6.2004–2007
5.2003
4.May–Dec
2002
3.Jan–Apr
2002
2.2001
y = –0.1074x + 0.7712R2 = 0.5662
Iconic/MainStreet
Other
Linear(Iconic/MainStreet
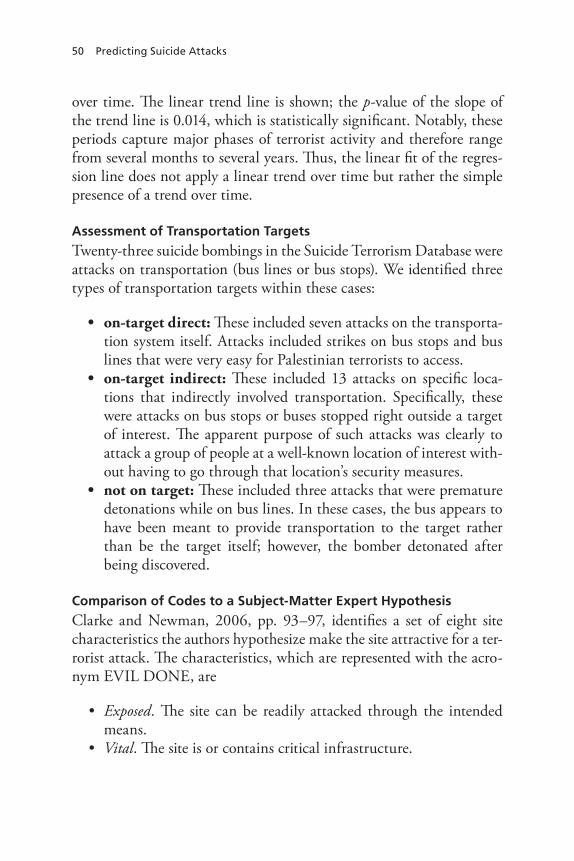
50 Predicting Suicide Attacks
over time. The linear trend line is shown; the p-value of the slope of the trend line is 0.014, which is statistically significant. Notably, these periods capture major phases of terrorist activity and therefore range from several months to several years. Thus, the linear fit of the regres-sion line does not apply a linear trend over time but rather the simple presence of a trend over time.
Assessment of Transportation Targets
Twenty-three suicide bombings in the Suicide Terrorism Database were attacks on transportation (bus lines or bus stops). We identified three types of transportation targets within these cases:
• on-target direct: These included seven attacks on the transporta-tion system itself. Attacks included strikes on bus stops and bus lines that were very easy for Palestinian terrorists to access.
• on-target indirect: These included 13 attacks on specific loca-tions that indirectly involved transportation. Specifically, these were attacks on bus stops or buses stopped right outside a target of interest. The apparent purpose of such attacks was clearly to attack a group of people at a well-known location of interest with-out having to go through that location’s security measures.
• not on target: These included three attacks that were premature detonations while on bus lines. In these cases, the bus appears to have been meant to provide transportation to the target rather than be the target itself; however, the bomber detonated after being discovered.
Comparison of Codes to a Subject-Matter Expert Hypothesis
Clarke and Newman, 2006, pp. 93–97, identifies a set of eight site characteristics the authors hypothesize make the site attractive for a ter-rorist attack. The characteristics, which are represented with the acro-nym EVIL DONE, are
• Exposed. The site can be readily attacked through the intended means.
• Vital. The site is or contains critical infrastructure.

Qualitative Analysis 51
• Iconic. The site has significant symbolic meaning.• Legitimate. Key populations will see attacking the site as legiti-
mate.• Destructible. An attack on the site using the intended means will
destroy the target or at least cause heavy damage.• Occupied. Attacking the site will cause numerous casualties.• Near. It is easy for the would-be terrorists to travel to the site, with
low risk.• Easy. Protective measures at the site (if any) can be readily over-
come.
The EVIL DONE attributes were specifically meant to identify tar-gets at risk from being hit by hijacked aircraft in repeats of the 9/11 attacks but can be more broadly applied to terrorist targeting in gen-eral. Table 3.4 compares these hypothesized attributes to the inferred codes for suicide bombings in Israel.
As shown, the hypothesized and inferred codes correlate fairly well. Groups of people at main-shopping and main-street locations tended to be exposed to blast attacks. Both EVIL DONE and the inferred codes agree precisely on attacking iconic targets. Crowds of Jewish Israelis were described in articles about the attacks as being seen as legitimate targets for Palestinian attackers; the crowds were also inherently destructible, and attacking crowds at sites of interest inher-ently produced casualties (occupied). EVIL DONE’s definition of near, being able to travel to the site easily and with low risk, corresponds well with the inferred easy access. Easy corresponds well with the crowded (note this code included the groups of people who were vulnerable to a blast attack), easy access, and alternative codes.
The only EVIL DONE attribute that did not correlate with the inferred codes was Vital (hence the shading). Palestinian terror-ist organizations showed no signs of attacking key infrastructure with suicide bombings; they instead focused exclusively on killing Jewish Israelis directly. Nonetheless, the comparison does show that the EVIL DONE predictions matched fairly well with the inferred attributes of suicide bombings in Israel.
52 Predictin
g Su
icide A
ttacks
Table 3.4Comparing Hypothesized Target Attributes with Inferred Attributes for Suicide Bombings in Israel
IZ Suicide Bombing Codes
EVIL DONE Applied to Suicide Bombingsa
Exposed Vital Iconic Legitimate Destructible Occupied Near Easy
Crowded Y Y Y Y
Main shopping Y
Iconic Y
Main street Y
easy access Y Y
Alternative Y
a Clarke and newman, 2006.
53
ChAPter FOUr
Conclusions and Recommendations
This final chapter records the major findings from this research. The first section addresses findings associated with the quantitative analy-sis reported in Chapter Two, and the second addresses the qualitative analysis addressed in Chapter Three. We conclude with a set of recom-mendations that focus on further research.
Conclusions from Quantitative Data Analysis
The purpose of the pilot study documented here was to establish the potential utility of sociocultural (as well as political, demographic, and socioeconomic) information in assisting with the spatial prediction of suicide bombing attacks, using Israel as a test case. The quantitative analysis established that socioeconomic, demographic, and political data not only have statistically significant relationships with the odds of attack within specific neighborhoods but also explain unique vari-ances in the risk of attack over and above geospatial predictors. Demo-graphically, both having a heavily Jewish population and having a large number of immigrants (particularly from Asia and Africa) were related to greater risk of attack. Finally, voting for right-wing or Orthodox par-ties in 1999 was related to lower neighborhood risk of attack. Some of these relationships are obvious (for example, the attractiveness of target neighborhoods with a highly Jewish population). However, others are less obvious and deserve further exploration, such as the association of risk with immigrant populations. It is possible that such neighbor-hoods are constructed or laid out in a way that allows potential suicide

54 Predicting Suicide Attacks
bombers to blend into crowds more easily, but such ideas are conjecture and require further data collection and analysis to explore.
The relationships between socioeconomic, demographic, and political variables and attack probability held even when controlling for geospatial factors, so they seem to confer risk for reasons beyond their association with the geospatial features of neighborhoods. Further-more, the combination of sociocultural profiles as a product of CART analysis with the NRL geospatial risk assessment scores suggests that a convergence of complementary research approaches can draw attention to areas at greater risk and achieve greater specificity in risk prediction.
The association between driving distances to terrorist safe houses and attack probability is notable, especially given the large role that barriers, checkpoints, and road closures play in access to target sites. This suggests that tactical and strategic variables related to known cen-ters of support for terrorist activities and navigability to target sites are worthy of further data collection and analysis.
Perhaps the most striking finding was the robust relationship between multiple types of sociocultural precipitants and attack fre-quency in Jerusalem. Jewish religious holidays and political negotia-tions were both associated with a greater likelihood of attack within the time windows specified for each type of event. Such findings sug-gest that, likely for a mixture of tactical and strategic reasons, terrorist groups respond to the behaviors of their target population.
Conclusions from Qualitative Data Analysis
Consistent with rational choice hypotheses suggesting that attack-ers would trade off between risk (carrying out the attack) and reward (numbers of casualties), suicide bombers targeted accessible crowds. The crowds did not have to be massive; “good enough” thresholds appeared to be in effect. In general, suicide bombers were content to target groups of dozens or even smaller—but a group needed to be more than a few people.
However, attackers were not simply targeting groups of people at random. First, attackers were very repetitive in making target decisions.

Conclusions and recommendations 55
Over one-third of attacks were repeat strikes on locations attacked pre-viously. Locations that have been targeted need to be considered very high risk for future attacks.
Next, attackers most often targeted places that were not just where people congregated but that were well-known. The three most frequent characteristics of attacked sites were that they were the city’s principal shopping locations, on one of a city’s main streets for shop-ping and entertainment, and/or were iconic locations in the city. Almost 70 percent of the attack locations had at least one of these three characteristics. This conclusion is consistent with both crime pattern and bounded rationality hypotheses—attackers tended to choose sites that constituted “obvious” choices—they would be well known to the attackers, perhaps offering some additional symbolic value, and would likely have “good-enough” groups of accessible crowds to attack.
The remaining 30 percent of sites also offered justifications for why they were attacked; as noted, every site had at least one attribute code beyond just having accessible crowds. That fact aside, the com-parative range and sparseness of the other codes makes any inferences about them preliminary.
Recommendations for Further Research
As mentioned earlier, this study was essentially a proof of principle aimed at suggesting that sociocultural, economic, and political fac-tors have a role in predicting suicide attacks by providing the needed context for NRL’s geospatial analyses. We have indeed demonstrated that these factors enhance our ability to predict these attacks. How-ever, building on what we have accomplished, there are ways to further improve our results.
Regression Analyses and Classification
This short-term project was exploratory, so we placed a premium on assembling a high-quality, comprehensive data set and demonstrating its potential utility in adding to a purely geospatial model of suicide bombing target preferences. Future analytic efforts would do well to
56 Predicting Suicide Attacks
incorporate better methods of classification and supervised learning. Future exploration should include support vector machines, boosting, and clustering (Hastie Tibshirani, and Friedman, 2009). In addition, the classification trees should be used to compare different loss matri-ces where particular errors, such as false negatives, are penalized more than false positives.
The regression analyses we performed were all cross-sectional. However, sociocultural, geospatial, and even precipitant event deter-minants of suicide bomb attack sites likely change over time. For exam-ple, terrorist organizations and safe houses rise and fall in influence over time. Roads are closed, barriers built, and checkpoints opened and closed. Neighborhoods also change over time, both in the struc-tures built within them and their demographic composition. Multiple years of data exist for voting patterns (1996, 1999, and 2003), and the Israeli census has 2008 data available in addition to the 1995 census data used in our analyses. Furthermore, geospatial data are available for specific years, which would enable the modeling of changing road networks and other geospatial features. Accessing data collected annu-ally on road networks, barriers, and businesses would permit a more-comprehensive longitudinal analysis. Having a higher level of detail on the road networks, integrated with barrier data, would allow more-accurate depiction of travel time and distances. Access to a database of annual business information could also lead to more-advanced spatial analysis to calculate and predict trends in the types and locations of businesses over a range of desired years. A panel regression using multi-ple years of data would permit modeling of the influence of changes in the social and geospatial contexts relative to patterns of suicide bomb-ing attacks over time.
Additionally, the outcomes are likely to be spatially correlated; that is, the outcomes in one neighborhood are likely correlated with the outcomes in nearby neighborhoods. The regression models presented in the quantitative analyses did not examine or account for this corre-lation among neighborhoods. Future analysis should consider the spa-tially correlated regression residuals and apply a spatial smoothing vari-able to the regression models and should consider both spatially and geographically weighted regression models. This parameter would spa-

Conclusions and recommendations 57
tially smooth the estimates and adjust for spatial correlation. A major benefit of using a spatial smoothing parameter is the ability to reduce the residuals, which results in smaller prediction errors and ultimately improves model fits.
For the quantitative analyses in this report, we focused on attacks in the city of Jerusalem. Further analyses could not only make use of attack data from all four cities in the Suicide Terrorism Database (Jerusalem, Haifa, Netanya, and Tel Aviv) but could also draw on sui-cide bombing attacks (and relevant geospatial and sociocultural data) beyond these cities. Furthermore, analyses could model other types of terrorism, such as shooting attacks and nonsuicide bomb attacks.
Sociocultural Precipitants
We specified the relevant time window for sociocultural precipitants a priori, rather than permitting an infinite time window or develop-ing a set of models to pinpoint the most optimal or influential time window. Future analytic efforts should focus on taking this more- flexible approach to the proximity of sociocultural precipitants to attacks in time and could also consider additional precipitants (see Appendix A). Furthermore, future analyses should take a “neighbor-hood free” time series approach to all suicide bombing attacks in the region (or even nonsuicide terrorism) to determine how sociocultural precipitants affect terrorism more broadly. Finally, future analyses should take a more nuanced approach to linking sociocultural precipi-tants to types of neighborhoods. For example, one might hypothesize that Jewish religious holidays would be a more relevant precipitant for heavily religious neighborhoods, where the target population will con-gregate in greater numbers to prepare for and observe the holiday. An analysis taking this into account would weigh the temporal variable for Jewish religious holidays more heavily in such neighborhoods.
Transferability
The analysis in this paper, and in other NRL and University of Okla-homa research, is limited to preferences of Palestinian suicide bomb-ers in Israel. While the comparison of EVIL DONE attributes (devel-oped to predict targets of airplane attacks) to inferred codes showed

58 Predicting Suicide Attacks
that there may be a great deal of similarity between attacked sites in Israel and elsewhere, we do expect there to be significant differences. In brief, the suicide bombings in Israel took place during open hostili-ties between Israel and Palestinians, and Palestinian terrorist organi-zations have long espoused ideologies that glorify suicide operations. Neither condition is likely to apply to plots in the United States and other Western countries. In the United States, for example, there is no open conflict between the U.S. government and minority groups, and suicide attacks have been extremely rare (9/11 is the only example). Therefore, we believe that directly transferring the target preference results from Israel to other countries has limited value.
However, the methods used to assess target preferences in Israel could be transferred to the United States and other countries. Qualita-tive data analysis can be applied directly to data from the United States and other countries. The quantitative techniques need to be restruc-tured slightly, but the underlying methods will still apply. We believe there is value in applying the methods NRL, RAND, and the Univer-sity of Oklahoma have developed to targeted sites in the United States and other Organization for Economic Cooperation and Development countries. To increase the amount of available data, we recommend including all sites seriously considered (e.g., where site surveillance took place) during terrorist plots, whether or not those plots were success-ful. Even unsuccessful plots can provide important insights into what would-be terrorists are finding to be ideal targets.

59
APPenDIX A
Sociocultural Precipitant Database
We developed a database of 1,513 incidents and dates of significance related to Israel and Palestine with a possible role in precipitating sui-cide bomb attacks. Table A.1 describes the major categories of events we included.
Certain incidents, such as the Arab League Summit, dates of religious observance, and nonreligious days of commemoration, recur over time. In contrast, such incidents as political assassinations, violent
Table A.1Precipitants Identified
Precipitant Category EventsNumber
Identified
Civil-political events negotiationsChanges in leadershipPublic statementsAssassinationsDays of commemorationOther
211
religious holidays JewishMuslim
814
IDF military operations Airstrikestargeted killingsIncursions
292
Other terrorism Suicide attacks outside area of interestnon–suicide bomb attacksrocket attacksShooting attacks
180
Palestinian infighting 16
60 Predicting Suicide Attacks
operations, and public statements by Arab or Israeli public figures are one-time occurrences.
We developed a database of significant dates related to Israel and Palestine, and we have enclosed a compact disk with the database on it. Here, we will offer a brief explanation of the contents of the database and provide examples of the dates selected and the data entered within each section and subheading.
Our analysis began with an aerial view of the 13-year period in question, for both Palestinians and Israelis. We examined broad shifts in political leadership and the social landscape and labeled the different periods accordingly, for example, as the Second Intifada, the Yitzhak Rabin years, or the Yasser Arafat years. We then researched the period in more detail and examined specific dates of significance. The data-base includes dates from before and after the actual 13-year period of analysis; we included additional dates of significance to allow future analysis to focus on an extended period.
The database consists of five sections: Civil/Political, Religious, IDF Military Operations, Other Terrorism/Violent Operations (Pal-estinians Versus Non-Arab Israelis), and Palestinian Infighting. Each row in the database represents the date of a specific significant event; if multiple events occurred on the same date, each received a separate row. Each distinct section of the database begins with a separate description column that is followed by subheadings relevant to the section. A “1” is entered into a row under the appropriate subheading if the event occurred on that date. Setting aside the initial section on periods, there are 24 subheadings in all. Adjacent to the section on periods, there is a single column for specific dates in the database; date, month, and year.
The following subsections describe the five categories listed in Table A.1.
Civil and Political
The civil-political section focuses on political negotiations, Arab and Israeli changes in leadership, public statements by Arab and Israeli public figures, political assassinations, withdrawals, regional warfare,

Sociocultural Precipitant Database 61
major protests and demonstrations, and nonreligious days of commem-oration. Brief definitions (when applicable) and examples follow below.
High-Level Negotiations/Extraregional Involvement
Meetings, negotiations, and decisions on Israeli-Palestinian issues that involve foreign leaders and external involvement. These proceedings need not be exclusively focused on Israel-Palestine. For example,
• July 11, 2000: Camp David Summit 2000 convenes in the United States. Bill Clinton, Ehud Barak, and Yasser Arafat are present.
• March 27, 2002: Arab League Summit convenes in Beirut, Leba-non. Arab states sign the Arab Peace Initiative (first known as the Saudi Peace Plan) with Israel, proposed by Saudi Crown Prince Abdullah. Despite the initiative, the Beirut summit formally sup-ports the Second Intifada.
Israel-Palestinian Negotiations
Meetings and negotiations between Israeli and Palestinian leadership. For example,
• February 3, 2000: Summit between Prime Minister Ehud Barak and Palestinian Authority (PA) President Yasser Arafat fails. Talks end over disagreement on a promised Israeli withdrawal from the West Bank under the revised Wye Accord.
Inter-Palestinian Negotiations
Internal Palestinian political meetings, negotiations, and decisions. For example,
• March 10, 2003: Central Council of the Palestine Liberation Organization meets in Ramallah and approves Yasser Arafat’s nomination of Mahmoud Abbas (Abu Mazen) to serve as prime minister.
62 Predicting Suicide Attacks
Changes in Leadership—Arab and Israeli
Notable elections, replacements, major changes in political landscape and leadership. For example,
• March 23, 2004: Abdel Aziz Al-Rantisi is named leader of Hamas in the Gaza Strip after the killing of Sheikh Ahmed Yassin.
• January 4, 2006: Prime Minister Ariel Sharon suffers a brain hemorrhage that leaves him in a vegetative state. Ehud Olmert becomes acting prime minister.
Public Statements—Arab and Israeli
Speeches and statements of significance. These may include the formal proceedings of major conferences or meetings, such as the Herzliya Conference in Israel, the Aqaba Summit in Jordan, or the UN Gen-eral Assembly in New York; alternatively, these may be informal state-ments made by public figures that had far-reaching effects. Addition-ally, significant Israeli High Court and Knesset decisions that were made public are included here. For example,
• December 16, 2001: In an announcement from Ramallah head-quarters, Yasser Arafat calls for an end to suicide bombing attacks against Israel as he seeks to reengage with the Jewish state and the international community.
• March 29, 2000: Israeli high court orders that 700 Palestinians be allowed to return to their traditional homes in caves in the southern West Bank.
• September 28, 2000: Campaigning for prime minister at the time, Ariel Sharon visits the Temple Mount complex and the Al-Aqsa Mosque, among the holiest sites in both Judaism and Islam. he declares that the complex would always be under Israeli con-trol. Note that this occurred during ongoing peace negotiations.
Political Assassinations
This category includes both attempted and successful political assassi-nations. There are some parallels to be drawn between the aftereffects of attempted assassinations and successful assassinations, most specifi-

Sociocultural Precipitant Database 63
cally, the anger and retaliation that such events may provoke among those who side with the target of the assassination. For example,
• October 17, 2001: Right-wing Israeli minister Rehavem Zeevi is shot dead in Jerusalem hotel by a Palestinian gunman. This undermines the truce that PA and Israel had signed three weeks earlier. The Syria-based Popular Front for the Liberation of Pales-tine takes responsibility.
Dates of Withdrawals
These dates refer to official Israeli decisions to withdraw from regions and cede control to Palestinian leadership. They are not associated with termination of operations. For example,
• August 15, 2005: Israel begins disengagement from Gaza settle-ments and four West Bank settlements. Today is the deadline for Israeli settlers to accept government compensation and volun-tarily vacate their houses; those who refuse are evicted by the IDF over the next several days.
Regional Warfare
For example,
• April 11, 1996: Operation Grapes of Wrath, a 16-day military operation carried out by IDF in southern Lebanon in response to Hezbollah’s Katyusha rocket strikes on the Israeli population along the border with Lebanon, begins.
Major Protests and Demonstrations—Arab and Israeli
For example,
• July 25, 2004: 130,000 Israeli opponents of Israeli disengagement form a human chain from Nisanit in the Gaza strip to the West-ern Wall in Jerusalem.

64 Predicting Suicide Attacks
Nonreligious Days of Commemoration—Arab and Israeli
Cyclical dates of significance. These may operate on the Hebrew calen-dar or on the Gregorian calendar. For example,
• Annually, on May 15: Yom An-Nakba [Day of Catastrophe] is the Palestinian day of solidarity and was inaugurated by Yasser Arafat. Observed internationally, it marks the anniversary of the creation of state of Israel. As such, Nakba Day events may coin-cide with Israeli Independence Day celebrations, although Nakba Day is set on the Gregorian calendar date, and Independence Day rotates on the Hebrew calendar. The day often involves major vio-lent clashes between Palestinians and the IDF.
• Annually, on 5 Iyar: Yom Ha’atzma’ut [Day of Independence for state of Israel] occurs on this date on the Hebrew calendar. The Gregorian date changes every year.
Religious
The data on religious holidays include observance dates for both Islam and Judaism. The Jewish holidays include the Yamim Nora’im, which includes Rosh Hashanah and Yom Kippur, as well as the more com-munal celebrations of Purim, Passover, Sukkot, and Hanukkah. We included Tisha B’Av and Simchat Torah/Shemini Atzeret as well, in addition to several observed days of Sabbath, a weekly observance that lasts for 25 hours every Friday evening through Saturday night.
The analysis excluded relatively minor Jewish holidays that are not typically afforded the same degree of observance as the included holidays. For example, Tu Bishevat and the monthly Rosh Chodesh (New Month) observances are relatively minor and were thus excluded. Observances of Jewish holidays, including the Sabbath, most often begin at sundown on the eve of the first day. As such, all holidays are afforded a separate, additional day on the timeline to recognize the actual start date. The database includes Sabbath observances that occurred closely in time to violent operations and or other religious
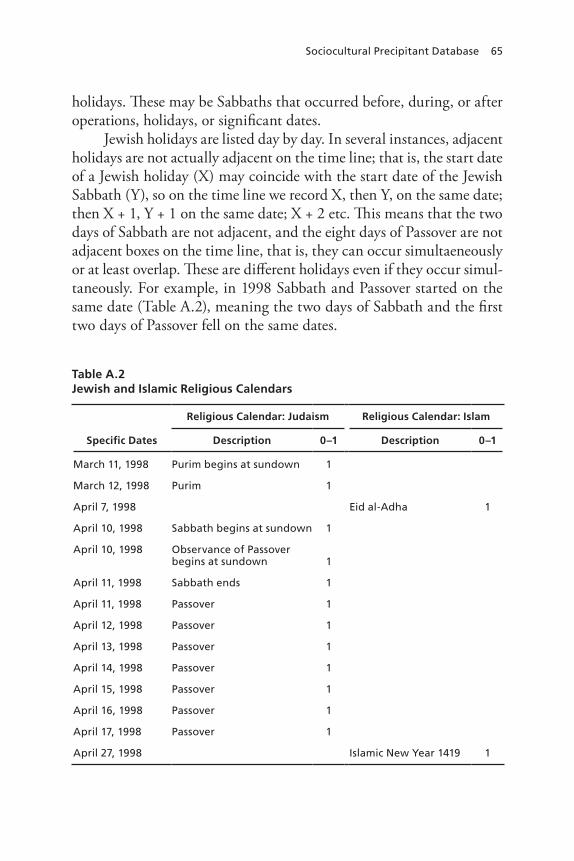
Sociocultural Precipitant Database 65
holidays. These may be Sabbaths that occurred before, during, or after operations, holidays, or significant dates.
Jewish holidays are listed day by day. In several instances, adjacent holidays are not actually adjacent on the time line; that is, the start date of a Jewish holiday (X) may coincide with the start date of the Jewish Sabbath (Y), so on the time line we record X, then Y, on the same date; then X + 1, Y + 1 on the same date; X + 2 etc. This means that the two days of Sabbath are not adjacent, and the eight days of Passover are not adjacent boxes on the time line, that is, they can occur simultaeneously or at least overlap. These are different holidays even if they occur simul-taneously. For example, in 1998 Sabbath and Passover started on the same date (Table A.2), meaning the two days of Sabbath and the first two days of Passover fell on the same dates.
Table A.2Jewish and Islamic Religious Calendars
Specific Dates
Religious Calendar: Judaism Religious Calendar: Islam
Description 0–1 Description 0–1
March 11, 1998 Purim begins at sundown 1
March 12, 1998 Purim 1
April 7, 1998 eid al-Adha 1
April 10, 1998 Sabbath begins at sundown 1
April 10, 1998 Observance of Passover begins at sundown 1
April 11, 1998 Sabbath ends 1
April 11, 1998 Passover 1
April 12, 1998 Passover 1
April 13, 1998 Passover 1
April 14, 1998 Passover 1
April 15, 1998 Passover 1
April 16, 1998 Passover 1
April 17, 1998 Passover 1
April 27, 1998 Islamic new Year 1419 1
66 Predicting Suicide Attacks
Military Operations (IDF and Palestinian)
The database lists official military operations day by day. We included all official IDF operations that we discovered, and after determining the general location of each operation, we categorized it as a targeted killing; an air strike; or as an incursion, raid, or ambush. This category includes IDF arrests of notable public figures, under the heading of incursion, raid, or ambush. We did not include routine incursions or IDF patrols but rather the more notable operations that drew local, regional, or international attention. We included every day of extended IDF operations as a separate line of data. Brief definitions (when appli-cable) and examples follow below.
Targeted Killings
This category covers IDF operations that focused on a particular person or set of people. For example,
• October 22, 2001: The top Hamas bomb maker on Israel’s most-wanted list is blown up in his car in the West Bank city of Nablus. This is the fourth Israeli assassination in nine days.
Airstrikes
This category covers IDF aerial attacks on Palestinian targets. For example,
• March 28, 2001: IDF begins rocket attacks against Palestinian targets in Ramallah and Gaza on Wednesday. Israel calls these actions defensive after multiple Palestinian attacks on the previ-ous two days. Yasser Arafat’s residence in Gaza is also a target, although he is not there at the time.
Incursions, Raids, Ambushes, or Arrests
For example,
• May 7, 2001: An IDF naval commando unit captures a Santorini-Lebanese boat headed to PA-controlled Gaza. The boat found to be packed with weapons.
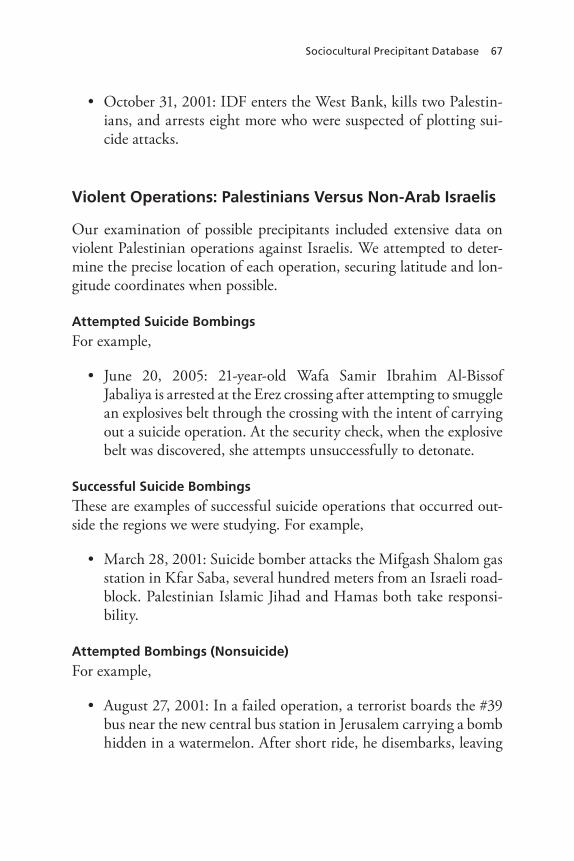
Sociocultural Precipitant Database 67
• October 31, 2001: IDF enters the West Bank, kills two Palestin-ians, and arrests eight more who were suspected of plotting sui-cide attacks.
Violent Operations: Palestinians Versus Non-Arab Israelis
Our examination of possible precipitants included extensive data on violent Palestinian operations against Israelis. We attempted to deter-mine the precise location of each operation, securing latitude and lon-gitude coordinates when possible.
Attempted Suicide Bombings
For example,
• June 20, 2005: 21-year-old Wafa Samir Ibrahim Al-Bissof Jabaliya is arrested at the Erez crossing after attempting to smuggle an explosives belt through the crossing with the intent of carrying out a suicide operation. At the security check, when the explosive belt was discovered, she attempts unsuccessfully to detonate.
Successful Suicide Bombings
These are examples of successful suicide operations that occurred out-side the regions we were studying. For example,
• March 28, 2001: Suicide bomber attacks the Mifgash Shalom gas station in Kfar Saba, several hundred meters from an Israeli road-block. Palestinian Islamic Jihad and Hamas both take responsi-bility.
Attempted Bombings (Nonsuicide)
For example,
• August 27, 2001: In a failed operation, a terrorist boards the #39 bus near the new central bus station in Jerusalem carrying a bomb hidden in a watermelon. After short ride, he disembarks, leaving

68 Predicting Suicide Attacks
bomb underneath the back seat. Shortly thereafter, he tries to det-onate the bomb using a mobile phone but is not successful. The bus driver later discovers the bomb, which the police neutralize. The Popular Front for the Liberation of Palestine is responsible.
Successful Bombings (Nonsuicide)
For example,
• December 12, 2004: An explosion destroys an Israeli Joint Veri-fication Team terminal near the Egypt-Gaza border (at that time, the area was still under Israeli control—by 2005, Israel evacuated Gaza as part of disengagement). The explosive charge was planted via tunnels from the Gaza side. Hamas and Fatah Eagles take responsibility.
Rocket Attacks
For example,
• June 28, 2004: Hamas operatives in the Gaza strip fire Qassam rockets that land near a nursery school in the northern Negev town of Sderot.
Shooting Attacks
These include Palestinian raids on and ambushes of Israelis. For example,
• March 12, 2002: Gunmen in IDF uniforms ambush vehicles near Kibbutz Matzuva. The vehicles were traveling between Shlomi and Kibbutz Matzuva, near the northern border with Lebanon. Fatah’s Al-Aqsa Martyrs’ Brigade is responsible.
Palestinian Infighting
This category records instances of Palestinian internal conflict, whether nonviolent political conflict or violent infighting. For example,

Sociocultural Precipitant Database 69
• July 31, 2004: The Al-Aqsa Martyrs’ Brigade burns down the PA security forces’ HQ in Jenin. Al-Aqsa Martyrs’ Brigade set the HQ on fire allegedly because the new mayor, Qadorrah Moussa, who was appointed by Yasser Arafat, had refused to pay brigade salaries or to cooperate with it.
• June 6, 2003: Abdel Aziz al-Rantisi, cofounder of Hamas, breaks off discussions with PA Prime Minister Mahmoud Abbas, who had called for an end to armed resistance.

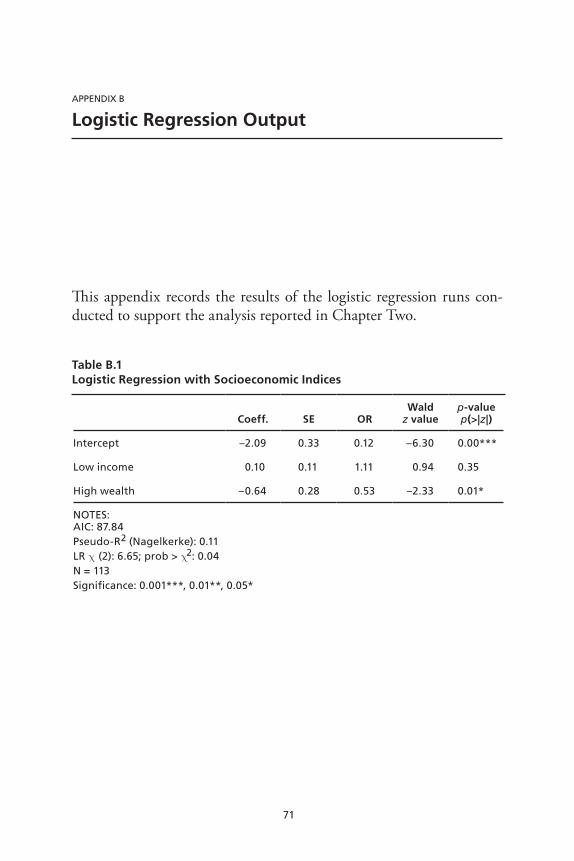
71
APPenDIX B
Logistic Regression Output
This appendix records the results of the logistic regression runs con-ducted to support the analysis reported in Chapter Two.
Table B.1Logistic Regression with Socioeconomic Indices
Coeff. SE ORWald
z valuep-valuep(>|z|)
Intercept –2.09 0.33 0.12 –6.30 0.00***
Low income 0.10 0.11 1.11 0.94 0.35
high wealth –0.64 0.28 0.53 –2.33 0.01*
nOteS:AIC: 87.84Pseudo-r2 (nagelkerke): 0.11Lr χ (2): 6.65; prob > χ2: 0.04n = 113Significance: 0.001***, 0.01**, 0.05*
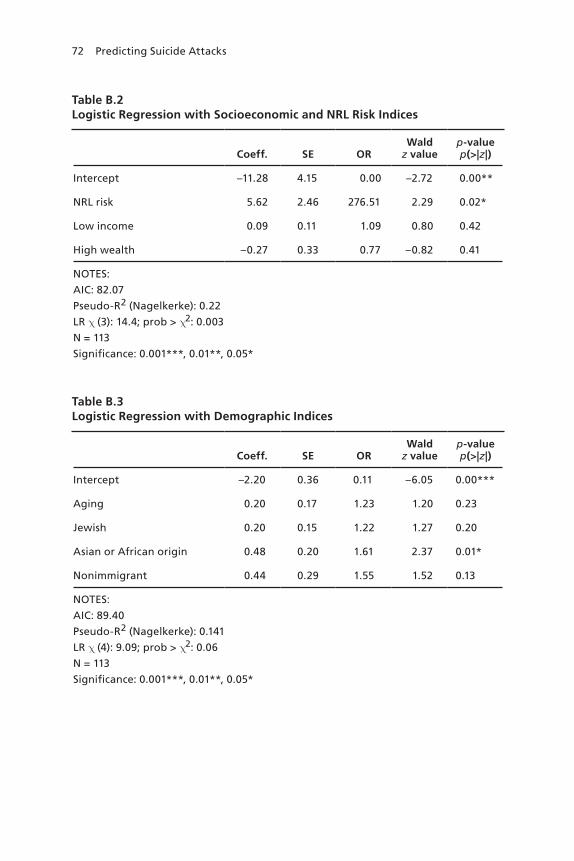
72 Predicting Suicide Attacks
Table B.2Logistic Regression with Socioeconomic and NRL Risk Indices
Coeff. SE ORWald
z valuep-valuep(>|z|)
Intercept –11.28 4.15 0.00 –2.72 0.00**
nrL risk 5.62 2.46 276.51 2.29 0.02*
Low income 0.09 0.11 1.09 0.80 0.42
high wealth –0.27 0.33 0.77 –0.82 0.41
nOteS:
AIC: 82.07
Pseudo-r2 (nagelkerke): 0.22
Lr χ (3): 14.4; prob > χ2: 0.003
n = 113
Significance: 0.001***, 0.01**, 0.05*
Table B.3Logistic Regression with Demographic Indices
Coeff. SE ORWald
z valuep-valuep(>|z|)
Intercept –2.20 0.36 0.11 –6.05 0.00***
Aging 0.20 0.17 1.23 1.20 0.23
Jewish 0.20 0.15 1.22 1.27 0.20
Asian or African origin 0.48 0.20 1.61 2.37 0.01*
nonimmigrant 0.44 0.29 1.55 1.52 0.13
nOteS:
AIC: 89.40
Pseudo-r2 (nagelkerke): 0.141
Lr χ (4): 9.09; prob > χ2: 0.06
n = 113
Significance: 0.001***, 0.01**, 0.05*
Logistic regression Output 73
Table B.4Logistic Regression with Demographic and NRL Risk Indices
Coeff. SE ORWald
z valuep-valuep(>|z|)
Intercept –11.21 4.43 0.00 –2.53 0.01*
nrL risk 5.55 2.63 256.00 2.11 0.03*
Aging 0.04 0.19 1.04 0.22 0.83
Jewish 0.07 0.16 1.07 0.40 0.69
Asian or African origin 0.27 0.22 1.31 1.25 0.21
nonimmigrant 0.14 0.31 1.15 0.47 0.64
nOteS:
AIC: 85.55
Pseudo-r2 (nagelkerke): 0.228
Lr χ (5): 14.95; prob > χ2: 0.01
n = 113
Significance: 0.001***, 0.01**, 0.05*
Table B.5Logistic Regression with Political Indices
Coeff. SE ORWald
z valuep-valuep(>|z|)
Intercept –1.90 0.28 0.15 –6.73 0.00***
Orthodox –0.11 0.17 0.90 –0.61 0.54
non-Arab –0.15 0.18 0.86 –0.84 0.40
nOteS:
AIC: 93.46
Pseudo-r2 (nagelkerke): 0.02
Lr χ (2): 1.03; prob > χ2: 0.60
n = 113
Significance: 0.001***, 0.01**, 0.05*

74 Predicting Suicide Attacks
Table B.6Logistic Regression with Political and NRL Risk Indices
Coeff. SE ORWald
z valuep-valuep(>|z|)
Intercept –12.79 3.99 0.00 –3.21 0.001**
Orthodox –0.05 0.19 0.95 –0.28 0.004**
non-Arab –0.20 0.21 0.82 –0.95 0.780
nrL risk 6.58 2.32 717.70 –2.84 0.341
nOteS:
AIC: 82.36
Pseudo-r2 (nagelkerke): 0.22
Lr χ (3): 14.1; prob > χ2: 0.003
n= 113
Significance: 0.001***, 0.01**, 0.05*
Table B.7Logistic Regression with All Variable Indices
Coeff. SE ORWald
z valuep-valuep(>|z|)
Intercept –2.42 0.43 0.09 –5.58 0.00***
Low income, Orthodox –0.02 0.09 0.98 –0.22 0.82
Older non-Jewish 0.44 0.19 1.55 2.34 0.01*
Younger nonimmigrant –0.04 0.16 0.96 –0.27 0.79
Jewish, Asian, or African 0.33 0.17 1.39 1.90 0.06
educated Israeli, non-right 0.57 0.29 1.77 2.00 0.04*
non-Orthodox, non-Arab 0.18 0.22 1.19 0.80 0.42
nOteS:
AIC: 88.6
Pseudo-r2 (nagelkerke): 0.21
Lr χ(6): 13.9; prob > χ2: 0.031
n = 113
Significance codes: 0.001***, 0.01**, 0.05*
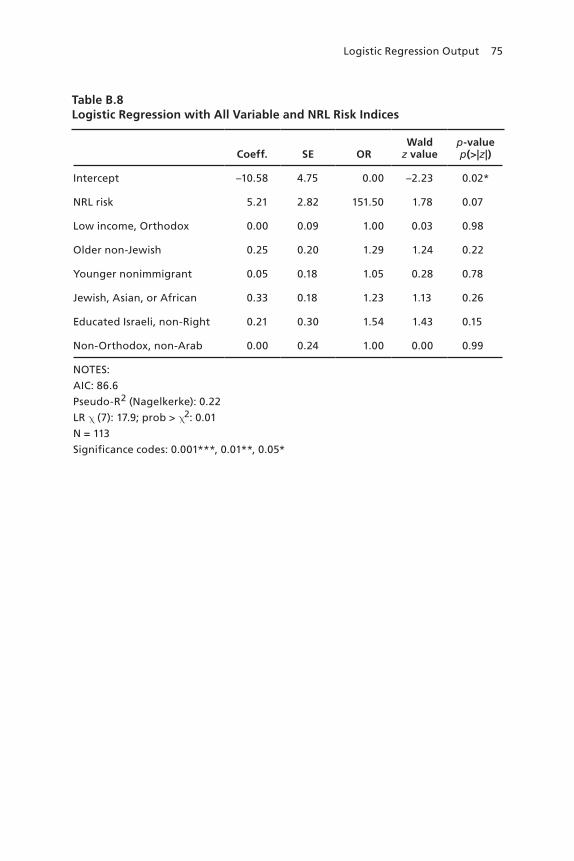
Logistic regression Output 75
Table B.8Logistic Regression with All Variable and NRL Risk Indices
Coeff. SE ORWald
z valuep-valuep(>|z|)
Intercept –10.58 4.75 0.00 –2.23 0.02*
nrL risk 5.21 2.82 151.50 1.78 0.07
Low income, Orthodox 0.00 0.09 1.00 0.03 0.98
Older non-Jewish 0.25 0.20 1.29 1.24 0.22
Younger nonimmigrant 0.05 0.18 1.05 0.28 0.78
Jewish, Asian, or African 0.33 0.18 1.23 1.13 0.26
educated Israeli, non-right 0.21 0.30 1.54 1.43 0.15
non-Orthodox, non-Arab 0.00 0.24 1.00 0.00 0.99
nOteS:
AIC: 86.6
Pseudo-r2 (nagelkerke): 0.22
Lr χ (7): 17.9; prob > χ2: 0.01
n = 113
Significance codes: 0.001***, 0.01**, 0.05*


77
About the Authors
Walter L. Perry
Walter Perry (Ph.D., Information Technology, George Mason Univer-sity) has most recently conducted research identifying the behavioral and social indicators of potential violent acts, focusing primarily on information fusion methods to combine indicator reports. He is con-ducting research on predictive policing techniques for the National Institute of Justice. Prior to these studies, he codeveloped an algorithm for the Defense Intelligence Agency designed to indicate when a ter-rorist group is on the verge of acquiring weapons of mass destruction. He conducted research into methods for developing data fusion and information-processing algorithms and analyzing large command-and-control problems through network modeling. He has also devel-oped several metrics of the impact of command and control on military operations for both Army and Navy applications. Perry joined RAND in 1984 after a 20-year career with the U.S. Army Signal Corps. He has taught electrical engineering and computer sciences at The George Washington University, statistics at George Mason University, and mathematics at West Point.
Claude Berrebi
Claude Berrebi (Ph.D., Economics, Princeton University, MBA, Hebrew University) is a senior lecturer at Hebrew University’s School of Public Policy and an economist at RAND. Prior to joining Hebrew

78 Predicting Suicide Attacks
University, he was a Professor of Economics in the Pardee RAND Graduate School and a Visiting Associate Professor of Economics at UCLA. His terrorism and counterterrorism research has been exten-sively cited and published in top economics, public policy, and politi-cal science academic journals. He recently contributed to two RAND books, Social Science for Counterterrorism: Putting the Pieces Together and Dilemmas of Intervention: Social Science for Stabilization and Recon-struction. His work at RAND addresses major public policy concerns related to security, economics, politics, and other topical issues.
Ryan Andrew Brown
Ryan Brown (Ph.D., Anthropology, Emory University) has used a wide variety of qualitative and quantitative methods to conduct research on the determinants of violent and risk-taking behaviors in both domestic and international settings. At RAND, he has led multiple teams on projects incorporating social sciences into intelligence-gathering and military operations, including support to Marine Corps Expedition-ary Intelligence Analysis. He recently spent four months working at the Special Forces Command in Afghanistan, where he led a team of RAND analysts and provided support to the command from the tac-tical to the strategic level regarding village stability operations. While at RAND, he has worked on multiple projects related to terrorism, counterinsurgency, and irregular warfare and the individual determi-nants of risky behavior in the Middle East.
John Hollywood
John Hollywood (Ph.D., Operations Research, MIT) is a full opera-tions researcher at the RAND Corporation, where he applies quantita-tive and qualitative analytics to security policy, including criminal jus-tice, homeland security, counterinsurgency, and defense systems. His recent focus has been on improving information collection and analy-sis methods to prevent acts of violence, ranging from violent crime to

About the Authors 79
terrorism to insurgent attacks. He also has significant experience in analyzing and designing information networks to meet the needs of multiple types of users. His areas of expertise include predictive analy-sis (data mining), information systems research, social network analy-sis, evaluation, and systems engineering. Recent projects include exam-ining combat search and rescue networks, assessing characteristics of suicide bombing targets in Israel, assessing methods used to foil U.S. terrorist plots, and using 911 call data to predict crime hot spots.
Amber Jaycocks
Amber Jaycocks (M.Phil., Pardee RAND Graduate School) is a doc-toral candidate at the Pardee RAND Graduate School and an assis-tant policy analyst at the RAND Corporation. Her research is special-ized in applied statistical approaches across defense, finance, health, and environmental policy settings. Her research uses both quantita-tive and qualitative methods from various fields (computer science, sta-tistics, natural language processing, and economics). At RAND, she has developed anomaly detection algorithms for the Army, supported analysis for Afghanistan village stability operations, constructed math-ematical models for HIV and flu transmission, modified dimension- reduction algorithms to deal with model uncertainty, and implemented text mining and topic models. Prior to RAND, Amber worked as an engineer with the VOLPE National Transportation Systems Center and as a quantitative financial researcher with State Street Associates. She holds a B.S. in Environmental Engineering from the Massachu-setts Institute of Technology.
Parisa Roshan
Parisa Roshan (B.A. in Political Science from Barnard College, Colum-bia University) is a research assistant at the RAND Corporation and a Master of Public Policy candidate at the Kennedy School of Gov-ernment, Harvard University. Prior to joining the National Security
80 Predicting Suicide Attacks
Research Division at RAND in 2009, Roshan held positions at the U.S. Department of State, Lehman Brothers, and Barclays Capital. At Harvard, she is affiliated with the Mossavar-Rahmani Center for Busi-ness and Government, and she recently worked with the Belfer Center for Science and International Affairs and the Center for Public Lead-ership after having been selected to participate in their 2012 National Security Crisis Simulation. Additionally, in 2011 Roshan accepted a nomination for the Women in Public Service Project, a new initiative at the U.S. Department of State.
Thomas Sullivan
Thomas Sullivan (Ph.D. Computational Science and Informatics, George Mason University) is an independent technology strategy con-sultant. He spent 13 years as an information scientist at the RAND Corporation, where he participated in or led projects in the national security area. He deployed to Baghdad, Iraq, in 2004 as a strategic planner for the Coalition Provisional Authority and again in 2005 in support of the Coalition’s counter–improvised explosive device (IED) effort. He jointly developed an algorithm for the intelligence commu-nity designed to indicate whether a terrorist group was likely to acquire weapons of mass destruction. He was a professor at the RAND Pardee Graduate School, where he taught advanced statistics and also lectured on quantitative approaches for assessing IED threats to deploying offers at the Army Logistics University. He currently has seven patents pending with the U.S. Patent and Trademark Office and is actively engaged as an advisor to the technology startup community in South-ern California.
Lisa Miyashiro
Lisa Miyashiro (M.S., Public Policy and Management, Carnegie Mellon University) is a research programmer/analyst at the RAND Corporation. She has extensive experience with analyzing data on a
About the Authors 81
range of project topics including international and domestic health, military, and criminal justice fields. She has developed expertise in using geographic information systems (GIS), ATLAS.ti, SAS, and GeoClip to perform a combination of quantitative, qualitative, and spatial analysis. For a project designed to assess access to health care for recently released prisoners, she geocoded all returnees within the state of California and all mental health, substance abuse, and hospital facilities using GIS. The spatial information was then used to analyze the health care access and utilization of returnees using census vari-ables, hospital data, and drive-time estimations. Another project that she worked on combined qualitative, spatial, and quantitative methods on a project with Blue Cross Blue Shield. She was in charge of inven-torying and uploading the interview data from the research surveyors, coding the transcripts, and providing descriptive feedback on common themes. The data were then processed with SAS through regression analysis to identify key areas of concern. She used GIS to geocode and assign urban or rural designations using census-designated geographic identifiers. She joined RAND in 2007 and teaches RAND Ph.D. Fel-lows GIS and Atlas.ti.


83
Bibliography
Abdi, Hervé, and Lynne J. Williams, “Principal Component Analysis,” Wiley Interdisciplinary Reviews: Computational Statistics, Vol. 2, No. 4, July/August 2010, pp. 433–459.
Atran, Scott, “Mishandling Suicide Terrorism,” The Washington Quarterly, Vol. 27, No. 3, 2004, pp. 67–90.
Bernard, H. Russell, and Gery W. Ryan, Analyzing Qualitative Data: Systematic Approaches, Thousand Oaks, Calif.: Sage, 2010.
Berrebi, Claude, “Evidence About the Link Between Education, Poverty and Terrorism Among Palestinians,” Peace Economics, Peace Science and Public Policy, Vol. 13, No. 1, 2007.
Berrebi, Claude, and Esteban F. Klor, “On Terrorism and Electoral Outcomes: Theory and Evidence from the Israeli-Palestinian Conflict,” Journal of Conflict Resolution, Vol. 50, No. 6, December 2006, pp. 899–925.
———, “Are Voters Sensitive to Terrorism? Direct Evidence from the Israeli Electorate,” American Political Science Review, Vol. 102, No. 03, August 2008, pp. 279–301.
Berrebi, Claude, and Darius Lakdawalla, “How Does Terrorism Risk Vary Across Time and Space? An Analysis Based on the Israeli Experience,” Defence and Peace Economics, Vol. 18, No. 2, April 2007, pp. 113–131.
Brantingham, Paul J., and Patricia L. Brantingham, Patterns in Crime, New York: Macmillan, 1984.
———, “Crime Pattern Theory,” presentation to the Center for Analysis and Modeling of Security, Santiago, Chile, 2010. As of December 20, 2010: http://www.ceamos.cl/ceamos/images/stories/actividadesyeventos/pattern_theory1.pdf
Breiman, Leo, Heuristics of Instability in Model Selection, Berkeley, Calif.: University of California at Berkeley, Statistics Department, 1994.
84 Predicting Suicide Attacks
Breiman, Leo, Jerome Friedman, Charles J. Stone, and R. A. Olshen, Classification and Regression Trees, CRC Press, 1984.
Browning, Christopher R., Kathleen A. Cagney, and Ming Wen, “Explaining Variation in Health Status Across Space and Time: Implications for Racial and Ethnic Disparities in Self-Rated Health,” Social Science & Medicine, Vol. 57, No. 7, 2003, pp. 1221–1235.
Cameron, A. Colin, and Pravin K. Trivedi, Regression Analysis of Count Data, New York: Cambridge Press, 1998.
Clarke, Ronald V., and Graeme R. Newman, Outsmarting the Terrorists, Santa Barbara, Calif.: ABC-CLIO Greenwood, 2006.
Gruenewald, Tara. L., Teresa E. Seeman, Carol D. Ryff, Arun S. Karlamangla, and Burton H. Singer, “Combinations of Biomarkers Predictive of Later Life Mortality,” Proceedings of the National Academy of Sciences, Vol. 103, No. 38, 2006, pp. 14158–14163.
Hastie, Trevor, Robert Tibshirani, and Jerome Friedman, The Elements of Statistical Learning: Data Mining, Inference, and Prediction, 2nd ed., Berlin, Germany: Springer Verlag, 2009.
Kaiser, Henry F., “The Application of Electronic Computers to Factor Analysis,” Educational and Psychological Measurement, Vol. 20, April 1960, pp. 141–151.
Kliot, Nurit, and Igal Charney, “The Geography of Suicide Terrorism in Israel,” GeoJournal, Vol. 66, No. 4, November 9, 2006, pp. 353–373.
Knime GmbH, Konstanz Information Miner, Version 2.2.2, software, 2010.
Liaw, Andy, and Matthew Wiener, “Classification and Regression by randomForest,” R News, Vol. 2, No. 3, 2002, pp. 18–22.
Lloyd, Stuart P., “Least Square Quantization in PCM,” IEEE Transactions on Information Theory, Vol. 28, No. 2, March 1982, pp. 129–137.
Larose, Daniel T., Discovering Knowledge in Data: An Introduction to Data Mining, Hoboken, N.J.: John Wiley & Sons, Inc., 2005.
NRL—See U.S. Naval Research Laboratory.
Pearson, Karl, “On Lines and Planes of Closest Fit to Systems of Points in Space,” Philosophical Magazine, Vol. 2, No. 6, 1901, pp. 559–572.
Ripley, Brian D., Pattern Recognition and Neural Networks, Cambridge University Press, 1996.
R Development Core Team, R: A Language and Environment for Statistical Computing, R Foundation for Statistical Computing, Vienna, Austria, 2011.
Sandberg, Brian, Suicide Terrorism: Stability and Transfer of Group Targeting Preference, Washington D.C.: U.S. Naval Research Laboratory, undated.
Bibliography 85
Sampson, Robert J., Jeffrey D. Morenoff, and Thomas Gannon-Rowley, “Assessing ‘Neighborhood Effects’: Social Processes and New Directions in Research,” Annual Review of Sociology, Vol. 28, August 2002, pp. 443–478.
Seidel, J. V., Qualitative Data Research, Qualis Research, 1998. As of December 20, 2010: ftp://ftp.qualisresearch.com/pub/qda.pdf
Simon, Herbert A., “A Behavioral Model of Rational Choice,” The Quarterly Journal of Economics, Vol. 69, No. 1, February 1955, pp. 99–118.
Therneau, Terry M., and Elizabeth J. Atkinson, An Introduction to Recursive Partitioning Using the RPART Routines, Mayo Foundation, September 3, 1997. As of October 10, 2010: http://www.mayo.edu/hsr/techrpt/61.pdf
Therneau, T. M., and E. J. Atkinson, R port by Brian Ripley, rpart: Recursive Partitioning, R package version 3.1-50, 2011.
Therneau, Terry M., Beth Atkinson, and Brian Ripley, Recursive Partitioning and Regression Trees, Oxford, U.K., 2008.
U.S. Naval Research Laboratory, Discovering Group Target Preference in Suicide Terrorism: Part 1—A Spatial Preference Methodology, draft, Washington, D.C.: Risk Prediction Project, 2010a.
———, Spatial Target Selection in Suicide Terrorism with Literature Review, Washington, D.C.: Risk Prediction Project, 2010b.
van Um, Eric, “Discussing Concepts of Terrorist Rationality: Implications for Counterterrorism Policy,” Defense and Peace Economics, Vol. 22, No. 2, April 2011, pp. 161–179.


HOMELAND SECURITY AND DEFENSE CENTER
www.rand.org
MG-1246-NRL
$21.95
The Naval Research Laboratory (NRL) set out to develop ways to predict what determines the targets of suicide attacks. While the ultimate goal is to create a list of areas at risk for the U.S. environment, the first phase of development employed a data set from Israel. Initially, NRL focused on spatial attributes, creating its own risk index, but realized that this focus on the where ignored the broader social context, the why. The lab asked RAND to test, as a proof of principle, the ability of sociocultural, political, economic, and demographic factors to enhance the predictive ability of NRL’s methodology. Again using Israel as a sample, RAND created a database that coded for these factors, then conducted both quantitative and qualitative analyses with an eye to determining what puts a given area at greater risk. The quantitative analysis established that these factors are related to the odds of attack within specific neighborhoods and that the relationships held even when controlling for geospatial factors, so they seem to confer risk for reasons beyond their association with geospatial features of neighborhoods. The specifics of the research are limited to the preferences of Palestinian suicide bombers in Israel; however, the methods used to assess target preferences in Israel could be transferred to the United States or other countries. Any results, if proven to be robust, could be used to develop recommendations for heightened public awareness in certain areas.