predicting surface roughness and exit chipping size in...
TRANSCRIPT

Proceedings of the International Conference on Industrial Engineering and Operations Management Rabat, Morocco, April 11-13, 2017
Predicting surface roughness and exit chipping size in BK7 glass during rotary ultrasonic machining by adaptive neuro-
fuzzy inference system (ANFIS)
Saqib Anwar, Mustafa M. Nasr, Mohammed Alkahtani and Abdulaziz Altamimi Industrial Engineering Department
King Saud University Riyadh, Kingdom of Saudi Arabia
[email protected], [email protected], [email protected], [email protected]
Abstract
Due to the increasing use of brittle and nonconductive materials such as optical glass BK7 in optical industry, there is a need to control the processing parameters to improve the quality of the machined components and reduce the machining time and cost. However, manufacturing requires reliable models for predicting of machining performance of rotary ultrasonic Drilling (RUD) of BK7. In this paper, Adaptive neuro-fuzzy inference system (ANFIS) models have been used for modeling and predicting surface roughness and exit chipping size in RUD of BK7 glass. This has been achieved by study the effect of different machining variables such as spindle speed, feed rate, and ultrasonic vibration on surface roughness and exit chipping size which are directly linked with the quality of the drilled hole. Then, ANFIS models have been developed on the basis of full factorial design of experiment approach. The results of the developed model were validated with the regressions models. The results showed that the ANFIS model achieved lower Mean Absolute Percentage Error (MAPE).
Keywords: Optical glass, Rotary ultrasonic, Surface Roughness, chipping size, Adaptive Neuro-Fuzzy Inference.
Abbreviations
ANFIS = Adaptive neuro-fuzzy inference system Dsigmf = Difference of two fuzzy sigmoid membership functions ECH = Exit chipping size F = Feed rate Gaussmf= Gaussian membership function Gbellmf = Generalized bell membership function MAPE= Mean absolute percentage error RSM = response surface method RUM = Rotary ultrasonic machining S = Spindle speed SR = Surface roughness Trapmf = Grapezoidal membership function Trimf = Triangular membership functions UP = Ultrasonic power 1. Introduction
Optical BK7 glass is an important functional material in many high quality optical applications, including component such as lenses of digital cameras, scanners, projectors, and electronics (Lv, 2016) This is owing to its stable optical quality, bubble-free property and low amount of inclusions(Zhang et al., 2013) However, due to its brittleness, poor thermal and electrical conductivities, low fracture toughness and high hardness, it is a difficult-to-
© IEOM Society International
Proceedings of the International Conference on Industrial Engineering and Operations Management Rabat, Morocco, April 11-13, 2017
cut material and incurs high cost with conventional machining (Lv et al., 2013). There is a key importance for identifying and developing the new machining processes capable of overcoming the challenging properties of difficult-to-cut materials for their effective utilization. Rotary Ultrasonic Machining (RUM) is an alternative non-conventional machining process and it has been reported as a promising method to machine hard and brittle materials (Cong et al., 2013). In order to increase the applicability of the new processes such as RUM, it is also import to have capability to predict its output responses corresponding to given input parameters.
Adaptive neuro-fuzzy inference system (ANFIS) is one the modelling approaches which can be applied in various fields such as manufacturing, economic system, and medical system (Kar et al., 2014). ANFIS is a type of artificial neural network according to Takagi–Sugeno fuzzy inference system. The approach has been developed in the 1990s. ANFIS has the ability to integrate the fuzzy logic principles and neural networks, it is capable to capture the benefits of both in a single framework (Jang, 1991). The inference system is corresponding to the set of fuzzy IF-THEN rules which are capable to approximate nonlinear functions (Abraham, 2005). Consequently, ANFIS is considered to be a universal estimator. The core concept behind the neuro fuzzy systems is that, it can combine the human like reasoning style of fuzzy systems with learning and connectionist network in terms of neural structure (Jang, 1993).
Various studies have been reported on applying the ANFIS to predict performance of machining processes such as rotary ultrasonic, wire-EDM etc. (Ekici, 2009) employed ANFIS model to predict the surface roughness and the white layer thickness for wire electrical discharge machining against the input parameters of pulse duration, open circuit voltage, dielectric flushing pressure, and wire feed rate. (Ho et al., 2002) Proposed an ANFIS method to establish a relationship between the surface image features and the actual surface roughness in turning operations. The ANFIS models predicted the surface roughness effectively against the input parameters of feed rate, cutting speed, and depth of cut). A study(Hossain and Ahmad, 2012) presented an ANFIS approach to model and predict the surface roughness for ball end milling operation. The ANFIS predicted results were compared with response surface method (RSM) results. ANFIS results were found to be more accurate than RSM approach. (Neto et al., 2013) Applied an ANFIS approach to model and evaluate the diameter of holes in precision drilling process. The input parameters vibration, electric power, acoustic emission signals, and cutting force. Another study (Suganthi et al., 2013) utilized ANFIS to develop the surface roughness models during turning of aluminum alloys. The results of ANFIS were compared with RSM results and ANFIS showed superior results compared to the RSM results. (Suganthi et al., 2013) observed and predict the material removal rate, surface roughness, and tool wear ratio in micro-EDM process by applying ANFIS models. The process used a multi-process micromachining machine tool. The input parameters modeled were capacitance, feed rate and gap voltage. (Syukor et al.,2011) applied an ANFIS approach to predict the hardness of Titanium Aluminum Nitrite coatings. The results showed that the ANFIS model has the ability to predict the output response with high prediction accuracy. (S. Hari Krishna1, K.Satyanarayana2, 2011) demonstrated the application of the ANFIS method to predict the surface roughness of work piece for various cutting in hard turning. The selected parameters were feed rate and depth of cut in 4 levels, and cutting speed in 3 levels. From the reviewed literature it can be found that there is no work has been reported on the application of adaptive-neuro fuzzy inference system to RUM. The objective of this paper is to develop a prediction model for two major output responses of RUM process namely surface roughness and exit chipping size for drilling holes in BK7 glass while considering the input parameters of spindle speed (S), tool feed rate (F) and ultrasonic power (UP).
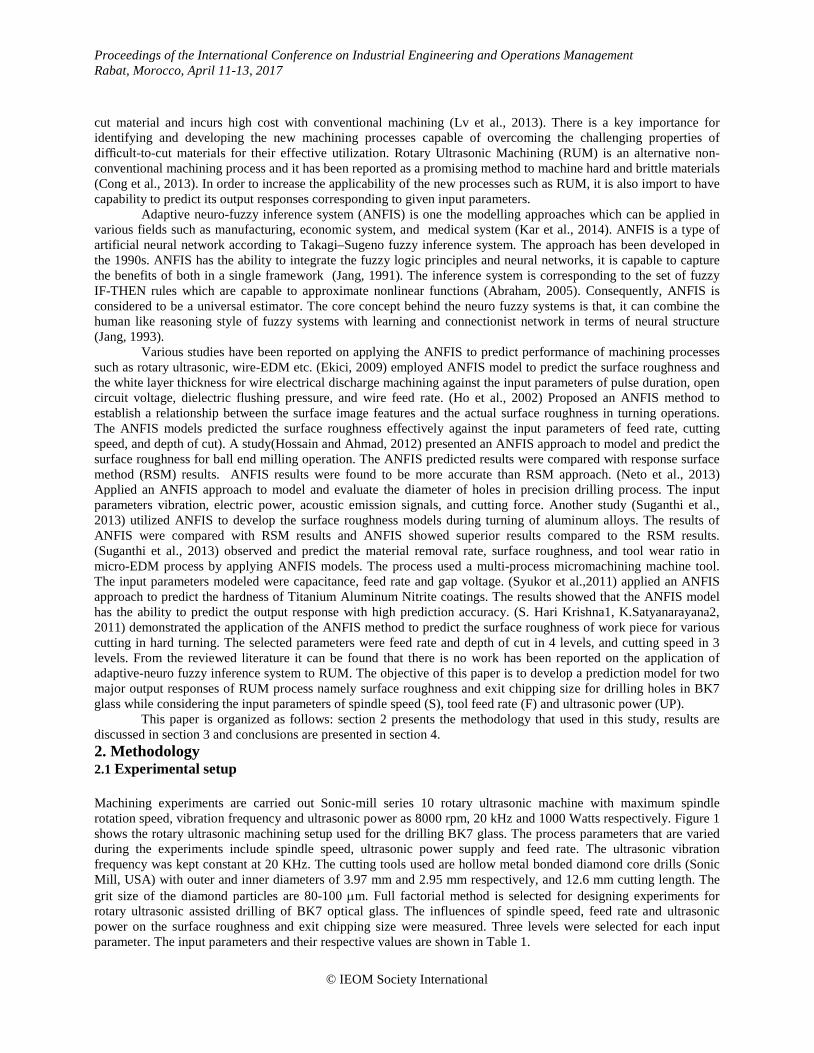
This paper is organized as follows: section 2 presents the methodology that used in this study, results are discussed in section 3 and conclusions are presented in section 4. 2. Methodology 2.1 Experimental setup Machining experiments are carried out Sonic-mill series 10 rotary ultrasonic machine with maximum spindle rotation speed, vibration frequency and ultrasonic power as 8000 rpm, 20 kHz and 1000 Watts respectively. Figure 1 shows the rotary ultrasonic machining setup used for the drilling BK7 glass. The process parameters that are varied during the experiments include spindle speed, ultrasonic power supply and feed rate. The ultrasonic vibration frequency was kept constant at 20 KHz. The cutting tools used are hollow metal bonded diamond core drills (Sonic Mill, USA) with outer and inner diameters of 3.97 mm and 2.95 mm respectively, and 12.6 mm cutting length. The grit size of the diamond particles are 80-100 µm. Full factorial method is selected for designing experiments for rotary ultrasonic assisted drilling of BK7 optical glass. The influences of spindle speed, feed rate and ultrasonic power on the surface roughness and exit chipping size were measured. Three levels were selected for each input parameter. The input parameters and their respective values are shown in Table 1.
© IEOM Society International
Proceedings of the International Conference on Industrial Engineering and Operations Management Rabat, Morocco, April 11-13, 2017
Figure 1. Rotary ultrasonic machining setup; (a) Zoomed-in view of the workpiece material BK7 glass (b) Rotary
ultrasonic machine
Table 1. Machining parameters and their values
Optical glass (BK7) provided by Esco Optics (USA) was used in this study to check its response to the rotary ultrasonic drilling. The dimensions of workpiece used are 50 × 50 × 3 mm. The workpiece thickness of 3 mm is kept same in all the experiments and all the holes are through drilled.
2.2 Measurement of the responses
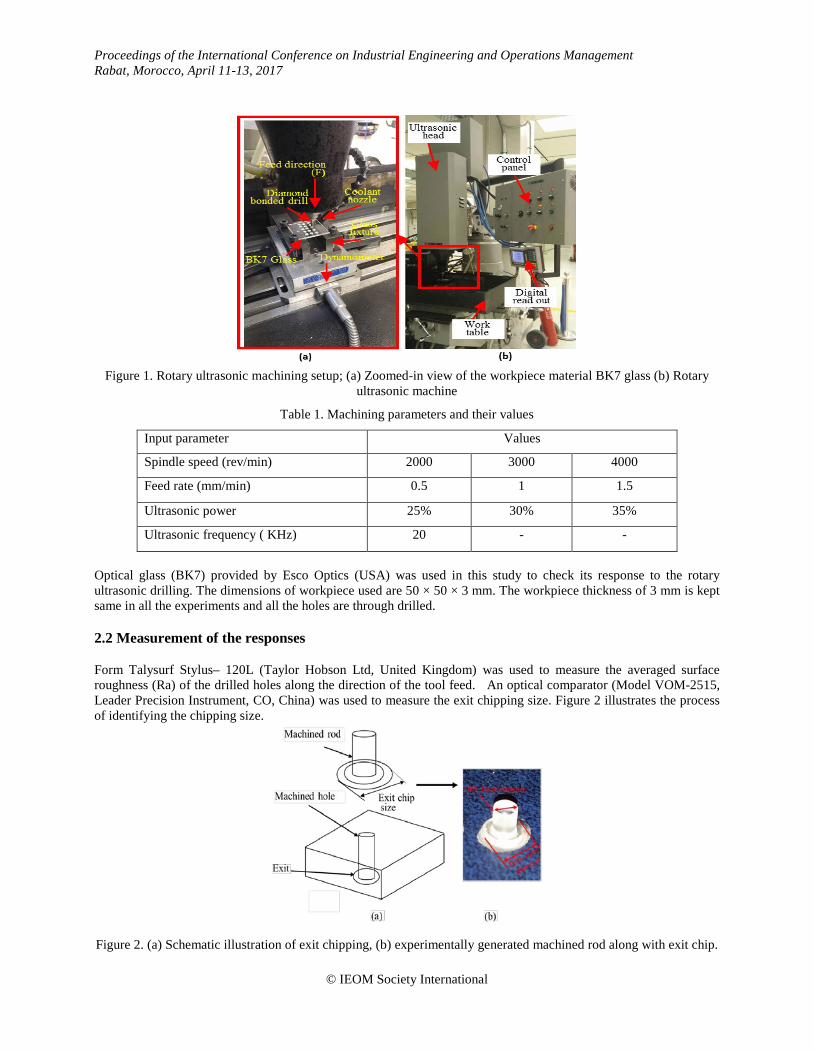
Form Talysurf Stylus– 120L (Taylor Hobson Ltd, United Kingdom) was used to measure the averaged surface roughness (Ra) of the drilled holes along the direction of the tool feed. An optical comparator (Model VOM-2515, Leader Precision Instrument, CO, China) was used to measure the exit chipping size. Figure 2 illustrates the process of identifying the chipping size.
Figure 2. (a) Schematic illustration of exit chipping, (b) experimentally generated machined rod along with exit chip.
Input parameter Values
Spindle speed (rev/min) 2000 3000 4000
Feed rate (mm/min) 0.5 1 1.5
Ultrasonic power 25% 30% 35%
Ultrasonic frequency ( KHz) 20 - -
© IEOM Society International

Proceedings of the International Conference on Industrial Engineering and Operations Management Rabat, Morocco, April 11-13, 2017
Exit chip size was calculate according the following equation: Exit chip size = Exit chip diameter – Drill outer diameter Equation 1
Experiments were carried out in order to study the effect of input parameters on the output characteristics to build prediction models for selected responses. After the measurement of responses for all the runs, the experimental results for all responses were recorded in Table 2 that are used as training and testing data for ANFIS models. Experiments were carried out in order to study the effect of input parameters on the output characteristics to build prediction models for selected responses. After the measurement of responses for all the runs, the experimental results for all responses were recorded in Table 2 that are used as training and testing data for ANFIS models.
Table 2. Process parameters used and corresponding experimental result of surface roughness and exit chipping size
Process parameters Outputs Spindle speed Ultrasonic Power % Feed rate Exit chipping size (mm) surface roughness (µm)
2000 30 1 2.27 2.16
3000 35 1 2.29 1.65
3000 25 1 2.32 1.61
2000 35 1 2.33 2.22
2000 35 1.5 3.41 2.27
2000 25 1.5 3.47 2.23
4000 25 1.5 2.22 1.43
4000 35 1 2.71 1.48
4000 35 1.5 2.97 1.54
3000 25 0.5 1.13 1.58
4000 25 1 2.71 1.44
2000 35 0.5 1.62 1.98
4000 25 0.5 0.96 1.38
3000 35 0.5 1.06 1.56
3000 30 1 2.41 1.59
3000 30 0.5 0.85 1.57
4000 35 0.5 1.11 1.47
3000 35 1.5 2.73 1.63
4000 30 1 2.42 1.32
2000 25 0.5 1.56 1.93
4000 30 1.5 2.56 1.55
2000 30 0.5 1.24 1.94
3000 30 1.5 2.95 1.73
3000 25 1.5 2.53 1.68
2000 25 1 2.18 2.07
4000 30 0.5 0.98 1.36
2000 30 1.5 3.68 2.25
© IEOM Society International
Proceedings of the International Conference on Industrial Engineering and Operations Management Rabat, Morocco, April 11-13, 2017
2.3 Adaptive Neuro Fuzzy Inference System Modeling
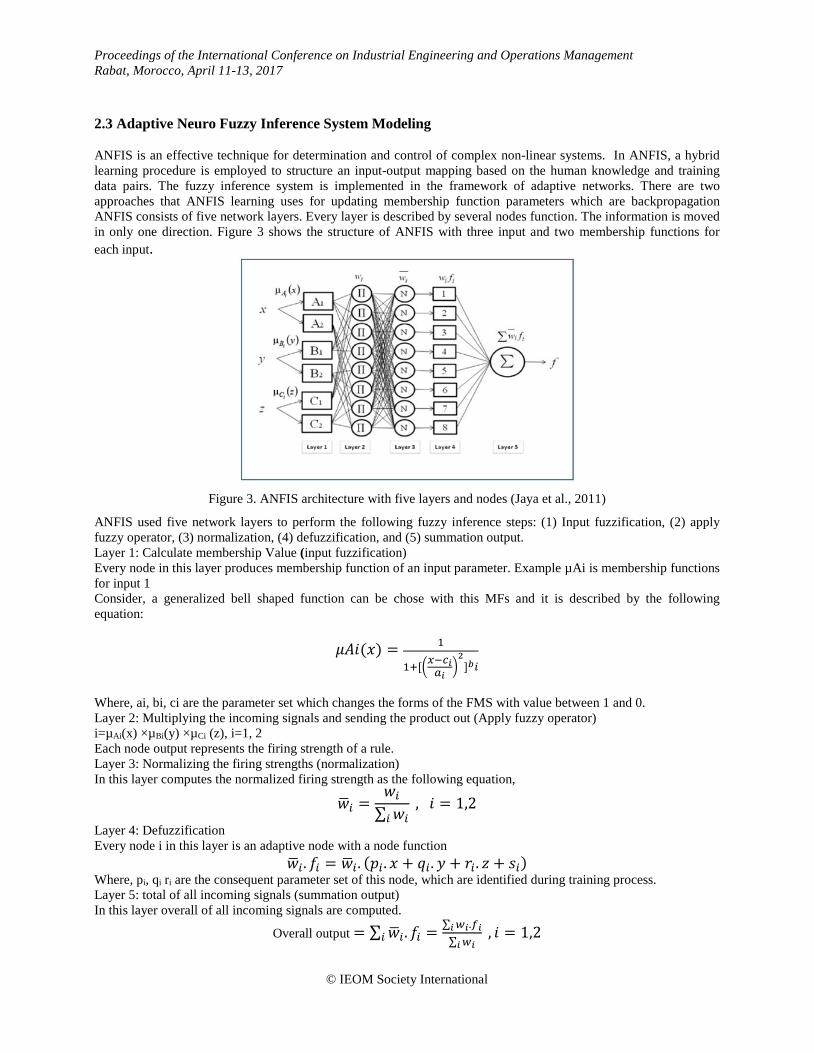
ANFIS is an effective technique for determination and control of complex non-linear systems. In ANFIS, a hybrid learning procedure is employed to structure an input-output mapping based on the human knowledge and training data pairs. The fuzzy inference system is implemented in the framework of adaptive networks. There are two approaches that ANFIS learning uses for updating membership function parameters which are backpropagation ANFIS consists of five network layers. Every layer is described by several nodes function. The information is moved in only one direction. Figure 3 shows the structure of ANFIS with three input and two membership functions for each input.
Figure 3. ANFIS architecture with five layers and nodes (Jaya et al., 2011)
ANFIS used five network layers to perform the following fuzzy inference steps: (1) Input fuzzification, (2) apply fuzzy operator, (3) normalization, (4) defuzzification, and (5) summation output. Layer 1: Calculate membership Value (input fuzzification) Every node in this layer produces membership function of an input parameter. Example µAi is membership functions for input 1 Consider, a generalized bell shaped function can be chose with this MFs and it is described by the following equation:
𝜇𝜇𝜇𝜇𝜇𝜇(𝑥𝑥) = 1
1+[�𝑥𝑥−𝑐𝑐𝑖𝑖𝑎𝑎𝑖𝑖�2
]𝑏𝑏𝑖𝑖
Where, ai, bi, ci are the parameter set which changes the forms of the FMS with value between 1 and 0. Layer 2: Multiplying the incoming signals and sending the product out (Apply fuzzy operator) i=µAi(x) ×µBi(y) ×µCi (z), i=1, 2 Each node output represents the firing strength of a rule. Layer 3: Normalizing the firing strengths (normalization) In this layer computes the normalized firing strength as the following equation,
𝑤𝑤�𝑖𝑖 =𝑤𝑤𝑖𝑖
∑ 𝑤𝑤𝑖𝑖𝑖𝑖 , 𝜇𝜇 = 1,2
Layer 4: Defuzzification Every node i in this layer is an adaptive node with a node function
𝑤𝑤�𝑖𝑖.𝑓𝑓𝑖𝑖 = 𝑤𝑤�𝑖𝑖. (𝑝𝑝𝑖𝑖. 𝑥𝑥 + 𝑞𝑞𝑖𝑖. 𝑦𝑦 + 𝑟𝑟𝑖𝑖. 𝑧𝑧 + 𝑠𝑠𝑖𝑖) Where, pi, qi ri are the consequent parameter set of this node, which are identified during training process. Layer 5: total of all incoming signals (summation output) In this layer overall of all incoming signals are computed.
Overall output = ∑ 𝑤𝑤�𝑖𝑖.𝑓𝑓𝑖𝑖 = ∑ 𝑤𝑤𝑖𝑖.𝑓𝑓𝑖𝑖𝑖𝑖∑ 𝑤𝑤𝑖𝑖𝑖𝑖
𝑖𝑖 , 𝜇𝜇 = 1,2
© IEOM Society International
Proceedings of the International Conference on Industrial Engineering and Operations Management Rabat, Morocco, April 11-13, 2017
2.4 Regression Model
Regression analysis is a mathematical equation to characterize the relationship between two or more input parameters and a response variable. Fit mathematical model are also developed using regression analysis to fit the data for the two selected responses.
3. Result and Discussions 3.1 ANFIS results
The determination of the ANFIS has been developed as a function of machining parameters for drilling BK7 glass using twenty seven train and test data. In addition, for the ANFIS an algorithm that already exists in MATLAB was used, which tests various combinations of inputs in order to achieve the perfect training and the maximum prediction accuracy. The ANFIS was designed with the initial parameters to obtain results, Table 3 presents initial parameters for the construction of the ANFIS.
Table 3. Initial parameters for the construction of the ANFIS
Responses Surface roughness Exit chipping size Training method hybrid hybrid
Membership function trimf trimf
Number of membership function 3 3 3 3 3 3
Number of epochs 100 100
Output function constant constant
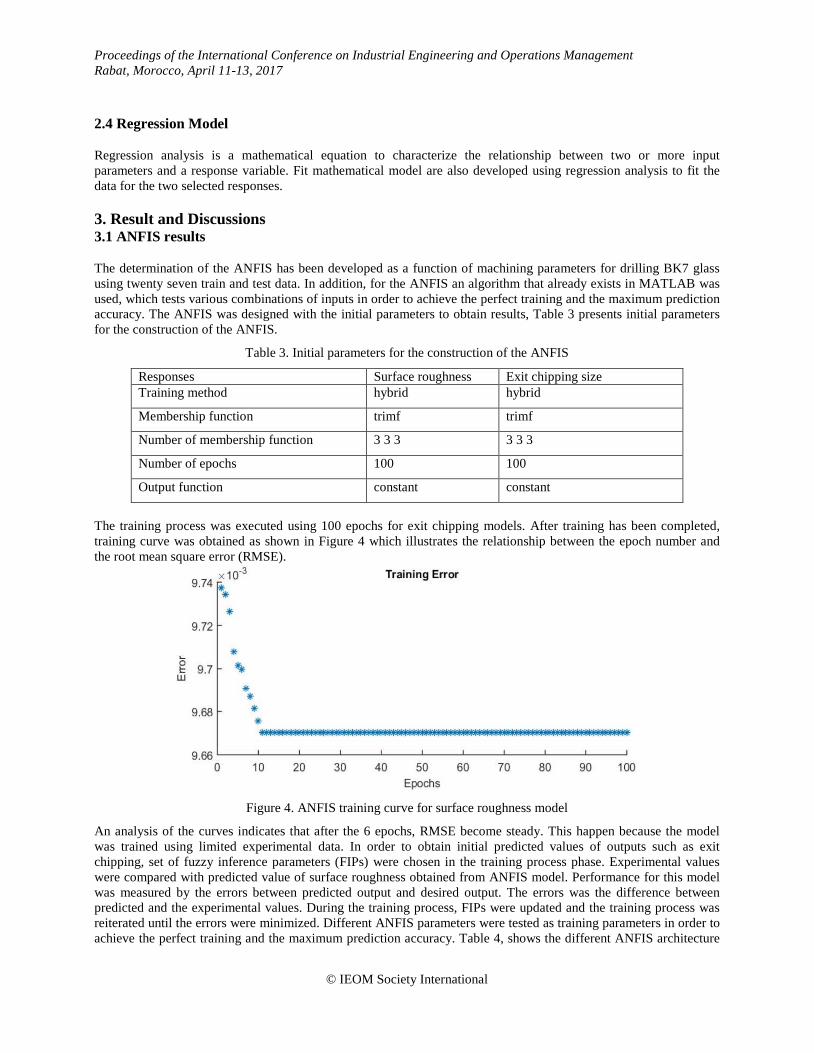
The training process was executed using 100 epochs for exit chipping models. After training has been completed, training curve was obtained as shown in Figure 4 which illustrates the relationship between the epoch number and the root mean square error (RMSE).
Figure 4. ANFIS training curve for surface roughness model
An analysis of the curves indicates that after the 6 epochs, RMSE become steady. This happen because the model was trained using limited experimental data. In order to obtain initial predicted values of outputs such as exit chipping, set of fuzzy inference parameters (FIPs) were chosen in the training process phase. Experimental values were compared with predicted value of surface roughness obtained from ANFIS model. Performance for this model was measured by the errors between predicted output and desired output. The errors was the difference between predicted and the experimental values. During the training process, FIPs were updated and the training process was reiterated until the errors were minimized. Different ANFIS parameters were tested as training parameters in order to achieve the perfect training and the maximum prediction accuracy. Table 4, shows the different ANFIS architecture
© IEOM Society International
Proceedings of the International Conference on Industrial Engineering and Operations Management Rabat, Morocco, April 11-13, 2017
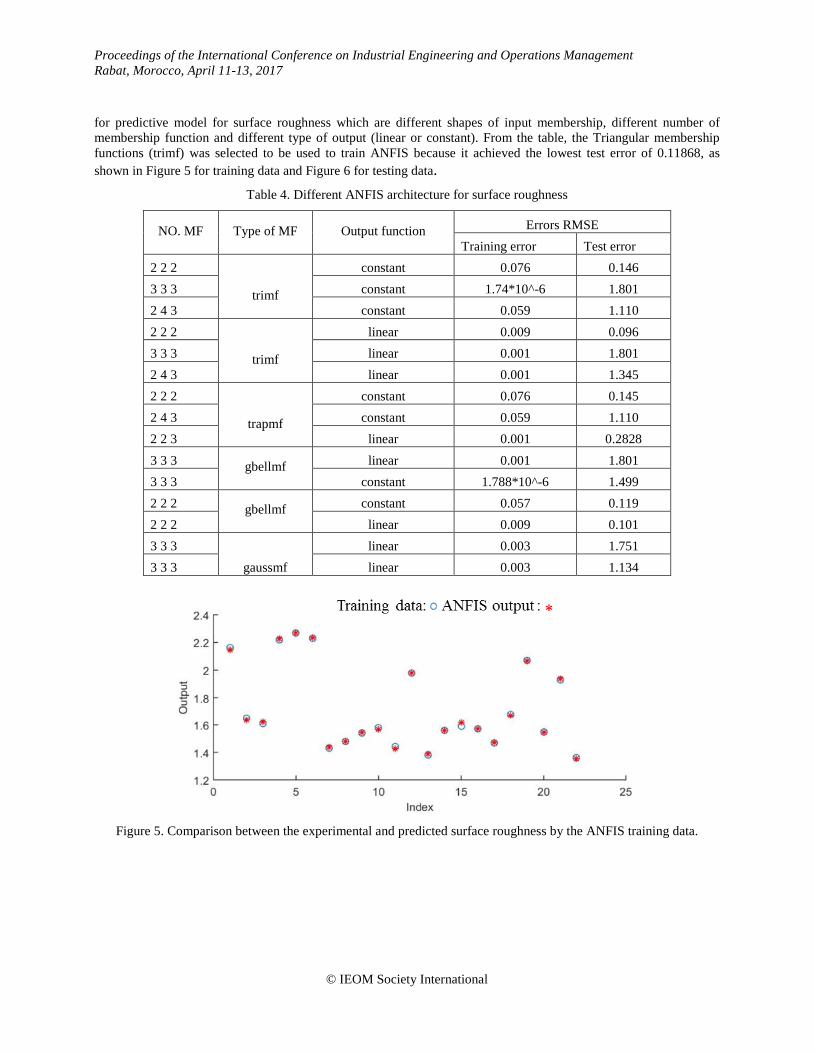
for predictive model for surface roughness which are different shapes of input membership, different number of membership function and different type of output (linear or constant). From the table, the Triangular membership functions (trimf) was selected to be used to train ANFIS because it achieved the lowest test error of 0.11868, as shown in Figure 5 for training data and Figure 6 for testing data.
Table 4. Different ANFIS architecture for surface roughness
NO. MF
Type of MF
Output function
Errors RMSE Training error Test error
2 2 2
trimf
constant 0.076 0.146 3 3 3 constant 1.74*10^-6 1.801 2 4 3 constant 0.059 1.110 2 2 2
trimf
linear 0.009 0.096 3 3 3 linear 0.001 1.801 2 4 3 linear 0.001 1.345 2 2 2
trapmf
constant 0.076 0.145 2 4 3 constant 0.059 1.110 2 2 3 linear 0.001 0.2828 3 3 3 gbellmf
linear 0.001 1.801
3 3 3 constant 1.788*10^-6 1.499 2 2 2 gbellmf
constant 0.057 0.119
2 2 2 linear 0.009 0.101 3 3 3
gaussmf linear 0.003 1.751
3 3 3 linear 0.003 1.134
Figure 5. Comparison between the experimental and predicted surface roughness by the ANFIS training data.
© IEOM Society International

Proceedings of the International Conference on Industrial Engineering and Operations Management Rabat, Morocco, April 11-13, 2017
Figure 6. Comparison between the experimental and predicted surface roughness by the ANFIS test data.
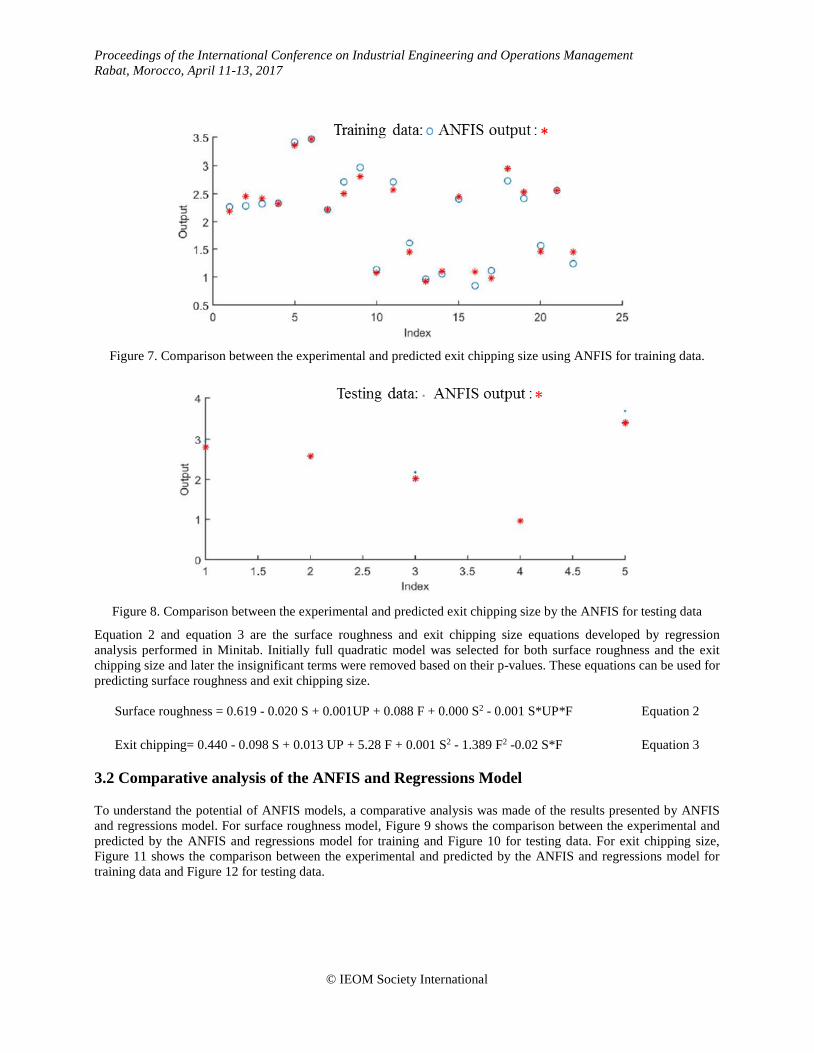
By using the procedure above, the ANFIS approach was also used to predict exit chipping size, the results are presented as follows to select the best model. Table 5 shows the different ANFIS architecture for predictive model for exit chipping size. To conclude, according to the least RMSE, the best result of the scenarios used for training and testing data was obtained using the generalized bell membership function (gbellmf) and the constant as the output membership function with RMSE equal to 0.129 and 0.161 mm respectively. Figure 7 shows the comparison between the experimental and predicted exit chipping size by training data. Also, the developed model by ANFIS is tested by the testing data and the results are shown in Figure 8.
Table 5. Different ANFIS architecture for exit chipping size
NO. MF Type of MF Output function RMSE Training Test 2 2 3 trimf constant 0.145 0.206 2 4 3 trimf constant 0.107 1.831 2 2 3 linear 0.001 0.606 2 4 3 linear 0.001 1.997 2 2 3 constant 0.145 0.212 4 4 4 trapmf constant 2.953*10^6 2.621 2 2 3 linear 0.001 0.605 4 4 4 trapmf linear 0.001 2.621 3 3 3 constant 2.376*10^-6 1.889 2 2 3 gbellmf constant 0.129 0.161 2 2 3 gbellmf linear 0.001 0.613 3 3 3 linear 0.004 1.781 3 3 3 gaussmf linear 0.002 1.763 constant 2.368*10^-6 1.904 2 2 2 dsigmf constant 0.091 1.448 dsigmf linear 0.003 1.334
© IEOM Society International
Proceedings of the International Conference on Industrial Engineering and Operations Management Rabat, Morocco, April 11-13, 2017
Figure 7. Comparison between the experimental and predicted exit chipping size using ANFIS for training data.
Figure 8. Comparison between the experimental and predicted exit chipping size by the ANFIS for testing data
Equation 2 and equation 3 are the surface roughness and exit chipping size equations developed by regression analysis performed in Minitab. Initially full quadratic model was selected for both surface roughness and the exit chipping size and later the insignificant terms were removed based on their p-values. These equations can be used for predicting surface roughness and exit chipping size.
Surface roughness = 0.619 - 0.020 S + 0.001UP + 0.088 F + 0.000 S2 - 0.001 S*UP*F Equation 2
Exit chipping= 0.440 - 0.098 S + 0.013 UP + 5.28 F + 0.001 S2 - 1.389 F2 -0.02 S*F Equation 3
3.2 Comparative analysis of the ANFIS and Regressions Model
To understand the potential of ANFIS models, a comparative analysis was made of the results presented by ANFIS and regressions model. For surface roughness model, Figure 9 shows the comparison between the experimental and predicted by the ANFIS and regressions model for training and Figure 10 for testing data. For exit chipping size, Figure 11 shows the comparison between the experimental and predicted by the ANFIS and regressions model for training data and Figure 12 for testing data.
© IEOM Society International

Proceedings of the International Conference on Industrial Engineering and Operations Management Rabat, Morocco, April 11-13, 2017
Figure 9. Comparison between experimental and predicted SR for training data
Figure 10. Comparison between experimental and predicted SR for test data
Figure 11. Comparison between experimental and predicted exit chipping for training data
0
0.5
1
1.5
2
2.5
1 2 3 4 5 6 7 8 9 10 11 12 13 14 15 16 17 18 19 20 21 22
SR(μm)
Runs
Ex. SR Predicted SR by ANFIS Predicted SR by Reg.
0
0.5
1
1.5
2
2.5
1 2 3 4 5
SR(µ
m)
Runs
Ex. SR Predicted SR by ANFIS Predicted by Reg.
00.5
11.5
22.5
33.5
4
1 2 3 4 5 6 7 8 9 10 11 12 13 14 15 16 17 18 19 20 21 22
Exi
t chi
ppin
g (m
m)
Runs
Ex, ECH Predicted ECH by ANFIS Predicted ECH by Reg.
© IEOM Society International
Proceedings of the International Conference on Industrial Engineering and Operations Management Rabat, Morocco, April 11-13, 2017
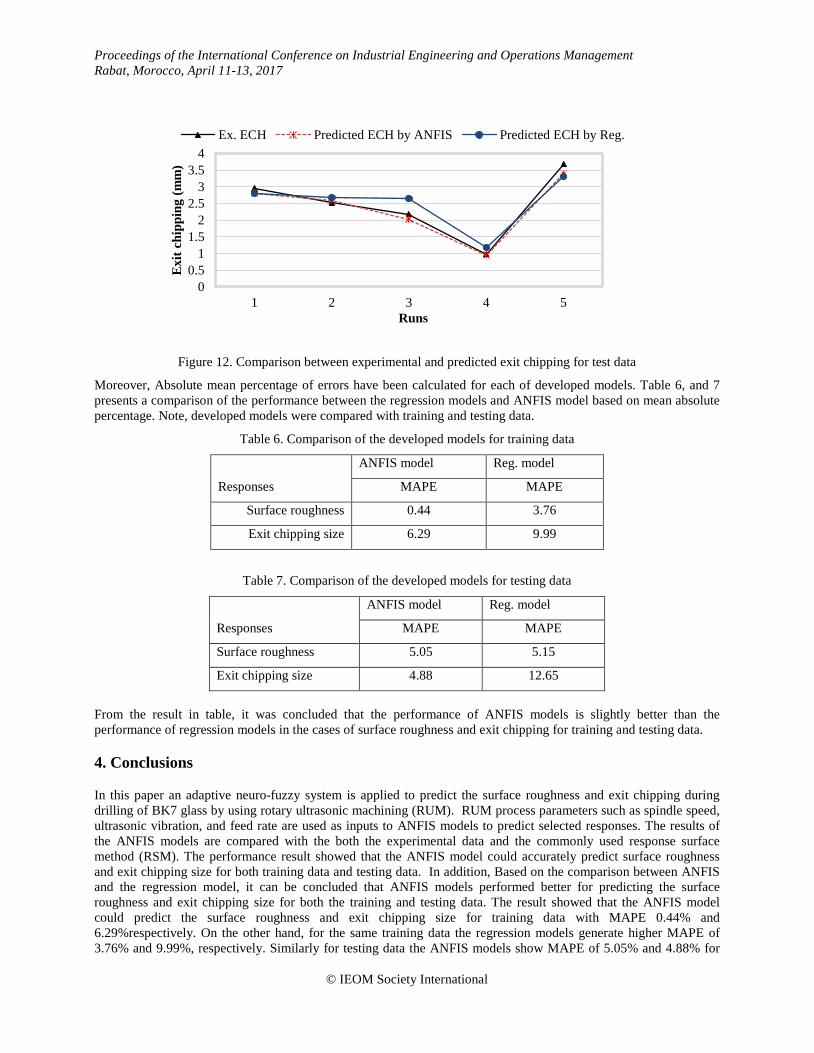
Figure 12. Comparison between experimental and predicted exit chipping for test data
Moreover, Absolute mean percentage of errors have been calculated for each of developed models. Table 6, and 7 presents a comparison of the performance between the regression models and ANFIS model based on mean absolute percentage. Note, developed models were compared with training and testing data.
Table 6. Comparison of the developed models for training data
Responses
ANFIS model Reg. model
MAPE MAPE
Surface roughness 0.44 3.76
Exit chipping size 6.29 9.99
Table 7. Comparison of the developed models for testing data
Responses
ANFIS model Reg. model
MAPE MAPE
Surface roughness 5.05 5.15
Exit chipping size 4.88 12.65
From the result in table, it was concluded that the performance of ANFIS models is slightly better than the performance of regression models in the cases of surface roughness and exit chipping for training and testing data.
4. Conclusions
In this paper an adaptive neuro-fuzzy system is applied to predict the surface roughness and exit chipping during drilling of BK7 glass by using rotary ultrasonic machining (RUM). RUM process parameters such as spindle speed, ultrasonic vibration, and feed rate are used as inputs to ANFIS models to predict selected responses. The results of the ANFIS models are compared with the both the experimental data and the commonly used response surface method (RSM). The performance result showed that the ANFIS model could accurately predict surface roughness and exit chipping size for both training data and testing data. In addition, Based on the comparison between ANFIS and the regression model, it can be concluded that ANFIS models performed better for predicting the surface roughness and exit chipping size for both the training and testing data. The result showed that the ANFIS model could predict the surface roughness and exit chipping size for training data with MAPE 0.44% and 6.29%respectively. On the other hand, for the same training data the regression models generate higher MAPE of 3.76% and 9.99%, respectively. Similarly for testing data the ANFIS models show MAPE of 5.05% and 4.88% for
00.5
11.5
22.5
33.5
4
1 2 3 4 5
Exi
t chi
ppin
g (m
m)
Runs
Ex. ECH Predicted ECH by ANFIS Predicted ECH by Reg.
© IEOM Society International

Proceedings of the International Conference on Industrial Engineering and Operations Management Rabat, Morocco, April 11-13, 2017
surface roughness and exit chipping size respectively, while regression models exhibit higher MAPE of 5.15% and 12.65%, respectively. Therefore, it can be concluded that developed model using ANFIS approach can be used effectively to predict surface roughness and exit chipping size and provides more reliable results as compared to RSM approach.
Acknowledgements
The authors acknowledge the support of Deanship of scientific Research, College of Engineering, King Saud University, Kingdom of Saudi Arabia.
References
Abraham, A., Adaptation of Fuzzy Inference System Using Neural Learning: vol. 83, pp. 53–83, 2005. Cong, W.L., Pei, Z.J., Deines, T.W., Liu, D.F., and Treadwell, C., 2013, Rotary ultrasonic machining of CFRP/Ti
stacks using variable feedrate, Composites Part B: Engineering, vol. 52, pp. 303–310, 2013. Ekici, S., An adaptive neuro-fuzzy inference system ( ANFIS ) model for wire-EDM, Expert Systems with
Applications, vol. 36, pp. 6135–6139, 2009. Ho, S., Lee, K., Chen, S., and Ho, S., Accurate modeling and prediction of surface roughness by computer vision in
turning operations using an adaptive neuro- fuzzy inference system, International Journal of Machine Tools and Manufacture, vol. 42, pp. 1441–1446. 2002.
Hossain, S.J., and Ahmad, N., , Adaptive neuro-fuzzy inference system ( ANFIS ) based surface roughness prediction model for ball end milling operation, Journal of Mechanical Engineering Research, vol. 4, no. March, pp. 112–129, 2012.
Jang, J.R., , ANFIS , Adap tive-Ne twork-Based Fuzzy Inference System, IEEE transactions on systems, man, and cybernetics, vol. 23, no. 3,1993.
Jang, J.-S.R., Fuzzy Modeling Using Generalized Neural Networks and Kalman Filter Algorithm, AAAI, Vol. 91, pp. 762–767, 1991.
Kar, S., Das, S., and Kanti, P., Applications of neuro fuzzy systems : A brief review and future outline, Applied Soft Computing Journal, vol. 15, pp. 243–259, 2014.
Krishna1,S., Hari, K.Satyanarayana, K.B.R., Surface roughness prediction model using ann & anfis, International Journal of Advanced Engineering Research and Studies,pp, 102-13, 2011.
Lv, D., Influences of high-frequency vibration on tool wear in rotary ultrasonic machining of glass BK7, International Journal of Advanced Manufacturing Technology, vol. 84, no. 5–8, pp. 1443–1455,2016,
Lv, D., Tang, Y., Wang, H., and Huang, Y., Experimental investigations on subsurface damage in rotary ultrasonic machining of glass BK7, Machining Science and Technology, vol. 17, no. 3, pp. 443–463, 2013.
Nambu, Y., Ohiai, K., Horio, K., Kaneko, J., Watanabe, T., and Matsuda, S., Attempt to Increase Step Feed by Adding Ultrasonic Vibrations in Micro Deep Drilling, Journal of Advanced Mechanical Design, Systems, and Manufacturing, vol. 5, no. 2, pp. 129–138, 2011.
Neto, F.C., Gerônimo, T.M., Cruz, C.E.D., Aguiar, P.R., and Bianchi, E.E.C., Neural models for predicting hole diameters in drilling processes, Procedia CIRP, vol. 12, pp. 49–54, 2013.
Suganthi, X.H., Natarajan, U., and Modeling, A.N.N.,Prediction of quality responses in micro-EDM process using an adaptive neuro-fuzzy inference system ( ANFIS ) model, pp. 339–347, 2013.
Syukor, A., Jaya, M., Samad, A., Basari, H., Zaiton, S., Hashim, M., Muhamad, M.R., and Rahman, N.A., Application of ANFIS in Predicting of TiAlN Coatings Hardness, Australian Journal of Basic and Applied Sciences, vol. 5, no. 9, pp. 1647–1657, 2011.
Zhang, C., Zhang, J., and Feng, P., Mathematical model for cutting force in rotary ultrasonic face milling of brittle materials, International Journal of Advanced Manufacturing Technology, vol. 69, no. 1–4, pp. 161–170, 2013.
Biography
Dr. Saqib Anwar is an assistant professor of Industrial Engineering at King Saud University since 2014. He received PhD degree in 2013, and MSc degree in 2009 with distinction from the University of Nottingham, UK in manufacturing engineering. He did his bachelor in industrial and manufacturing engineering (2007) from the University of Engineering and Technology, Lahore, Pakistan and received a golden medal. He started his research
© IEOM Society International

Proceedings of the International Conference on Industrial Engineering and Operations Management Rabat, Morocco, April 11-13, 2017
and academic activities since 2009 at the University of Nottingham, UK where he worked as a teaching assistant and researcher. His research interests are related to the application of finite element method to investigate manufacturing processes, new implant designs and machinability assessment of difficult to cut material. Mustafa M. Nasr is a Researcher and Ph.D Student in Industrial Engineering Department, College of Engineering, King Saud University, Saudi Arabia. His area of expertise is manufacturing systems. He received the B.Sc. in Industrial Engineering from Taiz University, Taiz, Yemen and Masters’ degree from King Saud University, Riyadh, Saudi Arabia. Mohammed Alkahtani is an Assistant Professor in Industrial Engineering Department at King Saud University. He is also the chairman of the Industrial Engineering Department and has recently been elected as chairman of the Industrial Engineering chapter of the Saudi Council of Engineers (SCE). Dr Alkahtani has collaborated on various Industrial and research projects. He has experience in teaching wide range of IE courses, is involved with several administrative duties, and has developed a network of industrial and academic collaborators across the world. Research areas and specialties: 1) Design and analysis of manufacturing systems, logistics, and supply chain. 2) Lean/Agile based approaches for performance improvement of SMEs. 3) Application of simulation, operations research and optimization techniques to solve supply chain and logistics problems. Abdul-Aziz Mohammed El-Tamimi was granted his Ph.D. from University of Manchester, Institute of Science and Technology, U.K, 1978. Currently he is working as a Full Professor in Industrial Engineering department, King Saud University, Riyadh, Saudi Arabia. He has published various books, ISI journal articles, conference papers and supervised many Ph.D and Masters Thesis.
© IEOM Society International