prediction methods mark j. van der laan division of biostatistics u.c. berkeley laan
Post on 21-Dec-2015
219 views
TRANSCRIPT
Prediction MethodsPrediction Methods
Mark J. van der LaanMark J. van der LaanDivision of BiostatisticsDivision of Biostatistics
U.C. BerkeleyU.C. Berkeley
www.stat.berkeley.edu/~laanwww.stat.berkeley.edu/~laan
OutlineOutline
Overview of Common Approaches to PredictionOverview of Common Approaches to PredictionRegressionRegressionrandomForestrandomForestDSADSA
Cross-ValidationCross-Validation Super Learner Method for PredictionSuper Learner Method for Prediction ExampleExample
ConclusionConclusion
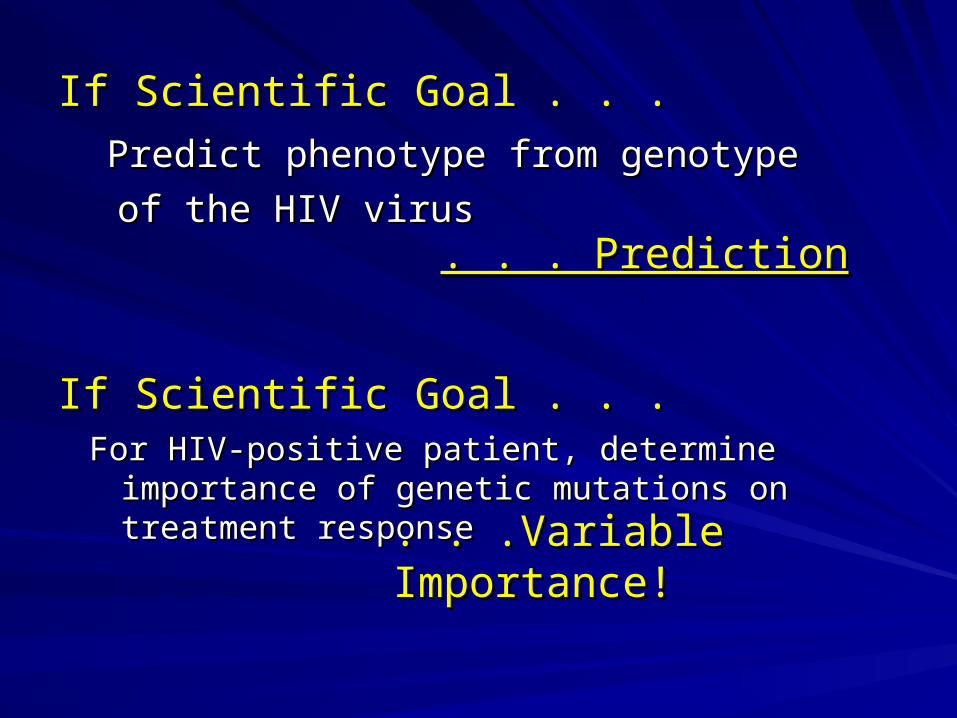
If Scientific Goal . . .If Scientific Goal . . .
Predict phenotype from genotype Predict phenotype from genotype
of the HIV virusof the HIV virus . . . Prediction. . . Prediction
For HIV-positive patient, determine importance of For HIV-positive patient, determine importance of genetic mutations on treatment responsegenetic mutations on treatment response
If Scientific Goal . . .If Scientific Goal . . .
. . .Variable Importance!. . .Variable Importance!
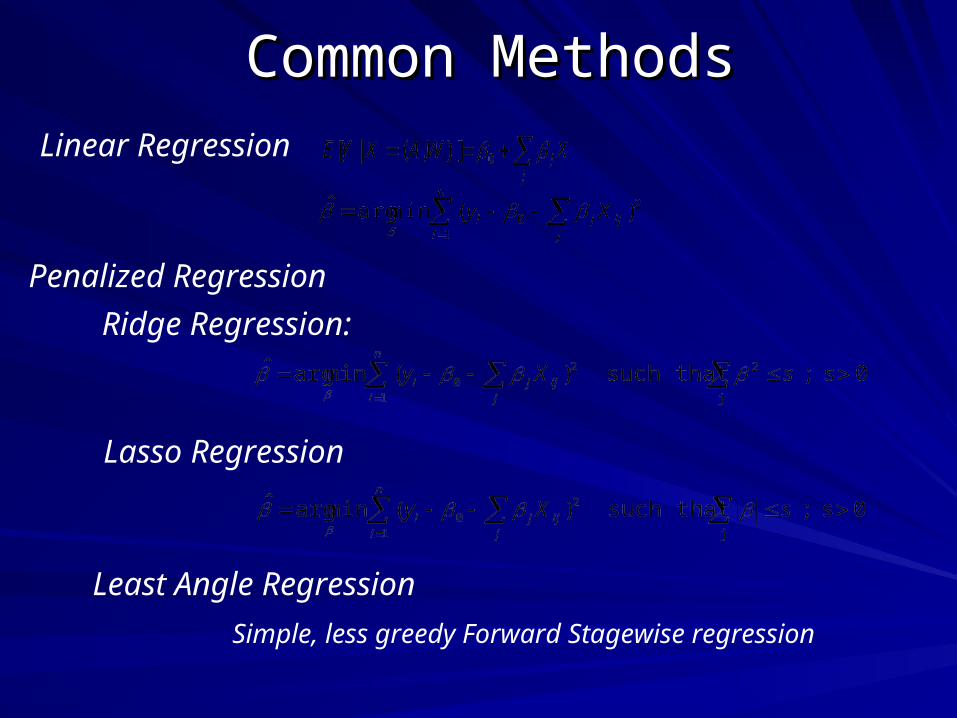
Common MethodsCommon MethodsLinear Regression
Lasso Regression
Least Angle Regression
Penalized Regression
Ridge Regression:
Simple, less greedy Forward Stagewise regression
Common MethodsCommon Methods
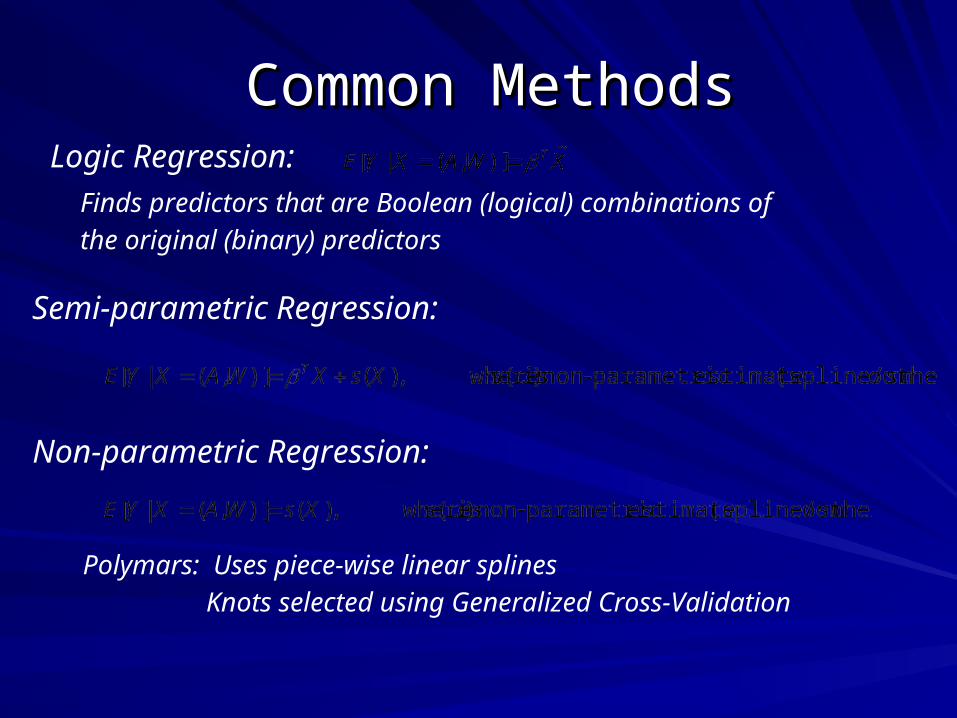
Non-parametric Regression:
Polymars: Uses piece-wise linear splines
Knots selected using Generalized Cross-Validation
Semi-parametric Regression:
Finds predictors that are Boolean (logical) combinations of
the original (binary) predictors
Logic Regression:
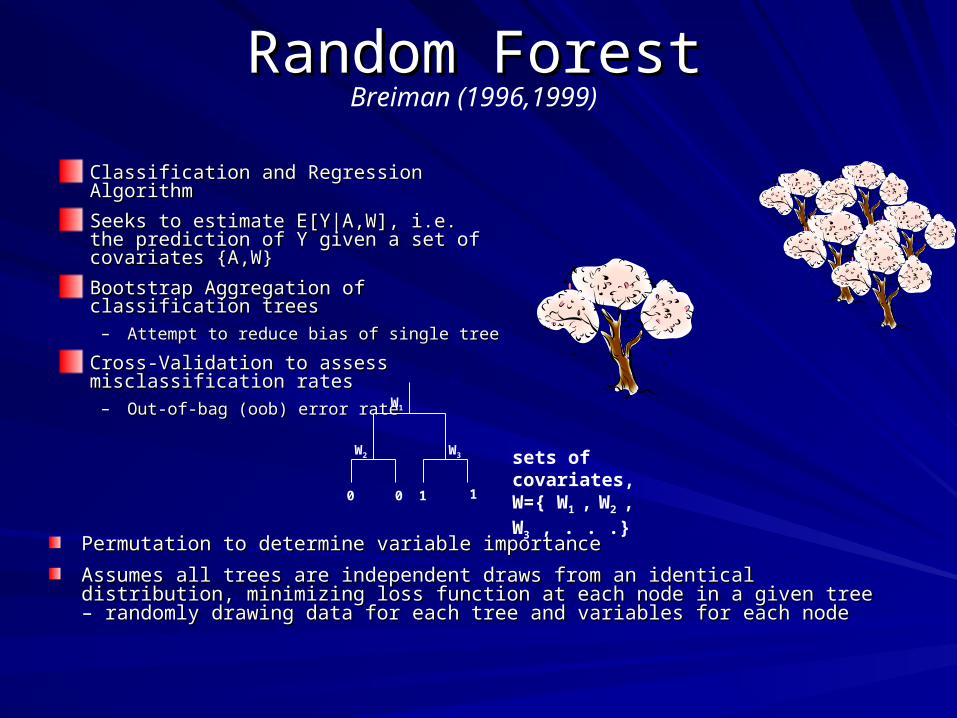
Classification and Regression Algorithm Classification and Regression Algorithm
Seeks to estimate E[Y|A,W], i.e. the Seeks to estimate E[Y|A,W], i.e. the prediction of Y given a set of covariates prediction of Y given a set of covariates {A,W}{A,W}
Bootstrap Aggregation of classification Bootstrap Aggregation of classification treestrees
– Attempt to reduce bias of single tree Attempt to reduce bias of single tree
Cross-Validation to assess Cross-Validation to assess misclassification ratesmisclassification rates
– Out-of-bag (oob) error rateOut-of-bag (oob) error rate
Random ForestRandom Forest
Permutation to determine variable importancePermutation to determine variable importance
Assumes all trees are independent draws from an identical distribution, minimizing Assumes all trees are independent draws from an identical distribution, minimizing loss function at each node in a given tree – randomly drawing data for each tree and loss function at each node in a given tree – randomly drawing data for each tree and variables for each nodevariables for each node
0 10 1
W1
W2 W3 sets of covariates, W={ W1 , W2 , W3 , . . .}
Breiman (1996,1999)
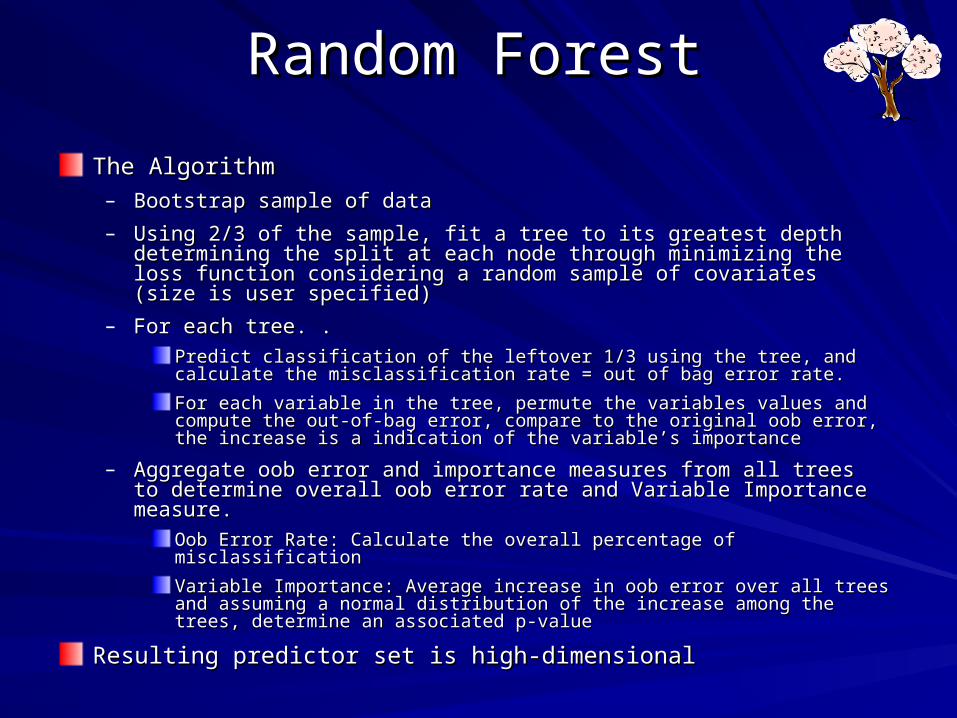
The Algorithm The Algorithm – Bootstrap sample of data Bootstrap sample of data
– Using 2/3 of the sample, fit a tree to its greatest depth determining the split at Using 2/3 of the sample, fit a tree to its greatest depth determining the split at each node through minimizing the loss function considering a random sample of each node through minimizing the loss function considering a random sample of covariates (size is user specified)covariates (size is user specified)
– For each tree. . For each tree. .
Predict classification of the leftover 1/3 using the tree, and calculate the Predict classification of the leftover 1/3 using the tree, and calculate the misclassification rate = out of bag error rate.misclassification rate = out of bag error rate.
For each variable in the tree, permute the variables values and compute the out-of-For each variable in the tree, permute the variables values and compute the out-of-bag error, compare to the original oob error, the increase is a indication of the bag error, compare to the original oob error, the increase is a indication of the variable’s importance variable’s importance
– Aggregate oob error and importance measures from all trees to determine Aggregate oob error and importance measures from all trees to determine overall oob error rate and Variable Importance measure. overall oob error rate and Variable Importance measure.
Oob Error Rate: Calculate the overall percentage of misclassificationOob Error Rate: Calculate the overall percentage of misclassification
Variable Importance: Average increase in oob error over all trees and assuming a Variable Importance: Average increase in oob error over all trees and assuming a normal distribution of the increase among the trees, determine an associated p-valuenormal distribution of the increase among the trees, determine an associated p-value
Resulting predictor set is high-dimensionalResulting predictor set is high-dimensional
Random ForestRandom Forest
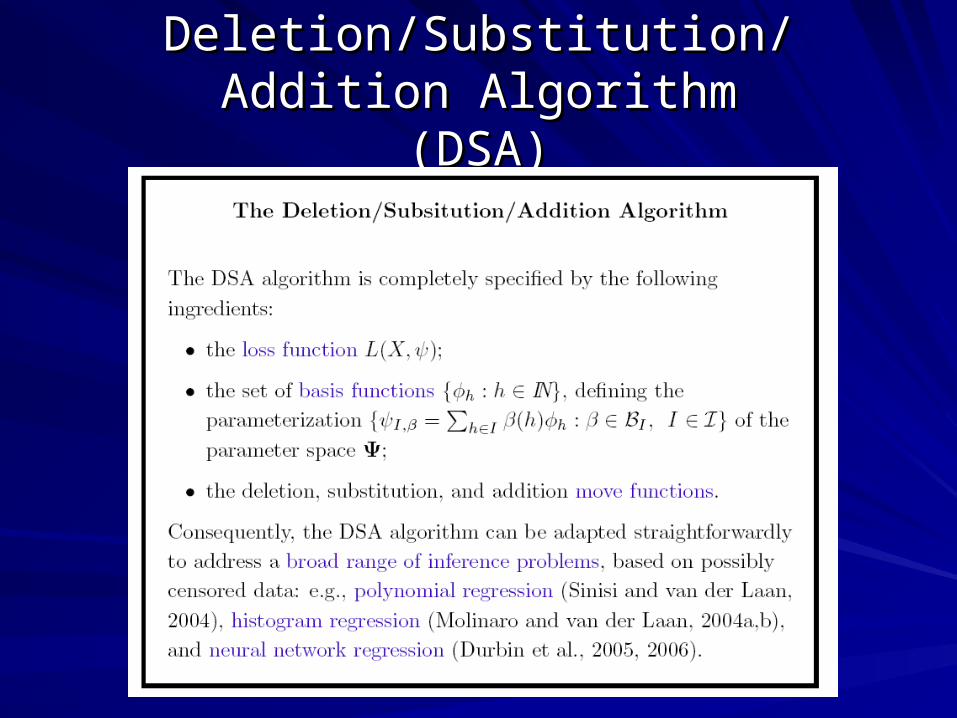
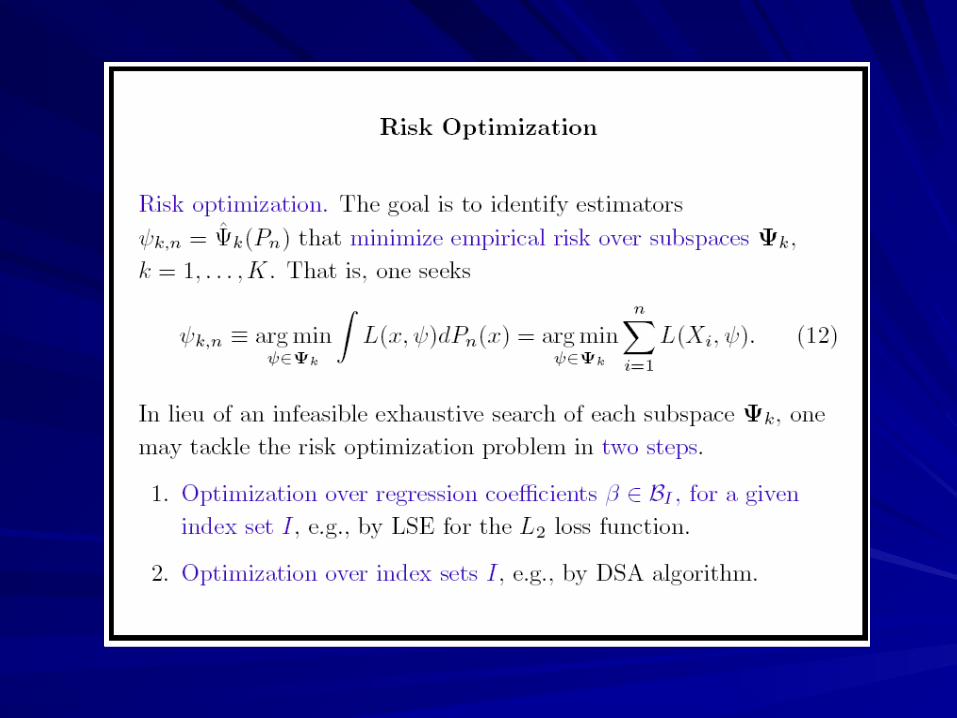
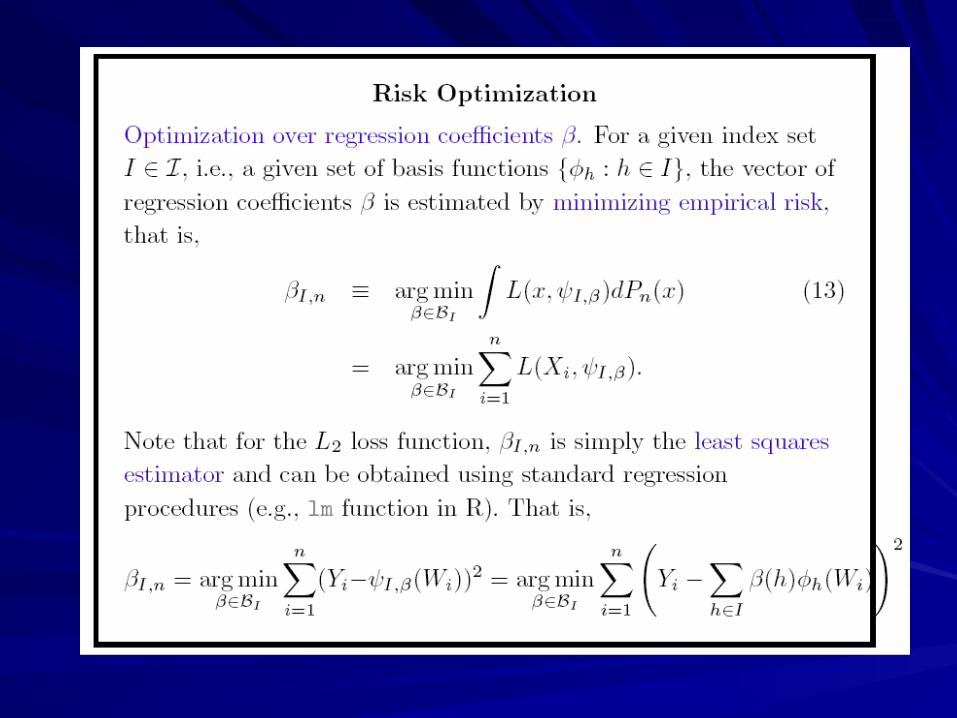
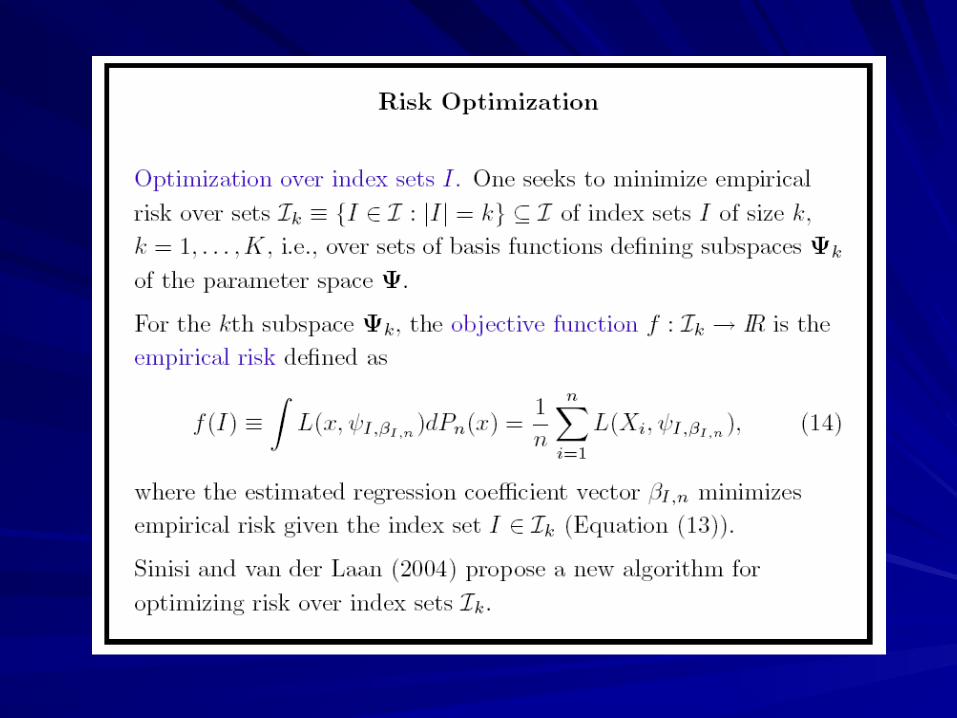
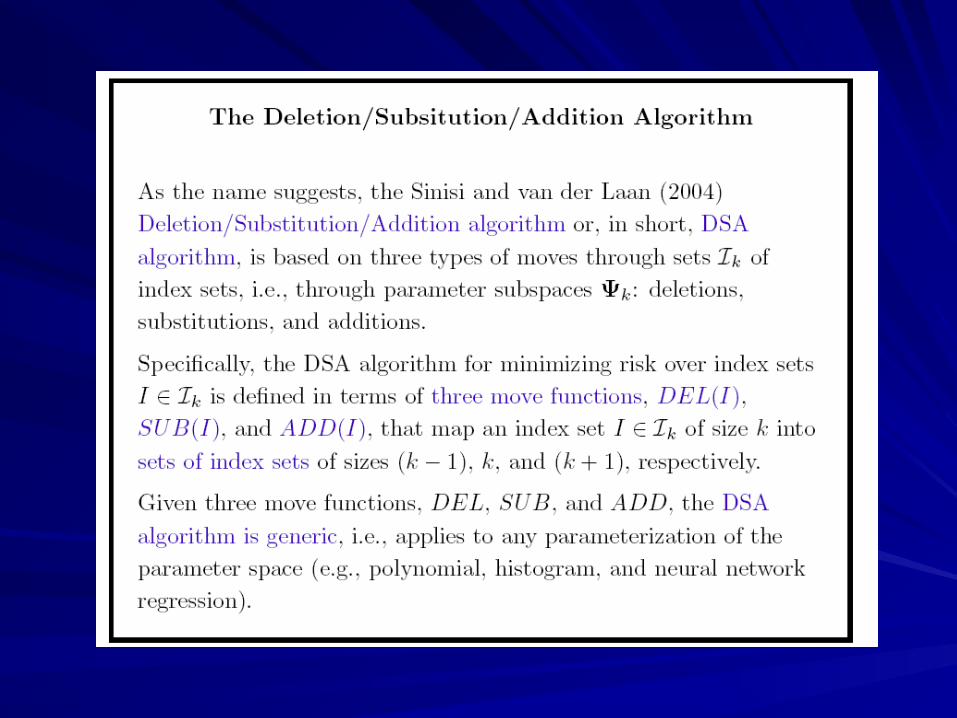
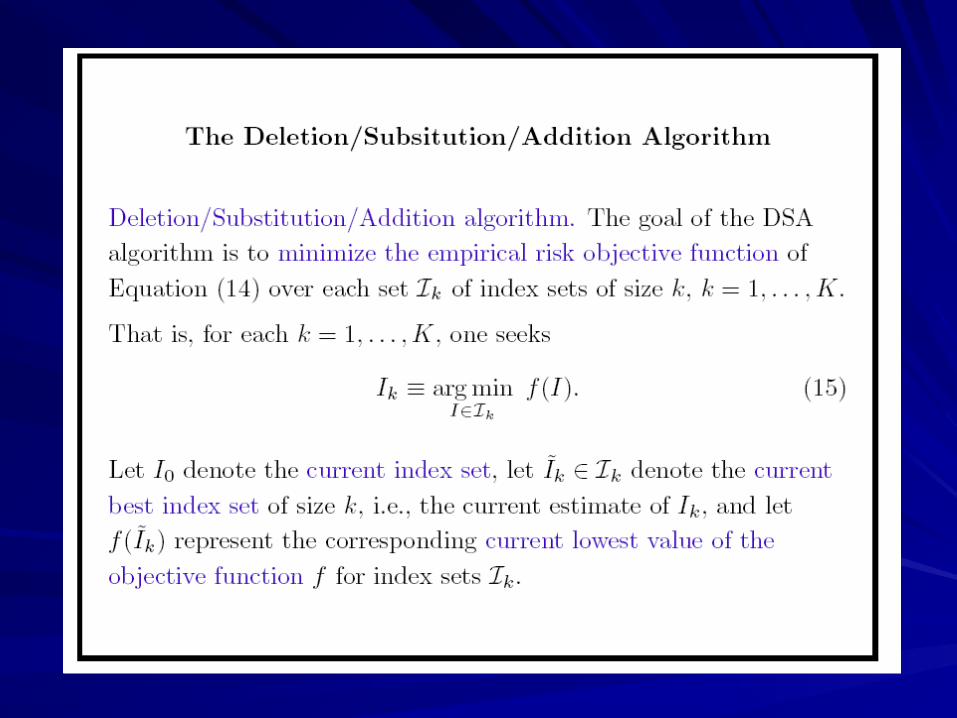
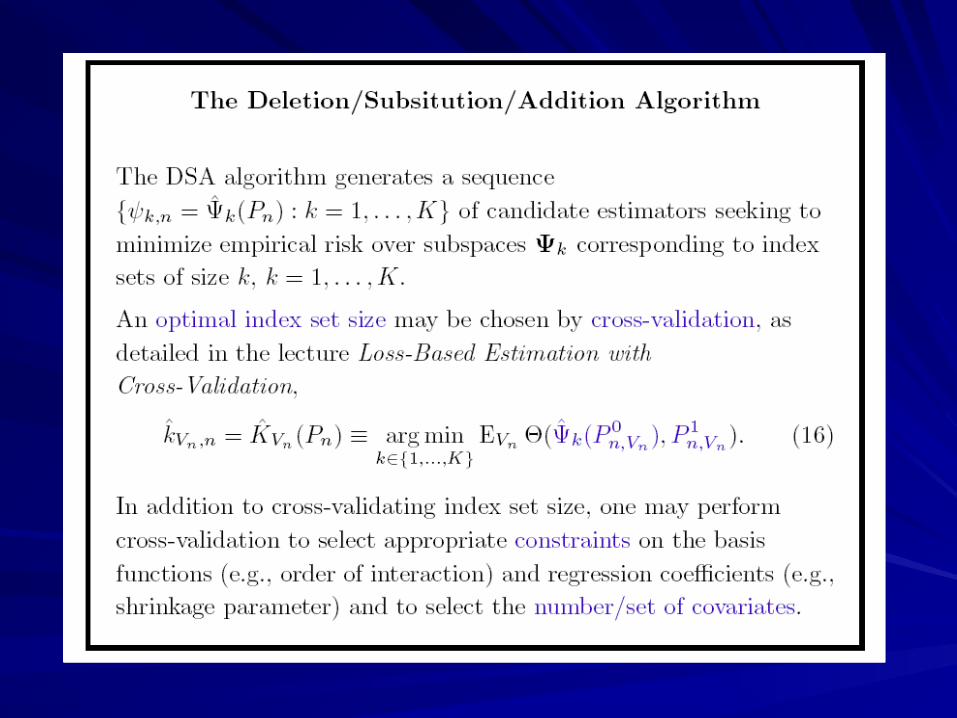
Deletion/Substitution/Addition AlgorithmDeletion/Substitution/Addition Algorithm(DSA)(DSA)