prediction model to identify the significant … - surveying history, 5537 dalibor barton ěk...
TRANSCRIPT

TS02K - Surveying History, 5537 Dalibor Bartoněk Prediction model to identify the significant development periods of historical objects FIG Working Week 2012 Knowing to manage the territory, protect the environment, evaluate the cultural heritage Rome, Italy, 6-10 May 2012
1/17
Prediction model to identify the significant development periods of the historical objects
Dalibor BARTONĚK, Czech Republic
Key words: prediction, Markov chain, historical object, GIS SUMMARY Reconstruction of a historical objects is now an integral part of a comprehensive research of historical monuments. In this process we can learn a lot about their past and understand the sequence of history in a given region. It is very plausible that in many cases it fails to acquire the necessary materials for reconstruction of the object. And it is a prediction which is one of the options to add the missing information. The article presents two variants of prediction (inductive and deductive). The model is based on Markov chain. All obtained historical materials (maps, plans etc.) of the object were pre-processed and then loaded in prediction model. For each possible development stage of the historical object was assigned one state in Markov model. The computation of transition probabilities between states of the Markov model were made by the interpolation method. In this method are compared two neighboring layers and evaluated changes in the object position. The interpolation was performed using ArcGIS GeoStatistical Analyst extension. When modeling a system characterized by a short-range variation of the data - a reasonable assumption in this case, considering that the width of the transition area between object position in previous layer and a next layer in a cartographic representation is likely to be small - a Local Polynomial Interpolator. Assuming that each point affects the value of the surface only in its immediate vicinity, the algorithm produces surfaces that represent local variation reasonably well. The whole process was driven from a knowledge base that is created by experts in the field of history. Predictive model is verified on site of Spilberk Castle, which dominates the city of Brno and ranks among an important heritage objects in the Czech Republic. Predictive model was created in the geographic information system (GIS) ArcGIS of ESRI company.

TS02K - Surveying History, 5537 Dalibor Bartoněk Prediction model to identify the significant development periods of historical objects FIG Working Week 2012 Knowing to manage the territory, protect the environment, evaluate the cultural heritage Rome, Italy, 6-10 May 2012
2/17
Prediction model to identify the significant development periods of historical objects
Dalibor BARTONĚK, Czech Republic
1. INTRODUCTION A human being is essentially an inquiring creature because the eagerness for knowledge of nature lies in the depth of each human’s mind. This fact confirms the sequence of evolutionary phases of the mankind. The stadium A wise man (homo sapiens) is followed by a higher stadium A man anxious know (homo cupidus sciendi). From time immemorial people wanted to know not only their presence and past but also their future. This desire resulted in various forms of soothsaying and developed into contemporary modern prediction methods. From our past we know, how difficult it is to tell our future reasonably which originates from the very principle of the issue. In this case people try to get in the door which no one has ever opened and try to tell the future on the basis of a secret we don’t have the notion of. Despite of all the mentioned hardships, prediction methods have become parts of all control and decisive processes. If we want to achieve maximum efficiency and sustain profitability it would be necessary to posess detailed reports watching the stability of the model in the course of its all life’s cycle. The term prediction can rank among the sphere data mining. The aim is to set the object parameter value (static part of prediction) or to set the dating of the phenomenon (dynamic part of prediction) either in the future or even in the past. According to the direction from the starting point of prediction in time axis, we distinguish prediction ex-post (interpolation) or prediction ex-ante (extrapolation) - see Fig. 1. Prevailing part of prediction models is designed for ex-ante; the prediction ex-post has its significance mainly in historical science and archaeology (Allen et all 1990), (Macháček 2008), (Neústupný 1994).
Fig. 1. Prediction in time axis Nowadays prediction models can be used practically in all branches of people’s activities. The most frequent usage is in economy (production trends), financial (currency prediction), marketing sphere (analyses of good sales) (Buryan 2007), distribution (gas/electricity consumption prediction) in botanics (prediction of weed spreading) (Křivánek 2006) in biology and medicine (pacient’s possible reaction on medicaments), social economic spheres (labour market, unemployment) in technical science (control and regulation of devices with
prediction ex - post prediction ex - ante
Lower limit of prediction
Upper limit of prediction
Treshold of prediction

TS02K - Surveying History, 5537 Dalibor Bartoněk Prediction model to identify the significant development periods of historical objects FIG Working Week 2012 Knowing to manage the territory, protect the environment, evaluate the cultural heritage Rome, Italy, 6-10 May 2012
3/17
state prediction) etc. A special position have prediction models in spatial attached systems. These are based on technology of geographical information systems (GIS) e.g. (Allen et all 1990), (Macháček 2008). The next contribution uses Markov model for the prediction (Yan et all 2011). This article is devoted to these systems. The reconstruction of historical object is topic of most research works (Martini 1998), (Becker 2009), (Tringali et all 2003), (Foti et all 2012), (Moltedo et all 2000). The other part of related works uses automatic methods of reconstruction of historical objects (Pedersini et all 2000), (Roh et all 2011), (Tang .et all 2010), (Haala & Kada 2010). In other works we can find the special methods in GIScience for solving the similar topic (Xu & Coors 2012), (Baranoski 2008), (Kokot & Zembaty 2009), (Verstrynge et all 2011), (Griffiths et all 2004), (El-Mechaiekh 2000), (James et all 2012), (Jenny & Hurni 2011). 2. METHOD OF SOLUTION The whole process of reconstruction of historical objects can be divided into several phases – see Fig. 2. The most difficult phase of the whole process is a collection of accessible historical materials. It involves time consuming searching in various both inland and foreign sources (such as museums, libraries, archives etc.).
Fig. 2. Workflow of reconstruction process Then follows material classification according to the usage in prediction model. Classification tree is in Fig. 3. The data preparation deals with transfer of all selected documents in digital form. Graphical data are scanned with the recommended resolution (minimum 200 dpi) and consequently are processed in a suitable raster editor (Adobe Photoshop). Text documents serve to setting of predictive model parameters. The time-bound information determines the individual stages of the object development. Spatially bounded data are decisive for the selection of suitable means for spatial analysis in GIS (visibility, topology etc.). The last phase – presentation and usage of the results contains a summary of outputs from the prediction model in the form of a map or plans of a given historical object. The prediction model in based on Markov chain and is described in the next chapter.
Collection of
accessible data
Data selection
and classification
Data
preparation
Prediction
model
Presentation and next usage of
the results

TS02K - Surveying History, 5537 Dalibor Bartoněk Prediction model to identify the significant development periods of historical objects FIG Working Week 2012 Knowing to manage the territory, protect the environment, evaluate the cultural heritage Rome, Italy, 6-10 May 2012
4/17
Fig. 3. Classification tree of historical materials 3. DESIGN OF THE PREDICTIVE MODEL According to the nature of the evidence the prediction of phenomenon or the existence of an object (Neustupný 1995) are predictive methods divided into: 1. Inductive and 2. Deductive. Inductive prediction works on the the basis of direct physical evidence (excavations, finds remains of the walls, etc.). Deductive prediction is based on indirect evidence and similarities to other phenomena or objects of that class (written reports, plans, former trends in development, etc.). In the designed model both types of predictions have been made use of. Conception of the prediction model – see Fig. 4. Inputs of the model are spatial and attribute data after previous classification – see Fig. 3. The knowledge base contains a set of rules for the reconstruction of historical buildings and is interactively controlled by experts in the field of history. Block users includes the creator of the project (project manager) and the before mentioned experts in the field of history. These users set the input values of the model, verify the output layers from the GIS and according to the results correct input values of the model. The core of the model consists of 2 parts: 1. Pre-processing. 2. Processing (editing and spatial analyses with usage of the prediction model).
Historical materials
Text documents
Graphical documents
Without spatial information
With spatial information
Without spatial information
With spatial information
Time-description of
the object
Position and topology of the
object
Pictures, photos
Maps, plans

TS02K - Surveying History, 5537 Dalibor Bartoněk Prediction model to identify the significant development periods of historical objects FIG Working Week 2012 Knowing to manage the territory, protect the environment, evaluate the cultural heritage Rome, Italy, 6-10 May 2012
5/17
Fig. 4. Conception of the prediction model 3.1 Preprocessing Preprocessing involves the transformation of graphical materials (maps, plans) as follows: a) Geo-rectification in a common coordinate system. Generally it is a very difficult task because it is necessary to identify a pair of identical points. In many cases were identical points found by the archaeological research. This problem is in detail solved in (Tucci & Giordano 2011). b) Unification of cartographic language of all materials proceeds in such a way so that cartographic phenomena in different periods of history can be mutually comparable. This unification is realized on the base of ontology. In the processing in GIS, layouts are generated in the form of maps or plans of a particular object referring to a certain period. It is an iterative process in which, according to the base of knowledge or help of experts, graphical layouts are edited. The missing components are completed by prediction method on the basis of experience from similar reconstructions. The final layers are eventually included into classes which represent significant periods of historical development of the object. The above mentioned classification was made according to Markov chain – see Fig. 5. States in the chain represent a certain stage of construction changes in historical object, transitions are evaluated by probabilities of transitions within these states. 3.2 Prediction model based on Markov chain Consider a stochastic process {Xn, n = 1, 2, …} that takes on a finite or countable number of possible values. Unless otherwise mentioned, this set of possible values of the process will be denoted by the set of non negative integers {1, 2, …}. If Xn =i , then the process is said to be in state i at time n. Suppose that when ever the process is in state i, there is a fixed probability Pij
Initial inputs of the model
Spatial data
Attribute data
Base of knowledge
The core of the prediction
model based on GIS Verification
of outputs
Correction of input values
Outputs
convenient
inconvenient
Users
Feedback

TS02K - Surveying History, 5537 Dalibor Bartoněk Prediction model to identify the significant development periods of historical objects FIG Working Week 2012 Knowing to manage the territory, protect the environment, evaluate the cultural heritage Rome, Italy, 6-10 May 2012
6/17
that it will be next in state j. That is
{ } { } ijnnnnnn PiXjXPiXiXiXiXjXP ========= +−−+ 11122111 ,...,, (1)
for all states i0, i1, …, in-1, i,j and all n ≥ 0. Such a stochastic process is known as a Markov chain. Equation (1) can be interpreted as stating that, for a Markov chain, the conditional distribution of any state Xn+1, given the past states X1, X2, …, X, n≥1 and the present state Xn, is independent of the past states and depends only on the present state. This is called the Markovian property. The value Pij represents the probability that the process will, when in state i, next make a transition into state j. Since probabilities are non negative and since the process must make a transition into some state, we have that
,...2,1,1;0,,01
==≥≥ ∑∞
=
iPjiPj
ijij (2)
If the process has a finite number of states, which means thes tates pace S={1,2,y, i, j, … s}, then the Markov chain model can be defined by the matrix of one-step transition probabilities, denoted as
=
ssss
s
s
PPP
PPP
PPP
P
21
22221
11211
(3)
The initial probability is computed by
i
ijij N
NP = (4)
where Nij denotes the transition times from state i to state j and Ni denotes the number of random variables {Xn, n=1,2, …, m} belonging to state i. Markov chain model adopts state vector and state transition matrix to deal with the prediction issue. Suppose the state vector of moment t–1 is Pt-1, the state vector of moment t is Pt and the state transition matrix is P, then the relationship is
KtPPP tt ,...,2,1,1 == − (5)
Update t from 1to K, then
KK PPP 0= (6)
where PK is the state vector at moment K.

TS02K - Surveying History, 5537 Dalibor Bartoněk Prediction model to identify the significant development periods of historical objects FIG Working Week 2012 Knowing to manage the territory, protect the environment, evaluate the cultural heritage Rome, Italy, 6-10 May 2012
7/17
Equation (5) is the basic Markov prediction model, if the initial state vector and the transition matrix are given, which allows calculation of any possible future state vector. Conventionally, the state with maximal probability is chosen as the next step state, known as the maximal probability rule (Yan et all, 2011). In our case we can use this model in the form of the graph on fig. 5.
Fig, 5. Markov chain for classification of output layers in the prediction model In Fig. 5:
• ps is probability of remaining in the current state • pi, i-1 is probability of transition to previous state • pi, i+1 is probability of transition to next state
For each possible stage of the historical object is assigned one state in Markov model. The computation of above mentioned probabilities will be made by the interpolation method. In this method are compared two neighboring layers and evaluated changes in the object position. Distances between objects in these layers are performed according the equations (7), (8) in floating window. The interpolation was performed using ArcGIS GeoStatistical Analyst extension. When modeling a system characterized by a short-range variation of the data - a reasonable assumption in this case, considering that the width of the transition area between object position in previous layer and a next layer in a cartographic representation is likely to be small - a Local Polynomial Interpolator is generally employed (Akima, 1970). Assuming that each point affects the value of the surface only in its immediate vicinity (Mitas & Mitasova, 1999), the algorithm produces surfaces that represent local variation reasonably well (Tucci et al., 2010, 54–55):
( ) ( )( )2
10 ,,∑
=
−n
iiiiii yxyxZw µ (7)
The interpolation is based on a moving window centered at µµµµ0(x, y), where n is the number of points within the window, and wi is the weight:
Si+1
ps
Si Si-1
ps ps pi-1, i pi, i+1
pi, i-1 pi+1, i

TS02K - Surveying History, 5537 Dalibor Bartoněk Prediction model to identify the significant development periods of historical objects FIG Working Week 2012 Knowing to manage the territory, protect the environment, evaluate the cultural heritage Rome, Italy, 6-10 May 2012
8/17
= a
d
i
i
ew03
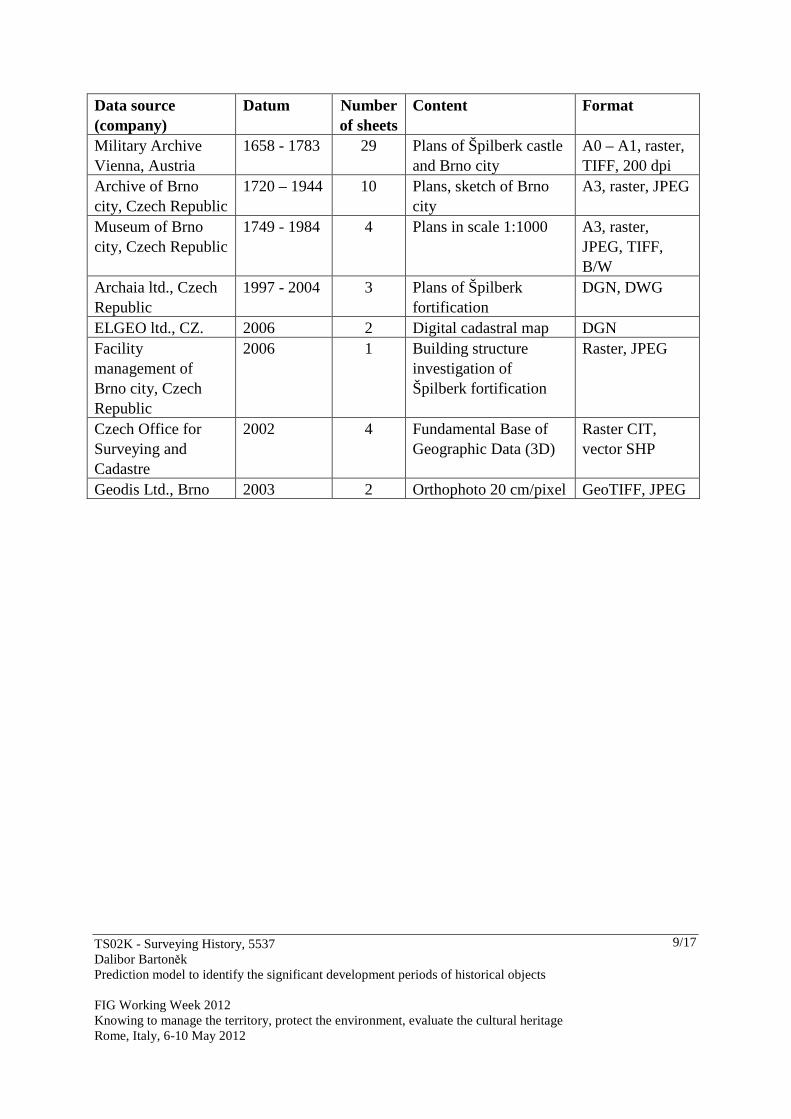
(8) where di0 is the distance between the point and the center of the window, a is the parameter that controls the distance decay, Z is the datum at the location i, and µµµµ0(xi, yi) is the value of the polynomial (Johnston et al., 2003). The output of the model is time-structured set of maps or plans showing the major stages of development of a historical building. 4. RECONSTRUCTION OF THE ŠPILBERK CASTLE The designed prediction model was verified on the project of Špilberk castle (Brno, Czech Republic) reconstruction (Procházka 2007, 2009). 4.1 Short history of Špilberk castle Špilberk Castle was established as a royal castle in the 13th century during the reign of the Přemyslide family. After the successful defence against the Swedish army in 1645 it was rebuilt into a massive Baroque fortress. It had served consecutively as both a jail and a barracks from the end of the 18th century until the sixties when it was declared a national heritage monument and became the seat of Brno City Museum. Nowadays it offers plenty of expositions and exhibitions as well as renowned casemates – the hardest prison in the Habsburg Monarchy. Besides 7 permanent expositions dedicated to Brno history, art and architecture visitors can currently enjoy magnificent view of the city from the View tower, visit a fencing tournament or listen to the bells. 4.2 Data collection The first step of the project - source materials and information collection was the most demanding of all its phases as for the consumption of time and organization as well. The most of historical maps of a higher quality were gained in a Military archive in Vienna (Kriegsarchiv Wien, Nottensdorfgasse 2). To the oldest and the most valuable exemplary belongs de Rochepien’s plan of Brno city of 1749 - see Fig. 6. The summary of all gained materials is in the table No. 1. Table 1 - Documents for reconstruction overview
TS02K - Surveying History, 5537 Dalibor Bartoněk Prediction model to identify the significant development periods of historical objects FIG Working Week 2012 Knowing to manage the territory, protect the environment, evaluate the cultural heritage Rome, Italy, 6-10 May 2012
9/17
Data source (company)
Datum Number of sheets
Content Format
Military Archive Vienna, Austria
1658 - 1783 29 Plans of Špilberk castle and Brno city
A0 – A1, raster, TIFF, 200 dpi
Archive of Brno city, Czech Republic
1720 – 1944 10 Plans, sketch of Brno city
A3, raster, JPEG
Museum of Brno city, Czech Republic
1749 - 1984 4 Plans in scale 1:1000 A3, raster, JPEG, TIFF, B/W
Archaia ltd., Czech Republic
1997 - 2004 3 Plans of Špilberk fortification
DGN, DWG
ELGEO ltd., CZ. 2006 2 Digital cadastral map DGN Facility management of Brno city, Czech Republic
2006 1 Building structure investigation of Špilberk fortification
Raster, JPEG
Czech Office for Surveying and Cadastre
2002 4 Fundamental Base of Geographic Data (3D)
Raster CIT, vector SHP
Geodis Ltd., Brno 2003 2 Orthophoto 20 cm/pixel GeoTIFF, JPEG

TS02K - Surveying History, 5537 Dalibor Bartoněk Prediction model to identify the significant development periods of historical objects FIG Working Week 2012 Knowing to manage the territory, protect the environment, evaluate the cultural heritage Rome, Italy, 6-10 May 2012
10/17
Fig. 6. - De Rochepine’s plan of Brno city from 1749 year. 4.3 Data selection and classification Materials collected in previous phase occurred to be insufficient for processing. Above all it was necessary to look up and determine appropriate identical points for geo-referencing of old maps. Further it was necessary to verify current map material and compare them with a reality. For these reasons the collected data were completed with direct geodetic measurement in field. The actual selection of suitable materials for reconstruction was consulted with experts at Middle age archeology from Brno Museum. A basic document for a choice of appropriate elements and identical points for reconstruction was present cadastral map of a given locality. This map contained objects which can be divided into 2 categories: 1. Preserved parts of an object of late 18th century. 2. Objects with small construction works which cannot influence identification with old maps and plans (facades adaptations, building reconstruction on an original object etc.). Above mentioned objects contained localities for placement of reference points for geo-referencing of old map documents. Other necessary identical points were obtained by geodetic surveying of south-west bastion of the castle which was newly reconstructed in the year 2002

TS02K - Surveying History, 5537 Dalibor Bartoněk Prediction model to identify the significant development periods of historical objects FIG Working Week 2012 Knowing to manage the territory, protect the environment, evaluate the cultural heritage Rome, Italy, 6-10 May 2012
11/17
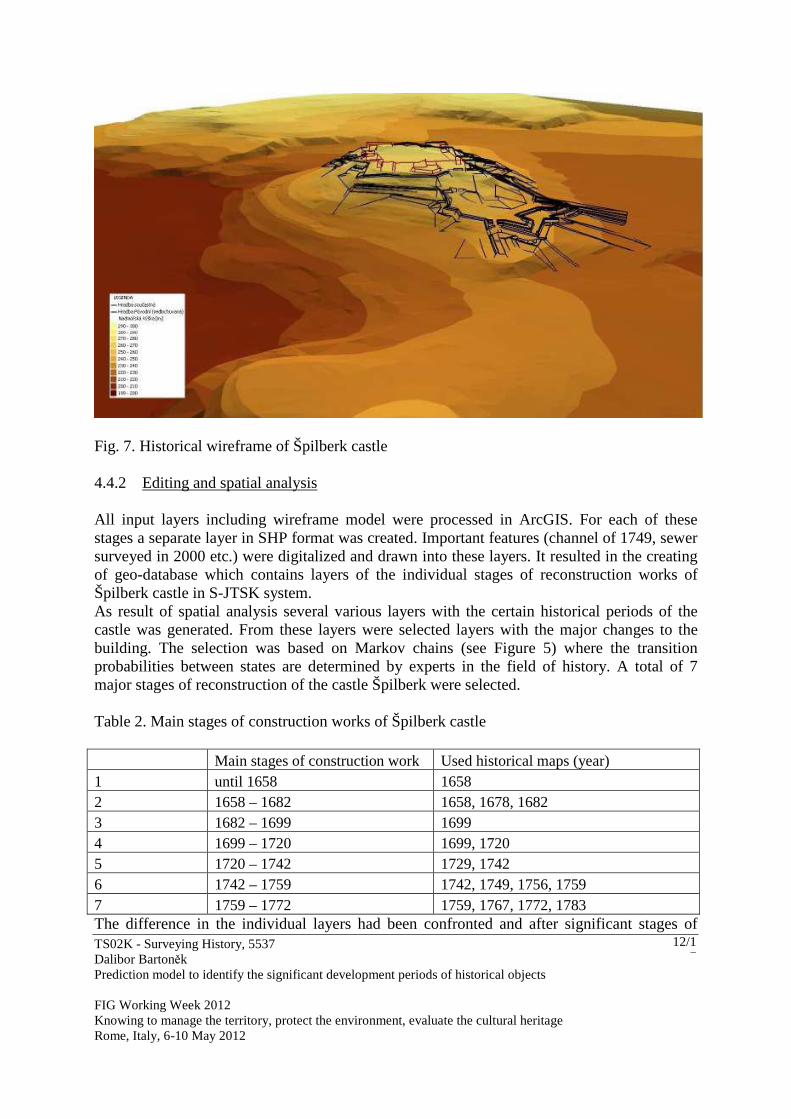
in the frame of archeological research. These points are the most accurate (both in history and planimetry). Rest of reference points was obtained in prediction model in ArcGIS by the method of cellular automata in Raster Calculator. In the next step was all selected materials classified according to the classification tree – see fig. 3. 4.4 Processing in prediction model 4.4.1 Preprocessing After data input into ArcGIS historical maps were geo-referenced by affine transformation according to selected identical points. It was necessary to choose and survey identical points for geo-referencing. For geodetic surveying of current objects of the castle GPS RTK method with the help of Leica System 1200 apparature was used. Particular dimensions of the construction were measured with BOSH DLE 30 laser range finder. All the measured values were calculated into S-JTSK system (Datum of Uniform Trigonometric Cadastral Network) and imported into MicroStation V8. With historical maps it was necessary to calculate all dimensions from Vienna fathom (1° = 1,896 m) into metric system. The most demanding and at the same time the most time consuming task was spatial drawing of sections in historical plans in MicroStation V8. The process had these phases: 1. Finding out and drawing approximate position of the section. 2. Marking intersection with current contour of the object. 3. Profile unification with current condition of the object (shift). 4. Verification of created profile according to contour lines in digital terrain model. As a result of it is a historical wireframe model of Špilberk castle in DGN format – see Fig. 7. Geo-database created in the stage of planimetry reconstruction of the project was completed with these results. All altimetric dimensions were calculated into altimetry system Bpv (Baltic Vertical Datum after Adjustment).
TS02K - Surveying History, 5537 Dalibor Bartoněk Prediction model to identify the significant development periods of historical objects FIG Working Week 2012 Knowing to manage the territory, protect the environment, evaluate the cultural heritage Rome, Italy, 6-10 May 2012
12/17
Fig. 7. Historical wireframe of Špilberk castle 4.4.2 Editing and spatial analysis All input layers including wireframe model were processed in ArcGIS. For each of these stages a separate layer in SHP format was created. Important features (channel of 1749, sewer surveyed in 2000 etc.) were digitalized and drawn into these layers. It resulted in the creating of geo-database which contains layers of the individual stages of reconstruction works of Špilberk castle in S-JTSK system. As result of spatial analysis several various layers with the certain historical periods of the castle was generated. From these layers were selected layers with the major changes to the building. The selection was based on Markov chains (see Figure 5) where the transition probabilities between states are determined by experts in the field of history. A total of 7 major stages of reconstruction of the castle Špilberk were selected. Table 2. Main stages of construction works of Špilberk castle Main stages of construction work Used historical maps (year) 1 until 1658 1658 2 1658 – 1682 1658, 1678, 1682 3 1682 – 1699 1699 4 1699 – 1720 1699, 1720 5 1720 – 1742 1729, 1742 6 1742 – 1759 1742, 1749, 1756, 1759 7 1759 – 1772 1759, 1767, 1772, 1783 The difference in the individual layers had been confronted and after significant stages of

TS02K - Surveying History, 5537 Dalibor Bartoněk Prediction model to identify the significant development periods of historical objects FIG Working Week 2012 Knowing to manage the territory, protect the environment, evaluate the cultural heritage Rome, Italy, 6-10 May 2012
13/17
construction work of the castle were determined – see table 2. The overview of main historical stages of construction work of Špilberk castle is in Fig. 8.
Fig. 8. Main stages of Špilberk castle construction work 5. CONCLUSIONS The goal of the project was to present the prediction model and verify it on the historical reconstruction of building adaptations of the whole area of Špilberk castle. The reconstruction was processed on historical maps’ and document’s base. The most complicated part of the reconstruction was that of northern part of castle fortification because of a minimum of preserved original elements. It would be of great use to make complete information on archeological and construction historical research of the citadel and specify it. Brno museum plans a building research in its locality with the help of sonds and other excavation work. The result of this project will be made use of in the practice under these activities. Another contribution of this project is a creation of 3D model today non-existing baroque fortification of Špilberk castle. It will be historically the first 3D digital model of the citadel taking original shape the one the second half of 18th century. I believe the results of historical reconstruction of Špilberk castle and its surroundings will become a valuable contribution not only for institutes and people working in the field of medieval archeology, but it will also draw attention of general public. REFERENCES

TS02K - Surveying History, 5537 Dalibor Bartoněk Prediction model to identify the significant development periods of historical objects FIG Working Week 2012 Knowing to manage the territory, protect the environment, evaluate the cultural heritage Rome, Italy, 6-10 May 2012
14/17
Akima, H. (1970). A new method of interpolation and smooth curve fitting based on local procedures. Journal of the Association for Computing Machinery, 17, 589–602. Allen G., Green S. and E.Zubrow (eds.) (1990): Interpreting Space: GIS and Archaeology. London: Taylor and Francis. Baranoski E J. (2008). Through-wall imaging: Historical perspective and future directions. Original Research Article. Journal of the Franklin Institute, Volume 345, Issue 6, September 2008, Pages 556-569. Becker S. (2009). Generation and application of rules for quality dependent façade reconstruction. Original Research Article. ISPRS Journal of Photogrammetry and Remote Sensing, Volume 64, Issue 6, November 2009, Pages 640-653. BURYAN, P. (2007): Moderní metody predikce měnových kurzů (Modern methods of exchange rates prediction). University of Economics, Prague, Czech Republic. El-Mechaiekh H. B. (2000). Spaces and maps approximation and fixed points. Original Research Article. Journal of Computational and Applied Mathematics, Volume 113, Issues 1–2, 1 January 2000, Pages 283-308. Foti D., Diaferio M., Giannoccaro N. I., Mongelli M. (2012). Ambient vibration testing, dynamic identification and model updating of a historic tower. Original Research Article. NDT & E International, Volume 47, April 2012, Pages 88-95. Griffiths T., Fernandes A. A., Paton N. W., Barr R. (2004) The Tripod spatio-historical data model. Original Research Article. Data & Knowledge Engineering, Volume 49, Issue 1, April 2004, Pages 23-65. Haala N., Kada M. (2010). An update on automatic 3D building reconstruction. Original Research Article. ISPRS Journal of Photogrammetry and Remote Sensing, Volume 65, Issue 6, November 2010, Pages 570-580. James L. A., Hodgson M. E., Ghoshal S., Latiolais M. M. (2012). Geomorphic change detection using historic maps and DEM differencing: The temporal dimension of geospatial analysis. Original Research Article. Geomorphology, Volume 137, Issue 1, 15, Pages 181-198. Jenny B., Hurni L. (2011). Studying cartographic heritage: Analysis and visualization of geometric distortions. Original Research Article. Computers & Graphics, Volume 35, Issue 2, April 2011, Pages 402-411. Kokot S., Zembaty Z. (2009). Damage reconstruction of 3D frames using genetic algorithms with Levenberg–Marquardt local search. Original Research Article. Soil Dynamics and

TS02K - Surveying History, 5537 Dalibor Bartoněk Prediction model to identify the significant development periods of historical objects FIG Working Week 2012 Knowing to manage the territory, protect the environment, evaluate the cultural heritage Rome, Italy, 6-10 May 2012
15/17
Earthquake Engineering, Volume 29, Issue 2, February 2009, Pages 311-323. KŘIVÁNEK, M. (2006): Biologické invaze a možnosti jejich předpovědi (Biological invasions and different approaches of their prediction). Acta Pruhoniciana 84. Macháček, J., (2008), Prostorová archeologie a GIS (Spatial Archaeology and GIS) in: Počítačová podpora archeologie (Computer Aided Archaeology). Masarykova univerzita Brno, 391 pp. Martini K. (1998). Ancient structures and modern analysis: investigating damage and reconstruction at Pompeii. Original Research Article. Automation in Construction, Volume 8, Issue 1, November 1998, Pages 125-137. Mitas, L. M., & Mitasova, H. (1999). Spatial interpolation. In P. Longley, M. Goodchild, D. Maguire, & D. Rhind (Eds.). Geographical Information Systems: Principles, techniques, management and applications (Vol. 1, pp. 481–492). London: Wiley. Moltedo L., Mortelliti G., Salvetti O., Vitulano D. (2000). Computer aided analysis of the buildings. Original Research Article. Journal of Cultural Heritage, Volume 1, Issue 1, January 2000, Pages 59-67. Neustupný, E. (1994): Předvídání minulosti (Predicting the past). Technický magazín 11, 58-60. Neustupný, E. (1995): Beyond GIS. In: Lock,G. and Z.Stančič (eds.), Archaeology and Geographical Information Systems: a European Perspective, 133-139. London: Taylor&Francis. Pedersini F., Sarti A., Tubaro S. (2000). Automatic monitoring and 3D reconstruction applied to cultural heritage. Original Research Article. Journal of Cultural Heritage, Volume 1, Issue 3, 2 November 2000, Pages 301-313. Procházka, T. (2007). Planimetric component of a map reconstruction of historical fortification of Špilberk castle. Bachelor work, Institute of Geodesy, Faculty of Civil Engineering, Brno University of Technology, 29 pp (in Czech). Procházka, T. (2009). Altimetric component of a map reconstruction of historical fortification of Špilberk castle. Bachelor work, Institute of Geodesy, Faculty of Civil Engineering, Brno University of Technology, 47 pp (in Czech). Roh S., Aziz Z., Peña-Mora F. (2011). An object-based 3D walk-through model for interior construction progress monitoring. Original Research Article Automation in Construction, Volume 20, Issue 1, January 2011, Pages 66-75. Tang P., Huber D., Akinci B., Lipman R., Lytle A. (2010). Automatic reconstruction of as-built building information models from laser-scanned point clouds: A review of related

TS02K - Surveying History, 5537 Dalibor Bartoněk Prediction model to identify the significant development periods of historical objects FIG Working Week 2012 Knowing to manage the territory, protect the environment, evaluate the cultural heritage Rome, Italy, 6-10 May 2012
16/17
techniques. Review Article. Automation in Construction, Volume 19, Issue 7, November 2010, Pages 829-843. Tringali S., De Benedictis R., La Rosa R., Russo C., Bramante A., Gavarini C., Valente G., Ceradini V., Tocci C., Tobriner C., Maugeri M., Binda L., Baronio G. (2003). The reconstruction of the Cathedral of Noto. Original Research Article. Construction and Building Materials, Volume 17, Issue 8, December 2003, Pages 573-578. Tucci, M., Giordano, A., & Ronza, R. W. (2010). Using spatial analysis and geovisualization to reveal urban changes: Milan, Italy, 1737–2005. Cartographica, 45, 47–63. Tucci M., Giordano A. (2011). Positional accuracy, positional uncertainty, and feature change detection in historical maps: Results of an experiment. COMPUTERS ENVIRONMENT AND URBAN SYSTEMS Volume: 35 Issue: 6 Pages: 452-463. Verstrynge E., Schueremans L., Van Gemert D., Hendriks M. A. N. (2011). Modelling and analysis of time-dependent behaviour of historical masonry under high stress levels. Original Research Article. Engineering Structures, Volume 33, Issue 1, January 2011, Pages 210-217. Xu Z., Coors V. (2012). Combining system dynamics model, GIS and 3D visualization in sustainability assessment of urban residential development. Original Research Article. Building and Environment, Volume 47, January 2012, Pages 272-287. Yan J., Guo C., Wang X. A (2011). Dynamic multi-scale Markov model based methodology for remaining life prediction. Original Research Article. Mechanical Systems and Signal Processing, Volume 25, Issue 4, May 2011, Pages 1364-1376. BIOGRAPHICAL NOTES

TS02K - Surveying History, 5537 Dalibor Bartoněk Prediction model to identify the significant development periods of historical objects FIG Working Week 2012 Knowing to manage the territory, protect the environment, evaluate the cultural heritage Rome, Italy, 6-10 May 2012
17/17
Assoc. prof. Dalibor Bartoněk Graduated from Faculty of Electrical Engineering, Brno University of Technology, specialization Electronic computers, is currently an assoc. prof. at the Institute of Geodesy Faculty of Civil Engineering. He deals with computer graphics, databases, programming and GIS.
CONTACTS Title Given name and family name: Assoc. prof. Dalibor Bartoněk Institution Institute of Geodesy, Faculty of Civil Engineering, Brno University of Technology Address: Veveří 95 City: Brno COUNTRY: Czech Republic Tel. +420 541147204 Fax + 420 541147218 Email: [email protected] Web site: http://www.fce.vutbr.cz/struktura/zamestnanec.asp?IDprac=2310&ID=bartonek.d