prediction of intracardiac pressures and assessment of - deep blue
TRANSCRIPT

Prediction of Intracardiac Pressures and Assessment of Ventricular Function with Doppler Echocardiography
A. REBECCA SNIDER, M.D. C. S. Mott Children’s Hospital, University of Michigan Medical Center, Ann Arbor, Michigan.
Doppler echocardiography provides a nonin- vasive technique by which blood flow in cardiac chambers and vessels can be characterized, and the timing and direction of flow can be deter- mined. Transvalvular pressure gradients can be quantified noninvasively by Doppler echocardi- ography. Combined imaging and Doppler allow quantification of volume flow rates. Intracar- diac pressures and cardiac function can be eval- uated by combining such measurements with observations from the physical examination.
One of the most important concepts used in noninvasive estimation of intracardiac pres- sures is that transvalvular pressure gradients can be calculated in the presence of valvular regurgitation as well as in the presence of val- vular stenosis. In both instances, the Doppler equation is used to calculate blood velocity (V) from the Doppler frequency shift (Fd) and the cosine of the Doppler angle (COS 6):
V = (Fd)/COS 6 ) (K)
where the constant (K) in the Doppler equation is speed of ultrasound in tissue divided by “2” times the carrier frequency. The equation is fur- ther simplified in most clinical settings by aligning the ultrasound beam parallel to the high velocity vectors from the stenotic or regur- gitant lesion. The cosine of the Doppler angle is then assumed to be 1 and the blood velocity is directly proportional to a constant times the Doppler frequency shift. Underestimation of true velocity is possible when using this ap- proach.
Address for correspondence: A. Rebecca Snider, M.D., F1609, C. S. Mott Children’s Hospital, University of Michi- gan Medical Center, Ann Arbor, MI 48109.
Pressure gradients (PG) are calculated by measuring the velocity (V) across the valve. The simplified Bernoulli equation:
PG = 4 (V)’ allows calculation of the pressure gradient from the blood velocity.’-’’
This article reviews noninvasive quantifica- tion of intracardiac pressure and assessment of cardiac function. The Bernoulli equation is used extensively to quantify intracardiac pressures. Analysis of the timing of flow is utilized to as- sess intracardiac pressures as well as cardiac function.
Calculation of Intracardiac Pressures Doppler echocardiography allows estimation
of right ventricular, pulmonary artery, left ven- tricular, and left atrial pressures. Because esti- mation of pulmonary artery pressure is most useful and least prone to error, it is discussed first.
Right Heart Pressures Because pulmonary artery and right ventricu-
lar systolic pressures are nearly equal in the ab- sence of disease involving the right ventricular outflow tract, pulmonic valve, or supravalvular region, pulmonary artery systolic pressure is commonly estimated by techniques that mea- sure right ventricular systolic pressure. The most common method involves using tricuspid regurgitation to calculate the right ventricular- to-right atrial pressure gradient. Pulmonary ar- tery systolic pressure can also be calculated di- rectly by noting the timing of the peak pulmo- nary artery pressure. Both approaches are clinically useful.
1. Pulmonary Artery Systolic Pressure from Tricuspid Regurgitation. Doppler echocardio- graphic evidence of tricuspid regurgitation is
Vol. 4, No. 4, 1987 ECHOCARDIOGRAPHY A Review of Cardiovascular Ultrasound 305

SNIDER
common in patients with pulmonary hyperten- sion, as well as in normal patients who have no physical evidence of tricuspid valve disease." As shown in Figure 1, the Doppler signals charac- teristic of tricuspid regurgitation can be re-
Figure 1. High pulse repetition frequency Doppler recording (bottom) from the apical four-chamber view (top) of a patient with multivalvuhr disease. The sam- ple volume is positioned in the right atrium (RA) prox- imal to the tricuspid valve. The Doppler spectral trac- ing shows signals below the baseline in systole indkat- ing flow from the right ventricle (RV) to the RA in systole or tricuspid insufficiency (TI). The peak veloc- ity of the TI jet (black arrow) is 2.5 mlsec. This predicts a pressure gradient of 4 X (2.5y or 25 mmHg between the RA and RV in systole. RA pressure was measured by a central verwus pressure line to be 36 mmHg. Peak R V systolic pressure is, therefore, 36 + 25 or 61 mmHg. LA = left atrium; LV = left ventricle.
corded by placing the transducer a t the cardiac apex and obtaining a four-chamber view. The ultrasound beam is directed through the tricus- pid valve and aligned parallel to the high veloc- ity jet between the right ventricle and the right atrium. Careful adjustment of the transducer location and the ultrasound beam is essential to assure a small Doppler angle and accurate quantification of actual velocity. Pansystolic velocities from the right ventricle into the right atrium are directed away from the transducer and are thus shown on the negative side of the baseline on the spectral time-velocity recording.
The peak systolic right ventricular-to-right atrial pressure gradient (PG/s rv-ra) is calcu- lated using the Bernoulli equation and peak sys- tolic velocity of tricuspid regurgitation (V tr) from the DopplerI2:
(PG/s rv - ra) = 4 (V tr)'
Peak right ventricular systolic pressure (P/s N) can be estimated in the presence of tricuspid regurgitation if right atrial pressure (P ra) is known:
(P/s N) = 4 (V tr)' + (P ra)
Several techniques are used to estimate right atrial pressure. If a central venous line is present, right atrial pressure can be measured directly. Physical examination allows determi- nation of the height of the jugular venous pulses but can be inexact even in experienced hands. Data from physical exam, echocardiogram, and chest x-ray can be combined to determine whether right atrial pressures are normal or ab- normal. An arbitrary 10 mmHg is added to the calculated rv-ra gradient if the above men- tioned parameters are normal.
In Figure 1, the Doppler signals toward the transducer during diastole represent forward flow through the tricuspid valve. The negative systolic velocities of tricuspid regurgitation peak at 2.5 m/sec as shown by the black arrow. The systolic tricuspid valve pressure gradient is thus 4 (2.5)2 or 25 mmHg. At the time of the Doppler study, right atrial pressure measured by a central venous line was 36 mmHg. Because the patient had no Doppler or physical evidence of obstruction near the pulmonic valve, the pul- monary artery systolic pressure was estimated at 25 + 36 = 61 mmHg.
306 ECHOCARDIOGRAPHY A Review of Cardiovascular Ultrasound Vol. 4, No. 4. 1987

DOPPLER EVALUATION OF CARDIAC PRESSURES AND VENTRICULAR FUNCTION
In patients with Doppler evidence of tricuspid regurgitation and an absence of right ventricu- lar outflow obstruction, pulmonary artery peak systolic pressure is calculated by adding the Doppler-derived rv-ra gradient to right atrial pressure. Using this technique, there has been excellent correlation between Doppler and in- vasive measurements of right ventricular and pulmonary artery systolic pressures.12
Berger et al simplified this approach by re- gressing the rv-ra gradient derived by Doppler against the pulmonary artery systolic pressure measured at catheterization.I2 His regression equation allows direct calculation of pulmonary artery systolic pressure without determination or estimation of right atrial pressure:
(P/s pa) = 4.9 (V tr)' - .09 mmHg.
2. Pulmonary Artery Systolic Pressure from Ventricular Septa1 Defect. In patients with a ventricular septal defect, right ventricular sys- tolic pressure can be estimated using a Doppler recording of the peak velocity across the septum (V vsd). Peak systolic pressure gradient be- tween the right and left ventricle (PG/s lv - rv) is calculated using the Bernoulli equation:
(PG/s IV - IV) = 4 (V vsd)'
If aortic stenosis is absent, then the brachial artery sphygmomanometer pressure (P/s ba) is useful in estimating aortic peak systolic pres- sure:
(P/s rv) = (P/s ba) - 4 (V vsd)2
If right ventricular outflow obstruction is also absent, right ventricular systolic pressure is near pulmonary artery systolic pressure.- Thus, this approach allows detection of pulmonary hypertension in patients with a VSD and ab- sence of left or right ventricular outflow tract obstruction. Using this approach, several inves- tigators have reported excellent correlations between Doppler and catheterization-deter- mined right ventricular systolic pressures (r
Technically, the examination requires high PRF or continuous-wave Doppler capable of re- solving high velocities, and parallel alignment of
= .93-.95).'3-'4
the velocity vectors through the septal defect and the ultrasound beam. Although multiple ul- trasound windows are used to assure the small- est Doppler angle, the left parasternal and sub- costal windows provide the highest Doppler fre- quency shifts. In general, the jet through perimembranous VSDs is directed anteriorly and to the right; therefore, the transducer is placed at the mid-left sternal border and aimed posteriorly, leftward, and inferi0r1y.I~ Muscular VSDs are usually more easily interrogated from a subcostal or apical window. If unusual orienta- tion of the jet is suspected, direct visualization of the jet with two-dimensional color flow imaging can be helpful to align the ultrasound beam parallel to the jet or to measure the Doppler angle.
3. Technical Problems. Both approaches re- quire that obstruction to outflow from the right ventricle be absent. Doppler and imaging echo- cardiographic examination performed before quantification should eliminate this possibility. Likewise, the possibility of left ventricular out- flow obstruction is easily eliminated during rou- tine echo exam.
Both the tricuspid regurgitation and VSD methods require parallel alignment of the ultra- sound beam and the high velocity jet to allow quantification of velocity and thus pressure gradient. Underestimation of true velocity is possible. Multiple ultrasound windows should be used. Color flow imaging may be useful in some cases to document parallel alignment or measure the Doppler angle.
The VSD approach adds the additional source of error of using brachial artery pressure to es- timate central aortic pressure. Nonsimulta- neous mesurements and the increased systolic pressure frequently noted in peripheral arteries pose additional problems.
A final problem is encountered with the VSD method. Doppler ultrasound measures the peak instantaneous pressure gradient between the left and right ventricles during systole. The dif- ference between the peak left and right ventric- ular pressures is determined at catheterization. It is possible to have "no peak-to-peak gra- dient" at catheterization and a significant peak instantaneous gradient by Doppler. Because of differences in timing of the peak in left and right ventricular pressures, velocities of up to
Vol. 4, No. 4, 1987 ECHOCARDIOGRAPHY A Review of Cardiovascular Ultrasound 307

SNIDER
2.5 m/sec (and instantaneous gradients of up to 25 mmHg) have been reported in patients in whom catheterization suggested "nonrestric- tive" VSDs.13
4. Mean and Diastolic Pulmonary Artery Pressure from Pulmonic Regurgitation. Pulmo- nary regurgitation can be recorded on the Doppler exam in about 40% of normal patients and in nearly all patients with pulmonary hy-
Figure 3. Continuous-wave Doppler tracing from a patient with significant pulmonary insufficiency (PI) after repair of tetralogy of Fallot and elevated right ventricular end-diastolic pressure. The Doppler signals from the PI je t return to baseline (black arrow) before the end of diastole because of equalization of right ven- tricular and pulmonary artery pressures in late dias- tole. PS = pulmonary stenosis.
Figure 2. Pulsed-Doppler recording (bottom) from the parasternal short-axis view (top) of a patient with pulmonary insufficiency (PI). T h e Doppler signals above the baseline in diastole represent flow toward the transducer f rom thepulmonary artery (PA) to the right ventricle (RV) in diastole (pulmonary insufiiency). The PI signals return to the baseline at end-diastole, indicating normal RV end-diastolic pressure, low P A diastolic pressure, and mild PI. Ao = aorta; LA = left atrium; RA = right atrium.
pertension." Quantification of diastolic veloci- ties in patients with pulmonary regurgitation is helpful in calculating pulmonary artery mean and end-diastolic pressures. It should be re- membered that the severity of pulmonary re- gurgitation, pulmonary hypertension, and right ventricular function all affect the end-diastolic pressure gradient across the pulmonary valve. In the presence of mild pulmonic regurgitation, normal right ventricular end-diastolic pressure, and low pulmonary artery diastolic pressure, pulmonic regurgitation Doppler velocities re- turn to the baseline at end-dia~tole '~ (Fig. 2). The low end-diastolic velocity indicates a low end-diastolic pulmonary artery to right ventri- cle pressure gradient. Unfortunately, as illus- trated in Figure 3, low end-diastolic velocities can also be detected in patients with severe pul- monic regurgitation and elevation of right ven- tricular end-diastolic pressure. In individuals with elevated pulmonary artery systolic and dia- stolic pressures and less than severe pulmonary
308 ECHOCARDIOGRAPHY A Review of Cardiovascular Ultrasound Vol. 4, No. 4, 1987

DOPPLER EVALUATION OF CARDIAC PRESSuRJ3s AND VENTRICULAR FUNCTION
regurgitation, the end-diastolic pulmonic regur- gitation remains elevated.
Despite these limitations, Masuyama and co- workersI6 showed that mean and end-diastolic pulmonary artery pressures can be calculated accurately using pulmonary regurgitant veloci- ties. Using the Bernoulli equation and the peak pulmonary regurgitant velocity a t end-diastole (V/ed pr), they calculated the diastolic pressure gradient between the pulmonary artery and the right ventricle (Pg/ed pa - N):
(PG/ed pa - N) = 4 (V/ed pr)2
Comparisons between catheterization and Doppler were good (r = .94; SEE = 3 mmHg).
Calculation of pulmonary artery diastolic pressure (P/ed pa) is possible if right atrial dia- stolic pressure is known or estimated:
(P/ed pa) = 4(V/ed pr)2 + (P ra). A good correlation between Doppler and cath- eter determinations of the pulmonary artery- right ventricular end-diastolic pressure gradient has been reported.I6 (r = 94; SEE = 3 mmHg). If
Figure 4. Continuous-wave Doppler tracing from a patient with residual pulmonary stemsis and insuffi- c i emy (PS/PI) after repair of tetralogy of Fallot. The peak velocity of the insufficiency jet at end-diastole (black arrow) is 0.4 m/sec. This predicts a minimal right ventricular to pulmonary artery pressure gradient at end-diostole.
right atrial or right ventricular end-diastolic pressures are unknown, pulmonary artery end- diastolic pressure can be calculated using a re- gression equation:
4 (V/ed pr)' = .61 (P/ed pa) - 2.
In addition, the peak velocity of the pulmonary regurgitation correlated well with mean pulmo- nary artery pressure (r = .92; SEE = 5 mmHg).
In summary, if true velocity across the pul- monic valve can be determined and right atrial pressure estimated accurately, pulmonary ar- tery end-diastolic and mean pressures can be estimated. Measurement of the true velocity re- quires a small Doppler angle to avoid underesti- mation. Inaccuracy in the measurement of right atrial pressure can lead to further difficulties.
5. Detection of Pulmonary Hypertension by Timing Pulmonary Velocities. In patients in whom tricuspid regurgitation and VSDs are ab- sent, or in those with such pathology in whom confirmatory evidence of pulmonary hyperten- sion is required, Doppler pulmonary artery ve- locity can be helpful. Hatle et al" and Kitaba- take" have suggested tha t Doppler velocity tracings from the pulmonary valve orifice in pa- tients in whom pulmonary outflow tract ob- struction is absent can be used to identify pa- tients with pulmonary hypertension. Kitaba- take and associates" noted that acceleration time (the time from onset to peak pulmonary velocity) is shortened in patients with pulmo- nary hypertension. In their study, patients with mean pulmonary artery pressure < 20 mmHg had acceleration times of 137 f 24 msec. Those with mean pulmonary artery pressure > 20 mmHg had acceleration times of 97 f 20 msec. The ratio of acceleration time/right ventricular ejection time correlated well with the log of the mean pulmonary artery pressure (AT/ET = .45 k .05 in normals and .30 k .06 in patients with pulmonary hypertension). Other studies suggest the usefulness of acceleration time alone or ac- celeration time/ejection time.'s21 Isobe and co- workers22 recently noted that the ratio of right ventricular pre-ejection period (Q-wave to onset of pulmonary artery flow) divided by accelera- tion time was the best predictor of pulmonary hypertension. Ratios > 1.1 were found in 93% of his patients with pulmonary hypertension,
Vol. 4, No. 4, 1987 ECHOCARDIOGRAPHY A Review of Cardiovascular Ultrasound 309
SNIDER
whereas 97% of normals had ratios of 4.1. Since factors other than mean pulmonary artery pressure can alter the Doppler time intervals (such as age, heart rate, RV preload and func- tion), pulmonary artery pressure based on these measurements should be interpreted with cau- t i ~ n . ~ ~
Left Heart Pressures
Left ventricular systolic and diastolic pres- sures are calculated in the presence of aortic valve disease by using systolic stenotic and dia- stolic regurgitant blood velocity, the Bernoulli equation, and sphygmomanometer blood pres- sures.
Left Ventricular Systolic Pressure
In normal patients, left ventricular systolic pressure is estimated easily by measuring bra- chial systolic blood pressure. In patients with aortic stenosis, left ventricular peak systolic pressure is calculated from Doppler measure- ment of the peak gradient across the aortic valve in systole and the simultaneous measure- ment of arm systolic blood pressure. Using the Bernoulli equation the aortic valve pressure gradient (PG/s lv - a) is determined from the peak systolic velocity across the aortic valve ori- fice (V as)'-5:
(PG/s lv - a) = 4 (V as)2
where the pressure gradient is given in mmHg if the velocity is shown in m/sec. Peak left ven- tricular systolic pressure (P/s lv) is calculated by adding brachial artery systolic sphygmoma- nometer blood pressure (P/s ba):
(P/s lv ) = 4 (V as)' + (P/s ba)
Accurate determination of velocity across the stenotic orifice is essential for accurate mea- surement of the transvalvular pressure gradient and left ventricular systolic pressure. In clinical Doppler exams, multiple ultrasound windows (apical, right parasternal, and suprasternal) are used to assure parallel alignment of the vectors from the high velocity jet and the ultrasound beam. Using this technique, accurate estimation of such gradients is possible in children and adults with aortic stenosis.6-'0
Four possible sources of error should be con-
sidered. First, the pressure gradient can be un- derestimated if the Doppler record is obtained from a site other than the high velocity jet in the valve orifice, or if the Doppler angle is in excess of 25". Second, brachial artery systolic pressure overestimates central aortic pressure. There- fore, use of brachial artery pressure, rather than central aortic pressure, would overestimate left ventricular systolic pressure. Third, the sphyg- momanometer can lead to over- or underesti- mation of true brachial artery pressure by 5-10 mmHg. Fourth, simultaneous measurements of brachial artery pressure and the transvalvular pressure gradient is difficult; potentially, nonsi- multaneous measurements can lead to over- or underestimation of the true left ventricular sys- tolic pressure.
Left Ventricular Diastolic Pressure
Left ventricular end-diastolic pressure can be useful in assessing left ventricular function or the severity of valvular disease. Left ventricular end-diastolic pressure can be estimated in the presence of aortic regurgitation. As shown in Figure 5, the ultrasound transducer is placed at the cardiac apex and a five-chamber view is ob- tained. The Doppler ultrasound beam is ori- ented parallel to the diastolic high velocity jet from the aorta into the left ventricle. The Doppler record shows diastolic velocities that are directed toward the transducer and decrease in a linear way from an early diastolic peak. Because left ventricular end-diastolic pressure is to be calculated, end-diastolic velocities (V/ed ar) are used to determine the end-diastolic aor- tic-to-left ventricular pressure gradient (PG/ed a - lv):
(PG/ed a - lv) = 4 (V/ed ar)'
Left ventricular end-diastolic pressure (Pjed lv) is calculated as the difference between brachial artery diastolic pressure (P/d ba) and the aortic regurgitant end-diastolic pressure gradient:
(P/ed lv) = (P/d ba) - 4 (V/ed ar)'
Although this is a tempting way to assess left ventricular end-diastolic pressure, errors can be large. First, the very nature of the calculation tends to magnify the potential error because a
310 ECHOCARDIOGRAPHY A Review of Cardiovascular Ultrasound Vol. 4, No. 4, 1987

DOPPLER EVALUATION OF CARDIAC PRESSURES AND VENTRICULAR FUNCTION
Figure 5. High pulse repetition frequency Doppler recording from the left ventricular (LV) ou t f iw tract of a patient wi th aortic insufficiency. T h e two-dimen- sional image of the apical view (top) shows the position of the sample volume just beneath the aortic (Ao) valve at the t ime of the Doppler recording. The Doppler spectral tracing (bottom) shows Doppler signals above the baseline i n diastole indicating blood flow toward the transducer f rom the Ao to the LV in diastole (aortic insufficiency). The peak velocity of the aortic insufi- ciency jet at end-diastole (black arrow) is 2.7 mlsec. This predicts an Ao to LV pressure gradient at end- diastole of 4 X (2.7y or 29 mmHg. The patient’s arm diastolic blood pressure was 45 mmHg. LV end-dia- stolic pressure is, therefore, 45 - 29 or 16 mmHg. LA = left atrium.
relatively small number (the end-diastolic pres- sure) is derived by subtracting two larger num- bers (brachial artery diastolic pressure from the diastolic pressure gradient). Second, the end-di-
astolic velocity is moderate to high in most cases (2.5-5.0 m/sec) and it is squared; small errors in the velocity result in large errors in the squared velocity required t o calculate the gradient. Third, brachial artery diastolic pressure fre- quently exceeds central aortic diastolic pres- sure. Fourth, sphygmomanometer diastolic pressures are frequently 5-10 mmHg different from actual brachial artery pressure. Fifth, the pressure measured and the pressure gradient calculated by Doppler are not obtained simulta- neously. Despite these limitations, this ap- proach can produce clinically useful measure- ments of left ventricular end-diastolic pressure in some patients.
Left Atrial Pressure Peak systolic left atrial pressure can be cal-
culated in patients in whom mitral regurgitation is present but aortic stenosis is absent. As seen in Figure 6, the ultrasound transducer is placed
Figure 6. Continuous-wave Doppler recording f rom the cardiac apex of a child with mitral stenosis and insufficiency (MSfMI). The peak velocity of the MI je t (black arrow) is 3.8 m/sec. This predicts a pressure gradient of 4 X (3.8y or 58 mmHg across the mitral valve in systole. The patient’s arm systolic blood pres- sure was 80 mmHg; therefore, left atrial peak pressure in systole is 80 - 58 or 22 mmHg.
Vol. 4, No. 4, 1987 ECHOCARDIOGRAPHY A Review of Cardiovascular Ultrasound 311

SNIDER
at the cardiac apex and a two- or four-chamber view is obtained with the ultrasound beam par- allel to the high velocity jet from the left ventri- cle into the left atrium. High velocity Doppler signals are noted throughout systole. The peak mitral regurgitant velocity (V mr) is used to calculate peak systolic pressure gradient be- tween the left ventricle and the left atrium (PG/s lv - la):
(PG/s lv - la) = 4 (V mr)'
If it is assumed that brachial artery systolic pressure is equivalent to left ventricular peak systolic pressure, then left atrial peak systolic pressure (P/s la) can be calculated as the differ- ence between brachial systolic pressure (P/s ba) and the systolic pressure gradient across the mitral valve:
(P/s la) = (P/s ba) - 4 (V mr)'
The potential errors encountered in the use of this approach are similar to those noted for left ventricular diastolic pressure calculation in the presence of aortic regurgitation. Despite these limitations, the approach can be applied to pa- tients with cardiomyopathy and mitral ste- n ~ s i s . ' ~
Assessment of Ventricular Function
Ventricular Systolic Function
Doppler echocardiography evaluates intra- cardiac blood flow and provides an estimate of ventricular performance that is independent of ventricular geometry. Cardiac output is one ejection phase index of function that can be calculated from the Doppler examination. Doppler-derived values for cardiac output have correlated closely with those measured inva- s i ~ e l y . ~ ~ - ~ ~ Stroke volume or cardiac output can be measured for the left ventricle by using the aortic mean velocity and cross-sectional area and for the right ventricle by using the pulmo- nary artery mean velocity and cross-sectional a~ea .~ ' -~ l
Catheterization and animal studies have shown that peak aortic acceleration is a good index of global left ventricular p e r f ~ r m a n c e . ~ ~ J ~ Doppler echocardiography provides a noninva- sive technique for the measurement of aortic peak velocity, acceleration rates and times, and
deceleration rates and times. In 1983, Gardin and colleagues34 showed that pulsed-Doppler tracings from the ascending aorta can be used to distinguish normal patients from patients with impaired systolic function (dilated cardiomyop- athy patients). Peak aortic flow velocity distin- guished normal subjects (mean 92 cm/sec, range 72-120) from cardiomyopathy patients (mean 47 cm/sec, range 35-62) with no overlap of data. The aortic velocity-time integral also distin- guished between the two patient groups with no overlap in data (normals = mean 15.7 cm and range 12.6 to 22.5; cardiomyopathy = mean 6.7 cm and range 3.5 to 9.1). The aortic acceleration time, measured from the onset of flow to the time of the peak aortic velocity, was signifi- cantly shorter in the cardiomyopathy patients (mean 73 msec, range 55-98 msec) compared to normal patients (mean 98 msec, range 83-118); however, there was considerable overlap in data between the groups. Mean aortic acceleration, calculated as peak aortic velocity divided by ac- celeration time, was also significantly reduced in cardiomyopathy patients (mean 659 cm/sec', range 389 to 921; normals = mean 955 cm/sec', range 735 to 1,318); but, again, there was over- lap in data points for the two groups. Decelera- tion time (from aortic peak velocity to end of systole) and mean deceleration rate (peak aortic velocity divided by deceleration time) were lower in cardiomyopathy patients but were less useful indexes for discriminating the two pa- tient groups.
Sabbah and colleagues35 have measured peak aortic velocity and peak acceleration rate in the ascending aorta using a continuous-wave Doppler transducer applied to the suprasternal notch. Measurements were obtained in patients a t the time of cardiac catheterization. In pa- tients with angiographic ejection fraction of >60%, peak aortic acceleration was 19 k 5 m/secz. In patients with ejection fraction of 41% to 60%, peak acceleration was significantly lower (12 +- 2 m/sec2, p < .001). In patients with ejection fraction < 4096, peak acceleration was lower (8 k 2 m/sec') than in patients with ejec- tion fraction of >60% (p < .001). An excellent correlation was found between peak aortic ac- celeration and ejection fraction (r = .go).
In a study of open-chest dogs, Wallmeyer et aP6 investigated the effects of varying preload,
312 ECHOCARDIOGRAPHY A Review of Cardiovascular Ultrasound Vol. 4, No. 4, 1987

DOPPLER EVALUATION OF CARDIAC PRESSURES AND VENTRICULAR FUNCTION
heart rate, and inotropic state on the Doppler indexes of left ventricular performance. Within a given animal, Doppler measurements of peak aortic velocity correlated closely with maximum aortic flow (r = .96) and maximum aortic accel- eration (r = 0.95), both measured with an elec- tromagnetic flow probe around the ascending aorta. Peak aortic velocity also correlated with maximum left ventricular dP/dt (r = 0.92). Doppler values for mean aortic acceleration also correlated with invasive indexes; however, there was greater interobserver variability with this Doppler parameter. The Doppler measurements of peak aortic velocity and mean aortic accelera- tion provided a method to assess changes in left ventricular performance under conditions of varying preload, heart rate, and inotropic state.
Aortic velocity and acceleration have been used to assess left ventricular function in pa- tients with acute myocardial i n f a r ~ t i o n . ~ ~ . ~ ' When measured within 18 hours of admission for an acute myocardial infarction, the Doppler indexes correlated closely with the patient's clinical status using the Forrester classifica- tion3' and with subsequent survival. The Doppler indexes have also been compared to the results of exercise stress testing performed three to four weeks after acute myocardial infarction. Aortic peak velocity and acceleration and the aortic velocity-time integral were lower at peak exercise in patients with a positive exercise stress test (21 mm of ST segment depression in any lead) than those with a negative stress test.
An indirect assessment of left and right ven- tricular systolic Performance can also be ob- tained by examining the shape of the Doppler velocity curves of the mitral or tricuspid insuf- ficiency jets.4o If the rate of rise of the systolic pressure in the ventricle is impaired, then the increase in the velocity of the insufficiency jet is slower. In this case, the time from the onset of the insufficiency flow to the peak velocity of the insufficiency jet is prolonged (Fig. 1). To make this type of assessment, a clear recording of the entire Doppler envelope throughout systole is required.
Ventricular Diastolic Function Several different indexes of left ventricular
diastolic function have been derived from the mitral valve inflow Doppler. For this technique,
a range-gated pulsed-Doppler examination of the left ventricular inflow tract is performed. From the apical four-chamber view, the Doppler cursor line and sample volume are placed in the mitral valve orifice a t an angle as nearly parallel to flow as possible (Fig. 7). The sample volume position is adjusted to record the maximum ve- locity through the mitral valve. This point usually is found just distal to the anulus near the tips of the mitral valve leaflets. As discussed later, the position of the sample volume is criti- cal in order to obtain standardized results. An adequate mitral valve Doppler examination consists of clear identification of the opening and closure points of the mitral valve and the peak velocities a t rapid ventricular filling (the peak E velocity) and during atrial contraction (the peak A velocity).
From the mitral valve Doppler tracing, sev- eral types of indexes of left ventricular diastolic filling can be calculated. First, diastolic time in- tervals reflecting the time course of relaxation can be calculated. The isovolumic relaxation time can be measured from the aortic closing component of the second heart sound to the onset of the diastolic flow velocity and requires a phonocardiogram to be recorded simulta- neously with the mitral valve Doppler tracing. The isovolumic relaxation time is 75 f 11 msec in normal subjects and is prolonged in patients with impaired left ventricular relaxation." The time from the onset of diastolic flow to the peak E velocity (0 to E time or D to E time) can be measured and is 100 -+ 10 msec in normal adults.42 The duration of the early diastolic flow period can be measured from the onset of dia- stolic flow to the time when the Doppler curve returns from peak E velocity to the baseline. This time period is 214 k 26 msec in normal subjects and has been reported to be prolonged in patients with left ventricular outflow ob- ~truction."*~~ The time from the onset of dia- stolic flow to the point where the peak E veloc- ity falls to the value of peak E/1.4 has been measured and corresponds well with M-mode measurements of the rapid filling period (nor- mals = 130 ? 20 m~ec) .~ ' Finally, the accelera- tion and deceleration half-times of early dia- stolic rapid inflow have been used to describe the time course of r e l a ~ a t i o n . ~ ~ These time pe- riods are measured as the intervals between the
Vol. 4, No. 4, 1987 ECHOCARDIOGRAPHY A Review of Cardiovascular Ultrasound 313

SNIDER
Figure 7 . Technique used to record the mitral valve inflow Doppler for evaluation of diustolicfilling. The apical four-chamber view (left) shows the position of the sample volume in the mitral orifice at the time of the Doppler recording. The Doppler tracing (right) shows the opening and closure points of mitral flow (D and C points) and the peak velocities at rapid filling (peak E) and during atrial contraction (peak A). A = anterior; LA = left atrium; R = right; RA = right atrium; RV = right ventricle.
peak E velocity and 50% of the peak E velocity on the ascending limb (acceleration half-time) and the descending limb (deceleration half- time) of early diastolic inflow.
Acceleration and deceleration half-times of the transmitral inflow velocity have been re- ported to be prolonged in patients with myocar- dial infarction (acceleration half-time > 73 msec, deceleration half-time > 100 msec) com- pared to normal subjects (acceleration half-time = 62 +. 18 msec, deceleration half-time = 73 ? 24 m ~ e c ) . ~ ~
A second type of diastolic parameter that has been measured from the mitral valve Doppler tracings are indexes of velocity and accelera- tion. The peak velocity during rapid filling or the peak E velocity can be measured and is 0.60 to 0.68 m/sec in normal adults. The peak veloc- ity in atrial contraction or the peak A velocity is
0.38 to 0.48 m/sec in normal a d ~ l t s . " , ~ ~ - ~ ~ The ratio of the peak E to peak A velocities (E/A ratio) and the ratio of the peak A to peak E velocities (A/E ratio) have been used to describe the pattern of left ventricular diastolic filling. Values for the E/A ratio in normal adults have ranged from 1.7 +. 0.4 to 2.5 f 0.9.4'-42-49 Values for the A/E ratio in normal adults have ranged from 0.44 k 0.2 to 0.66 k 0.2.45,46,48 The decelera- tion of early diastolic flow can be measured as the slope of a straight line drawn between the peak E velocity and the point where peak E decreases to peak E/2 on the descending limb of the early diastolic inflow. In normal adults, values for the deceleration have ranged from 355 k 67 cm/sec2 to 399 f 110 c r n / ~ e c * . ~ ~ * ~ ~
Abnormalities of the mitral valve peak ve- locities, velocity ratios, and deceleration iates have been reported in a number of disease
Vol. 4, No. 4. 1987 314 ECHOCARDIOGRAPHY A Review of Cardiovascular Ultrasound
DOPPLER EVALUATION OF CARDIAC PRESSURES AND VENTRICULAR FUNCTION
states. Kitabatake and c o - ~ o r k e r s ~ ~ found that the peak E velocity and deceleration were signif- icantly reduced in patients with hypertension, hypertrophic cardiomyopathy, and myocardial infarction. In their study, peak A velocity was significantly increased in patients with hyper- tension and myocardial infarction but not in patients with hypertrophic cardiomyopathy. They concluded that early diastolic filling was impaired in all three disease states and was ac- companied by a compensatory increase in filling during atrial contraction in patients with hy- pertension and myocardial infarction. In pa- tients with hypertrophic cardiomyopathy, the compensatory mechanism seemed to be a pro- longation of rapid filling rather than an in- creased filling during atrial contraction. Spirit0 and colleague^^'*^^ reported similar abnormali- ties in a group of patients with left ventricular outflow obstruction. In the patient group, the deceleration and E/A velocity ratio was signifi- cantly reduced compared to normal adults. Ta- kenaka et a1 reported different Doppler patterns of left ventricular diastolic filling in different subgroups of patients with hypertrophic cardio- m y ~ p a t h y . ~ ~ In patients with hypertrophic car- diomyopathy and systolic anterior motion of the mitral valve, no significant differences were ob- served in peak E velocity, peak A velocity, A/E velocity ratio, and deceleration compared to normal subjects. Patients with hypertrophic cardiomyopathy and no systolic anterior motion of the mitral valve, however, had decreased peak E velocity, increased A/E velocity ratio, and re- duced deceleration of early diastolic flow com- pared to normal subjects. Mitral regurgitation was detected in all patients with systolic ante- rior motion of the mitral valve and in only 33% of patients without systolic anterior motion of the mitral valve. The authors postulated that increased left ventricular early diastolic filling caused by mitral regurgitation or a less exten- sive myopathic process reported previously to occur in patients with systolic anterior motion accounted for the differences in left ventricular diastolic filling observed in subgroups of pa- tients with hypertrophic cardiomyopathy. In a similar study, Takenaka and co-workers com- pared mitral valve Doppler recordings from pa- tients with dilated cardiomyopathy with and
without mitral regurgitation to normal sub- j e c t ~ . ~ ~ Cardiomyopathy patients without mitral regurgitation had a reduced peak E velocity and an increased A/E velocity ratio compared to normal subjects. Cardiomyopathy patients with mitral regurgitation had normal peak E and peak A velocities, normal A/E velocity ratio, but a shortened deceleration half-time. These find- ings suggest that mitral regurgitation can mask filling abnormalities on the mitral valve Doppler examination in patients with dilated cardiomyopathy .
A third type of parameter that can be mea- sured from the mitral valve Doppler examina- tion are indexes of peak and mean left ventricu- lar filling rates. Rokey and colleagues compared Doppler and angiographic values for peak filling rates and half filling fraction in normal subjects and patients with coronary artery d i ~ e a s e . ~ ' Doppler peak filling rate was calculated as peak E velocity times the mitral anulus cross-sec- tional area (calculated as ad2/4 where d = the anulus diameter measured from the two-dimen- sional echocardiogram). Normalized peak filling rate was calculated as peak filling rate divided by left ventricular end-diastolic volume (mea- sured from the two-dimensional echocardio- gram). The half filling fraction was calculated as the integral under the mitral valve Doppler tracing for the first half of diastole divided by the total velocity-time integral under the mitral valve Doppler tracing. No differences were found between Doppler and angiographic esti- mates of peak filling rate (296 vs 283 ml/sec), normalized peak filling rate (1.9 vs 2.0 sec-'), and half filling fraction (0.55 vs 0.55). Signifi- cant correlations were found between Doppler and angiographic values for peak filling rate (r = 0.87, SEE = 91.5 ml/sec) and normalized peak filling rate ( r = 0.83, SEE = 0.52 sec-I). In gen- eral, patients with reduced angiographic peak filling rates had peak E velocity often less than 0.45 m/sec and E / A velocity ratio of less than 1.0.
Additional filling rates have been calculated from the mitral valve Doppler examination by Pearson and colleague^.^^ These investigators calculated (1) peak atrial filling rate as the prod- uct of peak A velocity and mitral anular cross- sectional area (normals = 225 f 72 ml/sec), (2)
Vol. 4, No. 4, 1987 ECHOCARDIOGRAPHY A Review of Cardiovascular Ultrasound 315
SNIDER
mean filling rate as the product of mean dia- stolic velocity and mitral anular cross-sectional area, and (3) the rapid filling index as the quo- tient of peak early diastolic filling rate divided by mean filling rate (normals = 2.3 k 0.3).
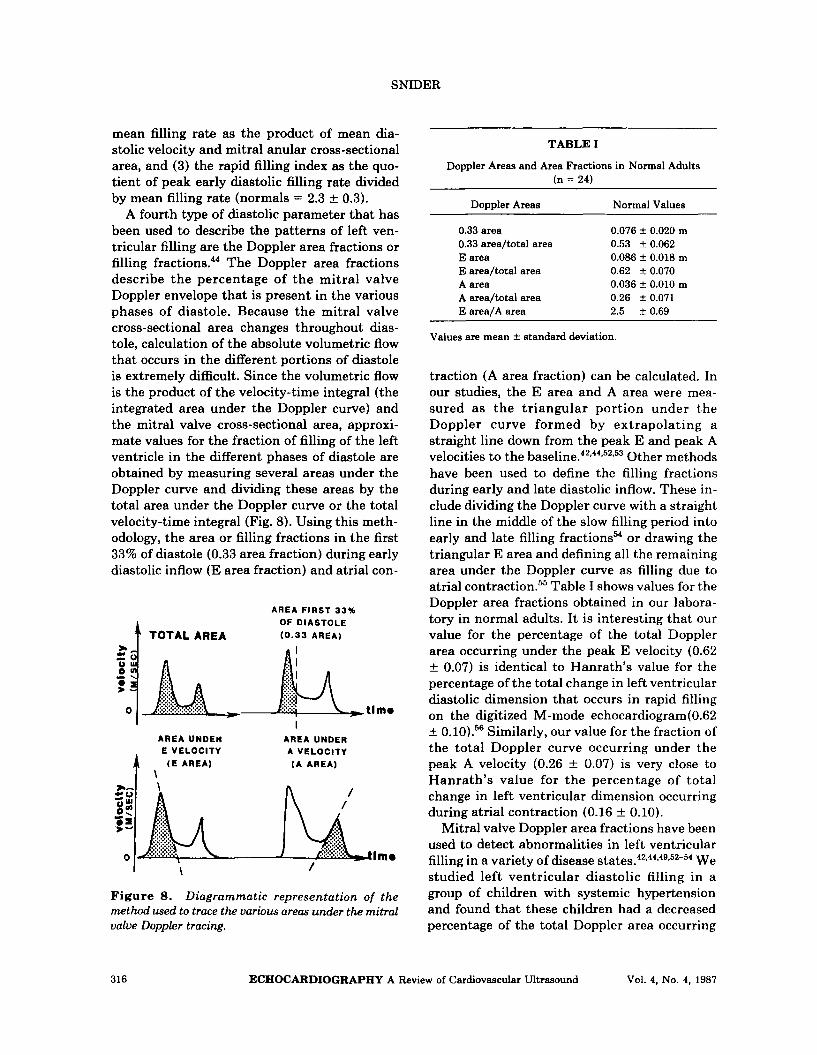
A fourth type of diastolic parameter that has been used to describe the patterns of left ven- tricular filling are the Doppler area fractions or filling fractions.44 The Doppler area fractions describe the percentage of the mitral valve Doppler envelope that is present in the various phases of diastole. Because the mitral valve cross-sectional area changes throughout dias- tole, calculation of the absolute volumetric flow that occurs in the different portions of diastole is extremely difficult. Since the volumetric flow is the product of the velocity-time integral (the integrated area under the Doppler curve) and the mitral valve cross-sectional area, approxi- mate values for the fraction of filling of the left ventricle in the different phases of diastole are obtained by measuring several areas under the Doppler curve and dividing these areas by the total area under the Doppler curve or the total velocity-time integral (Fig. 8). Using this meth- odology, the area or filling fractions in the first 33% of diastole (0.33 area fraction) during early diastolic inflow (E area fraction) and atrial con-
AREA FIRST 33% OF DIASTOLE
TOTAL AREA (0.33 AREA)
AREA UNDER AREA UNDER E VELOCITY A VELOCITY 1 , ( € A R E A ) ( A AREA)
Figure 8. Diagrammatic representation of the method used to trace the various areas under the mitral valve Doppler tracing.
TABLE I
Doppler Areas and Area Fractions in Normal Adults (n = 24)
Doppler Areas Normal Values
0.076 i 0.020 m
0.086 f 0.018 m
0.036 f 0.010 m
0.33 area 0.33 area/total area 0.53 f 0.062 E area E area/total area 0.62 f 0.070 A area A area/total area 0.26 f 0.071 E area/A area 2.5 * 0.69
Values are mean i standard deviation.
traction (A area fraction) can be calculated, In our studies, the E area and A area were mea- sured as the triangular portion under the Doppler curve formed by extrapolating a straight line down from the peak E and peak A velocities to the baseline.42-44s52*53 Other methods have been used to define the filling fractions during early and late diastolic inflow. These in- clude dividing the Doppler curve with a straight line in the middle of the slow filling period into early and late filling fractions54 or drawing the triangular E area and defining all the remaining area under the Doppler curve as filling due to atrial c ~ n t r a c t i o n . ~ ~ Table I shows values for the Doppler area fractions obtained in our labora- tory in normal adults. It is interesting that our value for the percentage of the total Doppler area occurring under the peak E velocity (0.62 k 0.07) is identical to Hanrath’s value for the percentage of the total change in left ventricular diastolic dimension that occurs in rapid filling on the digitized M-mode echocardiogram(0.62 k 0.10).56 Similarly, our value for the fraction of the total Doppler curve occurring under the peak A velocity (0.26 k 0.07) is very close to Hanrath’s value for the percentage of total change in left ventricular dimension occurring during atrial contraction (0.16 k 0.10).
Mitral valve Doppler area fractions have been used to detect abnormalities in left ventricular filling in a variety of disease state^.^^,^^,^^*^^-^^ We studied left ventricular diastolic filling in a group of children with systemic hypertension and found that these children had a decreased percentage of the total Doppler area occurring
316 ECHOCARDIOGRAPHY A Review of Cardiovascular Ultrasound Vol. 4, No. 4, 1987

in the first third of diastole and an increased percentage of the total Doppler area occurring under the A wave compared to age-matched normal children.4 Also, the peak A velocity was higher in the children with systemic hyperten- sion. Diastolic filling abnormalities were detec- table by mitral valve Doppler ultrasound tech- niques when the M-mode indexes of diastolic function were still normal and before the devel- opment of systolic function abnormalities or left ventricular hypertrophy on the M-mode echo- cardiogram.
In addition, we have evaluated left ventricular diastolic filling in a group of children with hy- pertrophic cardiomyopathy and no mitral re- gurgitation using mitral valve Doppler tech- n i q u e ~ . ~ ~ These children had a decreased peak E velocity and a decreased percentage of the total Doppler area occurring in the first third of dias- tole. In these children, there was no compensa- tory increase in the percentage of the total Doppler area occurring during atrial contrac- tion.
The Doppler patterns of left ventricular dia- stolic filling have been evaluated in a group of patients with coronary artery disease and nor- mal global systolic function and compared with a group of age-matched normal adults.42 The coronary artery disease patients had a decreased percentage of the mitral valve Doppler area oc- curring during rapid filling and an increased percentage of the Doppler area occurring in late diastole suggesting that these patients have im- paired left ventricular early diastolic filling. These diastolic filling abnormalities were un- improved 24 hours after successful coronary angioplasty. In children with severe left ventric- ular outflow obstruction, we have observed sim- ilar abnormalities in diastolic filling and similar results immediately after successful relief of the obstruction with balloon valvuloplasty or an- g i ~ p l a s t y . ~ ~
There are several limitations of the mitral valve Doppler technique that should be noted. The Doppler time intervals and peak velocities vary with cardiac cycle lengths. Peak velocities also vary with age and ventricular preload. The peak E and peak A velocity tend to decrease and to increase respectively with aging and the A/E velocity ratio shows a significant increase with
aging." Also, the peak A velocity and the A/E velocity ratio tend to be increased in the fetus in utero and in the first few days after birth." The position of the sample volume can alter the mi- tral valve Doppler tracing. Gardin and col- leaguesm compared Doppler tracings obtained from the left atrium just proximal to the mitral valve with Doppler tracings obtained at the tips of the mitral valve leaflets. These investigators found that the peak E velocity was 25% lower and the peak A velocity was 22% lower in the tracings obtained from the left atrial site. The A/E velocity ratio was the same at both sites. In addition, the mitral valve Doppler indexes vary with the phases of respiration and complexes should be measured at end-expiration to elimi- nate these variations. Finally, early diastolic left ventricular filling is affected not only by left ventricular relaxation properties but also by the left atrial pressure at the onset of left ventricu- lar filling.59 Factors that increase left atrial pressure will alter left ventricular diastolic fill- ing patterns. For example, mitral regurgitation increases left atrial pressure and causes an in- crease in mitral valve flow velocity, left ventric- ular filling rate, and mitral volumetric flow.
Little information currently is available on the use of Doppler echocardiography to assess right ventricular diastolic function. Using the tricuspid valve inflow Doppler, peak velocities during early and late diastolic filling, peak fill- ing rates, and filling fractions of the right ven- tricle can be calculated. In the future, one can expect that these measurements will be used to analyze right ventricular diastolic filling in a variety of disease states.
Summary
Doppler echocardiography has had a pro- found influence on the clinical practice of cardi- ology. With the use of the modified Bernoulli equation, Doppler echocardiography provides a noninvasive technique for calculating intracar- diac pressures. Compared to invasive measure- ments, the Doppler estimates of intracardiac pressures are accurate and reproducible. By the evaluation of intracardiac blood flow, Doppler echocardiography provides a technique for the evaluation of ventricular performance that is in-
DOPPLER EVALUATION OF CARDIAC PRESSURES AND VENTRICULAR FUNCTION
Vol. 4, No. 4, 1987 ECHOCARDIOGRAPHY A Review of Cardiovascular Ultrasound 317

SNIDER
dependent of ventricular geometry. This appli- cation of the Doppler technique is in its infancy and much investigative work is needed to corre- late the invasive and noninvasive measure- ments of ventricular function and to determine the effect of factors such as heart rate, loading conditions, and cardiac drugs on the Doppler indexes of function. In the future, it is very likely that Doppler color flow mapping tech- niques will provide additional information on ventricular emptying and filling patterns that will be important in the noninvasive assessment of cardiac function.
1.
2.
3.
4.
5.
6.
7.
8.
9.
10.
11.
References
Hatle L, Angelsen B: Doppler Ultrasound in Car- diology. Philadelphia, Lea & Febiger, 1985, p. 1. Holen J, Aaslid R, Landmark K, et al: Determi- nation of pressure gradient in mitral stenosis with a non-invasive ultrasound Doppler tech- nique. Acta Med S c a d 199:455, 1976. Hatle L, Brubakk A, Tromsdal A, et al: Nonin- vasive assessment of pressure drop in mitral ste- nosis by Doppler ultrasound. Br Heart J 40:131, 1978. Stamm RB, Martin RP: Quantification of pres- sure gradients across stenotic valves by Doppler ultrasound. J Am Coll Cardiol2:707, 1983. Stevenson JG, Kawabori I: Noninvasive deter- mination of pressure gradients in children: Two methods employing pulsed Doppler echocardiog- raphy. J Am Coll Cardiol3:179, 1984. Hatle L, Angelsen BA, Tromsdal A: Non-inva- sive assessment of aortic stenosis by Doppler ul- trasound. Br Heart J 43:284, 1980. Hatle L: Noninvasive assessment and differen- tiation of left ventricular outflow obstruction by Doppler ultrasound. Circulation 64:381, 1981. Berger M, Berdoff RL, Gallerstein PE, e t al: Evaluation of aortic stenosis by continuous wave Doppler ultrasound. J Am Coll Cardiol 3:150, 1984. Young DB, Quinones MA, Waggoner AD, et al: Diagnosis and quantification of aortic stenosis with pulsed Doppler echocardiography. Am J Cardiol45:987, 1980. Lima CO, Sahn DJ, Valdes-Cruz LM, et al: Pre- diction of the severity of left ventricular outflow tract obstruction by quantitative two-dimen- sional echocardiographic Doppler studies. Cir- culation 68:348, 1983. Yock PG, Naasz C, Schnittger I, et al: Doppler
tricuspid and pulmonic regurgitation in normals: Is it real? (Abstract) Circulation 7O(Suppl 1I):II- 40, 1984. Berger M, Haimowitz A, Van Tosh A, et al: Quantitative assessment of pulmonary hyper- tension in patients with tricuspid regurgitation using continuous wave Doppler ultrasound. J Am Coll Cardiol6:359, 1985. Murphy DJ J r , Ludomirsky A, Huhta JC: Con- tinuous-wave Doppler in children with ventricu- lar septal defect: Noninvasive estimation of in- terventricular pressure gradient. Am J Cardiol 57:428, 1986. Silbert DR, Brunson AC, Schiff R, et al: Deter-
12.
13.
14.
15.
16.
17.
18.
19.
20.
21.
22.
23.
mination of right ventricular pressure in the presence of a ventricular septal defect using con- tinuous wave Doppler ultrasound. J A m Coll Cardiol8:379, 1986. Hatle L, Angelsen B: Doppler Ultrasound in Car- diology. Philadelphia, Lea & Febiger, 1985, p. 162. Masuyama T , Kodama K, Kitabatake A, et al: Continuous-wave Doppler echocardiographic detection of pulmonary regurgitation and its ap- plication to noninvasive estimation of pulmo- nary artery pressure. Circulation 74:484, 1986. Hatle L, Angelsen BAJ, Tromsdal A: Noninva- sive estimation of pulmonary artery systolic pressure with Doppler ultrasound. Br Heart J 45:157, 1981. Kitabatake A, Inoue M, Asao M, et al: Noninva- sive evaluation of pulmonary hypertension by a pulsed Doppler technique. Circulation 68:302, 1983. Kosturakis D, Goldberg SJ , Allen HD, et al: Doppler echocardiographic prediction of pulmo- nary arterial hypertension in congenital heart disease. Am J Cardiol53:1110, 1984. Martin-Duran R, Larman M, Trugeda A, et al: Comparison of Doppler-determined elevated pulmonary arterial pressure with pressure mea- sured a t cardiac catheterization. Am J Cardiol 572359, 1986. Matsuda M, Sekiguchi T, Sugishita Y, et al: Re- liability of non-invasive estimates of pulmonary hypertension by pulsed Doppler echocardiogra- phy. Br Heart J 56:158, 1986. Isobe M, Yazaki Y, Takaku F, et al: Prediction of pulmonary arterial pressure in adults by pulsed Doppler echocardiography. Am J Cardiol57:316, 1986. Serwer GA, Cougle AG, Eckerd JM, et al: Fac- tors affecting use of the Doppler-determined time from flow onset to maximal pulmonary ar-
318 ECHOCARDIOGRAPHY A Review of Cardiovascular Ultrasound Vol. 4, No. 4, 1987
DOPPLER EVALUATION OF CARDIAC PRESSURES AND VENTRICULAR FUNCTION
24.
25.
26.
27.
28.
29.
30.
31.
32.
33.
34.
35.
tery velocity for measurement of pulmonary ar- tery pressure in children. Am J Cardiol 58:352, 1986. Hatle L, Angelsen B: Doppler Ultrasound in Car- diology. Philadephia, Lea & Febiger, 1985, p. 170. Colocousis JS, Huntsman LL, Curreri PW: Es- timation of stroke volume changes by ultrasonic Doppler. Circulation 56:914, 1977. Huntsman LL, Stewart DK, Barnes SR, et al: Noninvasive Doppler determination of cardiac output in man. Clinical validation. Circulation 67:593, 1983. Alverson DC, Eldridge M, Dillon T , et al: Non- invasive pulsed Doppler determination of car- diac output in neonates and children. J Pediutr 101:46, 1982. Nishimura RA, Callahan MJ, Schaff HV, et al: Noninvasive measurement of cardiac output by continuous wave Doppler echocardiography: Ini- tial experience and review of t he literature. Mayo Clin Proc 59:484, 1984. Goldberg SJ, Sahn DJ, Allen HD, et al: Evalua- tion of pulmonary and systemic blood flow by 2-dimensional Doppler echocardiography using fast Fourier transform spectral analysis. Am J Cardiol50:1394, 1982. Sanders SP, Yeager S, Williams RG: Measure- ment of systemic and pulmonary blood flow and QP/QS ratio using Doppler and two-dimen- sional echocardiography. Am J Cardiol 51:952, 1983. Barron JV, Sahn DJ, Valdes-Cruz LM, et al: Clinical utility of two-dimensional Doppler echocardiographic techniques for estimating pulmonary to systemic blood flow ratios in chil- dren with left to right shunting atrial septal de- fect, ventricular septal defect, or patent ductus arteriosus. J Am Coll Cardiol3:169, 1984. Noble MIM, Trenchard D, Guz A: Left ventricu- lar ejection in conscious dogs, 1. Measurement and significance of the maximum acceleration of blood from the left ventricle. Circ Res 19:139, 1966. Stein PD, Sabbah HN: Ventricular performance measured during ejection. Studies in patients of the rate of change of ventricular power. Am Heart J 91:599, 1976. Gardin JM, Iseri LT, Elkayam U, et al: Evalua- tion of dilated cardiomyopathy by pulsed Doppler echocardiography. A m Heart J 106:1057, 1983. Sabbah HN, Khaja F, Brymer JF , et al: Nonin- vasive evaluation of left ventricular performance
36.
37.
38.
39.
40.
41.
42.
43.
44.
45.
46.
based on peak aortic blood acceleration mea- sured with a continuous-wave Doppler velocity meter. Circulation 74:323, 1986. Wallmeyer K, Wann LS, Sagar KB, et al: The influence of preload and heart rate on Doppler echocardiographic indexes of left ventricular performance: Comparison with invasive indexes in a n experimental preparation. Circulation 74:181, 1986. Mehta N, Bennett DE: Impaired left ventricular function in acute myocardial infarction assessed by Doppler measurement of ascending aortic blood velocity and maximum acceleration. Am J Cardiol57:1052, 1986. Mehta N, Bennett D, Mannering D, et al: Use- fulness of noninvasive Doppler measurement of ascending aortic blood velocity and acceleration in detecting impairment of the left ventricular functional response to exercise three weeks after acute myocardial infarction. A m J Cardiol 58:879, 1986. Forrester JS, Diamond GA, Swan HJC: Correla- tive classification of clinical and hemodynamic function after acute myocardial infarction. Am J Cardiol39:137, 1977. Hatle L, Angelsen B: Doppler Ultrasound in Car- diology. Philadelphia, Lea & Febiger, 1985, p. 170. Spirito P , Maron BJ, Bonow RO: Noninvasive assessment of left ventricular diastolic function: Comparative analysis of Doppler echocardio- graphic and radionuclide angiographic tech- niques. J A m Coll Cardiol7:518, 1986. Wind BE, Snider AR, Buda AG, et al: Pulsed Doppler assessment of left ventricular diastolic filling in patients with coronary artery disease before and immediately after coronary angio- plasty. Am J Cardiol59:1041, 1987. Spirito P , Maron BJ, Bellotti P, et al: Noninva- sive assessment of left ventricular diastolic function: Comparative analysis of pulsed Doppler ultrasound and digitized M-mode echo- cardiography. Am J Cardiol58:837, 1986. Snider AR, Gidding SS, Rocchini AP, e t al: Doppler evaluation of left ventricular diastolic filling in children with systemic hypertension. Am J Cardiol56:921, 1985. Fujii J , Yazaki Y, Sawada H, et al: Noninvasive assessment of left and right ventricular filling in myocardial infarction with a two-dimensional Doppler echocardiographic method. J A m Coll Cardiol5:1155, 1985. Kitabatake A, Inoue M, Asao M, et al: Transmit- ral blood flow reflecting diastolic behavior of the
Vol. 4, No. 4, 1987 ECHOCARDIOGRAPHY A Review of Cardiovascular Ultrasound 319
SNIDER
47.
48.
49.
50.
51.
52.
left ventricle in health and disease: A study by pulsed Doppler technique. J p n Circ J 46:92, 1982. Miyatake K, Okamoto M, Kinoshita N, et al: Augmentation of atrial contribution to left ven- tricular inflow with aging as assessed by intra- cardiac Doppler flowmetry. A m J Cardiol53:586, 1984. Takenaka K, Dabestani A, Gardin J , et al: Left ventricular filling in hypertrophic cardiomyopa- thy: A pulsed Doppler echocardiographic study. J Am Coll Cardwl7:1263,1986. Pearson AC, Schiff M, Mrosek D, e t al: Left ventricular diastolic function in weight lifters. Am J Cardiol 58:1254, 1986. Takenaka AK, Dabestani A, Gardin JM, et al: Pulsed Doppler echocardiographic study of left ventricular filling in dilated cardiomyopathy. Am J Cardwl58:143, 1986. Rokey R, Kuo LC, Zoghbi WA, et al: Determina- tion of parameters of left ventricular diastolic filling with pulsed Doppler echocardiography: Comparison with cineangiography. Circulation 71:543, 1985. Gidding SS, Snider AR, Rocchini AP, e t al: Left ventricular diastolic filling in children with hy- pertrophic cardiomyopathy: Assessment with pulsed Doppler echocardiography. J Am Coll Cardiol8:310, 1986.
53.
54.
55. 56.
57.
58.
59.
Shaffer EM, Snider AR, Rocchini AP, et al: Dia- stolic filling in LV outflow obstruction pre and post balloon angioplasty. (Abstract) J Am Coll Cardwl 9(Suppl A):130A, 1987. Friedman BJ, Drinkovic N, Miles H, et al: As- sessment of left ventricular diastolic function: Comparison of Doppler echocardiography with gated blood pool scintigraphy. J Am Coll Cardiol 8:1348, 1986. Plehn JF: Personal communication, April 1987. Hanrath P, Mathey DG, Siegart R, e t al: Left ventricular relaxation and filling pattern in dif- ferent forms of left ventricular hypertrophy: An echocardiographic study. Am J Cardiol 45:15, 1980. Reed KL, Sahn DJ, Scagnelli S, et al: Doppler echocardiographic studies of diastolic function in the human fetal heart: Changes during gesta- tion. J Am Coll Cardiol8391, 1986. Gardin JM, Dabestani A, Takenaka K, et al: Ef- fect of imaging view and sample volume location on evaluation of mitral flow velocity by pulsed Doppler echocardiography. A m J Cardiol 57:1335, 1986. Ishida Y, Meisner JS, Tsujioka K, et al: Left ventricular filling dynamics: influence of left ventricular relaxation and left atrial pressure. Circulation 74:187, 1986.
320 ECHOCARDIOGRAPHY A Review of Cardiovascular Ultrasound Vol. 4, No. 4, 1987