prediction of motor failure time using an artificial
TRANSCRIPT

sensors
Article
Prediction of Motor Failure Time Using An ArtificialNeural Network
Gustavo Scalabrini Sampaio 1 Arnaldo Rabello de Aguiar Vallim Filho 2 Leilton Santos da Silva 3 and Leandro Augusto da Silva 1
1 Postgraduate Program in Electrical Engineering and Computing Mackenzie Presbyterian UniversityRua da Consolaccedilatildeo 896 Preacutedio 30mdashConsolaccedilatildeo Satildeo Paulo 01302-907 Brazilleandroaugustosilvamackenziebr
2 Computer Science Dept Mackenzie Presbyterian University Rua da Consolaccedilatildeo 896Preacutedio 31mdashConsolaccedilatildeo Satildeo Paulo 01302-907 Brazil arnaldoaguiarmackenziebr
3 EMAEmdashMetropolitan Company of Water amp Energy Avenida Nossa Senhora do Sabaraacute 5312mdashVila EmirSatildeo Paulo 04447-902 Brazil leiltonemaecombr
Correspondence gustavosampaiomackenzistacombr
Received 31 August 2019 Accepted 3 October 2019 Published 8 October 2019
Abstract Industry is constantly seeking ways to avoid corrective maintenance so as to reduce costsPerforming regular scheduled maintenance can help to mitigate this problem but not necessarilyin the most efficient way In the context of condition-based maintenance the main contributions ofthis work were to propose a methodology to treat and transform the collected data from a vibrationsystem that simulated a motor and to build a dataset to train and test an Artificial Neural Networkcapable of predicting the future condition of the equipment pointing out when a failure can happenTo achieve this goal a device model was built to simulate typical motor vibrations consisting of acomputer cooler fan and several magnets Measurements were made using an accelerometer andthe data were collected and processed to produce a structured dataset The neural network trainingwith this dataset converged quickly and stably while the tests performed k-fold cross-validation andmodel generalization presented excellent performance The same tests were performed with othermachine learning techniques to demonstrate the effectiveness of neural networks mainly in theirgeneralizability The results of the work confirm that it is possible to use neural networks to performpredictive tasks in relation to the conditions of industrial equipment This is an important area ofstudy that helps to support the growth of smart industries
Keywords predictive maintenance condition-based maintenance artificial neural network vibratoryanalysis smart industry industry maintenance
1 Introduction
The control monitoring and maintenance of production line equipment are fundamental activitiesfor the quality and performance of the productive process [1ndash4] Sensors and actuators play animportant role in the operation of various machines such as conveyor belts generators mixerscompressors furnaces welding machines among others so they must always be in proper workingcondition To guarantee this these machines are constantly monitored and two types of maintenance oftheir components corrective and the scheduled are performed Corrective maintenance is performedin the case of a critical failure in the equipment and causes an unplanned downtime of the productionline Scheduled maintenance is performed periodically and equipment is checked and replacedif necessary in order to avoid unplanned downtime [25ndash7] Although scheduled maintenance isless disruptive both types have associated costs due to loss of production To avoid these two
Sensors 2019 19 4342 doi103390s19194342 wwwmdpicomjournalsensors
Sensors 2019 19 4342 2 of 17
types of maintenance industry has begun to perform condition-based maintenance where predictiveequipment status is used to plan a maintenance Employing this method has become part of the smartindustrial maintenance and results in fewer downtimes than scheduled maintenance as it avoidsunnecessary maintenance and reduces corrective maintenance by anticipating possible equipmentfailures [247ndash11] Machine learning techniques such as Artificial Neural Network (ANN) RegressionTree (RT) Random Forest (RF) and Support Vector Machine (SVM) are being used to perform regressionand prediction tasks in various applications [1012ndash21] These techniques have enabled predictivecondition systems or remaining useful lifetime systems to be developed that allow different types ofproduction variables to be used [1022ndash24]
The objectives of this work were (1) to propose a methodology to generate a training datasetbased on vibration measurements This methodology includes the characterization of the dataset anddefinition of a way of calculating the failure time in vibrating systems by means of the amplitudeand frequency data (2) to train an ANN to be able to predict the failure time of an equipmentThis prediction allows anticipating maintenance only before a failure on motor occurs reducing theproduction line downtimes and the costs involved A computer cooling fan with an accelerometercoupled to it to measure its vibrations was used to simulate the evolution of motor vibration and collectthe data to train and test the ANN The training dataset was generated considering the frequencyspectrum of the vibrations containing amplitude and frequency of a time interval Each pair ofamplitude and frequency measurements was associated with a failure time The efficiency of the modeltraining was demonstrated by comparative tests with RT RF and SVM machine learning techniquesThe tests performed were the k-fold cross-validation standard test and model generalization testboth of them using the Root Mean Square Error (RMSE) performance index [1415]
This work is organized as follows Section 2 presents the related works Section 3 presents themethods applied in the development of the proposed system Section 4 presents the predictive testsperformed and the results of the performance index and Section 5 presents the conclusions andproposals for future studies
2 Related Works
In the context of asset management in industry condition-based maintenance plays an importantrole in seeking to reduce unnecessary maintenance reduce downtime and reduce costs involved inthese two aspects In general this maintenance strategy includes fault diagnosis fault prognosis andmaintenance process optimization [8911]
Fault Diagnosis Systems (FDSs) play the role of fault diagnosis aiming to detect and identifyfaults characterized when a behavior or system parameter is out of acceptable conditions [25ndash27]This type of system was studied in both small and local applications [25] as well as largersystems [2627] FDSs can be classified into two main groups those using model-based techniques andthose using model-free techniques The first group uses mathematical models of the monitored systemwhich describe the behavior of the real process This model is used to compare the behavior of the realsystem with that described by the model The second group uses machine learning techniques to learnthe different states of the monitored system to identify and classify faults [26ndash28] Ntalampiras [26]presents an FDS in electrical Smart Grids (SG) where a model-free method was used to detect andisolate faults in SG using data from the physical layer of the monitored system
In contrast to FDSs which aim to detect and classify faults fault prediction systems complywith failure prognosis aspect which aims to predict the future behavior of equipment and determinetheir possible moments of failure assisting in decision making on maintenance issues YildirimSun and Gebraeel [89] presented a framework for generating efficient maintenance planning basedon predictive analytics using Bayesian prognostic techniques This predictive analysis dynamicallyestimates the remaining life distribution of electric generators allowing estimating the maintenancecost and the best time for maintenance to occur Verbert Schutter and Babuška [11] also presentedthe optimization of maintenance through efficient failure prediction the work propose a multivariate
Sensors 2019 19 4342 3 of 17
multiple-model approach based on Wiener processes for modeling and predicting of equipmentdegradation behavior The work clearly traces the dependencies between the processes of faultdiagnosis fault prognosis and maintenance optimization In the fault prognosis context ANNs areimportant tools because they enable the implementation of the prediction task easily and accurately
21 Data Predicting with ANN
ANNs are structures inspired by biological neurons and formed by simple units of processingcalled neuron The neurons are connected to each other and for each connection a synaptic weight isgiven The training phase of the ANN adjusts the synaptic weights of these connections modeling therelation of inputs and outputs of the system ANNs have the ability to model nonlinear and complexproblems and are easy to implement as numerous libraries for various programming languages areavailable The high generalizability of this technique is also a highlight as data outside the training setis admissible in the system [152429]
One of the tasks that can be performed by a ANN is prediction This task was used to assist inthe control and monitoring of numerous variables in several areas In medicine ANNs were used topredict mortality risk and incidence of disease [29ndash31] Hao et al [31] used ANNs to predict chronicdisease risk in patients The system developed used as input structured and unstructured data aboutthe patientrsquos health conditions In the field of wind power they were used to predict wind speed andthe amount of power that can be generated [2432ndash34] A study by Li Ren and Lee [34] presents theused ANNs to predict wind speed with the objective of reducing the effect of the instability of thisvariable and increasing the efficiency of the generation of electrical energy The system uses windvelocity as input transforming this data into average wind speed and wind speed turbulence intensityIn the area of railway engineering studies have predicted failure point in rail turnouts and the rates ofwear of wheels and rails [3536] Shebani and Iwnicki [36] presented a system for predicting wear intrain wheels and train tracks The system was developed with the aim of reducing maintenance costsimproving passenger comfort and even avoiding accidents To carry out this prediction the authorsused an ANN having as inputs several variables such as the characteristics of the wheels and railstrain speed yaw angle etc Other areas have also been targets of prediction studies using ANNs suchas turbine operation [10] education [37] entertainment [38] and production [39]
22 ANN in Engines Failure Prediction Systems
ANNs were employed in studies of engines to analyse vibrations and predict equipmentfailure [2472240ndash42] A study by Plante Nejadpak and Yang [7] showed that by observing thevibration of motors it was possible to identify those considered normal in the operation of themachinery and those related to failure From this analysis along with the data concepts associatedwith vibration it was possible to detect and predict faults and allows predictive maintenance to beplanned and helps to establish the remaining life of the equipment For each type of failure the authorspresented a frequency spectrum of the collected vibrations allowing the analysis of the vibrationbehavior to identify possible types of failure The use of the frequency spectrum to perform theanalyses was also employed in the present work since with this spectrum it is possible to havestrong reliable signal data Gongora et al [2] presented the failure classification of induction motorbearings based on ANNs using the motor stator current as data input The work describes motormaintenance the costs involved and the types of failures It highlights the main types of engine failureand concludes that engine failure prediction can be performed by non-invasive methods such asvibration measurement Guumlnnemann and Pfeffer [42] presented the classification of defects of a motorthrough the measurement of vibration in its operation This classification was performed with anANN having as input data the frequency spectrum of the collected signal the output being a binaryrepresenting a defective or non-defective motor
Sensors 2019 19 4342 4 of 17
The ANN proposed in the present study was developed from the information gathered in thearticles mentioned above The methodology which involves data collection and treatment ANNtraining and performance measures is described in the next section
3 Proposed Method
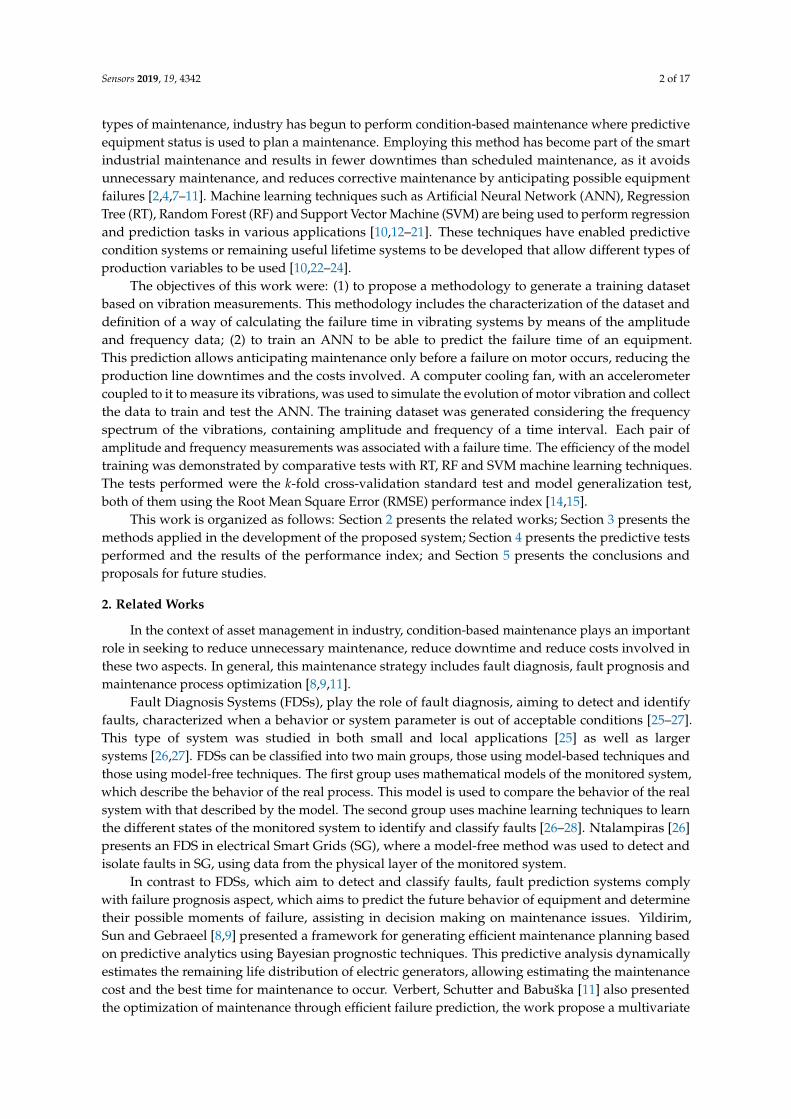
In real systems the collection and processing of data used for machine learning training shouldbe performed historically in relation to the point of interest like an equipment failure Knowingwhen a particular equipment failed a preliminary dataset would be extracted containing sensorsdata information This dataset should then be refined and enriched with signal growth informationand the time remaining for the failure to occur This work presents a methodology to generate atraining dataset similar to the dataset of a possible real system with the difference that the vibrationsignal growth rate and the estimated failure time were artificially generated for a better control of thescenarios and testing of the ANN This methodology has as much importance as the results achievedallowing vibration behaviors to be simulated and the data collected used to produce the training andtest datasets for machine learning Figure 1 shows the overview of the proposed method The processbegins with data collection derived from the measurements made by the accelerometer coupledto a cooler fan This data was then processed to generate training dataset Among the proceduresperformed with this data are the Fourrier transform of the vibration signal the definition of signalgrowth rates and the calculation of motor failure time After the data were processed the ANN wastrained to predict the motor failure time and validated by means of a performance index
Figure 1 Data collection and pre-processing flow chart
31 Data Collection and Data Processing
The device model used in this work to collect data was comprised of a computer cooling fan withsmall magnets fixed to its blades Adding a second magnet to certain blades created a weight differencebetween those with only one magnet and those with two magnets This weight difference generatedvibrations during the rotation of the fanrsquos motor allowing the vibration to be controlled in order togenerate different vibration scenarios A microcontroller the Arduino UNO was responsible for settingthe motor speeds and performing the readings of the vibration values from the accelerometer [43]
An Akasa AK-FN059 12cm Viper cooling fan was used in the construction of the device modeland an MMA8452Q accelerometer was used to measure vibration attached to the cooling fan [4445]This accelerometer has 12 bits of resolution and communicates with the microcontroller throughthe I2C (Inter-Integrated Circuit) protocol It was developed a software using Processing programlanguage to collect the data from the serial port and store it in a text file [4647] Figure 2 shows thedevice model developed to simulate motor vibrations
Figure 2 Device model developed to simulate vibrations in motors
Sensors 2019 19 4342 5 of 17
In order for the training dataset to cover different levels of vibration three weight distributionconfigurations were done in the cooler blades Figure 3 presents these configurations where the colorpairs represent the position where the weights were doubled to generate different vibration behaviorsFor each of these configurations 17 rotation speeds were set up ranging from 20 to 100 of thecooler maximum speed at 5 intervals The vibration measurements of each of these speeds wascollected by the accelerometer at a frequency of 20 ms for 1 min generating 3000 records per speedThus in total 153000 vibration records were collected from the simulation model
Figure 3 Weights distribution configurations between the coolerrsquos blades performed to collectdifferent vibration behaviors
The vibration data was pre-processed to standardize the inputs and outputs used in the trainingdataset When analyzing the behavior of the collected signals it was observed that the vibrationshad no harmonic behavior ie the signal did not show constant amplitude and frequency For thesame window of measurement of the same rotation speed different and non-standard data werecollected Therefore it was necessary to define a single frequency and amplitude value for each of theaxes in a measurement window Once 1 min of data was collected for each motor speed of the coolerrepresented by 3000 observations a set of 50 observations of the dataset were defined as the measuringwindow which represent 1 s of signal Figure 4 shows an example of the difference in measurementstaken at the same speed rotation of the fan at two different measuring windows
Figure 4 Vibration signals from two different and sequential measuring windows
The Fourier series and Fourier transform were used to describe the signals in the frequencydomain mapping the various frequencies and amplitudes of the signal From this transformation it was
Sensors 2019 19 4342 6 of 17
possible to define a single amplitude and frequency value per axis for each measurement window [48]For this purpose the calculation of the Fourier transform using the Fast Fourier Transform function wasimplemented in R with the aid of the rsquospectralrsquo library generating all pairs of amplitude and frequencyof a measurement window To generate a unique value for each window the Root Mean Square (RMS)value of the signal or effective value for the amplitude and frequency sets was calculated by thefollowing equation [49ndash51]
xrms =
radic1nmiddot
n
sumi=1
x2i (1)
where xrms represents the effective value of the amplitude or frequency xi represents each amplitudeor frequency that compose the signal and n the total number of amplitudes or frequencys that composethe signal
A new dataset containing 3060 records of pairs of amplitude and frequency data for each vibrationaxis was generated Figure 5 presents an example of the transformation performed on the vibrationmeasurements graphically
Figure 5 Process of simplification of measured vibration signal (a) Vibration signal collected froma measuring window (b) Application of the Fourrier Transform in the collected signal generatingall pairs of amplitude and frequency present in the signal (c) Calculation of the RMS value of theamplitudes and frequencies generating only one pair for each measurement window
With the unique values calculated for each measurement window it was possible to establish thethreshold values of amplitude and frequency needed to calculate the estimated failure time The limitvalues ie the maximum possible amplitude or frequency values before equipment failure weredefined by means of the analysis of the measurements made with the cooler rotating at the maximumspeed Thus the highest values of each amplitude and frequency pair were found for each axisThe maximum amplitudes on the accelerometer measurement scale ([minus8g 8g]) were 025 for the x axisand 07 for the y and z axes with a frequency of 18 Hz for all the 3 axes The data were analyzed toremove attributes that would not be representative The first attributes removed were the amplitudeand frequency of the x axis since the way the accelerometer was installed did not generate vibrationson that axis because it is the axis of height The frequency attributes of the y and z axes were thenremoved Although they generated values the interval between the measured frequencies and thethreshold was small and almost unchanged Thus only the amplitudes of the y and z axes were usedfor the training dataset Figure 6 graphically presents the process of generating the amplitudes used in
Sensors 2019 19 4342 7 of 17
training dataset where an amplitude value of the training dataset corresponds to the RMS value of acollected signal measurement window In this figure the amplitudes of y axis was represented
Figure 6 Schematic of vibration signal transformation to generate amplitude dataset (AY)
To calculate the estimated failure time three steps were performed in the dataset The first was toestablish vibration signal growth rates for the observations doubling the dataset for the amount ofdesired growth rates Three growth rates gr of the signal were set 001 002 and 005 In a real-timesystem this rate would be found by averaging the amplitude and frequency difference of two windowsof sequential measurements indicating how the vibration signal is growing The second step was tocalculate the time in windows of measurement so that each amplitude reached the threshold valueaccording to the growth rate established for each amplitude of the axes This calculation is given by
FTx =xlim minus x
x middot gr(2)
where FTx represents the failure time considering one variable x (amplitude) xlim represents thethreshold value of x and gr represents the growth rate of the signal Finally the third step was tocalculate the average between the failure times generating the expected equipment failure time Thusgiven the input x = x1 x2 xn and the signal growth rate gr the expected output representing theestimated failure time FTe is given by
FTe =sumn
i=1xilimminusxi
xi middotgr
n(3)
This was a simple and efficient way to characterize the vibration dataset and can be performed atany time interval for the measurement windows In the case of this work the measurement windowused was 1 s however it could have a duration of 1 min 1 h or 1 day with the result of calculating theequipment failure time given in the same units as the measuring window The equation presentedconsiders a linear growth rate however exponential or logarithmic growth behaviors could be useddepending on the desired or expected growth type In a real dataset this growth behavior would bediscovered by the ANN
Sensors 2019 19 4342 8 of 17
32 Performance Index
All validations of the trainings performed in this work used the RMSE performance indexThis performance index indicates the standard deviation of the difference between the estimated valuesand the values predicted [15] The RMSE value was calculated with the following equation [1415]
RMSE =
radic1nmiddot
n
sumi=1
(xprimei minus xi
)2 (4)
where n represents the number of observations compared xprimei the value of the i-th element of thepredicted results vector and xi the value of the i-th element of the test dataset estimated values vector
33 ANN Training
At the end of dataset pre-processing a new dataset was generated with 9180 observations andfour attributes amplitude of the y axis amplitude of the z axis signal growth rate and estimatedfailure time The first three attributes were used as input values for the training of the ANN since theattribute estimated failure time was used as the output of the network
The ANN class used to predict the failure time was the Multilayer Perceptron Neural Network(MLP) This ANN consists of an input layer one or more hidden layers and an output layer The inputsignal propagates forward from layer to layer until it reaches the network output The network traininghappens in a supervised way and although there are others the algorithm of backpropagation oferror is the most common learning algorithm for this type of ANN This architecture is flexible toparameterize inputs and outputs in the case of this work the network allows configuring differentsensorsrsquo input signals ANN neurons can be parameterized with nonlinear activation functionsensuring their use to continuous outputs This feature allows to model complex systems that deal withnonlinear datasets such as the relationship between vibration and equipment failure time addressedin this work This class of ANN in conjunction with the backpropagation learning algorithm is simpleto implement efficient for large-scale problems great generalizability and as can be seen in Section 4(Figure 7) depending on the dataset structure used for training converges quickly and accuratelywith the error tending asymptotically to 0 The backpropagantion learning algorithm can be usedwith an online update of synaptic weights these updates occur with each new set of inputs in ANNtraining so the model is refined by the training dataset observation number multiplied by numberof iteractions (epochs) giving greater precision in the model MLP neural network training withthe backpropagation algorithm is also computationally efficient because computation is linear for allANN synaptic weights making the algorithm linear with respect to the number of w synaptic weights(O(w)) The literature shows that it is a consolidated model for use in time series prediction problemsconsidered in some cases as a benchmarking model [152429]
The training of the ANN were performed in R with the help of the lsquoRSNNSrsquo library [5152]The training parameters were found empirically by trial and error for each set of parametersthe RMSE value was calculated and compared the parameters that presented the smaller RMSEwere learning rate (specifies the gradient descent step width)mdashη = 085 number of epochs(iterations)mdashMaxit = 50000 number of hidden layersmdashnHidden = 1 number of neurons in thehidden layermdashsizeHidden1 = 25 The ANN was trained with the backpropagation learning algorithm(learnFunc) the logistic function was used as the activation function of the hidden layer and the linearfunction was used as the activation function of the output layer (hiddenActFunc) The connectionsweight initialization between the neurons was performed in a random manner
34 Comparing with Other Machine Learning Techniques
To establish the performance level of the model generated with ANN training other classicalmachine learning techniques to perform the regression estimation and prediction tasks were chosenfor comparison Regression Tree Random Forest and Support Vector Machine techniques as well as
Sensors 2019 19 4342 9 of 17
ANNs are widely used for classification and prediction problems in many application areas [1014ndash21]For this reason they were selected to perform the same prediction task to which ANN was exposed
Regression Tree is the name given to a Decision Tree used to perform the regression taskThis structure consists of binary branches where each node represents a decision regarding a simplecomparison These decision frameworks consider all training dataset inputs modeling the relationshipof these inputs to the expected output The biggest advantage of this technique is the simplicityof tree construction requiring little processing Another advantage is the ease interpreting of thegenerated model The generalizability of this technique can be reduced as the tree structure stronglydepends on the training dataset so values outside of those considered during model training can leadto a large prediction error [10121649] RT training was conducted in R with the help of the lsquorpartrsquolibrary [5152] The choice of parameters for model training was performed in the same way as theANN empirically by trial and error The parameters with the lowest RMSE value were minimumobservations on one node for a split attemptmdashminSplit = 10 minimum number of observations ineach tree leaf (node)mdashminBucket = round(minSplit3) complexity parameter removes worthlessdivisionsmdashcp = 00000001 maximum tree depthmdashmaxDepth = 30
Random Forest corresponds to a set of tree predictors each of these trees is dependent on thevalues of an independently taken random input vector with the same distribution for all trees inthe forest This structure combines several simple predictors reducing complexity and improvingperformance when compared to individual tree models For regression problems RT is used assubmodels of the RF structure This technique is robust in the presence of outliers and noises in thetraining dataset and very stable to overfitting Just as RT RF may not perform well if the input datafrom the trained model is very different from the data presented during the training phase [10131819]RF training was performed in R with the help of the rsquorandomForestrsquo library [5152] The choice ofparameters happened empirically by trial and error The parameters with the lowest RMSE value werenumber of growing treesmdashnTree = 500 number of variables sampled in each divisionmdashmTry = 3minimum size of terminal nodesmdashnodeSize = 5 number of times data is exchanged per tree to verifythe variable importancemdashnPerm = 1
Support Vector Machine is a popular machine learning technique used for classification regressionprediction and other problems Nonlinear regression-driven SVMs enabled by the intensive-lossfunction [53] perform during the training phase basically the mapping of input vector elementsto high dimensional feature space using a nonlinear mapping process This technique like ANNsis highly flexible from a training dataset entry point of view and tends to have a better generalizationthan tree-based techniques [10151721234953ndash55] SVM training was conducted in R with the helpof the rsquosvmrsquo function of library lsquoe1071rsquo [5152] The choice of parameters also happened empiricallyby trial and error The parameters with the lowest RMSE value were kernel used in training andpredictionmdashkernel = radial basis cost of constraints violationmdashcost = 10 parameter γ used in kernelcalculation formulamdashγ = 10 tolerance of termination criterionmdashtolerance = 0001 parameter ε valueof the insensitive-loss functionmdashε = 00005
The parameters presented were the ones that were varied to find the best RMSE performanceindex There are other parameters for the training of each of these machine learning techniqueshowever these other parameters were configured with the default values of the R libraries usedTo consolidate and allow a better visualization of the used parameters Table 1 presents the parametersby technique Comparative tests between these techniques are presented in the next section
Sensors 2019 19 4342 10 of 17
Table 1 Machine learning techniques parameters
ANN RF
nHidden = 1 nTree = 500sizeHidden1 = 25 mTry = 3η = 085 nodeSize = 5Maxit(epochs) = 50000 nPerm = 1learnFunc = BackpropagationhiddenActFunc = Logistic
RT SVM
minSplit = 10 kernel = radial basisminBucket = round(minSplit3) cost = 10cp = 00000001 γ = 10maxDepth = 30 tolerance = 00001
ε = 00005
4 Prediction Results
The models using the machine learning techniques described in the previous section were trainedand tested During ANN model training the learning algorithm tends to reduce the output errorinteractively Figure 7 shows the evolution of the weighted sum of squared error for the k = 1 folderIt can be seen from this figure that the error value tends asymptotically to 0 quickly and the errorno longer varies after few training epochs The other folders presented similar behavior in respectof error evolution during the training The training phase involved k-fold cross-validation to verifyin a standardize way the performance of the trained model The k-fold cross-validation enables thesimulation of k data scenarios where the test dataset is not use to train the model After each foldertraining the prediction model was tested with the test dataset and the values predicted and estimatedare compared with the performance index [15] By means of the RMSE calculation using the estimatedand predicted values it was possible to measure if the generated model had precision and reflectedthe reality of the system being studied In this work the k value was set as 5 Also the RMSE valuescan be used to compare the models performance Figure 8 presents the graphs which demonstratethis comparison for the models generated in the k = 1 folder where the x axis represents the set ofamplitudes of the signal and the signal growth rate (AY-AZ-GR) and y axis represents the failure timein seconds For small amplitudes and small vibration signal growth rate the time until the equipmentfails is longer as the vibrations increase and vibration increases the time until the equipment fails isshorter The dataset used was generated considering a window of measurement of 1 s which generateda failure time also in seconds but this window could consider a measurement of 1 day which wouldgenerate a failure time in days meaning that the measuring window is flexible Table 2 shows theRMSE values for each model validation folder and the average of this index
Sensors 2019 19 4342 11 of 17
Figure 7 Iterative error evolution of the ANN training process (k = 1)
Figure 8 Results of the tests of the first folder (k = 1) carried out with the machine learning techniques
Table 2 RMSE values of the folders used in the test of the machine learning techniques
Folder ANN RT RF SVM
1 00039 00047 00025 001062 00035 00054 00035 001293 00028 00051 00022 001054 00041 00052 00024 001205 00049 00052 00026 00123
Average 00038 00051 00026 00117
All models converged during training and were able to deliver good performance resultsThe average RMSE for the ANN model was 00038 being ahead of the models trained with theRT and SVM techniques the best result of k-fold cross-validation was presented by the RF techniquewith an average RMSE value of 00026 Performance measurements of models acquired through the
Sensors 2019 19 4342 12 of 17
test dataset even with k-fold cross-validation may present better values than a possible generalizationin a real system This scenario can happen if the dataset has values in its observations close to or evenequal In the dataset used in models training and testing the amplitude and vibration growth ratevalues were doubled to simulate different scenarios of vibratory behavior generating optimal testssince the test dataset can contain the same values for vibration amplitude in y and z as the trainingdataset Thus two new datasets were generated with different amplitude values and vibration signalgrowth rates in relation to the original training dataset in order to attest to the generalizability ofthe trained model Both datasets for generalization served as input to the models and the RMSEvalues of these new tests were calculated Generalization dataset (a) was generated with the samevibration amplitude values as the modelsrsquo original training dataset but with different growth ratevalues of 0015 003 and 004 totaling 9180 observations Generalization dataset (b) was producedwith the average amplitude values for each cooler motor rotation speed in the three weight settings ofits blades doubled by the vibration signal growth rates of 0015 003 and 004 totaling 153 observationsComparative graphs between the estimated and predicted values of these two generalization datasetscan be seen in Figures 9 and 10 as well as numerically in Table 3 The values generated for thesedatasets did not exceed the maximum and minimum values of the models training dataset in ordernot to impair the performance of tree-based techniques It is possible to observe in these figures and byanalyzing Table 3 that the prediction followed the same behavior as the one presented in the k-foldcross-validation in a more accentuated way Short term predictions were accurate for ANN RT and RFtechniques however for medium and long term predictions ANN outperformed the other techniquesIn general ANN had the best RMSE indexes for the generalization tests with 00313 for generalization(a) and 0118 for the generalization (b) The values presented are low proving the good generalizabilityof the model The RT and RF models had a good generalization for short term predictions and evenwith low RMSE indexes SVM did not perform very well
The results presented in tests with ANN prove that the objective of the work was achievedand that a real-time system could be implemented to predict the failure time associated with vibrationin motors using this machine learning technique This system should have as input the same parametersused in the ANN training vibration amplitude on the y axis amplitude of vibration on the z axis andvibration signal growth rate calculated with the current vibration values and the values of the lastmeasurement The system would output the estimated failure time with good accuracy
Figure 9 Generalization Test (a)
Sensors 2019 19 4342 13 of 17
Figure 10 Generalization Test (b)
Table 3 RMSE values of the generalization test of the machine learning techniques
Gen ANN RT RF SVM
a 00313 00922 00920 00696b 01184 01417 01430 01237
5 Conclusions
Increasingly businesses seek more efficient ways to perform activities that directly impact theirperformance In the case of the advent of smart industry accurately predicting when any equipment orprocess may fail helps decision making regarding maintenance that needs to be performed minimizingcosts and reducing workload
The objectives of this work and its main contributions were to propose a methodology to treat thecollected vibration data from a device model developed to simulate an actual system by measuring thevibrations of a computer cooler fan with an accelerometer and to build a dataset to train a ANN capableof predicting when a failure can happen The construction of this dataset involved the estimation ofequipment failure time achieved by a formula that considers the linear growth of the signal The ANNclass chosen to perform the prediction task was MLP which is an easy to implement ANN with a goodgeneralization index The ANN model was compared in terms of RMSE performance index valueswith other machine learning techniques Regression Tree Random Forest and Support Vector MachineThe results of the training and comparative tests were satisfactory showed that the ANN model wassuperior to the other techniques Generalization in short term predictions were equivalent betweenANN RT and RF techniques however with the ANN model medium and long term predictionswere better The success of the training and testing of the MLP neural network described in this workto predict motor failure shows that this technique could be applied in industrial condition-basedmaintenance Despite the good performance of the ANN for the dataset built in this paper MLP neuralnetworks with backpropagation learning algorithm may have some weaknesses The literature [15]points out a tendency of these techniques to converge slowly besides allowing the occurrence ofoverfitting where after a certain time of training the error curve until close to 0 moves away from0 Thus some of these points can be explored in future work Different classes of ANNs could beimplemented and compared in order to observe which is the best model for the problem discussed in
Sensors 2019 19 4342 14 of 17
this paper From an asset management point of view it would be interesting to evaluate the possibilityof jointly implementing fault diagnosis systems and fault prediction systems with ANNs with the aimof building a unified system for maintenance planning in the industry The proposed methodologycould also be target of future works considering real systems measurements and other variables suchas temperature and pressure of the equipment since the behavior of these variables are different andwould influence the construction of fault prediction systems differently The training dataset could beconstructed based on real measurements or simulated with nonlinear estimates such as logarithmicor exponential
It is important to highlight that research and development of techniques that helps decisionmaking in the industry are essential for greater production efficiency and cost reductionThe development of low cost and easy implementation solutions are attractive to industry which canmaterialize academic knowledge and development
Author Contributions Conceptualization GSS ARdAVF LSdS and LAdS Data curation GSS Formalanalysis GSS Funding acquisition ARdAVF LSdS and LAdS Investigation GSS and LAdSMethodology GSS Project administration ARdAVF LSdS and LAdS Resources GSS Software GSSSupervision LAdS Validation GSS ARdAVF LSdS and LAdS Visualization GSS Writingmdashoriginaldraft GSS Writingmdashreview amp editing ARdAVF LSdS and LAdS
Funding This research is a part of the RampD project ldquoEMAEndashANEEL- PampD 00393-00082017rdquo funded by EMAEmdashMetropolitan Company of Water amp Energy of the state of Satildeo Paulo Brazil
Acknowledgments We thank all the EMAE staff who participated in the RampD project ldquoEMAEndashANEEL-PampD00393-00082017rdquo and all the faculty and students members of the BigMAAp research lab at MackenziePresbyterian University
Conflicts of Interest The authors declare no conflict of interest The funders had no role in the design of thestudy in the collection analyses or interpretation of data in the writing of the manuscript or in the decision topublish the results
Abbreviations
The following abbreviations are used in this manuscript
ANN Artificial Neural NetworksFDS Fault Diagnosis SystemI2C Inter-Integrated CircuitMLP Multilayer PerceptronRF Random ForestRT Regression TreeRMS Root Mean SquareRMSE Root Mean Square ErrorSG Smart GridSVM Suport Vector Machine
References
1 Patan K Korbicz J Głowacki G DC motor fault diagnosis by means of artificial neural networksIn Proceedings of the Fourth International Conference on Informatics in Control Automation and RoboticsAngers France 9ndash12 May 2007 pp 11ndash18 [CrossRef]
2 Gongora WS Silva HVD Goedtel A Godoy WF da Silva SAO Neural approach for bearingfault detection in three phase induction motors In Proceedings of the 2013 9th IEEE InternationalSymposium on Diagnostics for Electric Machines Power Electronics and Drives (SDEMPED) ValenciaSpain 27ndash30 August 2013 [CrossRef]
3 Kouki M Dellagi S Achour Z Erray W Optimal integrated maintenance policy based on qualitydeterioration In Proceedings of the 2014 IEEE International Conference on Industrial Engineering andEngineering Management Bandar Sunway Malaysia 9ndash12 December 2014 [CrossRef]
Sensors 2019 19 4342 15 of 17
4 Amihai I Gitzel R Kotriwala AM Pareschi D Subbiah S Sosale G An Industrial Case StudyUsing Vibration Data and Machine Learning to Predict Asset Health In Proceedings of the 2018 IEEE 20thConference on Business Informatics (CBI) Vienna Austria 11ndash14 July 2018 [CrossRef]
5 Wang N Sun S Si S Li J Research of predictive maintenance for deteriorating system based onsemi-markov process In Proceedings of the 2009 16th International Conference on Industrial Engineeringand Engineering Management Beijing China 21ndash23 October 2009 [CrossRef]
6 Gao B Guo L Ma L Wang K Corrective maintenance process simulation algorithm research based onprocess interaction In Proceedings of the IEEE 2012 Prognostics and System Health Management Conference(PHM) Beijing China 23ndash25 May 2012 [CrossRef]
7 Plante T Nejadpak A Yang CX Faults detection and failures prediction using vibration analysisIn Proceedings of the 2015 IEEE AUTOTESTCON National Harbor Maryland 2ndash5 Novermber 2015[CrossRef]
8 Yildirim M Sun XA Gebraeel NZ Sensor-Driven Condition-Based Generator MaintenanceSchedulingmdashPart I Maintenance Problem IEEE Trans Power Syst 2016 31 4253ndash4262 [CrossRef]
9 Yildirim M Sun XA Gebraeel NZ Sensor-Driven Condition-Based Generator MaintenanceSchedulingmdashPart II Incorporating Operations IEEE Trans Power Syst 2016 31 4263ndash4271 [CrossRef]
10 Mathew V Toby T Singh V Rao BM Kumar MG Prediction of Remaining Useful Lifetime (RUL)of turbofan engine using machine learning In Proceedings of the 2017 IEEE International Conference onCircuits and Systems (ICCS) Batumi Georgia 5ndash8 December 2017 [CrossRef]
11 Verbert K Schutter BD Babuška R A Multiple-Model Reliability Prediction Approach for Condition-Based Maintenance IEEE Trans Reliab 2018 67 1364ndash1376 [CrossRef]
12 Breiman L Friedman J Stone CJ Olshen R Classification and Regression Trees 1st ed Chapman andHallCRC Boca Raton FL USA 1984
13 Breiman L Random forests Mach Learn 2001 45 5ndash32 [CrossRef]14 Bird J Engineering Mathematics 5th ed Newnes-Elsevier Oxford UK 200715 Haykin SO Neural Networks and Learning Machines 3rd ed Pearson Upper Saddle River NJ USA 200816 Zheng C Malbasa V Kezunovic M Regression tree for stability margin prediction using synchrophasor
measurements IEEE Trans Power Syst 2013 28 1978ndash1987 [CrossRef]17 Bae KY Jang HS Sung DK Hourly Solar Irradiance Prediction Based on Support Vector Machine and
Its Error Analysis IEEE Trans Power Syst 2016 [CrossRef]18 Shevchik SA Saeidi F Meylan B Wasmer K Prediction of Failure in Lubricated Surfaces Using Acoustic
TimendashFrequency Features and Random Forest Algorithm IEEE Trans Ind Inform 2017 13 1541ndash1553[CrossRef]
19 Wang X Ladle furnace temperature prediction model based on large-scale data with random forestIEEECAA J Autom Sin 2017 4 770ndash774 [CrossRef]
20 Zhang B Wei Z Ren J Cheng Y Zheng Z An Empirical Study on Predicting Blood Pressure UsingClassification and Regression Trees IEEE Access 2018 6 21758ndash21768 [CrossRef]
21 Ababei C Moghaddam MG A Survey of Prediction and Classification Techniques in Multicore ProcessorSystems IEEE Trans Parallel Distrib Syst 2019 30 1184ndash1200 [CrossRef]
22 Tian Z Zuo MJ Health Condition Prediction of Gears Using a Recurrent Neural Network ApproachIEEE Trans Reliab 2010 59 700ndash705 [CrossRef]
23 Li C Liu S Zhang H Hu Y Machinery condition prediction based on wavelet and support vectormachine In Proceedings of the 2013 International Conference on Quality Reliability Risk Maintenance andSafety Engineering (QR2MSE) Sichuan China 15ndash18 July 2013 [CrossRef]
24 Marugaacuten AP Maacuterquez FPG Perez JMP Ruiz-Hernaacutendez D A survey of artificial neural network inwind energy systems Appl Energy 2018 228 1822ndash1836 [CrossRef]
25 Huang J Chen G Shu L Wang S Zhang Y An Experimental Study of Clogging Fault Diagnosis inHeat Exchangers Based on Vibration Signals IEEE Access 2016 4 1800ndash1809 [CrossRef]
26 Ntalampiras S Fault Diagnosis for Smart Grids in Pragmatic Conditions IEEE Trans Smart Grid 2016[CrossRef]
27 Alippi C Ntalampiras S Roveri M Model-Free Fault Detection and Isolation in Large-ScaleCyber-Physical Systems IEEE Trans Emerg Top Comput Intell 2017 1 61ndash71 [CrossRef]
Sensors 2019 19 4342 16 of 17
28 Gao Z Cecati C Ding SX A Survey of Fault Diagnosis and Fault-Tolerant TechniquesmdashPart I FaultDiagnosis With Model-Based and Signal-Based Approaches IEEE Trans Ind Electron 2015 62 3757ndash3767[CrossRef]
29 Daoud M Mayo M A survey of neural network-based cancer prediction models from microarray dataArtif Intell Med 2019 97 204ndash214 [CrossRef]
30 Brand L Patel A Singh I Brand C Real Time Mortality Risk Prediction A Convolutional NeuralNetwork Approach In Proceedings of the 11th International Joint Conference on Biomedical EngineeringSystems and Technologies SCITEPRESSmdashScience and Technology Publications Funchal Madeira Portugal19ndash21 January 2018 [CrossRef]
31 Hao Y Usama M Yang J Hossain MS Ghoneim A Recurrent convolutional neural network basedmultimodal disease risk prediction Future Gener Comput Syst 2019 92 76ndash83 [CrossRef]
32 Stubbemann J Treiber NA Kramer O Resilient Propagation for Multivariate Wind Power PredictionIn Proceedings of the International Conference on Pattern Recognition Applications and MethodsSCITEPRESSmdashScience and and Technology Publications Lisbon Portugal 10ndash12 January 2015 [CrossRef]
33 Ak R Fink O Zio E Two Machine Learning Approaches for Short-Term Wind Speed Time-SeriesPrediction IEEE Trans Neural Netw Learn Syst 2016 27 1734ndash1747 [CrossRef]
34 Li F Ren G Lee J Multi-step wind speed prediction based on turbulence intensity and hybrid deepneural networks Energy Convers Manag 2019 186 306ndash322 [CrossRef]
35 Yilboga H Eker OF Guclu A Camci F Failure prediction on railway turnouts using time delay neuralnetworks In Proceedings of the 2010 IEEE International Conference on Computational Intelligence forMeasurement Systems and Applications Taranto Italy 6ndash8 September 2010 [CrossRef]
36 Shebani A Iwnicki S Prediction of wheel and rail wear under different contact conditions using artificialneural networks Wear 2018 406ndash407 173ndash184 [CrossRef]
37 Arora Y Singhal A Bansal A PREDICTION amp WARNING ACM SIGSOFT Softw Eng Notes 2014 39 1ndash5[CrossRef]
38 Su Y Zhang Y Yan J Neural Network Based Movie Rating Prediction In Proceedings of the2018 International Conference on Big Data and ComputingmdashICBDC Shenzhen China 28ndash30 April 2018[CrossRef]
39 Muradkhanli L Neural Networks for Prediction of Oil Production IFAC-PapersOnLine 2018 51 415ndash417[CrossRef]
40 Gebraeel N Lawley M Liu R Parmeshwaran V Residual Life Predictions From Vibration-BasedDegradation Signals A Neural Network Approach IEEE Trans Ind Electron 2004 51 694ndash700 [CrossRef]
41 Wen P Vibration Analysis and Prediction of Turbine Rotor Based Grey Artificial Neural NetworkIn Proceedings of the 2009 International Conference on Measuring Technology and Mechatronics AutomationHunan China 11ndash12 April 2009 [CrossRef]
42 Guumlnnemann N Pfeffer J Predicting Defective Engines using Convolutional Neural Networks on TemporalVibration Signals In Proceedings of the First International Workshop on Learning with Imbalanced DomainsTheory and Applications ECML-PKDD Skopje Macedonia 22 September 2017 Volume 74 pp 92ndash102
43 Arduino About Us Available online httpswwwarduinoccenMainAboutUs (accessed on8 July 2019)
44 Akasa 12cm Viper Fan Available online httpwwwakasacomtwsearchphpseed=AK-FN059 (accessedon 8 July 2019)
45 Freescale Semiconductor Technical Data Xtrinsic MMA8452Q 3-Axis12-bit8-bit Digital AccelerometerAvailable online httpscdnsparkfuncomdatasheetsSensorsAccelerometersMMA8452Q-rev81pdf(accessed on 8 July 2019)
46 NXP Semiconductor UM10204 I2C-Bus Specification and User Manual Available online httpswwwnxpcomdocsenuser-guideUM10204pdf (accessed on 8 July 2019)
47 Processing Home Available online httpsprocessingorg (accessed on 8 July 2019)48 Lathi BP Linear Systems and Signals 2nd ed Oxford University Press New York NY USA 200449 Skiena SS The Data Science Design Manual (Texts in Computer Science) Springer Cham Switzerland 201750 Inc WR Root-Mean-Square Available online httpmathworldwolframcomRoot-Mean-Squarehtml
(accessed on 8 July 2019)
Sensors 2019 19 4342 17 of 17
51 Foundation TR The R Project for Statistical Computing Available online httpswwwr-projectorg(accessed on 8 July 2019)
52 DataCamp The R Documentation Available online httpswwwrdocumentationorg (accessed on8 July 2019)
53 Vapnik VN Statistical Learning Theory Wiley-Interscience New York NY USA 199854 Cortes C Vapnik V Support-vector networks Mach Learn 1995 20 273ndash297 [CrossRef]55 Chang CC Lin CJ LIBSVM A Library for Support Vector Machines ACM Trans Intell Syst Technol
2011 2 1ndash27 [CrossRef]
ccopy 2019 by the authors Licensee MDPI Basel Switzerland This article is an open accessarticle distributed under the terms and conditions of the Creative Commons Attribution(CC BY) license (httpcreativecommonsorglicensesby40)
- Introduction
- Related Works
-
- Data Predicting with ANN
- ANN in Engines Failure Prediction Systems
-
- Proposed Method
-
- Data Collection and Data Processing
- Performance Index
- ANN Training
- Comparing with Other Machine Learning Techniques
-
- Prediction Results
- Conclusions
- References
-
Sensors 2019 19 4342 2 of 17
types of maintenance industry has begun to perform condition-based maintenance where predictiveequipment status is used to plan a maintenance Employing this method has become part of the smartindustrial maintenance and results in fewer downtimes than scheduled maintenance as it avoidsunnecessary maintenance and reduces corrective maintenance by anticipating possible equipmentfailures [247ndash11] Machine learning techniques such as Artificial Neural Network (ANN) RegressionTree (RT) Random Forest (RF) and Support Vector Machine (SVM) are being used to perform regressionand prediction tasks in various applications [1012ndash21] These techniques have enabled predictivecondition systems or remaining useful lifetime systems to be developed that allow different types ofproduction variables to be used [1022ndash24]
The objectives of this work were (1) to propose a methodology to generate a training datasetbased on vibration measurements This methodology includes the characterization of the dataset anddefinition of a way of calculating the failure time in vibrating systems by means of the amplitudeand frequency data (2) to train an ANN to be able to predict the failure time of an equipmentThis prediction allows anticipating maintenance only before a failure on motor occurs reducing theproduction line downtimes and the costs involved A computer cooling fan with an accelerometercoupled to it to measure its vibrations was used to simulate the evolution of motor vibration and collectthe data to train and test the ANN The training dataset was generated considering the frequencyspectrum of the vibrations containing amplitude and frequency of a time interval Each pair ofamplitude and frequency measurements was associated with a failure time The efficiency of the modeltraining was demonstrated by comparative tests with RT RF and SVM machine learning techniquesThe tests performed were the k-fold cross-validation standard test and model generalization testboth of them using the Root Mean Square Error (RMSE) performance index [1415]
This work is organized as follows Section 2 presents the related works Section 3 presents themethods applied in the development of the proposed system Section 4 presents the predictive testsperformed and the results of the performance index and Section 5 presents the conclusions andproposals for future studies
2 Related Works
In the context of asset management in industry condition-based maintenance plays an importantrole in seeking to reduce unnecessary maintenance reduce downtime and reduce costs involved inthese two aspects In general this maintenance strategy includes fault diagnosis fault prognosis andmaintenance process optimization [8911]
Fault Diagnosis Systems (FDSs) play the role of fault diagnosis aiming to detect and identifyfaults characterized when a behavior or system parameter is out of acceptable conditions [25ndash27]This type of system was studied in both small and local applications [25] as well as largersystems [2627] FDSs can be classified into two main groups those using model-based techniques andthose using model-free techniques The first group uses mathematical models of the monitored systemwhich describe the behavior of the real process This model is used to compare the behavior of the realsystem with that described by the model The second group uses machine learning techniques to learnthe different states of the monitored system to identify and classify faults [26ndash28] Ntalampiras [26]presents an FDS in electrical Smart Grids (SG) where a model-free method was used to detect andisolate faults in SG using data from the physical layer of the monitored system
In contrast to FDSs which aim to detect and classify faults fault prediction systems complywith failure prognosis aspect which aims to predict the future behavior of equipment and determinetheir possible moments of failure assisting in decision making on maintenance issues YildirimSun and Gebraeel [89] presented a framework for generating efficient maintenance planning basedon predictive analytics using Bayesian prognostic techniques This predictive analysis dynamicallyestimates the remaining life distribution of electric generators allowing estimating the maintenancecost and the best time for maintenance to occur Verbert Schutter and Babuška [11] also presentedthe optimization of maintenance through efficient failure prediction the work propose a multivariate
Sensors 2019 19 4342 3 of 17
multiple-model approach based on Wiener processes for modeling and predicting of equipmentdegradation behavior The work clearly traces the dependencies between the processes of faultdiagnosis fault prognosis and maintenance optimization In the fault prognosis context ANNs areimportant tools because they enable the implementation of the prediction task easily and accurately
21 Data Predicting with ANN
ANNs are structures inspired by biological neurons and formed by simple units of processingcalled neuron The neurons are connected to each other and for each connection a synaptic weight isgiven The training phase of the ANN adjusts the synaptic weights of these connections modeling therelation of inputs and outputs of the system ANNs have the ability to model nonlinear and complexproblems and are easy to implement as numerous libraries for various programming languages areavailable The high generalizability of this technique is also a highlight as data outside the training setis admissible in the system [152429]
One of the tasks that can be performed by a ANN is prediction This task was used to assist inthe control and monitoring of numerous variables in several areas In medicine ANNs were used topredict mortality risk and incidence of disease [29ndash31] Hao et al [31] used ANNs to predict chronicdisease risk in patients The system developed used as input structured and unstructured data aboutthe patientrsquos health conditions In the field of wind power they were used to predict wind speed andthe amount of power that can be generated [2432ndash34] A study by Li Ren and Lee [34] presents theused ANNs to predict wind speed with the objective of reducing the effect of the instability of thisvariable and increasing the efficiency of the generation of electrical energy The system uses windvelocity as input transforming this data into average wind speed and wind speed turbulence intensityIn the area of railway engineering studies have predicted failure point in rail turnouts and the rates ofwear of wheels and rails [3536] Shebani and Iwnicki [36] presented a system for predicting wear intrain wheels and train tracks The system was developed with the aim of reducing maintenance costsimproving passenger comfort and even avoiding accidents To carry out this prediction the authorsused an ANN having as inputs several variables such as the characteristics of the wheels and railstrain speed yaw angle etc Other areas have also been targets of prediction studies using ANNs suchas turbine operation [10] education [37] entertainment [38] and production [39]
22 ANN in Engines Failure Prediction Systems
ANNs were employed in studies of engines to analyse vibrations and predict equipmentfailure [2472240ndash42] A study by Plante Nejadpak and Yang [7] showed that by observing thevibration of motors it was possible to identify those considered normal in the operation of themachinery and those related to failure From this analysis along with the data concepts associatedwith vibration it was possible to detect and predict faults and allows predictive maintenance to beplanned and helps to establish the remaining life of the equipment For each type of failure the authorspresented a frequency spectrum of the collected vibrations allowing the analysis of the vibrationbehavior to identify possible types of failure The use of the frequency spectrum to perform theanalyses was also employed in the present work since with this spectrum it is possible to havestrong reliable signal data Gongora et al [2] presented the failure classification of induction motorbearings based on ANNs using the motor stator current as data input The work describes motormaintenance the costs involved and the types of failures It highlights the main types of engine failureand concludes that engine failure prediction can be performed by non-invasive methods such asvibration measurement Guumlnnemann and Pfeffer [42] presented the classification of defects of a motorthrough the measurement of vibration in its operation This classification was performed with anANN having as input data the frequency spectrum of the collected signal the output being a binaryrepresenting a defective or non-defective motor
Sensors 2019 19 4342 4 of 17
The ANN proposed in the present study was developed from the information gathered in thearticles mentioned above The methodology which involves data collection and treatment ANNtraining and performance measures is described in the next section
3 Proposed Method
In real systems the collection and processing of data used for machine learning training shouldbe performed historically in relation to the point of interest like an equipment failure Knowingwhen a particular equipment failed a preliminary dataset would be extracted containing sensorsdata information This dataset should then be refined and enriched with signal growth informationand the time remaining for the failure to occur This work presents a methodology to generate atraining dataset similar to the dataset of a possible real system with the difference that the vibrationsignal growth rate and the estimated failure time were artificially generated for a better control of thescenarios and testing of the ANN This methodology has as much importance as the results achievedallowing vibration behaviors to be simulated and the data collected used to produce the training andtest datasets for machine learning Figure 1 shows the overview of the proposed method The processbegins with data collection derived from the measurements made by the accelerometer coupledto a cooler fan This data was then processed to generate training dataset Among the proceduresperformed with this data are the Fourrier transform of the vibration signal the definition of signalgrowth rates and the calculation of motor failure time After the data were processed the ANN wastrained to predict the motor failure time and validated by means of a performance index
Figure 1 Data collection and pre-processing flow chart
31 Data Collection and Data Processing
The device model used in this work to collect data was comprised of a computer cooling fan withsmall magnets fixed to its blades Adding a second magnet to certain blades created a weight differencebetween those with only one magnet and those with two magnets This weight difference generatedvibrations during the rotation of the fanrsquos motor allowing the vibration to be controlled in order togenerate different vibration scenarios A microcontroller the Arduino UNO was responsible for settingthe motor speeds and performing the readings of the vibration values from the accelerometer [43]
An Akasa AK-FN059 12cm Viper cooling fan was used in the construction of the device modeland an MMA8452Q accelerometer was used to measure vibration attached to the cooling fan [4445]This accelerometer has 12 bits of resolution and communicates with the microcontroller throughthe I2C (Inter-Integrated Circuit) protocol It was developed a software using Processing programlanguage to collect the data from the serial port and store it in a text file [4647] Figure 2 shows thedevice model developed to simulate motor vibrations
Figure 2 Device model developed to simulate vibrations in motors
Sensors 2019 19 4342 5 of 17
In order for the training dataset to cover different levels of vibration three weight distributionconfigurations were done in the cooler blades Figure 3 presents these configurations where the colorpairs represent the position where the weights were doubled to generate different vibration behaviorsFor each of these configurations 17 rotation speeds were set up ranging from 20 to 100 of thecooler maximum speed at 5 intervals The vibration measurements of each of these speeds wascollected by the accelerometer at a frequency of 20 ms for 1 min generating 3000 records per speedThus in total 153000 vibration records were collected from the simulation model
Figure 3 Weights distribution configurations between the coolerrsquos blades performed to collectdifferent vibration behaviors
The vibration data was pre-processed to standardize the inputs and outputs used in the trainingdataset When analyzing the behavior of the collected signals it was observed that the vibrationshad no harmonic behavior ie the signal did not show constant amplitude and frequency For thesame window of measurement of the same rotation speed different and non-standard data werecollected Therefore it was necessary to define a single frequency and amplitude value for each of theaxes in a measurement window Once 1 min of data was collected for each motor speed of the coolerrepresented by 3000 observations a set of 50 observations of the dataset were defined as the measuringwindow which represent 1 s of signal Figure 4 shows an example of the difference in measurementstaken at the same speed rotation of the fan at two different measuring windows
Figure 4 Vibration signals from two different and sequential measuring windows
The Fourier series and Fourier transform were used to describe the signals in the frequencydomain mapping the various frequencies and amplitudes of the signal From this transformation it was
Sensors 2019 19 4342 6 of 17
possible to define a single amplitude and frequency value per axis for each measurement window [48]For this purpose the calculation of the Fourier transform using the Fast Fourier Transform function wasimplemented in R with the aid of the rsquospectralrsquo library generating all pairs of amplitude and frequencyof a measurement window To generate a unique value for each window the Root Mean Square (RMS)value of the signal or effective value for the amplitude and frequency sets was calculated by thefollowing equation [49ndash51]
xrms =
radic1nmiddot
n
sumi=1
x2i (1)
where xrms represents the effective value of the amplitude or frequency xi represents each amplitudeor frequency that compose the signal and n the total number of amplitudes or frequencys that composethe signal
A new dataset containing 3060 records of pairs of amplitude and frequency data for each vibrationaxis was generated Figure 5 presents an example of the transformation performed on the vibrationmeasurements graphically
Figure 5 Process of simplification of measured vibration signal (a) Vibration signal collected froma measuring window (b) Application of the Fourrier Transform in the collected signal generatingall pairs of amplitude and frequency present in the signal (c) Calculation of the RMS value of theamplitudes and frequencies generating only one pair for each measurement window
With the unique values calculated for each measurement window it was possible to establish thethreshold values of amplitude and frequency needed to calculate the estimated failure time The limitvalues ie the maximum possible amplitude or frequency values before equipment failure weredefined by means of the analysis of the measurements made with the cooler rotating at the maximumspeed Thus the highest values of each amplitude and frequency pair were found for each axisThe maximum amplitudes on the accelerometer measurement scale ([minus8g 8g]) were 025 for the x axisand 07 for the y and z axes with a frequency of 18 Hz for all the 3 axes The data were analyzed toremove attributes that would not be representative The first attributes removed were the amplitudeand frequency of the x axis since the way the accelerometer was installed did not generate vibrationson that axis because it is the axis of height The frequency attributes of the y and z axes were thenremoved Although they generated values the interval between the measured frequencies and thethreshold was small and almost unchanged Thus only the amplitudes of the y and z axes were usedfor the training dataset Figure 6 graphically presents the process of generating the amplitudes used in
Sensors 2019 19 4342 7 of 17
training dataset where an amplitude value of the training dataset corresponds to the RMS value of acollected signal measurement window In this figure the amplitudes of y axis was represented
Figure 6 Schematic of vibration signal transformation to generate amplitude dataset (AY)
To calculate the estimated failure time three steps were performed in the dataset The first was toestablish vibration signal growth rates for the observations doubling the dataset for the amount ofdesired growth rates Three growth rates gr of the signal were set 001 002 and 005 In a real-timesystem this rate would be found by averaging the amplitude and frequency difference of two windowsof sequential measurements indicating how the vibration signal is growing The second step was tocalculate the time in windows of measurement so that each amplitude reached the threshold valueaccording to the growth rate established for each amplitude of the axes This calculation is given by
FTx =xlim minus x
x middot gr(2)
where FTx represents the failure time considering one variable x (amplitude) xlim represents thethreshold value of x and gr represents the growth rate of the signal Finally the third step was tocalculate the average between the failure times generating the expected equipment failure time Thusgiven the input x = x1 x2 xn and the signal growth rate gr the expected output representing theestimated failure time FTe is given by
FTe =sumn
i=1xilimminusxi
xi middotgr
n(3)
This was a simple and efficient way to characterize the vibration dataset and can be performed atany time interval for the measurement windows In the case of this work the measurement windowused was 1 s however it could have a duration of 1 min 1 h or 1 day with the result of calculating theequipment failure time given in the same units as the measuring window The equation presentedconsiders a linear growth rate however exponential or logarithmic growth behaviors could be useddepending on the desired or expected growth type In a real dataset this growth behavior would bediscovered by the ANN
Sensors 2019 19 4342 8 of 17
32 Performance Index
All validations of the trainings performed in this work used the RMSE performance indexThis performance index indicates the standard deviation of the difference between the estimated valuesand the values predicted [15] The RMSE value was calculated with the following equation [1415]
RMSE =
radic1nmiddot
n
sumi=1
(xprimei minus xi
)2 (4)
where n represents the number of observations compared xprimei the value of the i-th element of thepredicted results vector and xi the value of the i-th element of the test dataset estimated values vector
33 ANN Training
At the end of dataset pre-processing a new dataset was generated with 9180 observations andfour attributes amplitude of the y axis amplitude of the z axis signal growth rate and estimatedfailure time The first three attributes were used as input values for the training of the ANN since theattribute estimated failure time was used as the output of the network
The ANN class used to predict the failure time was the Multilayer Perceptron Neural Network(MLP) This ANN consists of an input layer one or more hidden layers and an output layer The inputsignal propagates forward from layer to layer until it reaches the network output The network traininghappens in a supervised way and although there are others the algorithm of backpropagation oferror is the most common learning algorithm for this type of ANN This architecture is flexible toparameterize inputs and outputs in the case of this work the network allows configuring differentsensorsrsquo input signals ANN neurons can be parameterized with nonlinear activation functionsensuring their use to continuous outputs This feature allows to model complex systems that deal withnonlinear datasets such as the relationship between vibration and equipment failure time addressedin this work This class of ANN in conjunction with the backpropagation learning algorithm is simpleto implement efficient for large-scale problems great generalizability and as can be seen in Section 4(Figure 7) depending on the dataset structure used for training converges quickly and accuratelywith the error tending asymptotically to 0 The backpropagantion learning algorithm can be usedwith an online update of synaptic weights these updates occur with each new set of inputs in ANNtraining so the model is refined by the training dataset observation number multiplied by numberof iteractions (epochs) giving greater precision in the model MLP neural network training withthe backpropagation algorithm is also computationally efficient because computation is linear for allANN synaptic weights making the algorithm linear with respect to the number of w synaptic weights(O(w)) The literature shows that it is a consolidated model for use in time series prediction problemsconsidered in some cases as a benchmarking model [152429]
The training of the ANN were performed in R with the help of the lsquoRSNNSrsquo library [5152]The training parameters were found empirically by trial and error for each set of parametersthe RMSE value was calculated and compared the parameters that presented the smaller RMSEwere learning rate (specifies the gradient descent step width)mdashη = 085 number of epochs(iterations)mdashMaxit = 50000 number of hidden layersmdashnHidden = 1 number of neurons in thehidden layermdashsizeHidden1 = 25 The ANN was trained with the backpropagation learning algorithm(learnFunc) the logistic function was used as the activation function of the hidden layer and the linearfunction was used as the activation function of the output layer (hiddenActFunc) The connectionsweight initialization between the neurons was performed in a random manner
34 Comparing with Other Machine Learning Techniques
To establish the performance level of the model generated with ANN training other classicalmachine learning techniques to perform the regression estimation and prediction tasks were chosenfor comparison Regression Tree Random Forest and Support Vector Machine techniques as well as
Sensors 2019 19 4342 9 of 17
ANNs are widely used for classification and prediction problems in many application areas [1014ndash21]For this reason they were selected to perform the same prediction task to which ANN was exposed
Regression Tree is the name given to a Decision Tree used to perform the regression taskThis structure consists of binary branches where each node represents a decision regarding a simplecomparison These decision frameworks consider all training dataset inputs modeling the relationshipof these inputs to the expected output The biggest advantage of this technique is the simplicityof tree construction requiring little processing Another advantage is the ease interpreting of thegenerated model The generalizability of this technique can be reduced as the tree structure stronglydepends on the training dataset so values outside of those considered during model training can leadto a large prediction error [10121649] RT training was conducted in R with the help of the lsquorpartrsquolibrary [5152] The choice of parameters for model training was performed in the same way as theANN empirically by trial and error The parameters with the lowest RMSE value were minimumobservations on one node for a split attemptmdashminSplit = 10 minimum number of observations ineach tree leaf (node)mdashminBucket = round(minSplit3) complexity parameter removes worthlessdivisionsmdashcp = 00000001 maximum tree depthmdashmaxDepth = 30
Random Forest corresponds to a set of tree predictors each of these trees is dependent on thevalues of an independently taken random input vector with the same distribution for all trees inthe forest This structure combines several simple predictors reducing complexity and improvingperformance when compared to individual tree models For regression problems RT is used assubmodels of the RF structure This technique is robust in the presence of outliers and noises in thetraining dataset and very stable to overfitting Just as RT RF may not perform well if the input datafrom the trained model is very different from the data presented during the training phase [10131819]RF training was performed in R with the help of the rsquorandomForestrsquo library [5152] The choice ofparameters happened empirically by trial and error The parameters with the lowest RMSE value werenumber of growing treesmdashnTree = 500 number of variables sampled in each divisionmdashmTry = 3minimum size of terminal nodesmdashnodeSize = 5 number of times data is exchanged per tree to verifythe variable importancemdashnPerm = 1
Support Vector Machine is a popular machine learning technique used for classification regressionprediction and other problems Nonlinear regression-driven SVMs enabled by the intensive-lossfunction [53] perform during the training phase basically the mapping of input vector elementsto high dimensional feature space using a nonlinear mapping process This technique like ANNsis highly flexible from a training dataset entry point of view and tends to have a better generalizationthan tree-based techniques [10151721234953ndash55] SVM training was conducted in R with the helpof the rsquosvmrsquo function of library lsquoe1071rsquo [5152] The choice of parameters also happened empiricallyby trial and error The parameters with the lowest RMSE value were kernel used in training andpredictionmdashkernel = radial basis cost of constraints violationmdashcost = 10 parameter γ used in kernelcalculation formulamdashγ = 10 tolerance of termination criterionmdashtolerance = 0001 parameter ε valueof the insensitive-loss functionmdashε = 00005
The parameters presented were the ones that were varied to find the best RMSE performanceindex There are other parameters for the training of each of these machine learning techniqueshowever these other parameters were configured with the default values of the R libraries usedTo consolidate and allow a better visualization of the used parameters Table 1 presents the parametersby technique Comparative tests between these techniques are presented in the next section
Sensors 2019 19 4342 10 of 17
Table 1 Machine learning techniques parameters
ANN RF
nHidden = 1 nTree = 500sizeHidden1 = 25 mTry = 3η = 085 nodeSize = 5Maxit(epochs) = 50000 nPerm = 1learnFunc = BackpropagationhiddenActFunc = Logistic
RT SVM
minSplit = 10 kernel = radial basisminBucket = round(minSplit3) cost = 10cp = 00000001 γ = 10maxDepth = 30 tolerance = 00001
ε = 00005
4 Prediction Results
The models using the machine learning techniques described in the previous section were trainedand tested During ANN model training the learning algorithm tends to reduce the output errorinteractively Figure 7 shows the evolution of the weighted sum of squared error for the k = 1 folderIt can be seen from this figure that the error value tends asymptotically to 0 quickly and the errorno longer varies after few training epochs The other folders presented similar behavior in respectof error evolution during the training The training phase involved k-fold cross-validation to verifyin a standardize way the performance of the trained model The k-fold cross-validation enables thesimulation of k data scenarios where the test dataset is not use to train the model After each foldertraining the prediction model was tested with the test dataset and the values predicted and estimatedare compared with the performance index [15] By means of the RMSE calculation using the estimatedand predicted values it was possible to measure if the generated model had precision and reflectedthe reality of the system being studied In this work the k value was set as 5 Also the RMSE valuescan be used to compare the models performance Figure 8 presents the graphs which demonstratethis comparison for the models generated in the k = 1 folder where the x axis represents the set ofamplitudes of the signal and the signal growth rate (AY-AZ-GR) and y axis represents the failure timein seconds For small amplitudes and small vibration signal growth rate the time until the equipmentfails is longer as the vibrations increase and vibration increases the time until the equipment fails isshorter The dataset used was generated considering a window of measurement of 1 s which generateda failure time also in seconds but this window could consider a measurement of 1 day which wouldgenerate a failure time in days meaning that the measuring window is flexible Table 2 shows theRMSE values for each model validation folder and the average of this index
Sensors 2019 19 4342 11 of 17
Figure 7 Iterative error evolution of the ANN training process (k = 1)
Figure 8 Results of the tests of the first folder (k = 1) carried out with the machine learning techniques
Table 2 RMSE values of the folders used in the test of the machine learning techniques
Folder ANN RT RF SVM
1 00039 00047 00025 001062 00035 00054 00035 001293 00028 00051 00022 001054 00041 00052 00024 001205 00049 00052 00026 00123
Average 00038 00051 00026 00117
All models converged during training and were able to deliver good performance resultsThe average RMSE for the ANN model was 00038 being ahead of the models trained with theRT and SVM techniques the best result of k-fold cross-validation was presented by the RF techniquewith an average RMSE value of 00026 Performance measurements of models acquired through the
Sensors 2019 19 4342 12 of 17
test dataset even with k-fold cross-validation may present better values than a possible generalizationin a real system This scenario can happen if the dataset has values in its observations close to or evenequal In the dataset used in models training and testing the amplitude and vibration growth ratevalues were doubled to simulate different scenarios of vibratory behavior generating optimal testssince the test dataset can contain the same values for vibration amplitude in y and z as the trainingdataset Thus two new datasets were generated with different amplitude values and vibration signalgrowth rates in relation to the original training dataset in order to attest to the generalizability ofthe trained model Both datasets for generalization served as input to the models and the RMSEvalues of these new tests were calculated Generalization dataset (a) was generated with the samevibration amplitude values as the modelsrsquo original training dataset but with different growth ratevalues of 0015 003 and 004 totaling 9180 observations Generalization dataset (b) was producedwith the average amplitude values for each cooler motor rotation speed in the three weight settings ofits blades doubled by the vibration signal growth rates of 0015 003 and 004 totaling 153 observationsComparative graphs between the estimated and predicted values of these two generalization datasetscan be seen in Figures 9 and 10 as well as numerically in Table 3 The values generated for thesedatasets did not exceed the maximum and minimum values of the models training dataset in ordernot to impair the performance of tree-based techniques It is possible to observe in these figures and byanalyzing Table 3 that the prediction followed the same behavior as the one presented in the k-foldcross-validation in a more accentuated way Short term predictions were accurate for ANN RT and RFtechniques however for medium and long term predictions ANN outperformed the other techniquesIn general ANN had the best RMSE indexes for the generalization tests with 00313 for generalization(a) and 0118 for the generalization (b) The values presented are low proving the good generalizabilityof the model The RT and RF models had a good generalization for short term predictions and evenwith low RMSE indexes SVM did not perform very well
The results presented in tests with ANN prove that the objective of the work was achievedand that a real-time system could be implemented to predict the failure time associated with vibrationin motors using this machine learning technique This system should have as input the same parametersused in the ANN training vibration amplitude on the y axis amplitude of vibration on the z axis andvibration signal growth rate calculated with the current vibration values and the values of the lastmeasurement The system would output the estimated failure time with good accuracy
Figure 9 Generalization Test (a)
Sensors 2019 19 4342 13 of 17
Figure 10 Generalization Test (b)
Table 3 RMSE values of the generalization test of the machine learning techniques
Gen ANN RT RF SVM
a 00313 00922 00920 00696b 01184 01417 01430 01237
5 Conclusions
Increasingly businesses seek more efficient ways to perform activities that directly impact theirperformance In the case of the advent of smart industry accurately predicting when any equipment orprocess may fail helps decision making regarding maintenance that needs to be performed minimizingcosts and reducing workload
The objectives of this work and its main contributions were to propose a methodology to treat thecollected vibration data from a device model developed to simulate an actual system by measuring thevibrations of a computer cooler fan with an accelerometer and to build a dataset to train a ANN capableof predicting when a failure can happen The construction of this dataset involved the estimation ofequipment failure time achieved by a formula that considers the linear growth of the signal The ANNclass chosen to perform the prediction task was MLP which is an easy to implement ANN with a goodgeneralization index The ANN model was compared in terms of RMSE performance index valueswith other machine learning techniques Regression Tree Random Forest and Support Vector MachineThe results of the training and comparative tests were satisfactory showed that the ANN model wassuperior to the other techniques Generalization in short term predictions were equivalent betweenANN RT and RF techniques however with the ANN model medium and long term predictionswere better The success of the training and testing of the MLP neural network described in this workto predict motor failure shows that this technique could be applied in industrial condition-basedmaintenance Despite the good performance of the ANN for the dataset built in this paper MLP neuralnetworks with backpropagation learning algorithm may have some weaknesses The literature [15]points out a tendency of these techniques to converge slowly besides allowing the occurrence ofoverfitting where after a certain time of training the error curve until close to 0 moves away from0 Thus some of these points can be explored in future work Different classes of ANNs could beimplemented and compared in order to observe which is the best model for the problem discussed in
Sensors 2019 19 4342 14 of 17
this paper From an asset management point of view it would be interesting to evaluate the possibilityof jointly implementing fault diagnosis systems and fault prediction systems with ANNs with the aimof building a unified system for maintenance planning in the industry The proposed methodologycould also be target of future works considering real systems measurements and other variables suchas temperature and pressure of the equipment since the behavior of these variables are different andwould influence the construction of fault prediction systems differently The training dataset could beconstructed based on real measurements or simulated with nonlinear estimates such as logarithmicor exponential
It is important to highlight that research and development of techniques that helps decisionmaking in the industry are essential for greater production efficiency and cost reductionThe development of low cost and easy implementation solutions are attractive to industry which canmaterialize academic knowledge and development
Author Contributions Conceptualization GSS ARdAVF LSdS and LAdS Data curation GSS Formalanalysis GSS Funding acquisition ARdAVF LSdS and LAdS Investigation GSS and LAdSMethodology GSS Project administration ARdAVF LSdS and LAdS Resources GSS Software GSSSupervision LAdS Validation GSS ARdAVF LSdS and LAdS Visualization GSS Writingmdashoriginaldraft GSS Writingmdashreview amp editing ARdAVF LSdS and LAdS
Funding This research is a part of the RampD project ldquoEMAEndashANEEL- PampD 00393-00082017rdquo funded by EMAEmdashMetropolitan Company of Water amp Energy of the state of Satildeo Paulo Brazil
Acknowledgments We thank all the EMAE staff who participated in the RampD project ldquoEMAEndashANEEL-PampD00393-00082017rdquo and all the faculty and students members of the BigMAAp research lab at MackenziePresbyterian University
Conflicts of Interest The authors declare no conflict of interest The funders had no role in the design of thestudy in the collection analyses or interpretation of data in the writing of the manuscript or in the decision topublish the results
Abbreviations
The following abbreviations are used in this manuscript
ANN Artificial Neural NetworksFDS Fault Diagnosis SystemI2C Inter-Integrated CircuitMLP Multilayer PerceptronRF Random ForestRT Regression TreeRMS Root Mean SquareRMSE Root Mean Square ErrorSG Smart GridSVM Suport Vector Machine
References
1 Patan K Korbicz J Głowacki G DC motor fault diagnosis by means of artificial neural networksIn Proceedings of the Fourth International Conference on Informatics in Control Automation and RoboticsAngers France 9ndash12 May 2007 pp 11ndash18 [CrossRef]
2 Gongora WS Silva HVD Goedtel A Godoy WF da Silva SAO Neural approach for bearingfault detection in three phase induction motors In Proceedings of the 2013 9th IEEE InternationalSymposium on Diagnostics for Electric Machines Power Electronics and Drives (SDEMPED) ValenciaSpain 27ndash30 August 2013 [CrossRef]
3 Kouki M Dellagi S Achour Z Erray W Optimal integrated maintenance policy based on qualitydeterioration In Proceedings of the 2014 IEEE International Conference on Industrial Engineering andEngineering Management Bandar Sunway Malaysia 9ndash12 December 2014 [CrossRef]
Sensors 2019 19 4342 15 of 17
4 Amihai I Gitzel R Kotriwala AM Pareschi D Subbiah S Sosale G An Industrial Case StudyUsing Vibration Data and Machine Learning to Predict Asset Health In Proceedings of the 2018 IEEE 20thConference on Business Informatics (CBI) Vienna Austria 11ndash14 July 2018 [CrossRef]
5 Wang N Sun S Si S Li J Research of predictive maintenance for deteriorating system based onsemi-markov process In Proceedings of the 2009 16th International Conference on Industrial Engineeringand Engineering Management Beijing China 21ndash23 October 2009 [CrossRef]
6 Gao B Guo L Ma L Wang K Corrective maintenance process simulation algorithm research based onprocess interaction In Proceedings of the IEEE 2012 Prognostics and System Health Management Conference(PHM) Beijing China 23ndash25 May 2012 [CrossRef]
7 Plante T Nejadpak A Yang CX Faults detection and failures prediction using vibration analysisIn Proceedings of the 2015 IEEE AUTOTESTCON National Harbor Maryland 2ndash5 Novermber 2015[CrossRef]
8 Yildirim M Sun XA Gebraeel NZ Sensor-Driven Condition-Based Generator MaintenanceSchedulingmdashPart I Maintenance Problem IEEE Trans Power Syst 2016 31 4253ndash4262 [CrossRef]
9 Yildirim M Sun XA Gebraeel NZ Sensor-Driven Condition-Based Generator MaintenanceSchedulingmdashPart II Incorporating Operations IEEE Trans Power Syst 2016 31 4263ndash4271 [CrossRef]
10 Mathew V Toby T Singh V Rao BM Kumar MG Prediction of Remaining Useful Lifetime (RUL)of turbofan engine using machine learning In Proceedings of the 2017 IEEE International Conference onCircuits and Systems (ICCS) Batumi Georgia 5ndash8 December 2017 [CrossRef]
11 Verbert K Schutter BD Babuška R A Multiple-Model Reliability Prediction Approach for Condition-Based Maintenance IEEE Trans Reliab 2018 67 1364ndash1376 [CrossRef]
12 Breiman L Friedman J Stone CJ Olshen R Classification and Regression Trees 1st ed Chapman andHallCRC Boca Raton FL USA 1984
13 Breiman L Random forests Mach Learn 2001 45 5ndash32 [CrossRef]14 Bird J Engineering Mathematics 5th ed Newnes-Elsevier Oxford UK 200715 Haykin SO Neural Networks and Learning Machines 3rd ed Pearson Upper Saddle River NJ USA 200816 Zheng C Malbasa V Kezunovic M Regression tree for stability margin prediction using synchrophasor
measurements IEEE Trans Power Syst 2013 28 1978ndash1987 [CrossRef]17 Bae KY Jang HS Sung DK Hourly Solar Irradiance Prediction Based on Support Vector Machine and
Its Error Analysis IEEE Trans Power Syst 2016 [CrossRef]18 Shevchik SA Saeidi F Meylan B Wasmer K Prediction of Failure in Lubricated Surfaces Using Acoustic
TimendashFrequency Features and Random Forest Algorithm IEEE Trans Ind Inform 2017 13 1541ndash1553[CrossRef]
19 Wang X Ladle furnace temperature prediction model based on large-scale data with random forestIEEECAA J Autom Sin 2017 4 770ndash774 [CrossRef]
20 Zhang B Wei Z Ren J Cheng Y Zheng Z An Empirical Study on Predicting Blood Pressure UsingClassification and Regression Trees IEEE Access 2018 6 21758ndash21768 [CrossRef]
21 Ababei C Moghaddam MG A Survey of Prediction and Classification Techniques in Multicore ProcessorSystems IEEE Trans Parallel Distrib Syst 2019 30 1184ndash1200 [CrossRef]
22 Tian Z Zuo MJ Health Condition Prediction of Gears Using a Recurrent Neural Network ApproachIEEE Trans Reliab 2010 59 700ndash705 [CrossRef]
23 Li C Liu S Zhang H Hu Y Machinery condition prediction based on wavelet and support vectormachine In Proceedings of the 2013 International Conference on Quality Reliability Risk Maintenance andSafety Engineering (QR2MSE) Sichuan China 15ndash18 July 2013 [CrossRef]
24 Marugaacuten AP Maacuterquez FPG Perez JMP Ruiz-Hernaacutendez D A survey of artificial neural network inwind energy systems Appl Energy 2018 228 1822ndash1836 [CrossRef]
25 Huang J Chen G Shu L Wang S Zhang Y An Experimental Study of Clogging Fault Diagnosis inHeat Exchangers Based on Vibration Signals IEEE Access 2016 4 1800ndash1809 [CrossRef]
26 Ntalampiras S Fault Diagnosis for Smart Grids in Pragmatic Conditions IEEE Trans Smart Grid 2016[CrossRef]
27 Alippi C Ntalampiras S Roveri M Model-Free Fault Detection and Isolation in Large-ScaleCyber-Physical Systems IEEE Trans Emerg Top Comput Intell 2017 1 61ndash71 [CrossRef]
Sensors 2019 19 4342 16 of 17
28 Gao Z Cecati C Ding SX A Survey of Fault Diagnosis and Fault-Tolerant TechniquesmdashPart I FaultDiagnosis With Model-Based and Signal-Based Approaches IEEE Trans Ind Electron 2015 62 3757ndash3767[CrossRef]
29 Daoud M Mayo M A survey of neural network-based cancer prediction models from microarray dataArtif Intell Med 2019 97 204ndash214 [CrossRef]
30 Brand L Patel A Singh I Brand C Real Time Mortality Risk Prediction A Convolutional NeuralNetwork Approach In Proceedings of the 11th International Joint Conference on Biomedical EngineeringSystems and Technologies SCITEPRESSmdashScience and Technology Publications Funchal Madeira Portugal19ndash21 January 2018 [CrossRef]
31 Hao Y Usama M Yang J Hossain MS Ghoneim A Recurrent convolutional neural network basedmultimodal disease risk prediction Future Gener Comput Syst 2019 92 76ndash83 [CrossRef]
32 Stubbemann J Treiber NA Kramer O Resilient Propagation for Multivariate Wind Power PredictionIn Proceedings of the International Conference on Pattern Recognition Applications and MethodsSCITEPRESSmdashScience and and Technology Publications Lisbon Portugal 10ndash12 January 2015 [CrossRef]
33 Ak R Fink O Zio E Two Machine Learning Approaches for Short-Term Wind Speed Time-SeriesPrediction IEEE Trans Neural Netw Learn Syst 2016 27 1734ndash1747 [CrossRef]
34 Li F Ren G Lee J Multi-step wind speed prediction based on turbulence intensity and hybrid deepneural networks Energy Convers Manag 2019 186 306ndash322 [CrossRef]
35 Yilboga H Eker OF Guclu A Camci F Failure prediction on railway turnouts using time delay neuralnetworks In Proceedings of the 2010 IEEE International Conference on Computational Intelligence forMeasurement Systems and Applications Taranto Italy 6ndash8 September 2010 [CrossRef]
36 Shebani A Iwnicki S Prediction of wheel and rail wear under different contact conditions using artificialneural networks Wear 2018 406ndash407 173ndash184 [CrossRef]
37 Arora Y Singhal A Bansal A PREDICTION amp WARNING ACM SIGSOFT Softw Eng Notes 2014 39 1ndash5[CrossRef]
38 Su Y Zhang Y Yan J Neural Network Based Movie Rating Prediction In Proceedings of the2018 International Conference on Big Data and ComputingmdashICBDC Shenzhen China 28ndash30 April 2018[CrossRef]
39 Muradkhanli L Neural Networks for Prediction of Oil Production IFAC-PapersOnLine 2018 51 415ndash417[CrossRef]
40 Gebraeel N Lawley M Liu R Parmeshwaran V Residual Life Predictions From Vibration-BasedDegradation Signals A Neural Network Approach IEEE Trans Ind Electron 2004 51 694ndash700 [CrossRef]
41 Wen P Vibration Analysis and Prediction of Turbine Rotor Based Grey Artificial Neural NetworkIn Proceedings of the 2009 International Conference on Measuring Technology and Mechatronics AutomationHunan China 11ndash12 April 2009 [CrossRef]
42 Guumlnnemann N Pfeffer J Predicting Defective Engines using Convolutional Neural Networks on TemporalVibration Signals In Proceedings of the First International Workshop on Learning with Imbalanced DomainsTheory and Applications ECML-PKDD Skopje Macedonia 22 September 2017 Volume 74 pp 92ndash102
43 Arduino About Us Available online httpswwwarduinoccenMainAboutUs (accessed on8 July 2019)
44 Akasa 12cm Viper Fan Available online httpwwwakasacomtwsearchphpseed=AK-FN059 (accessedon 8 July 2019)
45 Freescale Semiconductor Technical Data Xtrinsic MMA8452Q 3-Axis12-bit8-bit Digital AccelerometerAvailable online httpscdnsparkfuncomdatasheetsSensorsAccelerometersMMA8452Q-rev81pdf(accessed on 8 July 2019)
46 NXP Semiconductor UM10204 I2C-Bus Specification and User Manual Available online httpswwwnxpcomdocsenuser-guideUM10204pdf (accessed on 8 July 2019)
47 Processing Home Available online httpsprocessingorg (accessed on 8 July 2019)48 Lathi BP Linear Systems and Signals 2nd ed Oxford University Press New York NY USA 200449 Skiena SS The Data Science Design Manual (Texts in Computer Science) Springer Cham Switzerland 201750 Inc WR Root-Mean-Square Available online httpmathworldwolframcomRoot-Mean-Squarehtml
(accessed on 8 July 2019)
Sensors 2019 19 4342 17 of 17
51 Foundation TR The R Project for Statistical Computing Available online httpswwwr-projectorg(accessed on 8 July 2019)
52 DataCamp The R Documentation Available online httpswwwrdocumentationorg (accessed on8 July 2019)
53 Vapnik VN Statistical Learning Theory Wiley-Interscience New York NY USA 199854 Cortes C Vapnik V Support-vector networks Mach Learn 1995 20 273ndash297 [CrossRef]55 Chang CC Lin CJ LIBSVM A Library for Support Vector Machines ACM Trans Intell Syst Technol
2011 2 1ndash27 [CrossRef]
ccopy 2019 by the authors Licensee MDPI Basel Switzerland This article is an open accessarticle distributed under the terms and conditions of the Creative Commons Attribution(CC BY) license (httpcreativecommonsorglicensesby40)
- Introduction
- Related Works
-
- Data Predicting with ANN
- ANN in Engines Failure Prediction Systems
-
- Proposed Method
-
- Data Collection and Data Processing
- Performance Index
- ANN Training
- Comparing with Other Machine Learning Techniques
-
- Prediction Results
- Conclusions
- References
-
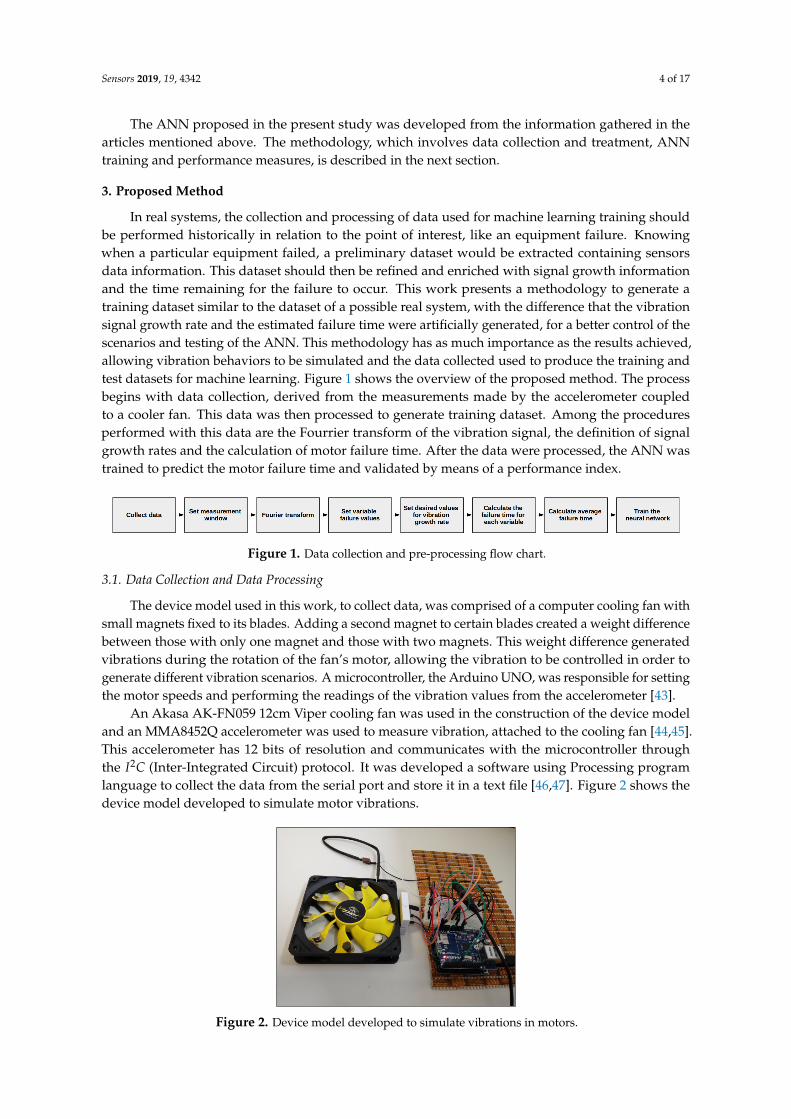
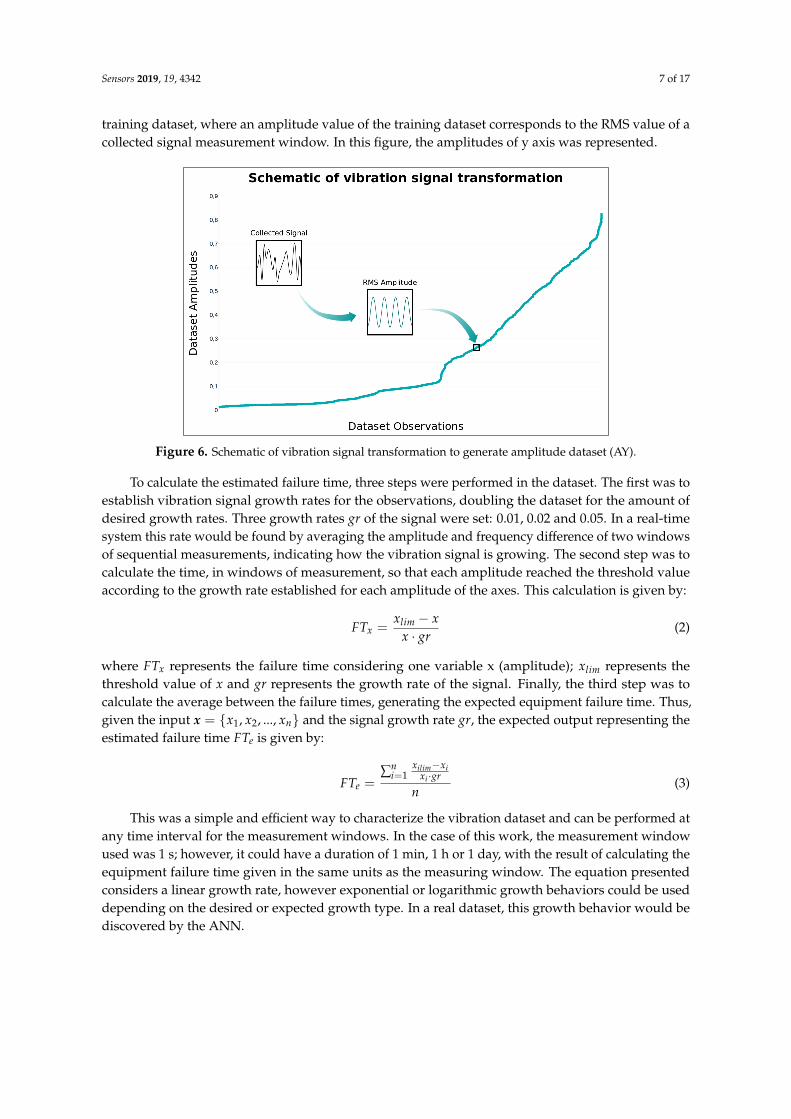
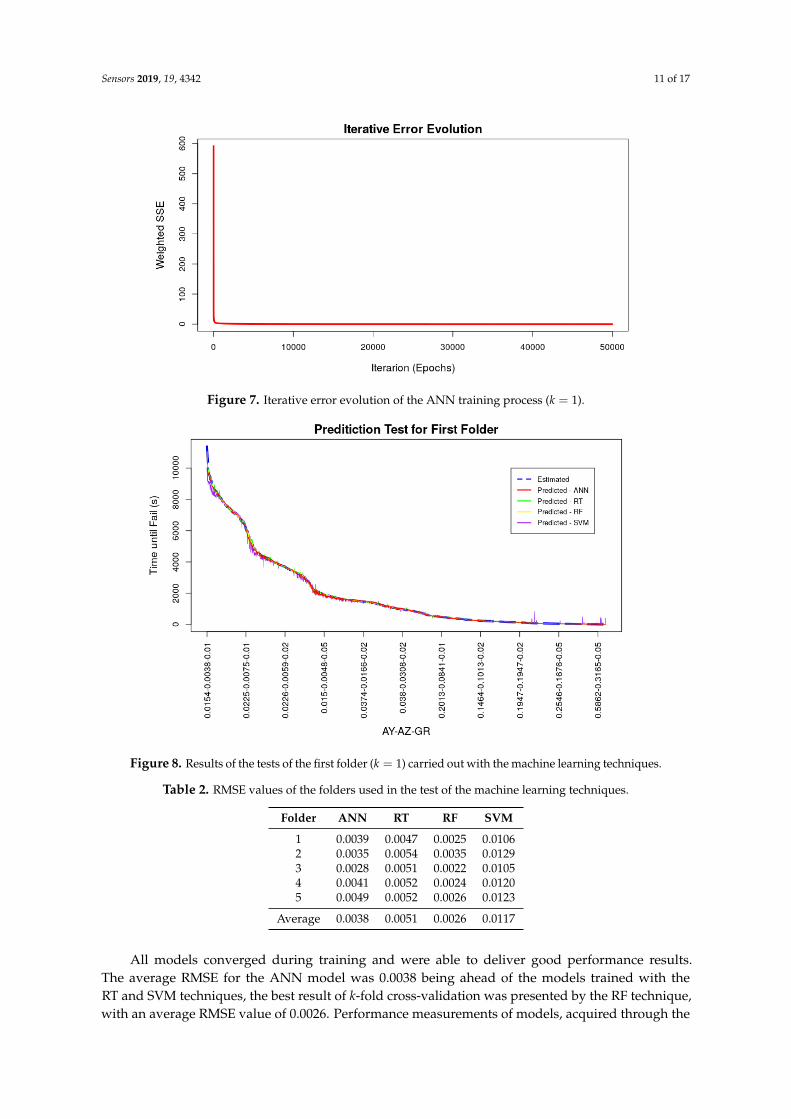
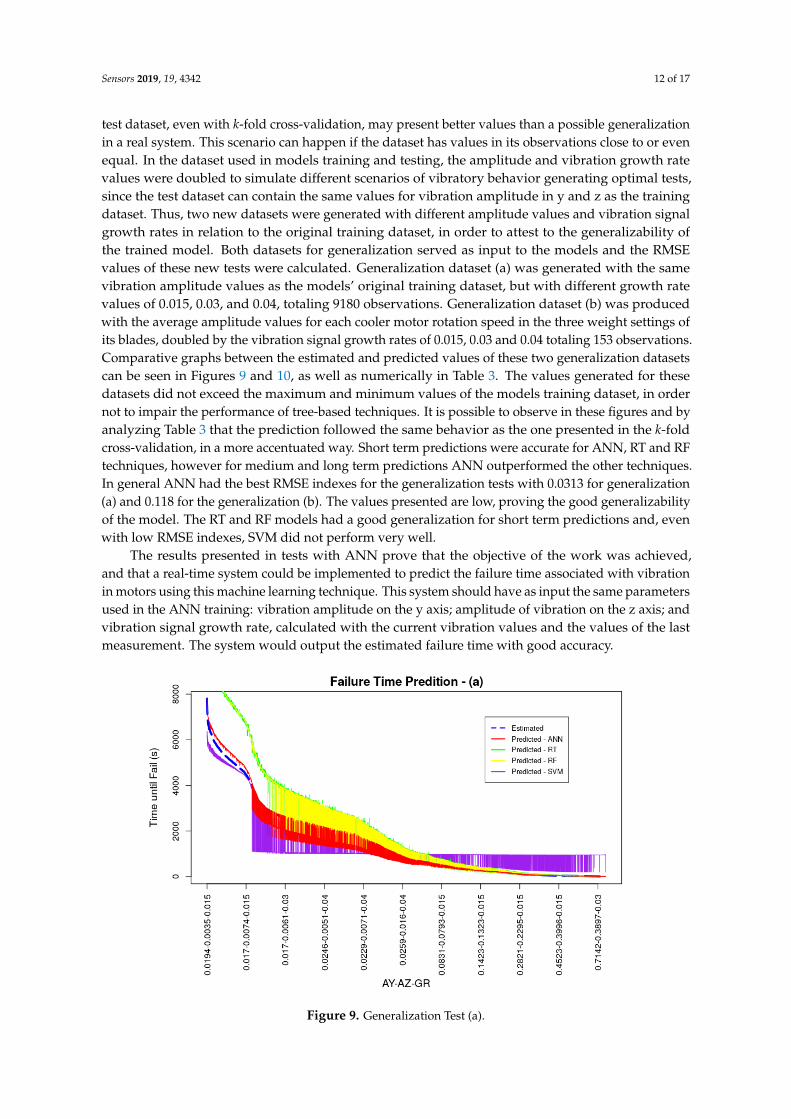
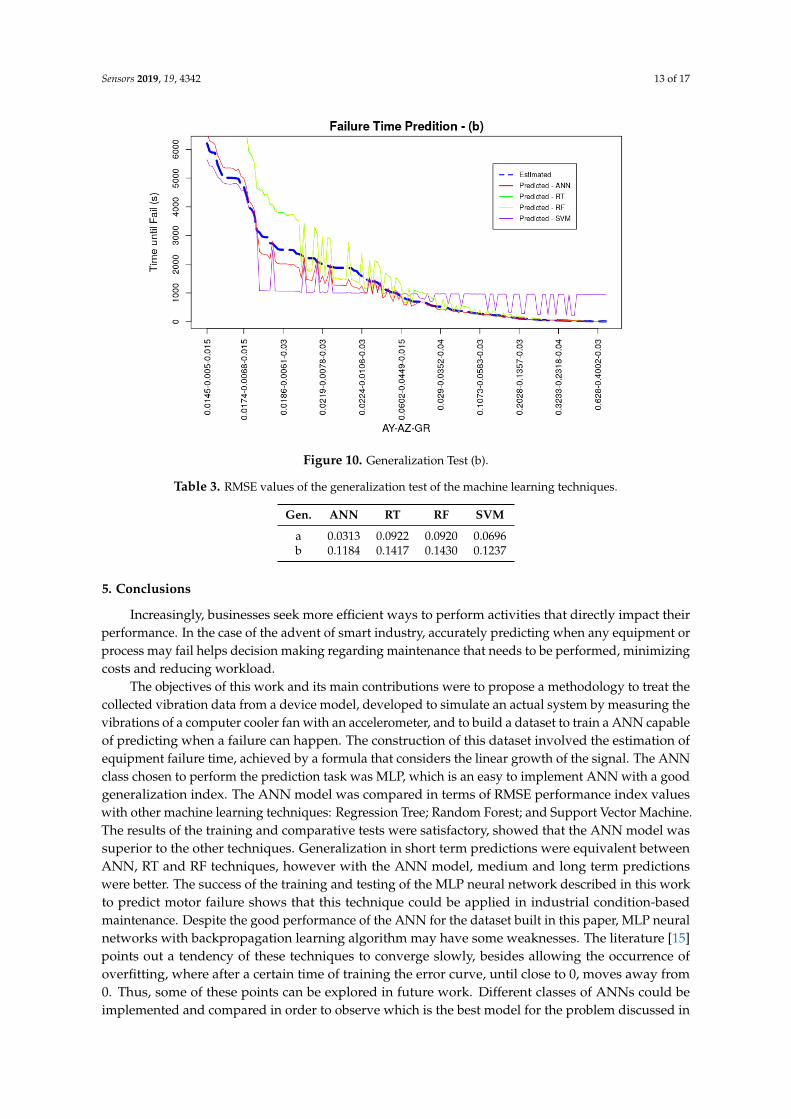