prediction of the extreme wind speed in the mixed climate
TRANSCRIPT
SHORT COMMUNICATION
Prediction of the extreme wind speed in the mixedclimate region by using Monte Carlo simulation andmeasure-correlate-predict methodTakeshi Ishihara and Atsushi Yamaguchi
Department of Civil Engineering, School of Engineering, The University of Tokyo, Tokyo, Japan
ABSTRACT
The extremewind speed at an offshore location was predicted usingMonte Carlo simulation (MCS) andmeasure-correlate-predict(MCP)method. TheGumbel distribution could successfully express the annual maximumwind speed of extratropical cyclone. Onthe other hand, the estimated extreme wind speed of tropical cyclones by analytical probability distribution shows largeruncertainty. In the mixed climate like Japan, the extreme wind speed estimated from the combined probability distributionobtained by MCP and MCS methods agrees well with the observed data as compared with the combined probability distributionobtained by the MCP method only. The uncertainty of extreme wind speed due to limited observation period of wind speed andpressure was also evaluated by the Gumbel theory and Monte Carlo simulation. As a result, it was found that the uncertainty of50year recurrence wind speed obtained byMCS method is considerably smaller than that obtained byMCP method in the mixedclimate. Copyright © 2014 John Wiley & Sons, Ltd.
KEYWORDS
Monte Carlo simulation; measure-correlate-predict method; mixed climate; extreme wind speed; prediction uncertainty;observation period
Correspondence
Atsushi Yamaguchi, Department of Civil Engineering, School of Engineering, The University of Tokyo.E-mail: [email protected]
Received 21 August 2012; Revised 10 October 2013; Accepted 28 October 2013
1. INTRODUCTION
The assessment of the design wind speed of wind turbines requires the accurate estimation of the probability distribution ofannual maximum wind speed. In those regions where strong wind event is dominated by only extratropical cyclones,measure-correlate-predict (MCP) method and Gumbel analysis can be used to assess the extreme wind speed as shownin IEC61400-1 Annex E.4 However, in mixed climate regions where more than one significant wind-producingmeteorological phenomena are observed, the examination of each phenomenon is required.5,6
Japan is one of those mixed climate regions, where both tropical and extratropical cyclones are the significantmeteorological phenomenon, and the estimation of the probability distribution of annual maximum wind speed inducedby tropical cyclones requires a special care. In Japan, for example, 26 typhoons are generated every year on average.However, in some years and in some locations, the strong wind event induced by tropical cyclones may not be observed,which results in the statistically unstable annual maximum wind speed induced by tropical cyclones.
To overcome this unstability, Monte Carlo simulation (MCS) of tropical cyclones4 has been proposed and adopted in theArchitectural Institute of Japan recommendation5 and American Society of Civil Engineers standard.6 This method isstatistically more stable, and uncertainty would be smaller than the method based on measurement. However, very fewstudies have investigated the uncertainty of the extreme wind speed estimation on the basis of Monte Carlo simulations.
In this study, first, MCP method and Gumbel analysis is applied for the estimation of the probability distribution ofstrong wind events induced by both tropical and extratropical cyclones to investigate the applicability of MCP method.Then, the probability of annual maximum wind speed induced by tropical cyclone is estimated by using MCS to showthe advantage of the Monte Carlo simulation. Next, the uncertainty of extreme wind speed related to the number of
WIND ENERGY
Wind Energ. (2014)
Published online in Wiley Online Library (wileyonlinelibrary.com). DOI: 10.1002/we.1693
Copyright © 2014 John Wiley & Sons, Ltd.
annual maximum wind speed for both tropical and extratropical cyclones are estimated theoretically. Lastly, the uncer-tainty related to the length of pressure measurement data used to identify the probability distribution of tropical cycloneparameters is investigated.
2. ESTIMATION OF EXTREME WIND SPEED ON THE BASIS OF WIND SPEEDMEASUREMENT
Measure-correlate-predict method uses the short-term on-site measurement data and the long-term measurement data atnearby meteorological station, and on the basis of the correlation between those sites, the long-term wind speed anddirection at the site of interest are estimated.1 If on-site measurement is not available, numerical simulation can be usedto estimate the correlation. In this study, a computational fluid dynamics based model, MASCOT,7,8 is used to estimatethe correlation and long-term wind speed and direction at the offshore site. In this section, the detail of this method isdescribed and the extreme wind speed is estimated based on this method. Although, strictly speaking, this method isdifferent from original MCP method, the distance between these two sites is a few kilometers, and a good correlation ofwind speeds can be seen in measured wind speeds between these sites, this method is referred as MCP method in this paper.
2.1. The MCP method
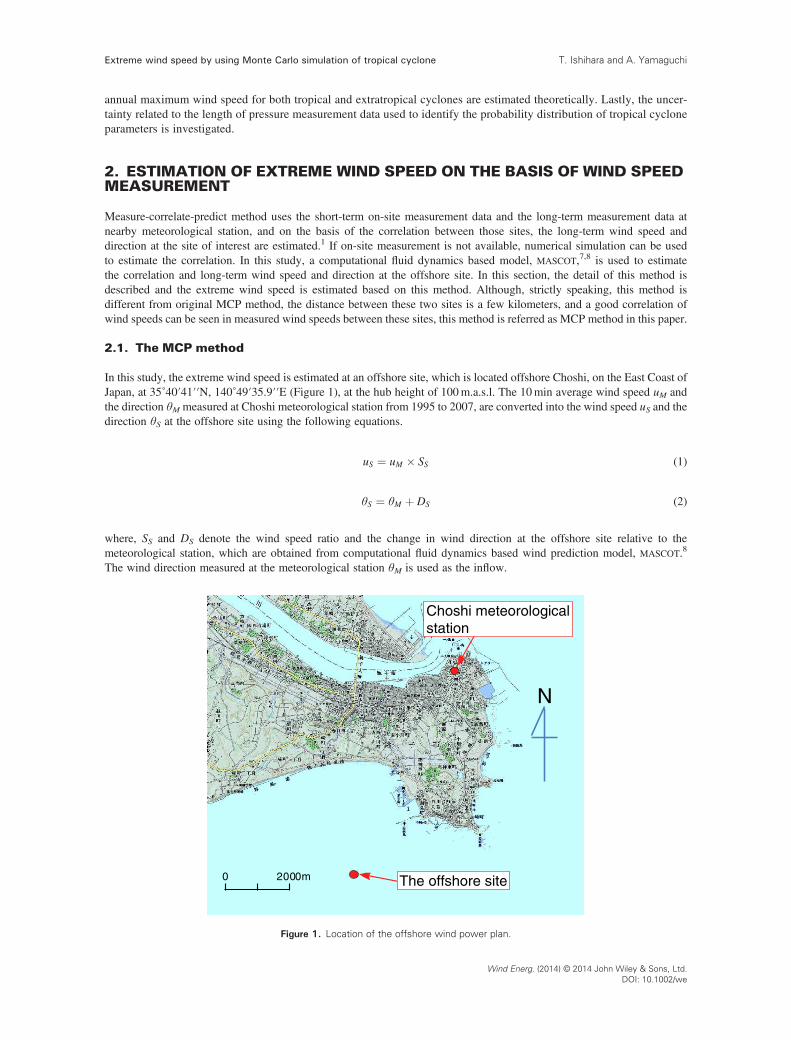
In this study, the extreme wind speed is estimated at an offshore site, which is located offshore Choshi, on the East Coast ofJapan, at 35˚40′41′′N, 140˚49′35.9′′E (Figure 1), at the hub height of 100m.a.s.l. The 10min average wind speed uM andthe direction θM measured at Choshi meteorological station from 1995 to 2007, are converted into the wind speed uS and thedirection θS at the offshore site using the following equations.
uS ¼ uM � SS (1)
θS ¼ θM þ DS (2)
where, SS and DS denote the wind speed ratio and the change in wind direction at the offshore site relative to themeteorological station, which are obtained from computational fluid dynamics based wind prediction model, MASCOT.8
The wind direction measured at the meteorological station θM is used as the inflow.
Figure 1. Location of the offshore wind power plan.
Extreme wind speed by using Monte Carlo simulation of tropical cyclone T. Ishihara and A. Yamaguchi
Wind Energ. (2014) © 2014 John Wiley & Sons, Ltd.DOI: 10.1002/we

The spatial distributions of the wind speed at the site for northerly and southerly winds are shown in Figure 2. Thenortherly wind (Figure 2(a)) is affected by land, and the wind speed in the lower boundary layer decreases compared withthe southerly wind (Figure 2(b)).
Figure 3 shows the speed-up ratio at the offshore sight relative to the Choshi meteorological station for each winddirection. Here, wind direction 0° denotes northerly wind, 90° easterly wind, etc. Because the anemometer at the Choshimeteorological station is located at 28m.a.s.l., the speed up ratio shows larger than one for almost all the wind directions.For the wind direction between 135° (south easterly) and 270° (westerly), the speed up ratio is significantly larger than one.This is due to the wind speed decrease caused by local terrain at the Choshi meteorological station.
2.2. Estimation of extreme wind speed induced by extratropical cyclones
All of the strong wind events in which the center of tropical cyclone did not pass within 500 km from the site of interest areassumed to be caused by extratropical cyclones. Annual maximum wind speeds induced by extratropical cyclones areextracted and ranked in ascending order and named from u1 to uN. The probability distribution of annual maximum windspeed, i.e., non-exceedance probability of annual maximum wind speed can be written as equation (3).
F uið Þ ¼ i= N þ 1ð Þ (3)
Probability distribution of annual maximum wind speed induced by extratropical cyclones can be approximated byGumbel distribution. In this case, the expected value uE of annual maximum wind speed can be expressed as follows.9
uE ¼ V þ σP y� γð Þ= π=6ð Þ (4)
Here, V and σP are the average value and the standard deviation of annual maximum wind speed, γ is the Euler constant(=0.57722) and y is the reduced variate and can be calculated as
Figure 2. Spatial distributions of wind speed at the offshore site for the northerly and southerly winds.
0.0
0.5
1.0
1.5
2.0
0 45 90 135 180 225 270 315 360
SS
Wind direction (degree)
Figure 3. Variation of speed-up ratio of mean wind speed with wind direction.
Extreme wind speed by using Monte Carlo simulation of tropical cycloneT. Ishihara and A. Yamaguchi
Wind Energ. (2014) © 2014 John Wiley & Sons, Ltd.DOI: 10.1002/we
yi ¼ �ln �ln F uið Þð Þð Þ: (5)
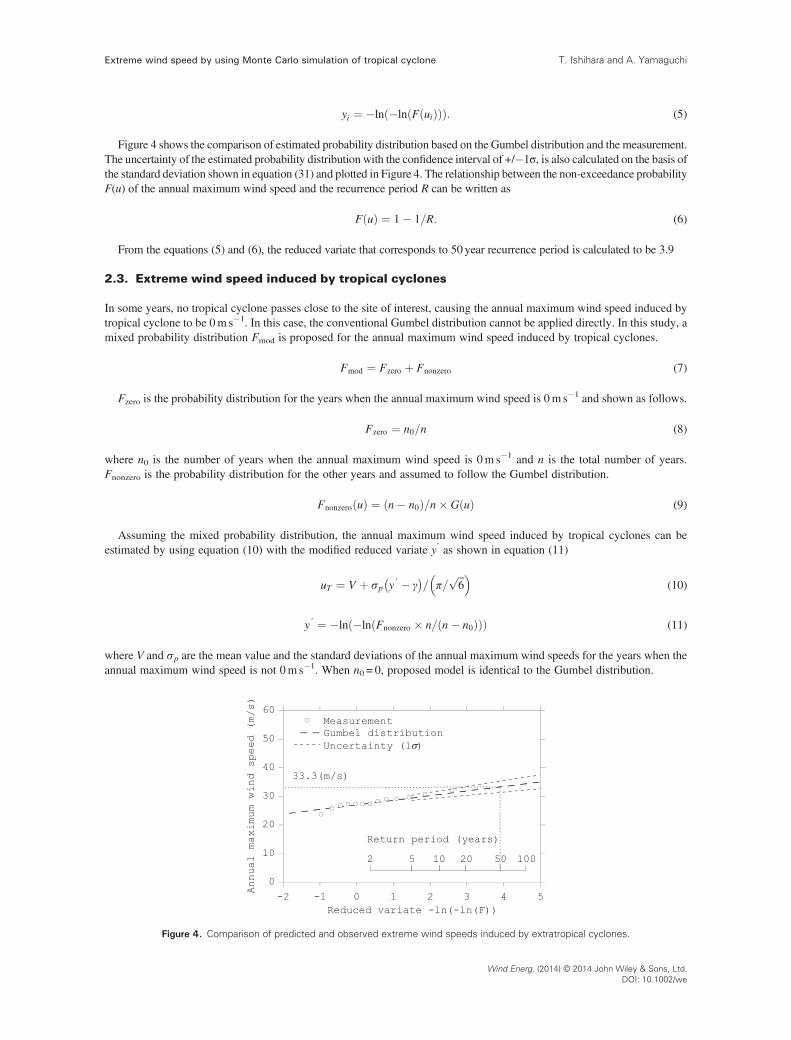
Figure 4 shows the comparison of estimated probability distribution based on the Gumbel distribution and the measurement.The uncertainty of the estimated probability distribution with the confidence interval of +/�1σ, is also calculated on the basis ofthe standard deviation shown in equation (31) and plotted in Figure 4. The relationship between the non-exceedance probabilityF(u) of the annual maximum wind speed and the recurrence period R can be written as
F uð Þ ¼ 1� 1=R: (6)
From the equations (5) and (6), the reduced variate that corresponds to 50year recurrence period is calculated to be 3.9
2.3. Extreme wind speed induced by tropical cyclones
In some years, no tropical cyclone passes close to the site of interest, causing the annual maximum wind speed induced bytropical cyclone to be 0m s�1. In this case, the conventional Gumbel distribution cannot be applied directly. In this study, amixed probability distribution Fmod is proposed for the annual maximum wind speed induced by tropical cyclones.
Fmod ¼ Fzero þ Fnonzero (7)
Fzero is the probability distribution for the years when the annual maximum wind speed is 0m s�1 and shown as follows.
Fzero ¼ n0=n (8)
where n0 is the number of years when the annual maximum wind speed is 0m s�1 and n is the total number of years.Fnonzero is the probability distribution for the other years and assumed to follow the Gumbel distribution.
Fnonzero uð Þ ¼ n� n0ð Þ=n� G uð Þ (9)
Assuming the mixed probability distribution, the annual maximum wind speed induced by tropical cyclones can beestimated by using equation (10) with the modified reduced variate y’ as shown in equation (11)
uT ¼ V þ σp y ′ � γ� �
= π=ffiffiffi6
p� �(10)
y ′ ¼ �ln �ln Fnonzero � n= n� n0ð Þð Þð Þ (11)
where V and σp are the mean value and the standard deviations of the annual maximum wind speeds for the years when theannual maximum wind speed is not 0m s�1. When n0 = 0, proposed model is identical to the Gumbel distribution.
Figure 4. Comparison of predicted and observed extreme wind speeds induced by extratropical cyclones.
Extreme wind speed by using Monte Carlo simulation of tropical cyclone T. Ishihara and A. Yamaguchi
Wind Energ. (2014) © 2014 John Wiley & Sons, Ltd.DOI: 10.1002/we

Figure 5 shows the probability distribution of the annual maximum wind speed induced by tropical cyclones. The whitecircles denote the measured annual maximum wind speed induced by tropical cyclones for 13 years, and the dashed linedenotes the proposed model. The uncertainty of the estimated probability distribution is also calculated as in Figure 4and shown in Figure 5. Proposed model shows good agreement with the measurement for the recurrence period shorter than5 years, whereas large uncertainty is found for recurrence period longer than 5 years. This is due to the large uncertainty inthe estimation of the probability distribution.
2.4. Extreme wind speed in mixed climate
In mixed climate region, examination of each significant wind-producing meteorological phenomena is carried outfollowed by synthesis of the individual mechanisms into a combined extreme wind speed distribution.2 When FE(uE)and FT(uT) are the probability distribution of annual maximum wind speed induced by extratropical and tropical cyclones,respectively, the combined probability distribution FC(uC) can be written as
FC uCð Þ ¼ FE uEð Þ � FT uTð Þ: (12)
Figure 6 shows the combined probability distribution calculated by equation (12). The combined probability distributionshows good agreement with measurement for the recurrence period shorter than 5 years, but large uncertainties may beincluded for longer recurrence period. The uncertainty of the estimated combined probability distribution is calculatedon the basis of equation (36).
3. ESTIMATION OF EXTREME WIND SPEED BY MONTE CARLO SIMULATION
Estimation of extreme wind speed by MCS is expected to have smaller uncertainty than those based on measurement be-cause simulation for longer periods (e.g., 10,000 years) is possible. In this section, an MCS of tropical cyclones proposedby Ishihara et al.10 is described, and application of this method to the offshore site is shown.
The flowchart of the MCS of tropical cyclones is shown in Figure 7. First, five tropical cyclone parameters (centralpressure depth, radius of maximum wind speed, translation speed and direction, and minimum distance) are evaluated froma historical track record of past tropical cyclones. Then, synthetic tropical cyclones are generated for longer periods tosatisfy the probability distributions and their correlations using a modified orthogonal decomposition (MOD) method.Gradient wind speeds are estimated from the pressure distribution of the synthetic tropical cyclones, and surface windspeeds are predicted considering the topography and roughness. Finally, the extreme wind distributions of tropical cyclonesare estimated.
Figure 5. Comparison of predicted and observed extreme wind speeds caused by tropical cyclones.
Extreme wind speed by using Monte Carlo simulation of tropical cycloneT. Ishihara and A. Yamaguchi
Wind Energ. (2014) © 2014 John Wiley & Sons, Ltd.DOI: 10.1002/we

3.1. Estimation of the tropical cyclone parameters
Tropical cyclone parameters are estimated on the basis of the historical track record of tropical cyclones provided by JapanMeteorological Agency from 1961 to 2007, which includes the surface pressure measurement data and digitized weatherchart for same period.
The number of tropical cyclones per year λ is defined as the number of tropical cyclones passed within the simula-tion circle with the radius of 500 km from the site of interest and estimated from the historical track record. The centralpressure pC, translation speed and direction C and θ, and the minimum distance dmin are also estimated from thehistorical track record. The radius of maximum wind speed Rm is estimated by the pressure model proposed bySchloemer:11
p rð Þ � pcp∞ � pc
¼ expRm
r
� �(13)
where p(r) is the surface pressure at the distance r from the center of the tropical cyclone. In this study, Rm is estimated by leastsquare method so that the error between the pressure model and the measured surface pressure is minimized. The ambient pressurep∞ can also be estimated by the least square method, in which case, the central pressure depth is calculated by Δp=p∞� pC.
In this study, the five tropical cyclone parameters and the number of tropical cyclones per year are modeled by using theprobability distribution functions shown in Table I. The definition typhoon direction θ is 0° for southbound tropical cycloneand measured counterclockwise. Δp, Rm and C are modeled by mixed probability of log normal and Weibull distributions(Ishihara et al.10), θ by normal distribution (Vickery and Twisdale12), dmin by quadratic function and λ by Poisson
Figure 6. Comparison of predicted and observed extreme wind speeds in mixed climate by the MCP method.
Speed-up ratio anddeviation of winddirection
Tropical cyclonedatabase
Simulation period
Extreme wind probabilitydistribution for tropical cyclones
Prediction of surface windspeed and direction
Generation of synthetictropical cyclones
Evaluation of tropical cycloneparameters
Yes
No
Figure 7. Flowchart of the Monte Carlo simulation of tropical cyclones.
Extreme wind speed by using Monte Carlo simulation of tropical cyclone T. Ishihara and A. Yamaguchi
Wind Energ. (2014) © 2014 John Wiley & Sons, Ltd.DOI: 10.1002/we

distribution. The model parameters estimated at Choshi meteorological station are also shown in Table I. The correlationcoefficients between parameters are also calculated and shown in Table II.
3.2. Generation of synthetic tropical cyclones
Synthetic tropical cyclones are generated for N years to satisfy the modeled probability distributions and the correlations oftropical cyclone parameters. The change in pressure field of tropical cyclones during one event can be neglected since windspeeds and directions are estimated only when tropical cyclones are located inside the simulation circle with a diameter of500 km. A MOD method proposed by Ishihara et al.10 is used to satisfy the statistical distribution of each parameters andthe correlations between them. The detailed procedure of the MOD method is described in the succeeding text. Five param-eters describing a tropical cyclone are normalized and written in vector form as follows:
xT ¼ ln Δpð Þ; ln Rmð Þ; ln Cð Þ; θ; dminf g: (14)
The covariance matrix of x is defined as S. The eigenvalues λ(k) and the eigenvectors Φ(k) are calculated by solving thefollowing equation:
S� λ kð ÞEh i
Φ kð Þ ¼ 0: (15)
The independent parameters zi with five components are then generated following the approximated distributions to theintended ones for specified years and the number of the generated vectors following the estimated annual occurrence rate.The correlated parameters xi can be obtained by the following equation:
Table II. Correlation coefficients between measured tropical cyclone parameters.
ln(Δp) ln(Rm) ln(C) θ dmin
ln(Δp) 1.00 �0.37 �0.02 �0.03 0.27ln(Rm) �0.37 1.00 0.42 �0.06 �0.28ln(C) �0.02 0.42 1.00 �0.31 �0.27θ �0.03 �0.06 �0.31 1.00 �0.35dmin 0.27 �0.28 �0.27 �0.35 1.00
Table I. Probability distribution and distribution functions of tropical cyclone parameters.
Parameter Type Probability density function Value at Choshi
Central pressuredepth Δp (hPa)
Mixed fM xð Þ ¼ a� 1ffiffiffiffi2π
pσln x
exp � 12
lnx�μ lnxσ lnx
� �2 þ 1� að Þ � k
cxc
� �k�1exp
� x
c
� �k μ=1.584σ=0.115k=4.158c=43.733a=1.000
Radius of maximumwind speed Rm (km)
μ=2.102σ=0.246k=1.917c=164.679a=0.521
Translation speed C (m s�1) μ=1.657σ=0.227k=2.484c=57.481a=0.000
Translation direction θ (degree) Normal f N xð Þ ¼ 1ffiffiffiffi2π
pσexp � 1
2x�μσ
� �2h iμ=143.349σ=25.738
Minimum distance dmin (km) Polynomial x= zFp(x)2� (z� 2r )Fp(x)� r z=�409.980
r=500.000Number of tropicalcyclones per year λ
Poisson f p xð Þ ¼ λxmexp �λmð Þx! λm=2.787
Extreme wind speed by using Monte Carlo simulation of tropical cycloneT. Ishihara and A. Yamaguchi
Wind Energ. (2014) © 2014 John Wiley & Sons, Ltd.DOI: 10.1002/we

xi ¼ Φ 1ð Þ Φ 2ð Þ ⋯ Φ 5ð Þh i�1
zi ¼ 0: (16)
These vectors xi should be considered as a set of parameters for tropical cyclones. Although the correlation between eachcomponent of xi satisfies the target correlations, their probability distributions do not follow the target ones. The xi shouldbe rearranged in ascending order and modified so that its probability distribution follows the target probability distributions.This operation hardly affects the correlations because it does not change the set of parameters.
Table III shows the correlations between generated tropical cyclone parameters by using the proposed modified or-thogonal decomposition. These correlations show good agreement with the intended correlations shown in Table II.The probability distribution functions of generated parameters also show good agreement with the intended ones(Figure 8).
To verify the probability distribution models, the probability distribution of annual maximum gradient wind speed basedon synthetic tropical cyclones is compared with that based on identified tropical cyclones. The gradient wind can be calcu-lated assuming that pressure gradient force balances with centrifugal force and Coriolli’s force:
θG→x; t� � ¼ π � ϕ (17)
uG→x; t� � ¼ C sin θ � ϕð Þ � fr
2þ
ffiffiffiffiffiffiffiffiffiffiffiffiffiffiffiffiffiffiffiffiffiffiffiffiffiffiffiffiffiffiffiffiffiffiffiffiffiffiffiffiffiffiffiffiffiffiffiffiffiffiffiffiffiffiffiffiffiC sin θ � ϕð Þ � fr
2
� �2
þ r
ρ∂p∂r
s(18)
Table III. Correlation coefficients between estimated tropical cyclone parameters.
ln(Δp) ln(Rm) ln(C) θ dmin
ln(Δp) 1.00 �0.36 0.01 �0.03 0.25ln(Rm) �0.36 1.00 0.38 �0.05 �0.27ln(C) 0.01 0.38 1.00 �0.28 �0.25θ �0.03 �0.05 �0.28 1.00 �0.35dmin 0.25 �0.27 �0.25 �0.35 1.00
Figure 8. Comparison of probability density functions of tropical cyclone parameters and observed data.
Extreme wind speed by using Monte Carlo simulation of tropical cyclone T. Ishihara and A. Yamaguchi
Wind Energ. (2014) © 2014 John Wiley & Sons, Ltd.DOI: 10.1002/we

where θG→x; t� �
and uG→x; t� �
are the gradient wind direction and speed, f is the Coriolis parameter, ρ is the air density and θ
is the translation direction of the tropical cyclone.4→x ¼ r;ϕð Þ is the location shown in polar coordinate the origin of whichis at the center of the tropical cyclone.
Figure 9 shows the probability distribution of annual maximum gradient wind speed based on synthetic tropical cyclonesand the identified tropical cyclones at Choshi meteorological station. The distribution based on synthetic tropical cyclonesshows good agreement with that based on the identified ones.
3.3. Estimation of surface wind speed
The horizontal scale of a tropical cyclone is a few hundred kilometers. Meanwhile, the horizontal scale of topography is afew kilometers. In other words, the scale of the topography is so small compared with the scale of the typhoon that we canseparate the effect of the topography from the effect of the tropical cyclone’s pressure field. This concept is represented in
the following equation for wind speed, ut→x; z; t� �
, and the wind direction, θt→x; z; t� �
.
ut→x; z; t� � ¼ uF
→x; z; t� �� St
→x; z� �
(19)
θt→x; z; t� � ¼ θF
→x; z; t� �þ Dt
→x; z� �
(20)
where uF→x; z; t� �
and θF→x; z; t� �
are the surface wind speed and direction caused by the tropical cyclone’s pressure field on
a flat terrain and will be explained later, and St→x� �
and Dt→x� �
are the speedup and the change in wind direction as func-tions of wind direction sector i which can be evaluated by flow simulation as follows.
St x→; z� �
¼ UTi→x; z� �
UFi→x; z� � (21)
Dt→x; z� � ¼ ΘTi
→x; z� �� ΘFi
→x; z� �
(22)
whereUTi x→; zð Þ andΘTi x→; zð Þ are the wind speed and direction over real terrain andUFi x→ð Þ andΘFi x→ð Þ are those over flatterrain estimated by flow simulations. The idea of the proposed method is shown graphically in Figure 10.
The vertical profile of wind speed and the change in wind direction over flat terrain with constant surface roughness isgiven in an exponential form as follows.
uF→x; z; t� � ¼ uG
→x; t� � z
zg
� �αu
(23)
θF→x; z; t� � ¼ θG
→x; t� �þ γs 1:0� 0:4
z
zg
� �1:1
(24)
Figure 9. Probability distribution of annual maximum gradient wind speed based on synthetic tropical cyclones and identified tropicalcyclones at Choshi meteorological station.
Extreme wind speed by using Monte Carlo simulation of tropical cycloneT. Ishihara and A. Yamaguchi
Wind Energ. (2014) © 2014 John Wiley & Sons, Ltd.DOI: 10.1002/we

Here,
αu ¼ 0:27þ 0:09log z0ð Þ þ 0:018log2 z0ð Þ þ 0:0016log3 z0ð Þ (25)
zg ¼ 0:052uG
→x; t� �f λ
logRoλð Þ�1:45 (26)
γs ¼ 69þ 100 ξð Þ logRoλð Þ�1:13 (27)
f λ ¼∂uG
→x; t� �∂r
þ uG→x; t� �r
þ f
!1=2
2uG
→x; t� �r
þ f
!12=
(28)
ξ ¼ 2uG
→x; t� �r
þ f
!1=2,
∂uG→x; t� �∂r
þ uG→x; t� �r
þ f
!12=
(29)
where Roλ ¼ uG→x; t� �
=f λz0� �
is a non-dimensional parameter called modified surface Rossby number, f is the Coriolisparameter and z0 is the surface roughness length. This model is a semi-theoretical formulae showing the relationship amongthe exponent of vertical profile, gradient wind height, change in wind direction, surface roughness length and thecharacteristic of tropical cyclone while having the advantage of exponential form widely used in wind engineering field.
In this study, the wind speed and direction over flat terrain was estimated assuming the exponent αu= 0.1 according toISO4354.13 The wind speed and the direction at the offshore site affected by surrounding terrain were estimated by usingequations (19) and (20) obtained from the flow simulation. Figure 11 shows the speedup at the offshore site relative to theflat terrain for each wind direction. When the wind direction is between 67.5° and 180°, the speedup is almost equal to 1.0as the wind blows from sea. For the other wind directions, the speedup is significantly smaller then 1.0 and strongly affectedby land. This means that near the coastline, the surface roughness is uneven and the effect of topography and surface r-oughness have to be taken into consideration.
The wind speed estimated by MCS has the averaging time of 3 h.14 To estimate the 10min average extreme wind speed,this difference in averaging time has to be considered. Yasui et al.14 showed that the difference of 3 h average wind speedand 10min average wind speed can be modeled as normal distribution and the standard deviation σa of which can bewritten as follows:
σa ¼ 0:1� uT : (30)
The coefficient 0.1 is the value proposed by Yasui et al.14 Yamaguchi et al.15 showed this value changes depending onthe averaging time.
Figure 10. Estimation of surface wind speed.
Extreme wind speed by using Monte Carlo simulation of tropical cyclone T. Ishihara and A. Yamaguchi
Wind Energ. (2014) © 2014 John Wiley & Sons, Ltd.DOI: 10.1002/we

Figure 12 shows the probability distribution of annual maximum wind speed based on Monte Carlo simulation. Theestimated distribution shows good agreement with the measurement. The uncertainty of the estimated probabilitydistribution is calculated as the sum of the uncertainty related to the length of simulation and related to the length of thepressure measurement, as shown in equation (34). Clearly, the uncertainty decreases compared with Figure 5.
Not only 50 year recurrence wind speed, but also the exponent of vertical wind speed profile and turbulence intensity areneeded for the estimation of wind load on wind turbines. In this study, the average wind direction for the wind directionbetween 50 year recurrence wind speed �0.5 and + 0.5m s�1 was calculated and used for the estimation of vertical windspeed profile and the exponent of turbulence intensity. In this site, this wind direction is southerly, and the exponent andthe turbulence intensity are 0.1 and 0.11, respectively.
3.4. Extreme wind speed in mixed climate
The extreme wind speed in mixed climate are estimated considering the extreme wind speed induced by tropical andextratropical cyclones using the method described in Section 2.4. The mixed probability distribution of annualmaximum wind speed based on the distribution estimated by using MCS for tropical cyclone and the distributionestimated by using MCP method for extratropical cyclones is shown in dotted line in Figure 13. The calculationof the uncertainty of the probability distribution is based on equation (36). The mixed probability distribution showsgood agreement with measurement for wide range of recurrence period. After obtaining the mixed distribution, the50 year recurrence wind speed is 48.1m s�1, which is the same as the value for only tropical cyclone case(Figure 12). This indicates that for this site, the tropical cyclone dominates the extreme wind speed with recurrenceperiod of 50 years. As shown in Figure 6, the 50 year recurrence wind speed estimated by MCP method (45.8m s�1)is smaller than the value by proposed method, and it is necessary to use the MCS to estimate the extreme windspeed induced by tropical cyclones.
0.0
0.5
1.0
1.5
2.0
0 45 90 135 180 225 270 315 360
St
Wind direction (degree)
Figure 11. Variation of speed-up ratio of mean wind speed with wind direction.
Figure 12. Probability distribution of annual maximum wind speed estimated by using MCS and measurement data.
Extreme wind speed by using Monte Carlo simulation of tropical cycloneT. Ishihara and A. Yamaguchi
Wind Energ. (2014) © 2014 John Wiley & Sons, Ltd.DOI: 10.1002/we

4. THE UNCERTAINTIES OF EXTREME WIND SPEED
The sources of the uncertainty of the extreme wind speed estimated by MCS are the limited number of annualmaximum wind speed and the limited length of the pressure measurement data used for the estimation of the tropicalcyclone parameters. In this section, the standard deviations of 50 year recurrence wind speeds are investigated toexamine theses uncertainties of extreme wind speed. Formulae to evaluate the extreme wind speed considering theuncertainties are also proposed for both tropical and extratropical cyclones.
4.1. The uncertainties of extreme wind speed related to the number of annual maximumwind speed
According to Gumbel,9 the variance of extrapolated extreme wind speed can be estimated by
σ2u ¼
σ2N
N1þ 0:885 y� γð Þ þ 0:6687 y� γð Þ2h i
(31)
where N is the number of the annual maximum wind speed, σN is the standard deviation of annual maximum wind speedand y is the reduced variate for the recurrence period of interest. This equation shows that the uncertainty of the predictedextreme wind speed increases when the number of annual maximum wind speed decreases or the standard deviation of theannual maximum wind speed increases.
The applicability of this equation is investigated by using 10,000 annual maximum wind speeds obtained fromthe Monte Carlo simulation. The 10,000 annual maximum wind speeds are divided into 10,000/ N subsets, eachhaving N annual maximum wind speeds. On the basis of each subsets, 50 year recurrence wind speeds are calcu-lated. Then, the standard deviation of these 50 year recurrence wind speeds are calculated and plotted against N inFigure 14. In this study, N was taken as 100, 200, 500, 1000 and 2000. Theoretical values of the standard devi-ations of predicted 50 year recurrence wind speed estimated by using equation (29) is also plotted in Figure 14with a dotted line. Both the estimated standard deviation and the theoretical values decreases with the numberof the measurement data (N) and show good agreement with each other. Using this model, the uncertainty of ex-treme wind speed predicted from 10,000 annual maximum wind speed is estimated as 0.3 m s�1 (0.6% of theestimation).
The uncertainty of the estimated extreme wind speed does not only depend on the number of annual maximum windspeed but also the standard deviation (σN) of the original extreme wind speed. This causes the difference of uncertaintyof extreme wind speed induced by extratropical cyclones and the tropical cyclones even for the same recurrence period.For example, the standard deviation of 50 year recurrence wind speed at Choshi meteorological stations is 1.9m s�1
(5.7% of estimation) for extratropical cyclone, whereas it shows the larger value of 5.7m s�1 (12.4% of estimation) fortropical cyclones (Figure 16).
Figure 13. Comparison of predicted and observed extreme winds in mixed climate by the MCS method.
Extreme wind speed by using Monte Carlo simulation of tropical cyclone T. Ishihara and A. Yamaguchi
Wind Energ. (2014) © 2014 John Wiley & Sons, Ltd.DOI: 10.1002/we

4.2. The effect of the pressure measurement period on the uncertainty of the extreme windspeed
In the Monte Carlo simulation, the tropical cyclone parameters are estimated on the basis of the pressure measurement data,which also affects the uncertainty of the extreme wind speed. To evaluate this effect, a relationship between the length ofthe pressure measurement and the 50 year recurrence wind speed is investigated.
The pressure measurement data for 47 years (from 1961 to 2007) are divided into five subsets, each having 10 years ofmeasurement data. On the basis of each subset, tropical cyclone parameters are estimated, and MCS was carried out toestimate the extreme wind speed. The same were carried out by using the subsets each having 20, 30, 40 years.
The standard deviation σp and the coefficient of variation γp(=σp/uT) of the extreme wind speed with recurrence period of50, 100 and 500 years were calculated for different length of the pressure measurement and shown in Figure 15. Thecoefficients of variations do not depend on the recurrence period and decrease as the length of the pressure measurementincreases. In this study, this coefficient of variation was modeled by using following equation.
γp ¼ 0:004exp �0:2 Y � 21ð Þð Þ þ 0:031;Y ≥ 10 (32)
Here, Y denotes the length of pressure measurement. When the pressure measurement period is 10 years, the coefficientof variation is 4.1%. The coefficient of variation decreases as the pressure measurement period becomes longer, and when30 years or more pressure measurement were used, the coefficient of variation approaches to 3.0%. In this case, the value ofσp (1.5m s�1) is larger than the standard deviation σu (0.3m s�1) resulting from the number of annual maximum windspeed (10,000 years), indicating that the former uncertainty is dominant.
It should be noted that the standard deviation of the 50 year recurrence wind speed induced by tropical cyclones esti-mated directly from the measured annual maximum wind speeds for 13 years is 5.7m s�1, which is larger than the value
Figure 14. Comparison of standard deviation of 50 year recurrence wind speed obtained by the MCS method and Gumbel theory.
Figure 15. Relationship between a coefficient of variation of 50 year recurrence wind speed and the length of pressure measurement.
Extreme wind speed by using Monte Carlo simulation of tropical cycloneT. Ishihara and A. Yamaguchi
Wind Energ. (2014) © 2014 John Wiley & Sons, Ltd.DOI: 10.1002/we

estimated by using MCS based on the pressure measurement data for 10 years. Clearly, the use of MCS reduces the uncer-tainty of the extreme wind speed.
Generally, the total uncertainty (σT) of the extreme wind speed estimated by using MCS can be written as,
σT ¼ffiffiffiffiffiffiffiffiffiffiffiffiffiffiffiffiffiffiffiffiffiffiffiffiffiffiffiffiffiffiffiffiffiffiffiffiffiσ2u þ 2βσuσp þ σ2
p
q(33)
where β is the correlation coefficient between two uncertainties and takes the value between 0 and 1. As the most conser-vative case, β is assumed to be 1, and the total standard deviation can be written as
σT ¼ σu þ σp ¼ σu þ γpuT : (34)
Thus, when 47 years of the pressure measurement data was used to estimate the tropical cyclone parameters σp (1.5m s�1)and 10,000 years of MCS was carried out σu (0.3m s�1), the total uncertainty σT can be estimated to be 1.8m s�1. This valueis comparable with the standard deviation of annual maximum wind speed estimated by MCP approach with 50 year recur-rence period for the extratropical cyclones as shown in Figure 16.
4.3. Estimation of extreme wind speed considering the uncertainties
Generally, the design extreme wind speed (uC) considering the uncertainty can be written as
uC ¼ uC þ kσC (35)
where uC is the extreme wind speed without considering the uncertainty, σC is the standard deviation of the predictedextreme wind speed and k is a constant value.
In the estimation of σC, both tropical and extra tropical cyclone has to be considered. In this study, the followingequation is proposed to estimate σC.
σC ¼ ασE þ 1� αð ÞσT (36)
where σE and σT are the standard deviations of the extreme wind speed induced by extratropical and tropical cyclones, respec-tively. The weight factor α shows dominant phenomena for the extreme wind speed and can be calculated by following equation.
α ¼ uC � uTð Þ= uC � uTð Þ þ uC � uEð Þ½ � (37)
When tropical cyclones are dominant, (uC = uT), the weight factor α becomes 0. On the other hand, whenextratropical cyclones are dominant (uC = uE), the weight factor α becomes 1. The weight factor α for differentrecurrence period R is shown in Figure 17. For long recurrence periods, tropical cyclones are dominant, and theweight factor α is close to 0. On the other hand, the extratropical cyclones are dominant for shorter recurrenceperiod, and the weight factor α is close to unity.
Figure 16. Comparison of standard deviation of 50 year recurrence wind speed.
Extreme wind speed by using Monte Carlo simulation of tropical cyclone T. Ishihara and A. Yamaguchi
Wind Energ. (2014) © 2014 John Wiley & Sons, Ltd.DOI: 10.1002/we

Table IV shows the comparison of the extreme wind speeds with 50 year recurrence period estimated with and withoutconsidering the uncertainties. Here, the parameter k is assumed to be 1.0. Without considering the uncertainties, the MCSestimates the extreme wind speed as 48.1m s�1, whereas the estimated extreme wind speed from 13 years of measurementdata by using MCP method is 45.8m s�1. This means that the use of the limited number of the measurement data withoutconsidering the uncertainties may underestimate the extreme wind speeds. If the uncertainties are taken into consideration,the estimated extreme wind speed based on 13 years of measurement data shows 51.5m s�1, which is higher than thatestimated by Monte Carlo simulations (49.9m s�1).
The uncertainty of the extreme wind speed is strongly related with the partial safety factor used in design. Thepartial safety factor in IEC61400-1 is based on the assumption that the uncertainty of the extreme wind speed is10%.16 When MCS is used, the uncertainty of the extreme wind speed is less than 10%, and additional uncertaintydoes not have to be considered. However, if tropical cyclone-induced extreme wind speed is predicted directly byusing the 10 years of wind speed measurement data, without considering additional uncertainty, extreme wind speedmay be underestimated.
5. CONCLUSIONS
The estimation of the extreme wind speed by MCS of tropical cyclones and ‘measure-correlate-predict’ methods wereinvestigated and verified by comparing with the measurement. The uncertainties related to the number of annual maximumwind speeds and the length of the pressure measurement data are quantitatively evaluated, and a method to estimate theextreme wind speed including those uncertainties are proposed. The following results were obtained:
1. Conventional MCP method with Gumbel fitting shows good performance for the estimation of extreme wind speedinduced by extratropical cyclones but shows large uncertainty for the extreme wind speed induced by tropicalcyclone, which implies the possibility of underestimation. In the mixed climate region, extreme wind speed basedon about 10 years of measurement annual maximum wind speed may be underestimated.
2. The proposed MCS of tropical cyclones can accurately estimate the probability distribution of annual maximum windspeed induced by tropical cyclones. This means that MCS method is needed for the estimation of the extreme windspeed in the mixed climate region.
3. When conventional MCP and Gumbel fitting is used, a larger uncertainty is introduced in the estimation of extremewind speed induced by them that induced by tropical cyclones.
Table IV. Fifty-year-recurrence wind speed with and without considering the uncertainties estimated by MCP and MCS methods.
Extreme wind speed MCP MCS
uC (without uncertainties) 45.8ms�1 48.1ms�1
uC (with uncertainties) 51.5ms�1 49.9ms�1
0
0.2
0.4
0.6
0.8
1
-2 -1 0 1 2
Wei
ghte
d fa
ctor
Reduced variate -ln(-ln(F))
Figure 17. The weighting factor as a function of recurrence period.
Extreme wind speed by using Monte Carlo simulation of tropical cycloneT. Ishihara and A. Yamaguchi
Wind Energ. (2014) © 2014 John Wiley & Sons, Ltd.DOI: 10.1002/we

4. The uncertainty of the MCS is dominated by the limited period of the pressure measurement for the estimation oftropical cyclone parameters. The total uncertainty in the estimation of extreme wind speed by MCS is comparablewith the MCP and Gumbel fitting for extratropical cyclones.
ACKNOWLEDGEMENT
This research was carried out as a part of ‘Development of offshore wind power generation system’ funded by New Energyand Industrial Development Organization (NEDO).
REFERENCES
1. IEC 61400–1. wind turbines—part 1: design requirements. Ed. 3, 2005.2. Gomes L, Vickery BJ. Extreme wind speeds in mixed climates. Journal of Wind Engineering & Industrial Aerodynam-
ics 1978; 2: 331–334.3. Cook NJ, Ian Harris R, Whiting R. Extreme wind speeds in mixed climates revisited. Journal of Wind Engineering &
Industrial Aerodynamics 2003; 91: 403–422.4. Georgiou PN, Davenport AG, Vickery BJ. Design wind speeds in regions dominated by tropical cyclones. Journal of
Wind Engineering & Industrial Aerodynamics 1983; 13: 139–152.5. Architectural Institute of Japan. AIJ recommendations for loads on buildings. 2004.6. ASCE 7–98. Minimum design loads for buildings and other structures. Revision of ANSI/ASCE 7–95, 2000.7. Ishihara T, Hibi K. Numerical study of turbulent wake flow behind a three-dimensional steep hill. Wind and Structures
2002; 5(2-4): 317–328.8. Ishihara T, Yamaguchi A, Fujino Y. A nonlinear model for predictions of turbulent flow over steep terrain. Proc. of The
World Wind Energy Conference and Exhibition, VB3.4, 2002; 1–4.9. Gumbel EJ. Statistics of Extremes. Columbia University Press: New York, 1958.10. Ishihara T, Siang KK, Leong CC, Fujino Y. Wind field model and mixed probability distribution function for typhoon
simulation. The Sixth Asia-Pacific Conference on Wind Engineering, 2005; 412–426.11. Schloemer RW. Analysis and synthesis of hurricane wind patterns over, Lake Okeechobee, Florida.
Hydrometeorogical Report, No.31, 1954.12. Vickery PJ, Twisdale LA. Prediction of hurricane wind speeds in the United States. Journal of Structural Engineering,
ASCE 1955; 121: 1691–1699.13. ISO4354. Wind actions on structures, 1997.14. Yasui H, Ohkuma T, Marukawa H, Katagiri J. Study on evaluation time in typhoon simulation based on Monte Carlo
method. Journal of Wind Engineering & Industrial Aerodynamics 2002; 90: 1529–1540.15. Yamaguchi A, Solomon MB, Ishihara T. An effect of the averaging time on maximum mean wind speeds during
tropical cyclone. EWEA2012, 2012.16. Tarp-Johansen NJ, Madsen PH, Frandsen ST. Partial safety factors for example load effects in wind turbines. Risø
report, R-1319 (EN), 2002.
Extreme wind speed by using Monte Carlo simulation of tropical cyclone T. Ishihara and A. Yamaguchi
Wind Energ. (2014) © 2014 John Wiley & Sons, Ltd.DOI: 10.1002/we