prediction virus by support vector machine (svm)
TRANSCRIPT

I
PREDICTION VIRUS BY SUPPORT VECTOR MACHINE (SVM)
MOHAMAD IMRAN BIN MOHD AYOB
BACHELOR OF COMPUTER SCIENCE
(COMPUTER NETWORK SECURITY) WITH HONORS
FACULTY OF INFORMATICS AND COMPUTING
UNIVERSITI SULTAN ZAINAL ABIDIN, TERENGGANU, MALAYSIA
2019

II
DECLARATION
I hereby declare that this report is based on my original work except for quotations and
citation, which have been duly acknowledged. I also declare that it has been previously
or concurrently submitted for any other degree at Universiti Sultan Zainal Abidin or
other institutions.
Signature :
Name : Mohamad Imran Bin Mohd Ayob
Date :
III
CONFIRMATION
This is to confirm that the research conducted and the writing of this report was under
my supervisor.
Signature :
Name :
Date :

IV
ACKNOWLEDGEMENT
In the name of Allah, the Most Merciful, the Most Compassionate all praise is
to Allah, and prayers and peace be upon Mohamed His servant and messenger. Praise
to Allah, for blessing and giving me the opportunity to undergo and complete my
proposal for final year project title, Predicting the Virus by Support Vector Machines
(SVM).
I am grateful to some people, who worked so hard with me from the beginning
until the completion of this project. Here, I would like to express my heartiest
gratitude to my supervisor, PM. Dr. Mohd Fadzil Bin Abdul Kadir for his outstanding
teachings, passion, unbelievable patience, and excellent ideas toward this project.
Without his generosity, it is impossible for me to finish this project efficiently. I
would like to take this opportunity to say warm thanks to my family members, who
has been my source of inspiration and game me strength when I thought of giving up,
who always been there in my hard and easy time, may Allah protect and blesses them.
Lastly, thank you to all my beloved friends, who have been so supportive along the
way of doing my project and to all my lectures who taught me throughout my
education from Semester 1 until graduated.

V
VI
ABSTRACT
Virus detection is an important factor in the security of the computer systems.
However, the currently utilized signature-based methods cannot provide accurate
detection for the polymorphic viruses as it does not contain the signature of the virus to
solve it for the anti-virus as it depended completely on the data from it database to
recognise the evolving virus. That is why the need for machine learning-based detection
arises.
The purpose of this work was to determine the best feature extraction, feature
representation, and classification methods that result in the best accuracy when used on
the top of Support Vector Machines classifiers that were evaluated and this simulation
was done by doing it in Weka tools.
This work presents recommended methods for machine learning to do the
classification and detection, as well as the guidelines for its implementation. Moreover,
the study performed can be useful as a base for further research in the field of virus
analysis with machine learning methods.
VII
ABSTRAK
Pengesanan virus merupakan faktor penting dalam keselamatan sistem
komputer. Walau bagaimanapun, pada masa ini kaedah berasaskan tandatangan yang
digunakan tidak dapat memberikan pengesanan yang tepat untuk virus polimorfik
kerana ia tidak mengandungi tanda tangan virus untuk menyelesaikannya untuk anti-
virus kerana ia bergantung sepenuhnya kepada data dari pangkalan data untuk mengenal
virus yang berkembang. Itulah sebabnya keperluan untuk pengesanan berasaskan
pembelajaran mesin timbul.
Tujuan kerja ini adalah untuk menentukan ciri-ciri pengekstrakan ciri,
perwakilan ciri, dan kaedah klasifikasi terbaik yang menghasilkan ketepatan terbaik
apabila digunakan di bahagian atas pengeluar Mesin Sokongan Vektor yang dinilai dan
simulasi ini dilakukan dengan melakukannya di alat Weka.
Kerja ini membentangkan kaedah yang disyorkan untuk pembelajaran mesin
untuk melakukan klasifikasi dan pengesanan, serta garis panduan untuk
pelaksanaannya. Selain itu, kajian yang dilakukan boleh menjadi berguna sebagai asas
untuk penyelidikan lanjut dalam bidang analisis virus dengan kaedah pembelajaran
mesin.
VIII
TABLE OF CONTENTS
CONTENTS PAGE
DECLARATION ………………………………………………………...II
CONFIRMATION ………………………………………………………III
ACKNOWLEDGEMENT ……………………………………………...IV
ABSTRACT………………………………………………………………V
ABSTRAK……………………………………………………………….VI
TABLE OF CONTENTS. ………………………………………………VII
LIST OF TABLES ………………………………………………………IX
LIST OF FIGURES……………………………………………………….X
CHAPTER 1
1.1 Introduction……………………………………………………………..1
1.2 Problem Statement……………………………………………………...3
1.3 Objectives………………………………………………………………..3
1.4 Scopes…………………………………………………………………....4
1.5 Limitation of Works…………………………………………………….4
1.6 Summary………………………………………………………………...5
CHAPTER 2
2.1 INTRODUCTION………………………………………………………6

IX
2.2 Related Work……………………………………………………………7
2.3 Summary………………………………………………………………..9
CHAPTER 3
3.1 Introduction……………………………………………………………..10
3.1.1 Machine Learning Basics…………………………………………….10
3.1.2 Supervised and Unsupervised Learning…………………………….11
3.2 Research of Methodology………………………………………………14
3.2.1 Cross-Validation……………………………………………………...14
3.2.2 Confusion Matrix and Accuracy Rate……………………………...16
3.2.2 Receiver Operating Characteristic………………………………….17
3.3 Simulation………………………………………………………………19
3.4 Project Framework…………………………………………………….21
3.5 Project Flowchart……………………………………………………...22
3.5 Summary……………………………………………………………….23
CHAPTER 4
4.1 Introduction…………………………………………………………...24
4.2 Dataset Used………………………………………………………….25
4.3 Data Mining Techniques…………………………………………….26
4.3.1. Explorer Interface………………………………………………...26
4.3.2. Naïve Bayes………………………………………………………..27
X
4.3.3. SMO (Linear Kernel) ………………………………………….28
4.3.4. LibSVM (Linear Kernel) ……………………………………...29
4.3.5. J48……………………………………………………………….30
4.3.6. SMO (RBF Kernel) …………………………………………….30
4.3.7. LibSVM (RBF Kernel) ………………………………………...31
4.4 Results and Discussion…………………………………………….32
CHAPTER 5
5.1 Conclusion and Future Work…………………………………….33-34
REFERENCES………………………………………………………..35-38

XI
LIST OF TABLES
Table 1: Confusion Matrix…………………………………………………15
Table 2: Description of datasets attributes………………………………...26
Table 3: Explorer result…………………………………………………….32

XII
LIST OF FIGURES
FIGURE 1 Infrastructure Based Network .........................................................18
FIGURE 2 Infrastructure Less Network ...........................................................21
FIGURE 3 Project Flowchart…………………………………………………...22
FIGURE 4 Screenshot view of Virus Dataset………………………………….25
FIGURE 5 Screenshot view of CSV Virus Dataset File open in……………...27
Explorer Interface
FIGURE 6 Screenshot view for Naïve Bayes Classifier………………………28
FIGURE 7 Screenshot view of SMO Classifier using Linear Kernel……….29
FIGURE 8 Screenshot view of LibSVM Classifier using Linear Kernel…...29
FIGURE 9 Screenshot view of J48 Classifier………………………………...30
FIGURE 10 Screenshot view of SMO Classifier using RBF Kernel………..31
FIGURE 11 Screenshot view of LibSVM Classifier using RBF Kernel……31

XIII

XIV

1
CHAPTER 1
1.1 Introduction
The term “Virus” brings many definitions from it. Virus can be either in science
or the medical. But, in computer science, Virus is one of the malwares that has the
ability to replicate itself during infection into any application software or a document.
Viruses can do harmful functions on a user machine as it can make destruction to the
whole system. Viruses today has affected a vast number of computers in locations
throughout the world due to a large surge in the last decade. In solving this problem,
user needs different solution like predicting of virus to manage the problem. This step
required a through step of study and analysis of the pattern virus that depends on many
parameters such as the detection approach, the machine learning and the classification
methods. The short term of virus prediction was obtained from a run time traces. Thus,
this theory presents a simulation to predict the virus that can used to enhance the
efficiency of the performance and to test the effectiveness of the detection system.

2
This happen because of the anti-virus scanners cannot fulfill the needs of
protection within the virus that keep evolve over time as the virus characteristic that
also polymorphic resulting in millions of hosts being attacked. According to Kaspersky
Labs (2016), 6 563 145 different hosts were attacked, and 4 000 000 unique malware
objects were detected in 2015. In turn, Juniper Research (2016) predicts the cost of data
breaches to increase to $2.1 trillion globally by 2019. There are a few attempts on
applying data mining and machine learning techniques to detect new malicious
executables [8, 17]. The performance of these techniques critically depends on the set
of features used to describe the executables and the classifier [1].
Data mining is the process of extracting useful information and knowledge from
the incomplete, noisy and inconsistent raw data. Data mining extracts information from
large dataset and converts it to an understandable form. Data mining is a part of
knowledge discovery process. Classification is a form of data analysis that extracts
model describing important data classes. Those models are called classifiers; predict
categorical class labels. For example, a classification model can be built to categorize
bank loan applications as either safe or risky [2].
The remaining of this paper is organized as follows. Section 2 gives a brief note
about the related works. Section 3 presents and discusses our research methodology
followed by the description of the Support Vector Machine (SVM) and Weka tools that
have used in our experiments as well as the experimental setup. In Section 4, the
evaluation of results along with the performance analysis is presented. Finally, in
Section 5 our conclusions are presented followed by the references.

3
1.2 Problem Statement
User cannot predict the safety of the system as the virus sometimes cannot be
detected with some approach. The anti-virus that run based on depend signature that
locate in the database might not detect some of the virus that polymorphic in shape.
Also, there were no accurate result as the area of detection might not cover some
coverage. Then, user also does not know how far can the usability of the system can be
used as different test will give some different value.
1.3 Objectives
The goal of the thesis is to solve the problem statement by proposed Support Vector
Machine in Weka. So, this project focus on following objectives that is:
i. To study how prediction of virus occur by using Support Vector Machine
(SVM) while testing the virus.
ii. To apply the Support Vector Machine (SVM) predicting of virus in order to
easily trace the virus.
iii. To test the effectiveness and the capabilities of the system in achieved the
user requirement.

4
1.4 Scopes
This project is about to study how Support Vector Machine (SVM) predict the
virus more efficiently. Then, to apply the SVM in order to collect the data about the
virus and thus review the result obtained from it. Next, to improve the prediction of
virus as to make it give us better result from it.
1.5 Limitation of Works
There are some limitations during the research:
i. Long training time does by SVM as the larger the dataset.
ii. Require feature scaling that one must do the feature scaling of variables before
applying the SVM.
iii. Extensive memory requirement as algorithm complexity and memory
requirements of SVM were very high. Lot of memory needed since need to store
all support vector in memory and the number grew largely with the training
dataset time.
iv. Choosing an appropriate Kernel function was difficult as it could be tricky and
complex. In case of high dimension Kernel, it might generate too many support
vectors that reduce training time drastically.

5
1.6 Summary
We can conclude that virus is one of the harmful malwares that can bring threat
to the system of the computer. In order to prevent the computer virus become worse,
there the prediction of virus using one of the machine language that is Support Vector
Machine (SVM) occurred. The prediction will help us to give better understanding
about the risk associated within virus as the classification SVM make it more easy to
predict the virus.
6
CHAPTER 2
LITERATURE REVIEW
2.1 Introduction
Literature review have shown that the Support Vector Machine (SVM)
classification algorithm, proves its potential for structure-activity relationship analysis;
R . Burbidge et. al. . [3]The basic idea of this method is the prediction of data by
stimulate it with infected data (contain virus).The way to perform these test were by
analyzed the result plus understanding the mathematical carefully as quadratic
programming can be expensive for large number but sequential minimal

7
optimization(SMO)is a fast, efficient algorithm for train SVM [5] plus it is the one
implement in Weka. [4,9]
Even many various techniques have been used in literature survey, there still
issues that need to solve such as the learning phase of SVM scale with the number of
training data points. [5]
2.2 Related Work
The performance analysis of virus prediction is proposed to this project in
order to determine the performance value and to find the best result that the Support
Vector Machine (SVM) can provided when used it.
R. Burbidge et. al., [3] have shown that the support vector machine (SVM)
classification algorithm, proves its potential for structure–activity relationship analysis.
In a benchmark test, they compared SVM with various machine learning techniques
currently used in this field. The classification task involves in predicting the inhibition
of dihydrofolate reductase by pyrimidines, using the data obtained from the UCI
machine learning repository. Among three tested artificial neural networks, they found
that SVM is significantly better than all of these.

8
Shutao Li et. al., [6] have applied SVMs by taking DWFT as input for
classifying texture, using translation-invariant texture features. They used a fusion
scheme based on simple voting among multiple SVMs, each with a different setting of
the kernel parameter, to alleviate the problem of selecting a proper value for the kernel
parameter in SVM training and perform the experiments on a subset of natural textures
from the Brodatz album. They claim that, as compared to the traditional Bayes classier
and LVQ, SVMs, in general, produced more accurate classification results.
In this paper, by Emmanuel Gbenga Dada, Joseph Stephen Bassi, Yakubu
Joseph Hurcha and Abdulkadir Hamidu Alkali (2019) [7], This paper presents a
comparative study of malware detection using fifteen different Machine Learning
algorithms. Network were used in the study and their statistical results presented. From
the experimental results obtained from running the various classification using 10-fold
cross-validation and 66% split test, it has been demonstrated that some unpopular
algorithms perform relatively well on the ClaMP dataset 36 on WEKA.
In this research written by E.Venkatesh, G.Srinivasulu (2014) [9], it show the
utilization of SVM as a method of distinctive malware. It shows that malware, that's
packed encrypted, will be detected exploitation SVMs and by exploitation the opcodes
chosen by the SVM as a benchmark, known a prefilter stage exploitation eigenvectors
that may cut back the feature set and so cut back the coaching effort.
A training method to increase the efficiency of SVM has been presented by
Yiqiang Zhan [11] for fast classification without system degradation. Experimental
9
results on real prostate ultrasound images show good performance of their training
method in discriminating the prostate tissues from other tissues and they claim that their
proposed training method is able to generate more efficient SVMs with better
classification abilities.
From Fabien Lauer et. al.[13] research, have proposed different formulations of
the optimization problem along with support vector machines (SVMs) for classification
task. They have exposed the utility of concerns on the incorporation of prior knowledge
into SVMs in their review of the literature. The methods are classified with respect to
the categorization into three categories depending on the implementation approach via
samples, in the kernel or in the problem formulation. They considered two main types
of prior knowledge that can be included by these methods like class invariance and
knowledge on the data.
2.3 Summary
This chapter tells us about the research that relate to the performance of
Support Vector Machine (SVM) through the different parameters that were
implemented in Weka. This study is essential in order to obtain general idea about the
SVM and it can be a reference in creating an efficient and successful project.

10
CHAPTER 3
METHODOLOGY
3.1 Introduction
The research methodology is essential to ensure the research objectives can be
achieved. This chapter will explain in detail regarding the methods used during
conducting this project. First, the overview of the machine learning field is discussed,
followed by the description of methods used in this study that is Support Vector
Machine (SVM).

11
3.1.1 Machine Learning Basics
The data mining techniques and methods that have rising and improve in
development days by days resulted in machine learning forming a separate field in the
Computer Science. It can be viewed under the subclass of the Artificial Intelligence
field, where the main idea is the ability of a system that is computer program or
algorithm to learn by its own actions. It was referred to as the "field of study that gives
computers the ability to learn without being explicitly programmed" by Arthur Samuel
in 1959. A more formal definition is given by T. Mitchell: "A computer program is said
to learn from experience E with respect to some class of tasks T and performance
measure P if its performance at tasks in T, as measured by P, improves with experience
E." (Mitchell 1997).
The basic idea is that any machine learning task is to train the model, based on
some algorithm and to perform some certain task that is classification, clusterization
and regression. Training is done based on the input dataset, and the model that is built
is usually used to make the predictions.
3.1.2 Supervised and Unsupervised Learning
The machine learning concepts were discussed from the point of view, where
the initial data, on which the model can be trained. Here, two machine learning
approaches were introduced that is supervised and unsupervised learning.

12
In Supervised Learning, it is based on the labelled data. In this case, we have an
initial dataset, where data samples are mapped to the correct outcome. The virus
behaviour case is an example of supervised learning: here we have an initial dataset
with virus, its attributes, and its behaviour. The model train on the dataset, where it
”knows” the correct results. Examples of supervised learning are regression and
classification problems:
1. Regression
Predict the value based on previous observations, for examples the values of
samples from the training set. It can be said that if the output is a real number or
in continuous, then it is a regression problem.
2. Classification
Based on the labelled dataset, where each label defines a class where the sample
belongs to and to predict the class for the previously unknown sample. The set of
possible outputs is finite and usually small in numbers. Generally, it can be said
that if the output is a discrete or categorical variable, then it is a classification
problem.
13
In Unsupervised Learning, compare to Supervised Learning, there is no initial labelling
of data. The goal is to find some pattern in the set of unsorted data, instead of predicting
some value. A common subclass of Unsupervised Learning is Clustering:
3. Clustering
To find the hidden patterns in the unlabelled data and separate it into clusters
according to similarity. The discovery of different customer groups inside the
customer base of the online shop is example of it.

14
3.2 Research of Methodology
In research methodology, the preparation of the project is relevant to
develop the project. Some of the methodology phase are usable. The phases are shown
in figure 3.1 below. The first phase is about identifying the problems regarding the
area. For this project, the problems in detecting virus are defined. The problem
statement is defined on the basis of the related research paper or literature review in
order to gain a better understanding of how prediction occurs and the issues that rise in
learning how methods works in solving the prediction problems. The second phase is
designed and developed which tell about this project’s overall development. This
process describes the correct and relevant approaches used to solve the problems.
Classification method was used for this project. Next phase is project simulation. The
simulation to be used in the project will be addressed in this phase. The Weka tools is
the simulation used for this project. And the final phase is the performance evaluation.
Performance metrics must be evaluated and analysed for this project. The performance
metrics to be analysed are based on the Cross-Validation Analysis, Confusion Matrix
and Accuracy Rate where the accuracy rate gives the measure for classification
performance and Receiver Operating Characteristic (ROC) curve for more detailed
analysis.

15
3.2.1 Cross-Validation
Cross-Validation was used in analysing the classification performance [10]. It helps in
estimating generalization error based on “resampling”. The resulting produced is based
on generalization the smallest estimated generalization error was chosen[10].
In the “leave-one-out” method one item from the training data set is left out
and the learning algorithm is trained on the rest of the items. The trained model
is then used to predict the label of the one left out earlier. This process is repeated
for each item of the training set by leaving it out and predicting its label from the
trained model prepared from the rest of the items in the training set. It was shown
that although this method of cross-validation works well for estimating generalization
error for continuous error functions such as the mean squared error, it performs poorly
for discontinuous error functions such as the number of misclassified cases [12]. Thus,
a k-fold cross-validation was preferred where the training data set is broken into k
sets of data, each of size n/k, where n is the size of the training data set. The learning
algorithm is trained on k −1 set and tested against 1. This process is repeated k times
after which the mean accuracy is calculated. A small value of k makes the
analyses more pessimistic and this helps in selecting the best model [12]. Choosing
too small a value for k, for instance, 3-fold is shown to result in wastage of data
and more expensive [10]. Thus, a value of 10 for k was chosen for estimating the
generalization error.

16
Table 1: Confusion Matrix
3.2.2 Confusion Matrix and Accuracy Rate
A Confusion Matrix is a 2-dimensional matrix which represents the actual and
predicted classifications done by a classifier [14]. The performance of a model is
evaluated based on the data in the confusion matrix. The structure of a confusion matrix
for a two class classifier is represented in Table 1. This is a confusion matrix, with true
positive, false positive, true negative, and false negative.
• True Positive (TP) is the number of correct predictions that an instance is positive.
• False Negative (FN) is the number of incorrect predictions that an instance is negative.
• False Positive (FP) is the number of incorrect predictions that an instance is positive.
• True Negative (TN) is the number of correct predictions that an instance is negative.
Some of the common performance metrics that can be calculated using a confusion
matrix were [14]:
• The accuracy (AC) is the proportion of the total number of predictions that were
correct. It is determined using the equation:
17
• The precision (P) is the proportion of positive instances that were correctly
classified. It is given by the equation,
All above performance metrics were calculated for both Linear and RBF Kernel
Methods on all training sets. They were calculated from independently prepared test
sets and from the cross-validation test.
3.2.3 Receiver Operating Characteristic
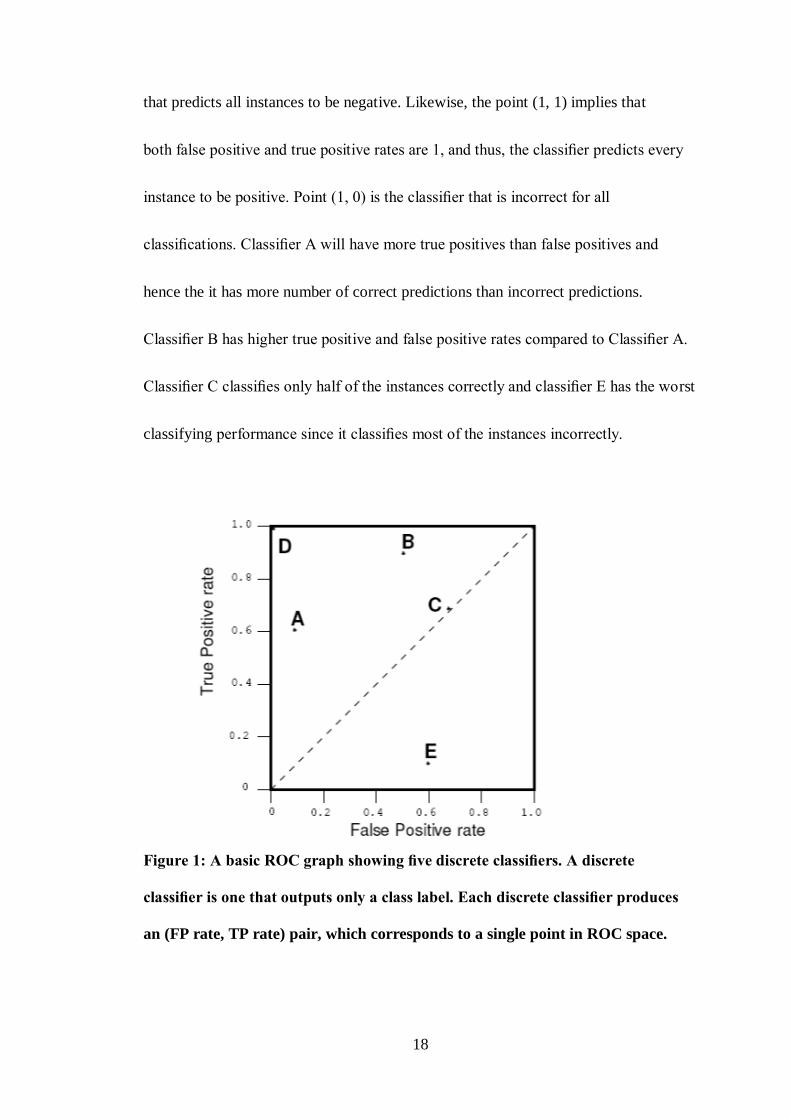
Receiver operating characteristic (ROC) analysis is being used to evaluate the
performance of classifiers [15]. A ROC graph is a plot with the false positive rate along
the X axis and the true positive rate along the Y axis. It helps in visualizing relative
trade-offs between benefits (true positives) and costs (false positives). Figure 1
shows a ROC graph with five classifiers labelled A through E. Now, we discuss this
basic ROC graph shown in Figure 1. In the graph, the point (0, 1) is the perfect
classifier, it classifies all positive and negative instances correctly. D’s performance is
perfect as shown in the figure. The point (0, 0) implies that both the false positive
and true positive rates are 0, which means that the classifier gives out neither false
positive error nor does it give out any true positives. Thus, it represents a classifier
18
that predicts all instances to be negative. Likewise, the point (1, 1) implies that
both false positive and true positive rates are 1, and thus, the classifier predicts every
instance to be positive. Point (1, 0) is the classifier that is incorrect for all
classifications. Classifier A will have more true positives than false positives and
hence the it has more number of correct predictions than incorrect predictions.
Classifier B has higher true positive and false positive rates compared to Classifier A.
Classifier C classifies only half of the instances correctly and classifier E has the worst
classifying performance since it classifies most of the instances incorrectly.
Figure 1: A basic ROC graph showing five discrete classifiers. A discrete
classifier is one that outputs only a class label. Each discrete classifier produces
an (FP rate, TP rate) pair, which corresponds to a single point in ROC space.
19
3.3 Simulation
The project experiment has been conducted by using a simulation network
because in real-life environment required a lot of patient and time consumed. Weka is
a collection of machine learning algorithms for data mining tasks [16]. It implements
John Platt’s sequential minimal optimization algorithm for training a support vector
classifier [18]. This SVM implementation of Weka was used in this study. Both the
positive and the negative instances from the training sets were used to train the SVM.
Linear and RBF Kernel functions were used to create a hyperplane for classification in
this study [20]. Simple linear SVM was used since it was the fastest to learn
and it is known to provide good generalization accuracy [19]. RBF was the second
fastest algorithm to learn and it was used to observe benefits, if any, like the difference
in accuracies between the two. Using the Weka command prompt, the following
command was used for training the SVM with linear function:
java weka.classifiers.functions.SMO -C 1.25 -L 0.0015 -N 1 -t testOneWithID.arff -T
testTwoID.arff -p 1
where,

20
-C is the complexity constant whose default value is 1.0
-L is the tolerance parameter whose default value is 0.0010
-N is option to specify whether to 0=normalize/1=standardize/2=neither, default
value is 0=normalize
-V is the number of folds for the internal cross-validation
-K is the kernel to use
-T is used to set the training file i.e. testOneWithID.arff
-t is used to set the test file i.e. testTwoID.arff
-p is used to output only the predictions for test instances, this helps in tracking the
test instances.
For training the SVM with the RBF Kernel, the following command was used:
java weka.classifiers.functions.SMO -C 1.25 -L 0.0015 -N 1 -K
“weka.classifiers.functions.supportVector.RBFKernel -C 250007 -E 1.0” -t
testOneWithID.arff -T testTwoID.arff -p 1
here,
-C which is used in -K is used to set the cache size
-E which is also used in -K is used to set the exponent

21
3.4 Project Framework
Figure 2: Framework of Virus Analysis
Weka
Classifier Selected and
Used
Virus Analysis
Performance
Analysis
Confusion
Matrix
ROC Analysis
Accuracy Rate
22
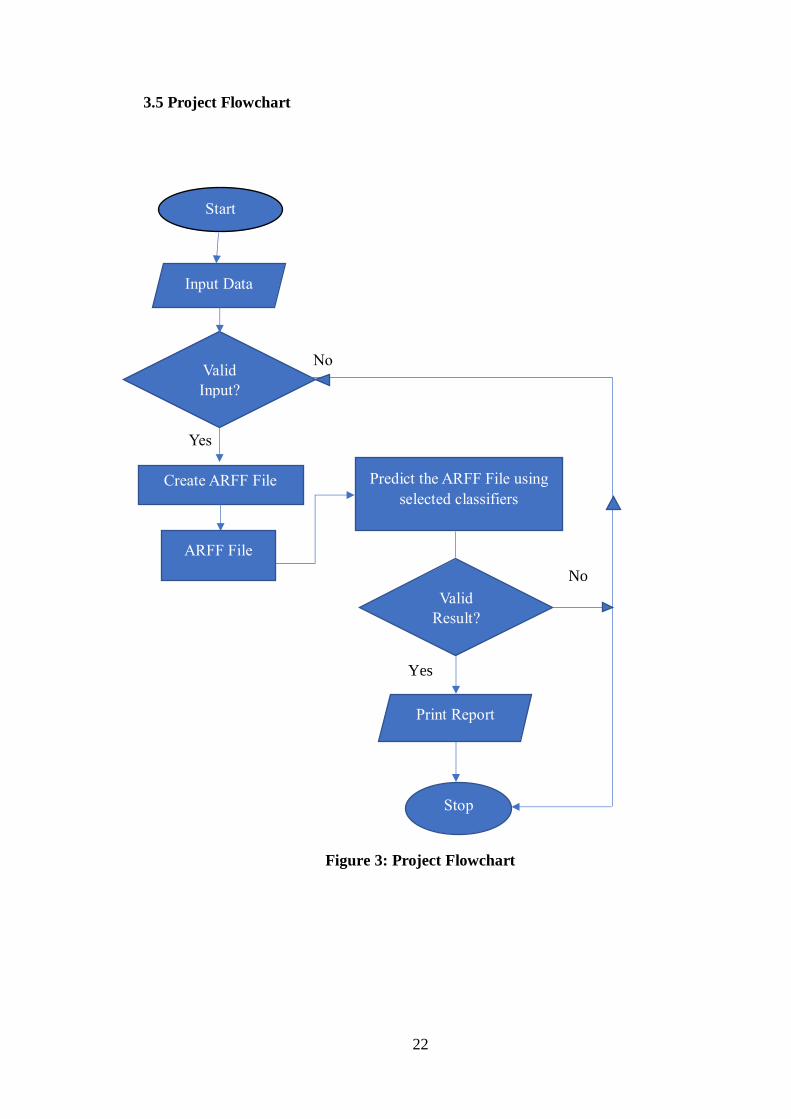
3.5 Project Flowchart
No
Yes
Figure 3: Project Flowchart
Stop
Input Data
Valid
Input?
Create ARFF File
ARFF File
Predict the ARFF File using
selected classifiers
Print Report
Yes
No
Start
Valid
Result?

23
3.6 Summary
The following chapter proofs for the concept of the research methodology,
framework, and flowchart of the project. It provides a better understanding for the
implementation of the simulator that we selected in this project.
24
CHAPTER 4
IMPLEMENTATION AND RESULT
4.1 Introduction
This chapter will cover the implementation and the result of the prediction virus
by Support Vector Machine (SVM) using the Weka to ensure that the prediction
according to the main objectives and achieve user requirement.

25
4.2 Dataset Used
Dataset is a collection of data or a single statistical data where every attribute of data
represents variable and each instance has its own description. For prediction of virus we
are using the behaviour of virus data set for prediction and classification of algorithms
in order to compare their accuracy using Weka interfaces that is Explorer. Explorer is
used in areas to represent, utilize and learn the statistical knowledge and significant
results have been achieved. Figure 4 shows a description of virus dataset. The dataset
contains 7 attributes and 228 instances for the computer virus prediction.
Fig.4. Screenshot view of Virus Dataset

26
Table 2 describes the attributes of data set which are presented in Figure 4 .The file
format of datasets used is Comma Separated Value CSV. Each attribute shows how the
virus behave if present on a hardware likes computer.
Table 2. Description of datasets attributes
Attribute Description
Speed Fast, slow
Content Exist, missing
Accessibility Yes, no
Display Normal, strange
Function Yes, no
Name Constant, change
4.3 Data Mining Techniques
The data mining technique have been used by us to predict the virus. Predictions have
been done by us using Weka data mining tool for classification and accuracy by
applying different algorithms approaches. The interfaces of Weka used in this paper are
the following:
4.3.1. Explorer Interface
It first pre-processes the data and then filters the data. Users can then load the data file
in CSV (Comma Separated Value) format and then analyse the classification accuracy
result by selecting the following algorithms using 10 cross validation for the Naïve

27
Bayes, SMO, LibSVM and J48. Different kernel was also used for each simulation and
it is very important as it give us a different result based from it. Figure 5 shows the
interface of explorer when using virus dataset is opened using CSV file along with its
graphical view.
Fig. 5. Screenshot view of CSV Virus Dataset File open in Explorer Interface
4.3.2. Naïve Bayes
Naïve Bayes is one of the algorithms that works as a probabilistic classifier of all
attributes contained in data sample individually and then classifies data problems.
Running the algorithms using Naïve Bayes we analyse the classifier output with so
many statistics-based output by using 10 cross validation to make a prediction of each
instance of the dataset. After running the algorithm as shown as Figure 6, we achieved
a classification accuracy of 87.6923% correctly classified 228 instances, error rates
achieved that is Mean Absolute Error is 0.249, time taken for building model is 0

28
seconds and ROC area is 0.945 and these outputs are obtained after these algorithms
are run.
Fig. 6. Screenshot view for Naïve Bayes Classifier
4.3.3. SMO (Linear Kernel)
SMO is one of the methods used for classification. In this paper we have used this
algorithm to split the data on the basis of dataset. The classifier output with different
statistics based on output by using 10 cross validation to make a prediction of each
instances of dataset. Figure 7 shows the classification accuracy 97.6923%, error rates
that is mean absolute error obtained is 0.0231, time taken to build model is 0.02 seconds
and ROC area is 0.979 that is obtained after running the algorithms.

29
Fig. 7. Screenshot view of SMO Classifier using Linear Kernel
4.3.4. LibSVM (Linear Kernel)
LIbSVM also one of the algorithms used by us in Explorer interface for the
classification. From Figure 8 we can deduce that classification accuracy achieved gives
97.6923% correctly classified accuracy that is 254 instances, error rates that is mean
absolute error is 0.0231, time taken to build model is 0 seconds, and ROC area is 0.979.
Fig. 8. Screenshot view of LibSVM Classifier using Linear Kernel

30
4.3.5. J48
J48 Tree decides the target value based on various attributes of dataset to predict
machine learning model and classify their accuracy on the basis of dengue disease
dataset. In figure 9 classification accuracy achieved shows that 97.6923% are correctly
classified accuracy out of 254 instances, error rates that is mean absolute error is 0.046,
time taken to build model is 0.01 seconds and ROC area is 0.961 are mentioned in
output.
Fig. 9. Screenshot view of J48 Classifier
4.3.6. SMO (RBF Kernel)
Based on figure 10, we can deduce that classification accuracy achieved gives
85.7692% correctly classified accuracy out of 223 instances, error rates that is mean
absolute error is 0.1423, time taken to build model is 0.06 seconds, and ROC area is
0.871.

31
Fig. 10. Screenshot view of SMO Classifier using RBF Kernel
4.3.7. LibSVM (RBF Kernel)
In figure 11, we can deduce that classification accuracy achieved gives 97.6923%
correctly classified accuracy out of 254 instances, error rates that is mean absolute error
is 0.0231, time taken to build model is 0.01 seconds, and ROC area is 0.979.
Fig. 11. Screenshot view of LibSVM Classifier using RBF Kernel

32
4.4 Results and Discussion
Explorer is one of the data mining techniques that have been used by us using different
algorithms such as Naïve Bayes, J48, SMO and LiBSVM. Through these techniques we
trained out results on the basis of time taken to build model, correctly classified
instances, error and ROC area. Algorithm scoring accuracy is shown in Table 3.
LibSVM and J48 classified 97 % correctly instances accuracy with minimum LibSVM
Mean Absolute Error = 0.0231 and J48 Mean Absolute Error J48=0.046, having
maximum LibSVM ROC =0.979 and J48 ROC Area = 0.961 and time taken to build
model=0 seconds for LibSVM. From Explorer Interface data mining technique also we
can deduce that LibSVM and J48 have maximum accuracy, least error and it takes less
time to build model it and has maximum ROC.
Algorithm Time
Taken to
Build
Model
(seconds)
Correctly
Classified
Instances
%Accuracy
Incorrectly
Classified
Instances
%Accuracy
Mean
Absolute
Error
ROC
Area
Naïve Bayes 0 87.6923(87) 12.3077(12) 0.249 0.945
J48 0.01 97.6923(97) 2.3077(2) 0.046 0.961
SMO(Linear Kernel) 0.02 97.6923(97) 2.3077(2) 0.0231 0.979
SMO (RBF Kernel) 0.06 85.7692(85) 14.2308(14) 0.1423 0.871
LibSVM (Linear) 0 97.6923(97) 2.3077(2) 0.0231 0.979
LiBSVM(RBF
Kernel)
0.01 97.6923 2.3077 0.0231 0.979
Table 3. Explorer result

33
CHAPTER 5
CONCLUSION
5.1 Conclusion and Future Work
Different algorithm and different kernel can bring different result that can affected in
term of performance for the virus prediction. The dataset must be train and test regularly
with the other algorithms in order to bring the data to its fullest potential.
The main aim of this paper is to predict computer virus using WEKA data mining tool
that has four interfaces and the interface used is the Explorer. Each interface has its own
classifier algorithms. Four algorithms used for the experimentation that is Naïve Bayes,

34
J48, SMO and LibSVM. Then these algorithms were implemented using WEKA data
mining technique to analyse algorithm accuracy which was obtained after running these
algorithms in the output window. After these algorithms were running, the outputs were
compared on the basis of accuracy achieved. In Explorer, there are several scoring
algorithms for accuracy but for this experimentation only used four algorithms. These
algorithms compare classifier accuracy to each other on the basis of correctly classified
instances, mean absolute error and ROC Area. Through Explorer technique it was
inferred that LibSVM and J48 are the best performance classifier algorithms than the
SMO algorithm as they achieved an accuracy of 97 %, takes less time taken to build
and shows maximum ROC area which is close to 1, and had least absolute error.
Maximum ROC Area means excellent predictions performance as compared to other
algorithms.
In future, the applications of Weka can be extended further to malware analysis of
different type like worm and many others. It can also help in solving the problems
malware research using different applications of Weka.
35
REFERENCE
[1] Kaspersky Lab. 2016. Kaspersky Security Bulletin 2015. Overall statistics for
2015. WWW document. Available at:https://securelist.com/analysis/kaspersky-
security-bulletin/73038/kaspersky-security-bulletin-2015-overall-statistics-for- 2015/.
[Accessed 15 February 2017]
[2] Mehmed Kantardzic, “Data Mining: Concepts, Models, Methods, and
Algorithms”, ISBN: 0471228524, John Wiley & Sons, 2003.
[3] R. Burbidge, M. Trotter, B. Buxton and S. Holden, “Drug design by machine
learning: support vector machines for pharmaceutical data analysis”, Computers and
Chemistry, vol. 26, (2001), pp. 5-14.
[4] J.Z.KolterandM.A.Maloof,“Learningtodetectandclassify
maliciousexecutablesinthewild,”JournalofMachineLearning Research,vol.7,pp.2721–
2744,2006.
[5] Mehmed Kantardzic, “Data Mining: Concepts, Models, Methods, and
Algorithms”, ISBN: 0471228524, John Wiley & Sons, 2003.
[6] L. Shutao, J. T. Kwok, H. Zhua and Y. Wang, “Texture classication using the
support vector machines”, Pattern Recognition, vol. 36, (2003), pp. 2883-2893.
36
[7] Emmanuel Gbenga Dada, Joseph Stephen Bassi, Yakubu Joseph Hurcha and
Abdulkadir Hamidu Alkali (2019); Performance Evaluation of Machine Learning
Algorithms for Detection and Prevention of Malware Attacks.
[8] Bishop, Christopher. 2006. Pattern Recognition and Machine Learning. New
York: Springer
[9] E.Venkatesh, G.Srinivasulu (2014);Malware Classification by Using
WEKATOOL.
[10] A. Moore, “Cross-validation for detecting and preventing overfitting.” http:
//www.autonlab.org/tutorials/overfit09.pdf
[11] Y. Zhan and D. Shen, “Design efficient support vector machine for fast
classification”, Pattern Recognition, vol. 38, (2005), pp. 157-161.
[12] J. Shao, “Linear Model Selection by Cross-Validation,” Journal of the American
Statistical Association, vol. 88, no. 422, pp. 486–494, 1993
[13] F. Lauer and G. Bloch, “Incorporating prior knowledge in support vector
machines for classification: A review”, Neurocomputing, vol. 71, (2008), pp. 1578–
1594.
[14] F. Provost, T. Fawcett, and R. Kohavi, “The Case Against Accuracy Estimation
for Comparing Induction Algorithms,” in In Proceedings of the Fifteenth In
ternational Conference on Machine Learning, pp. 445–453, Morgan Kaufmann,
1997.
[15] T. Fawcett, ROC Graphs: Notes and Practical Considerations for Data Mining

37
Researchers. HP Laboratories Palo Alto, January 2003. Copyright Hewlett
Packard Company 2003.
[16] Wikipedia, “Weka (machine learning) — Wikipedia, The Free Ency
clopedia.” http://en.wikipedia.org/w/index.php?title=Weka_(machine_
learning)&oldid=338751970, 2009. [Online; accessed 25-December-2009].
[17] Harley, David, and Andrew Lee. 2009. Heuristic Analysis — Detecting
Unknown Viruses.
[18] I. H. Witten and E. Frank, Data mining: practical machine learning tools and
techniques with Java implementations. Morgan Kaufmann Publisher, second
edition ed., 2005.
[19] M. A. Hearst, “Support Vector Machines,” IEEE Intelligent Systems, vol. 13,
pp. 18–28, 1998.
[20] B. Scho¨lkopf and A. J. Smola, Learning with Kernels: Support Vector Machines,
Regularization, Optimization, and Beyond (Adaptive Computation and Machine
Learning). The MIT Press, 1st ed., December 2001.
[21] Kaggle, “Microsoft Malware Classification Challenge (BIG 2015)” Microsoft,
URL: https://www.kaggle.com/c/malware-classification,
[Accessed:10/December/2016].
[22] L. K. Mehedy Masud and B. Thuraisingham, Data Mining Tools for Malware
Detection, vol. 1, CRC Press, 2012.

38
[23] J. Z. Kolter and M. A. Maloof, “Learning to detect and classify malicious
executables in the wild,” Journal of Machine Learning Research, vol. 7, pp. 2721–2744,
2006.
[24] C. Ravi and R. Manoharan, “Malware detection using Windows Api sequence and
machine learning,” International Journal of Computer Applications, vol. 43, no. 17, pp.
12–16, 2012.
[25] Gadhiya S. and Bhavsar K. Techniques for Malware Analysis. International Journal
of Advanced Research in Computer Science and Software Engineering. Vol. 3, Issue 4,
2013, pp. 972-975.
[26] KaterynaChumachenko. Machine Learning Methods for Malware Detection and
Classification. Bachelor's Thesis in Information Technology. University of Applied
Sciences, 93 pages, 2017.
[27] Margaret H. Danham,S. Sridhar, ” Data mining, Introductory and Advanced
Topics”, Person education , 1st ed., 2006.
[27] Mehmed Kantardzic, “Data Mining: Concepts, Models, Methods, and
Algorithms”, ISBN: 0471228524, John Wiley & Sons, 2003.
[28] Kim, H., Pang, S., Je, H., Kim, D., Bang, S.: Support vector machine ensemble
with bagging. SVM 2002, LNCSI, vol. 2388, pp 397–408 (2002).
[29] Kolcz, A., Sun, X., Kalita, J.: Efficient handling of highdimensional feature spaces
by randomized classifier ensembles. In: Proceedings of KDD’02 (2002).
[30] Bailey, M., Oberheide, J., Andersen, J., Mao, Z.M., Jahanian, F., Nazario, J.:
Automated classification and analysis of internet malware. RAID 2007. LNCS, vol.
4637, pp 178–197 (2007).

39