predictive analytics milliman risk score and hannover re 4 - predictive... · predictive analytics...
TRANSCRIPT
Predictive AnalyticsMilliman Risk Score and Hannover Re
November 18, 2016Eric Carlson & Sean Conrad

Agenda
Why Risk Score
What is Risk Score
Retrospective Study Results
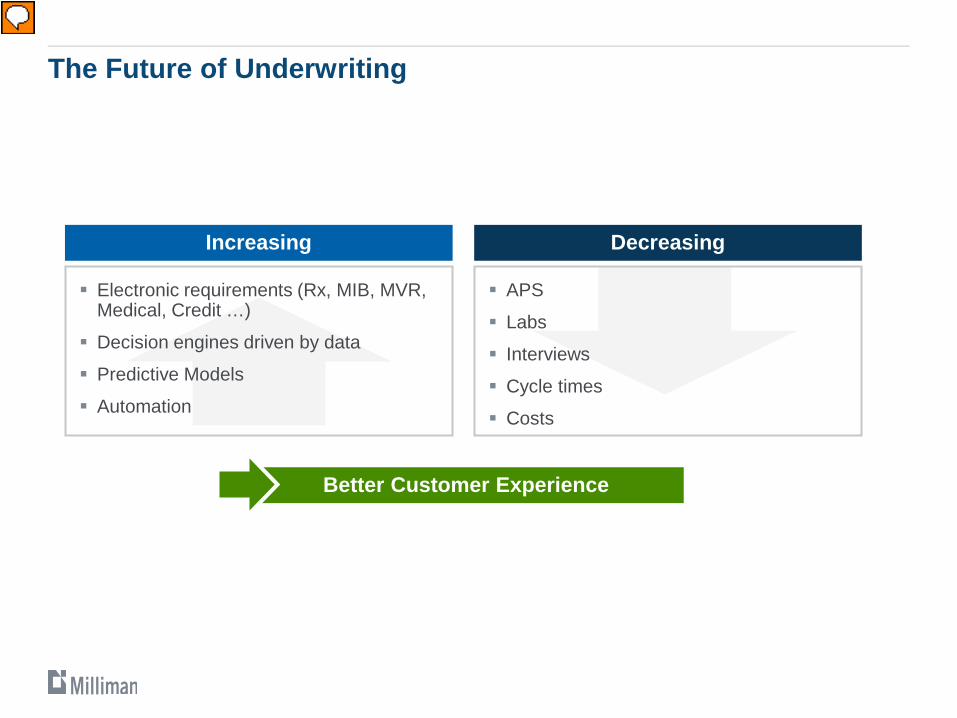
The Future of Underwriting
Electronic requirements (Rx, MIB, MVR, Medical, Credit …)
Decision engines driven by data
Predictive Models
Automation
Increasing
APS
Labs
Interviews
Cycle times
Costs
Decreasing
Better Customer Experience
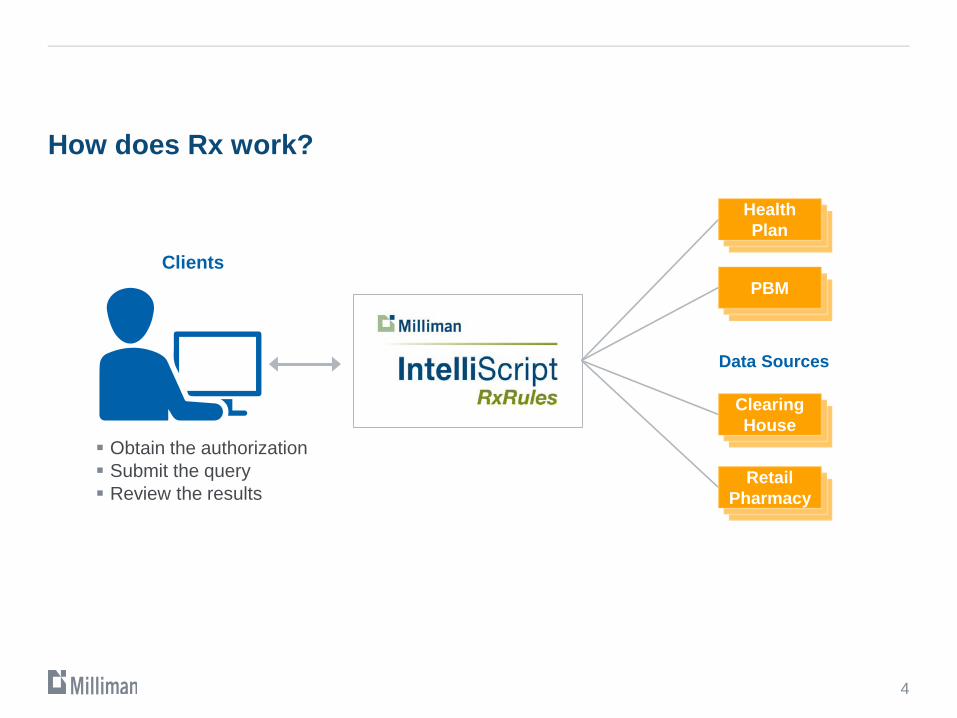
How does Rx work?
Obtain the authorization Submit the query Review the results
Clients
Health Plan
PBM
Clearing House
RetailPharmacy
Data Sources
4
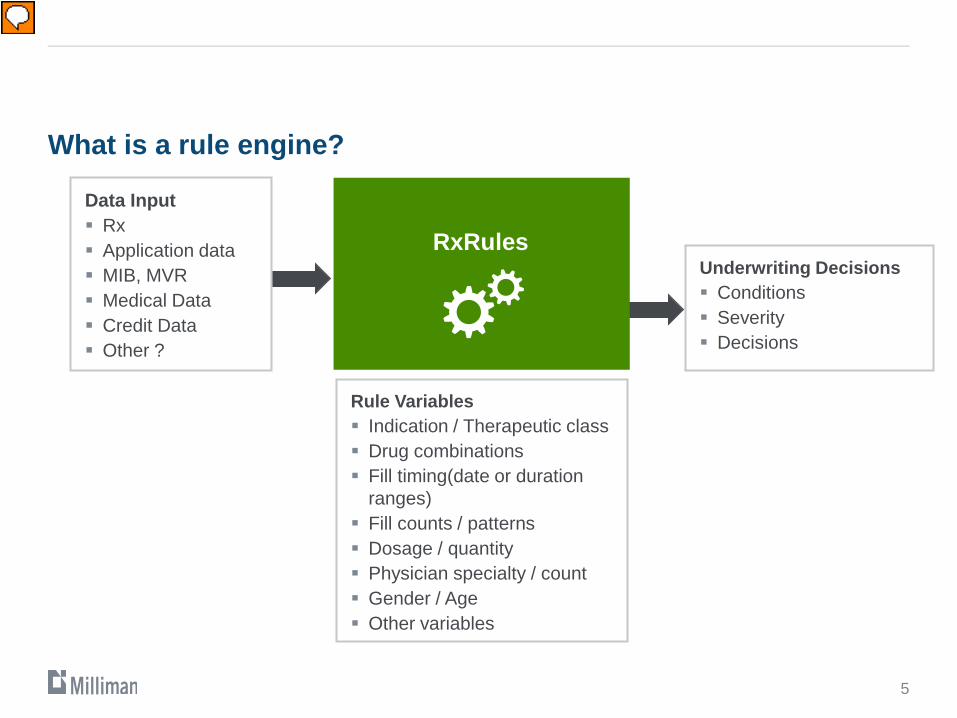
What is a rule engine?
RxRules
Data Input Rx Application data MIB, MVR Medical Data Credit Data Other ?
Underwriting Decisions Conditions Severity Decisions
Rule Variables Indication / Therapeutic class Drug combinations Fill timing(date or duration
ranges) Fill counts / patterns Dosage / quantity Physician specialty / count Gender / Age Other variables
5
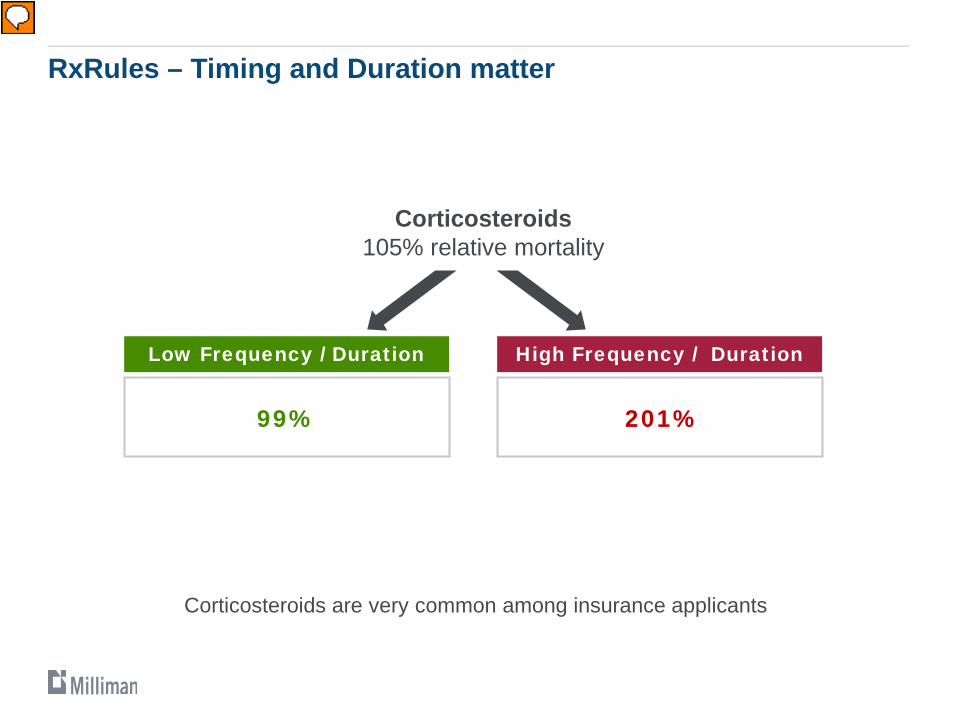
RxRules – Timing and Duration matter
Corticosteroids are very common among insurance applicants
Corticosteroids105% relative mortality
Low Frequency / Duration
99%
High Frequency / Duration
201%
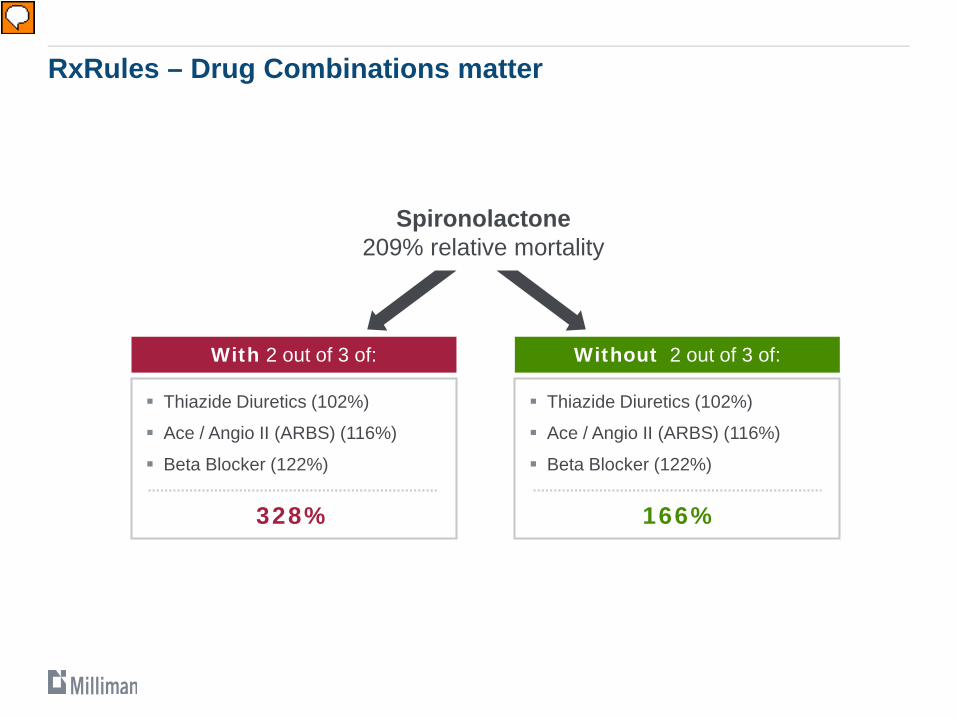
RxRules – Drug Combinations matter
Spironolactone209% relative mortality
Thiazide Diuretics (102%)
Ace / Angio II (ARBS) (116%)
Beta Blocker (122%)
With 2 out of 3 of:
328%
Thiazide Diuretics (102%)
Ace / Angio II (ARBS) (116%)
Beta Blocker (122%)
Without 2 out of 3 of:
166%
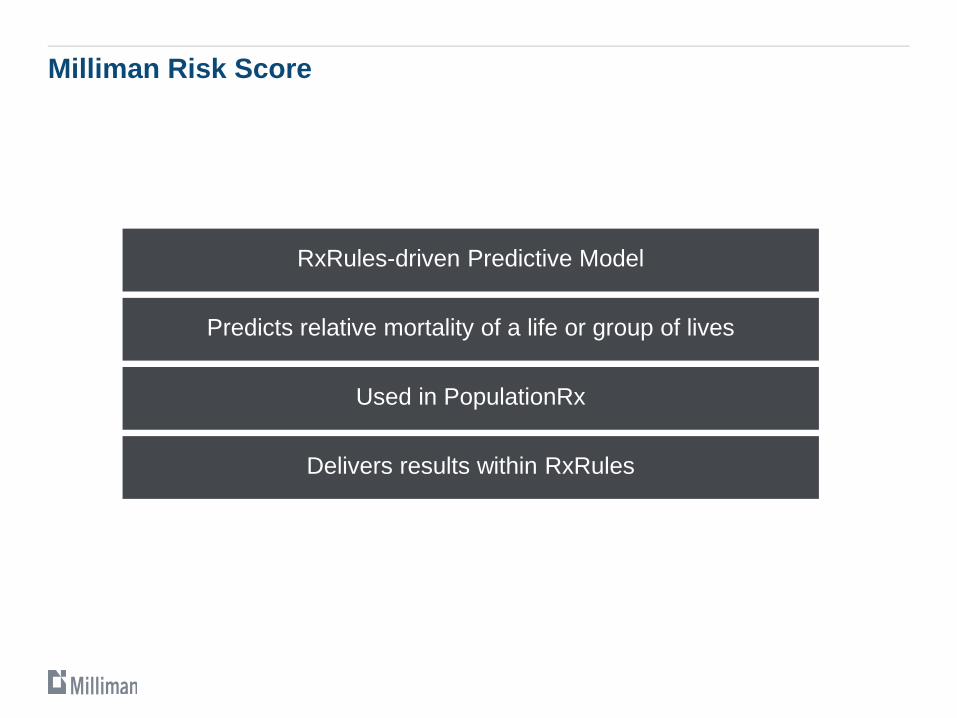
Milliman Risk Score
RxRules-driven Predictive Model
Predicts relative mortality of a life or group of lives
Used in PopulationRx
Delivers results within RxRules
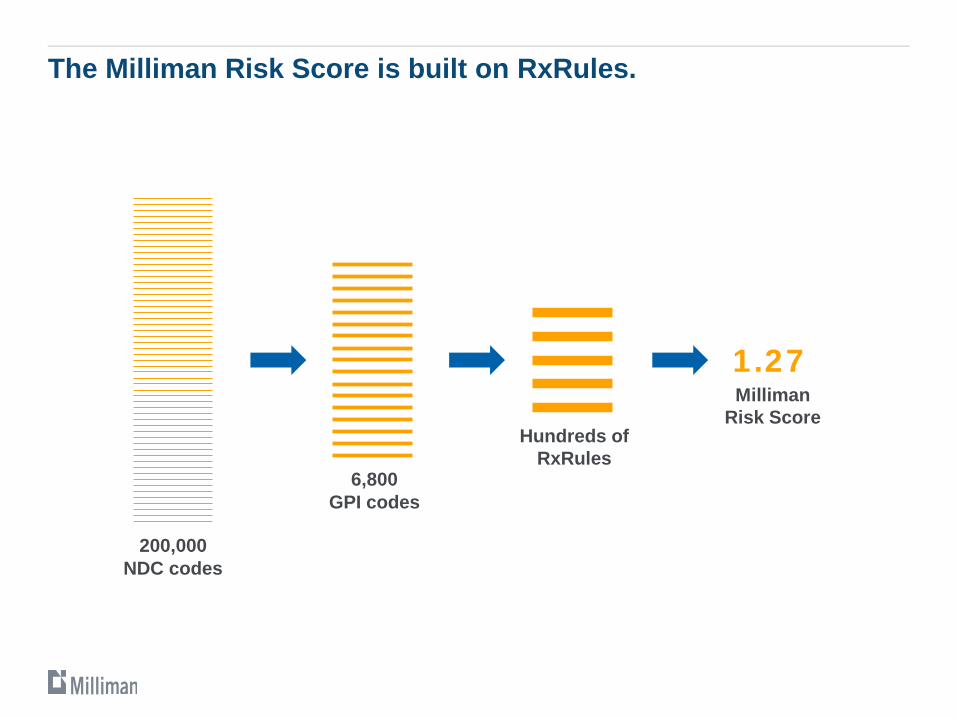
The Milliman Risk Score is built on RxRules.
Milliman Risk Score
200,000NDC codes
6,800GPI codes
Hundreds of RxRules
1.27
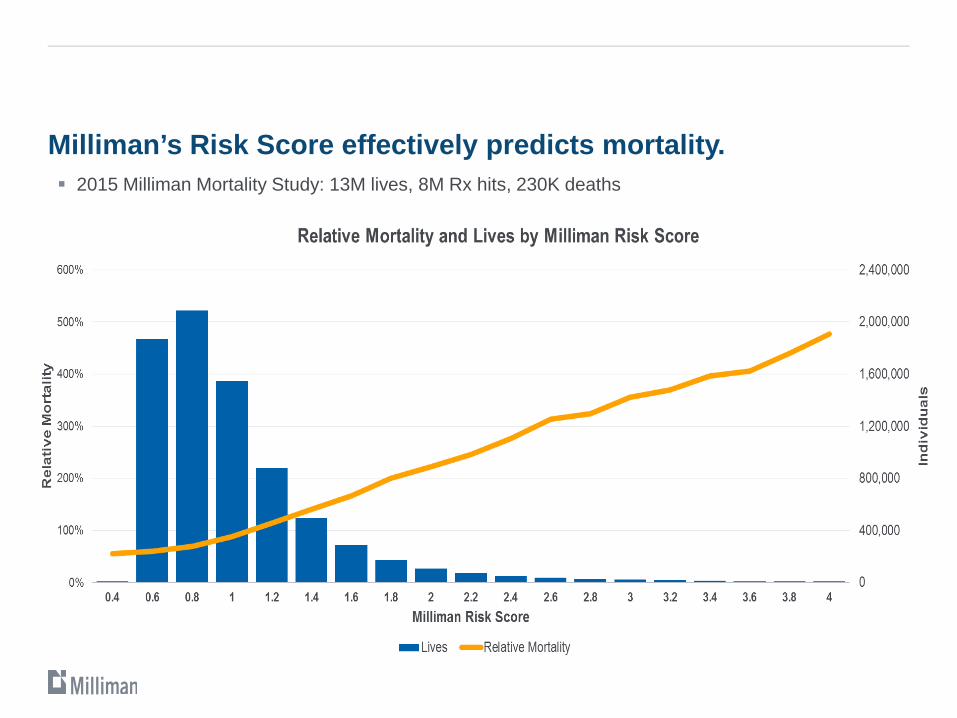
Milliman’s Risk Score effectively predicts mortality. 2015 Milliman Mortality Study: 13M lives, 8M Rx hits, 230K deaths
Hannover Re AnalysisIndependent Validation of Milliman Risk Score
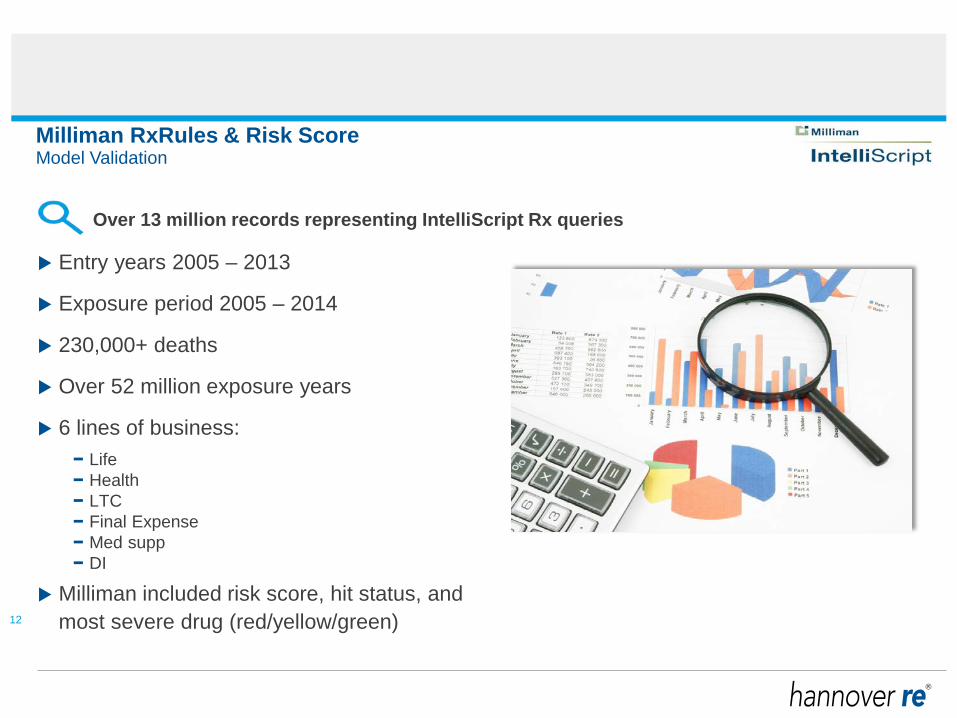
Milliman RxRules & Risk ScoreModel Validation
Over 13 million records representing IntelliScript Rx queries
Entry years 2005 – 2013
Exposure period 2005 – 2014
230,000+ deaths
Over 52 million exposure years
6 lines of business: − Life− Health− LTC− Final Expense− Med supp− DI
Milliman included risk score, hit status, and most severe drug (red/yellow/green)12
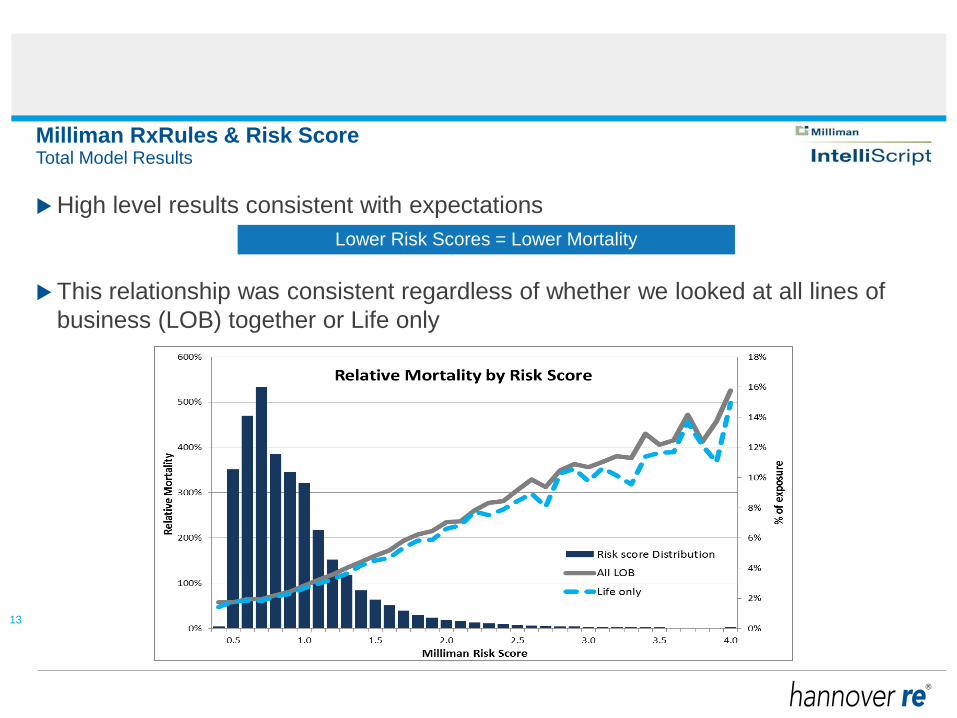
Milliman RxRules & Risk Score
High level results consistent with expectations
This relationship was consistent regardless of whether we looked at all lines of business (LOB) together or Life only
Total Model Results
13
Lower Risk Scores = Lower Mortality
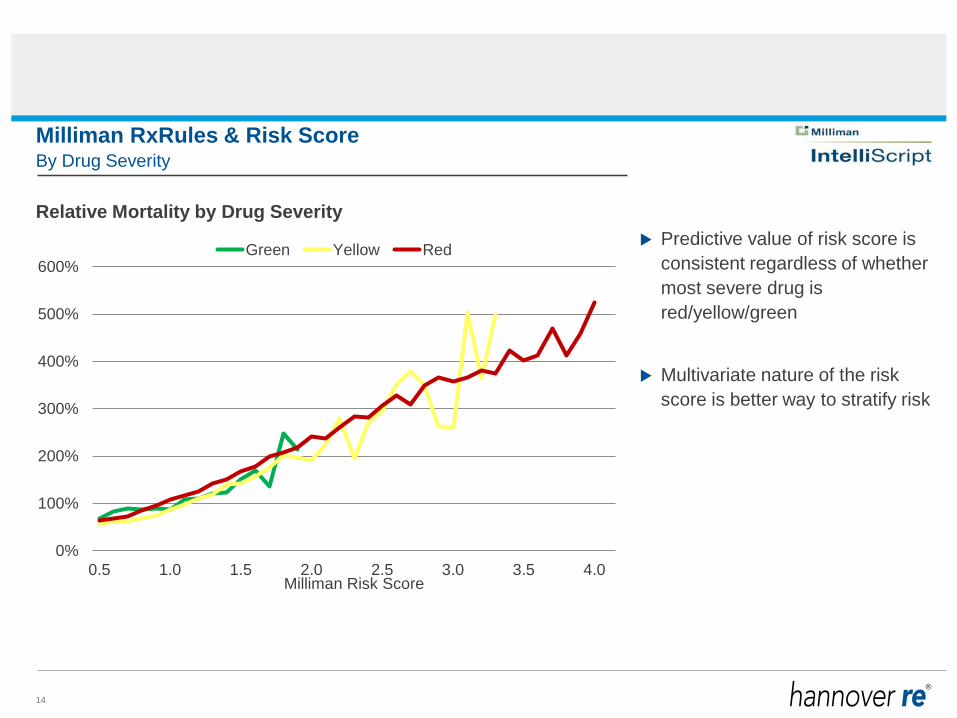
Milliman RxRules & Risk Score
Relative Mortality by Drug Severity Predictive value of risk score is
consistent regardless of whether most severe drug is red/yellow/green
Multivariate nature of the risk score is better way to stratify risk
By Drug Severity
0%
100%
200%
300%
400%
500%
600%
0.5 1.0 1.5 2.0 2.5 3.0 3.5 4.0Milliman Risk Score
Green Yellow Red
14
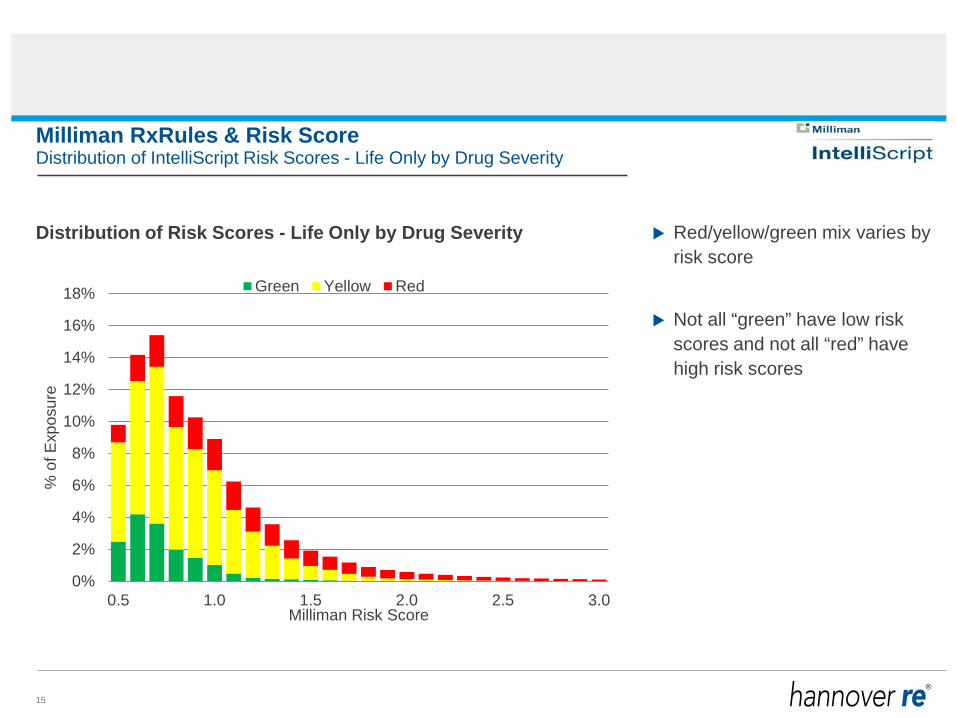
Milliman RxRules & Risk Score
Distribution of Risk Scores - Life Only by Drug Severity Red/yellow/green mix varies by risk score
Not all “green” have low risk scores and not all “red” have high risk scores
Distribution of IntelliScript Risk Scores - Life Only by Drug Severity
0%
2%
4%
6%
8%
10%
12%
14%
16%
18%
0.5 1.0 1.5 2.0 2.5 3.0
% o
f Exp
osur
e
Milliman Risk Score
Green Yellow Red
15
Milliman RxRules & Risk Score
Quick, efficient, and consistent method for evaluating Rx
Synthesize complex aspects of Rx history (# of refills, who prescribed?, etc.)
Triage Rx info – identify “clean” Rx histories vs. those to review in more detail
Benefits & Potential Use Cases
Increase acceptance rates and/or decrease mortality expectation
Case Study Background
Simplified Issue writer
Cases are either issued or declined – no rate classes
Decisions are almost exclusively automatedUsed application, Rx / RxRules, plus MIB and MVR as decision elements
230,000 lives
1,200 deaths – deaths for issued policies AND declined policies
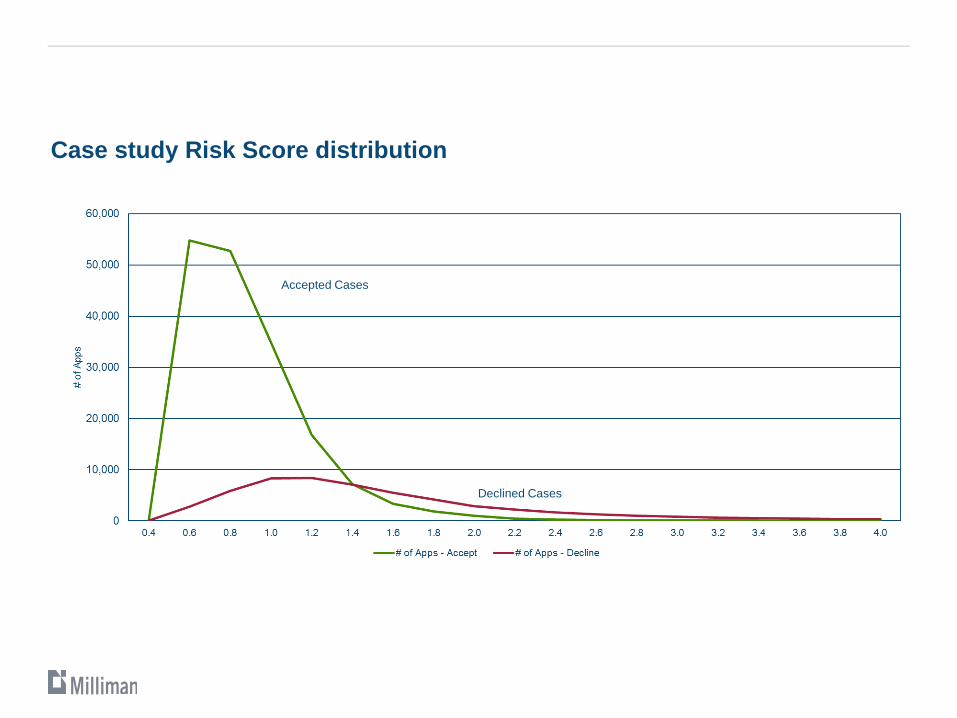
Case study Risk Score distribution
Accepted Cases
Declined Cases
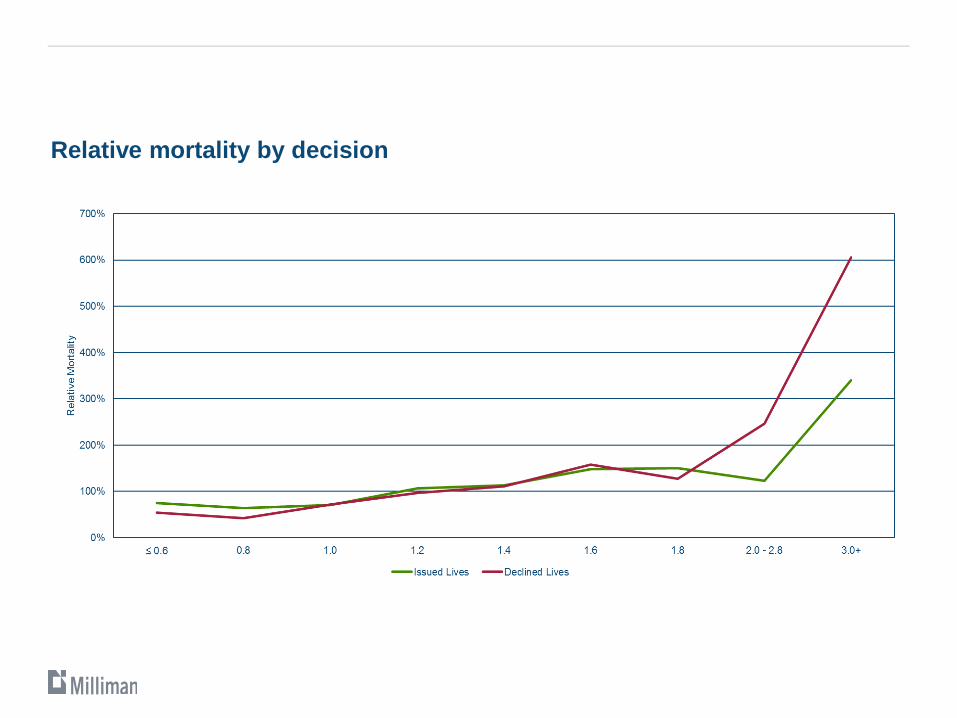
Relative mortality by decision
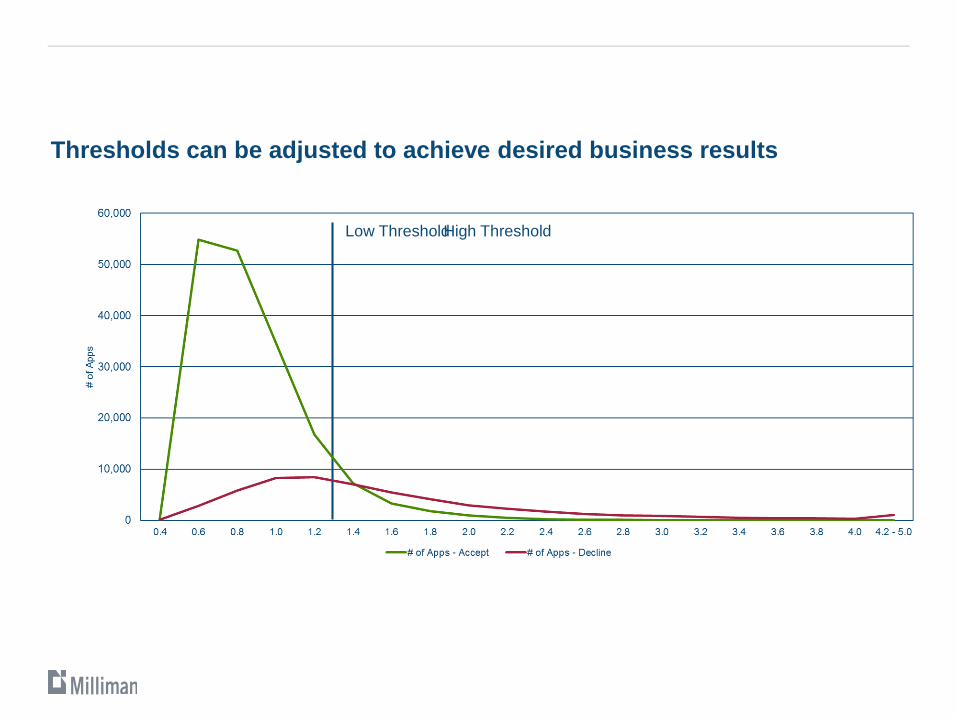
Thresholds can be adjusted to achieve desired business results
Low ThresholdHigh Threshold
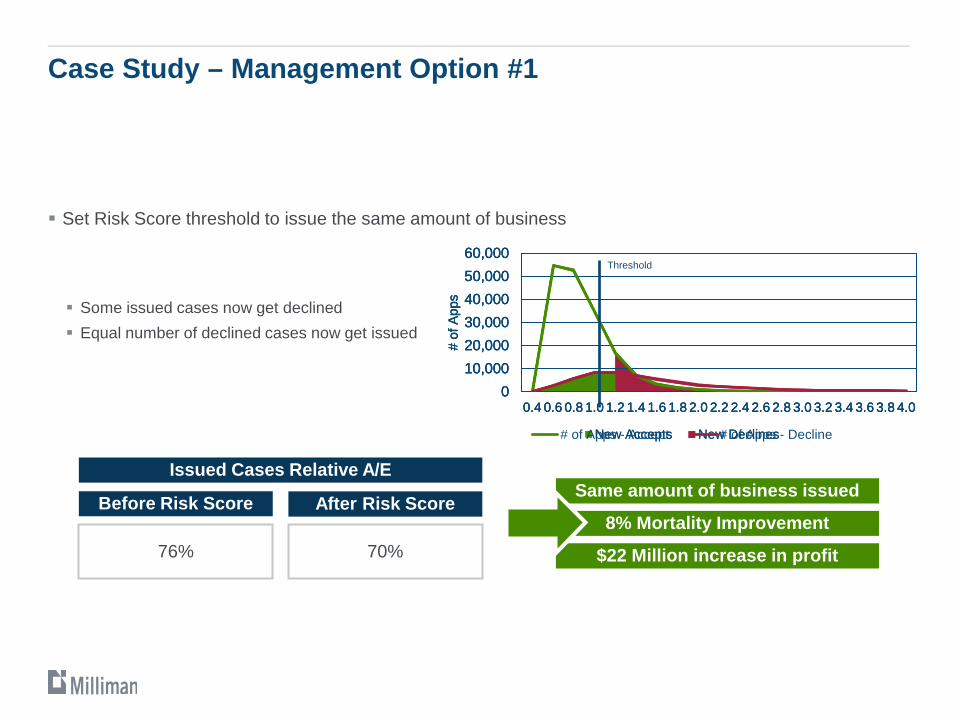
Case Study – Management Option #1
Set Risk Score threshold to issue the same amount of business
Some issued cases now get declined Equal number of declined cases now get issued
010,00020,00030,00040,00050,00060,000
0.4 0.6 0.8 1.0 1.2 1.4 1.6 1.8 2.0 2.2 2.4 2.6 2.8 3.0 3.2 3.4 3.6 3.8 4.0
# of
App
sNew Accepts New Declines
010,00020,00030,00040,00050,00060,000
0.4 0.6 0.8 1.0 1.2 1.4 1.6 1.8 2.0 2.2 2.4 2.6 2.8 3.0 3.2 3.4 3.6 3.8 4.0
# of
App
sNew Accepts New Declines
010,00020,00030,00040,00050,00060,000
0.4 0.6 0.8 1.0 1.2 1.4 1.6 1.8 2.0 2.2 2.4 2.6 2.8 3.0 3.2 3.4 3.6 3.8 4.0
# of
App
s# of Apps - Accept # of Apps - Decline
Threshold
76%
Before Risk Score
70%
After Risk Score
Issued Cases Relative A/ESame amount of business issued
$22 Million increase in profit
8% Mortality Improvement
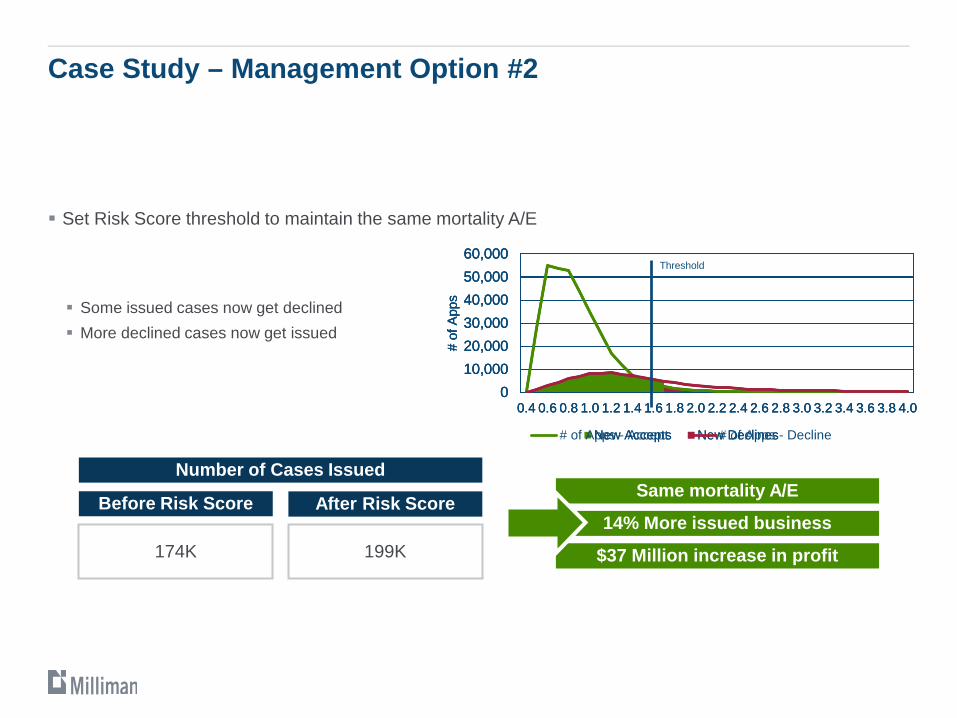
Set Risk Score threshold to maintain the same mortality A/E
Some issued cases now get declined More declined cases now get issued
Case Study – Management Option #2
010,00020,00030,00040,00050,00060,000
0.4 0.6 0.8 1.0 1.2 1.4 1.6 1.8 2.0 2.2 2.4 2.6 2.8 3.0 3.2 3.4 3.6 3.8 4.0
# of
App
sNew Accepts New Declines
010,00020,00030,00040,00050,00060,000
0.4 0.6 0.8 1.0 1.2 1.4 1.6 1.8 2.0 2.2 2.4 2.6 2.8 3.0 3.2 3.4 3.6 3.8 4.0
# of
App
sNew Accepts New Declines
010,00020,00030,00040,00050,00060,000
0.4 0.6 0.8 1.0 1.2 1.4 1.6 1.8 2.0 2.2 2.4 2.6 2.8 3.0 3.2 3.4 3.6 3.8 4.0
# of
App
s# of Apps - Accept # of Apps - Decline
Threshold
174K
Before Risk Score
199K
After Risk Score
Number of Cases IssuedSame mortality A/E
$37 Million increase in profit
14% More issued business
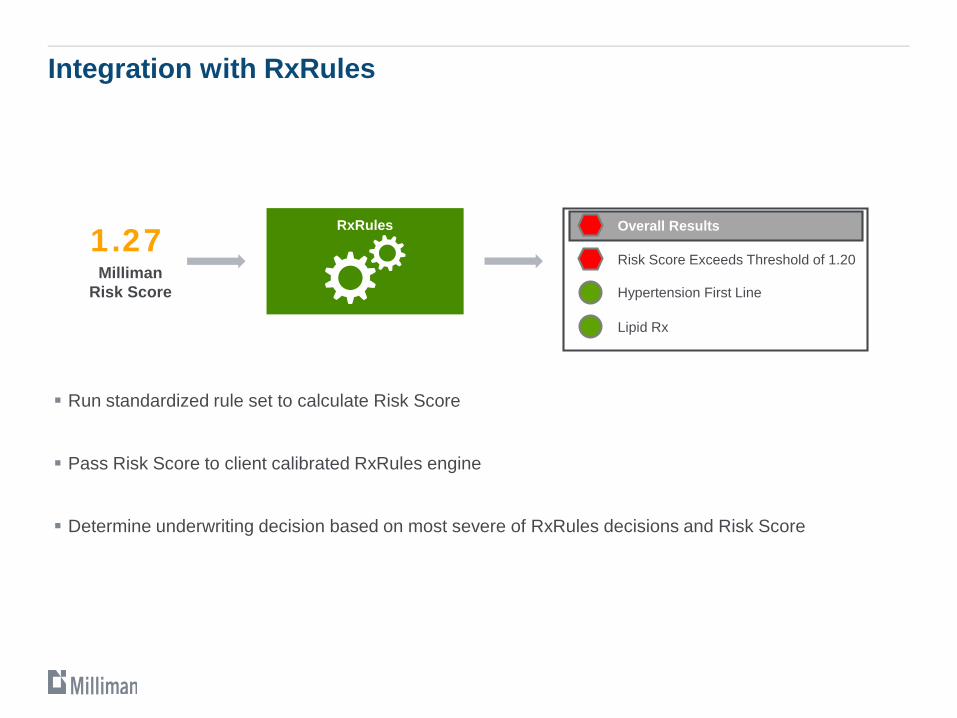
Integration with RxRules
Run standardized rule set to calculate Risk Score
Pass Risk Score to client calibrated RxRules engine
Determine underwriting decision based on most severe of RxRules decisions and Risk Score
RxRules
Milliman Risk Score
1.27Hypertension First Line
Lipid Rx
Risk Score Exceeds Threshold of 1.20
Overall Results
24
Proprietary and Confidential.
Contact Info
Eric Carlson, FSA, MAAA Life Actuary
[email protected] (262) 641-3537
Sean Conrad, FSA, MAAA, FIA, CFA VP & Actuary
[email protected] (704) 731-6382