predictive model and record description with segmented sensitivity analysis (ssa)
TRANSCRIPT

1
By Greg Makowski
http://www.LinkedIn.com/in/GregMakowski
Predictive Model and Record Description Using Segmented Sensitivity Analysis
Global Big Data Conference, Santa Clarahttp://globalbigdataconference.com/santa-clara/global-software-architecture-conference/schedule-86.html
Friday, June 9, 2017

Benefits
Describe the most important data inputs to a model
• What is driving the forecast?
• Good Communication is a Competitive Advantage
During model building – use to improve the model
Use to detect data drift – when model refresh is needed
For each record, what are reasons for the forecast?
2

“3 Reasons Why Data Scientist Remains the Top Job in America” – Infoworld 4/14/17
In 2015: 11k to 19k Data Scientists (existed)
Now: On LinkedIn, 13.7k OPEN POSITIONS (89% more pos in 2 yrs)
Reason #1: There’s a shortage of talent
• “Business leaders are after professionals who can not only understand the numbers, but also communicate their findings effectively.”
Reason #2: Org Face Challenges in organizing data
• “Data preparation accounts for 80% of the work of Data Scientists”
Reason #3: Need for DS is no longer restricted to tech giants
3http://www.infoworld.com/article/3190008/big-data/3-reasons-why-data-scientist-
remains-the-top-job-in-america.html#tk.drr_mlt

“3 Reasons Why Data Scientist Remains the Top Job in America” – Infoworld 4/14/17
4http://www.infoworld.com/article/3190008/big-data/3-reasons-why-data-scientist-
remains-the-top-job-in-america.html#tk.drr_mlt

Algorithm Design Objectives
1. Describe the model in terms of variables understandable to the target audience
2. Be independent of the algorithm (i.e. Neural Net, SVM, Xtreame Gradient Boosting, Random Forests…)
3. Support describing an arbitrary ensemble of models
4. Pick up non-linearities in the vars
5. Pick up interaction effects
6. Understand the model system in a very local way5
x
z (target)

Set Client Expectations
I understand completely how a bicycle works….
However, I still drive a car to work
A certain level of detail is NOT needed
Do you find out why the automotive engineer picked X mm for the diameter of the cylinders?
You can learn enough detail to let the model drive your business
6

Sensitivity Analysis(OAT) One At a Time
https://en.wikipedia.org/wiki/Sensitivity_analysis
Arbitrarily ComplexData Mining System
(S) Source fields
Target field
For source fields with binned ranges, sensitivity
tells you importance of the range, i.e. “low”, …. “high”
Can put sensitivity values in Pivot Tables
or Cluster
Record Level “Reason codes” can be extracted from the most important
bins that apply to the given record
Delta in forecast
Present record N, S times, each input 5% bigger (fixed input delta)Record delta change in output, S times per record
Aggregate: average(abs(delta)), target change per input field delta

5 Example Sensitivity RecordsIntermediate Table of Sensitivities /rec /var
Forecasted
Target
Variable
Changes from the target variable,
after multiplying each input by 1.05,
One At a Time (OAT) Delta
1
Delta
2
Delta
N
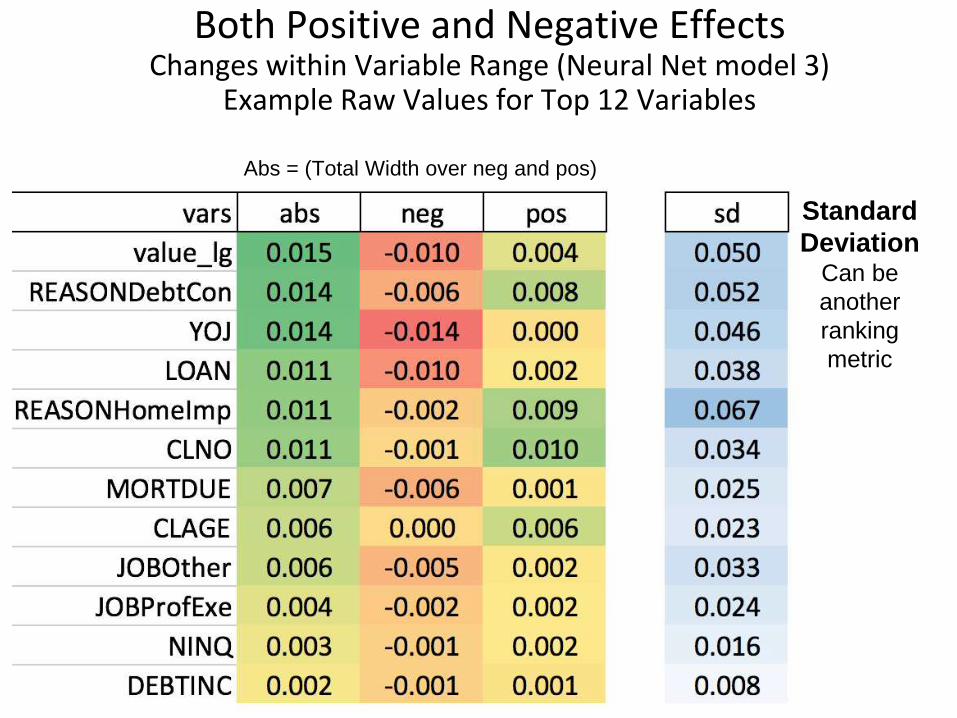
Both Positive and Negative EffectsChanges within Variable Range (Neural Net model 3)
Example Raw Values for Top 12 Variables
Standard
DeviationCan be
another
ranking
metric
Abs = (Total Width over neg and pos)

Both Positive and Negative EffectsChanges within Variable Range (Neural Net model 3)
Avg(negative values)
by variable
Avg(positive values)
by variable

11
Define business objectives and project plan during the Knowledge Discovery Workshop
Select the “Analysis Universe” dataInclude holdout verification data
Repeat through model loop (1-3 times, ~2 weeks each)
Exploratory Data Analysis (EDA)
Transformation (Preprocessing)
Build Model – dozens or 100’s of models (Data Mining)
Evaluate and explain the model – use business metric
Score or deploy the model on “Forecast Universe”
Track results, refresh or rebuild model, subdivide or refine as needed
Data Mining Project Overview
Scoring past
Analysis past
Forecasted future
Example future
Reference Date
Days per sprint
2 1 1
5 4 4
2 4 3
1 1 2
https://www.csd.uwo.ca/faculty/ling/cs435/fayyad.pdf
From Data Mining to Knowledge Discovery in Databases, 1996

During the Data Mining Projectat the End of the First Sprint
Sprint 1: basic data preprocessing and clean upAt the end (before Sprint 2) • Perform Sensitivity Analysis to rank variables
Sprint 2, start• Now have quantitative feedback on the most important variables• Start working on more detailed knowledge representation• Check variable interactions
“More data beats clever algorithms,
But BETTER DATA beats more data”
- Peter NorvigDirector of Research at Google
Fellow of Association for the Advancement of Artificial Intelligence

Higher Level Detectors Illustrated as rules, but typically functions for a continuous score
”Higher Level” or compound detectors–Group one of many to an overall behavior issue (using NLP tags)
if (hide communications identity with email alias) or
(hide communication subject with code phrase) then
hiding_comm on date_time X = 0.2
–Group many low level alerts in a short time
if (5 <= failed login attempts) and (3 minutes <= time window) then
Possible password guessing = 0.3
else if (20 <= failed login attempts) and (5 minutes <= time) then
Possible password guessing = 0.7
–Compare different levels of context (possibly from different source systems)
if (4 <= sum(over=week, event=hiding_comm) and # sum smaller detector over time
(3 <= comm network size(hiding_comm)) and # network analysis
(manager not in(network(hiding_comm))) # reporting hierarchy
escalating comm secrecy = 0.8 # thresholds distance increases score
Analogy
• Defense attorney
debating plausible
innocence
• Prosecuting attorney
debating guilt
• Detectors seeing the
plausible “best case”
(to reduce false alerts)
• Other detectors seeing
the “worst case” in
each record
Accurate
General
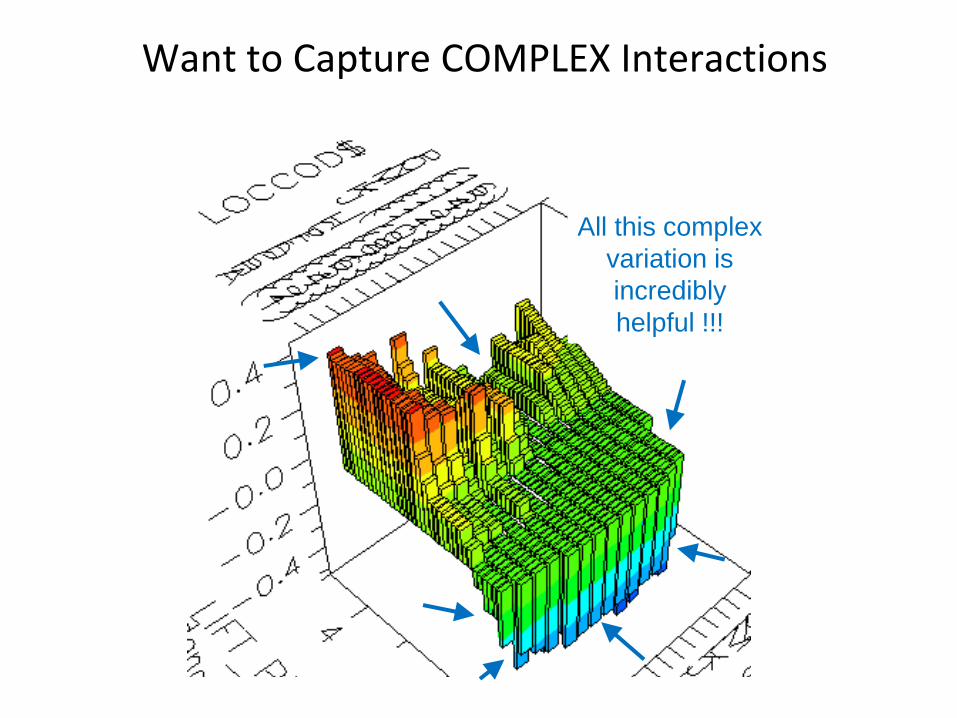
Want to Capture COMPLEX Interactions
All this complex
variation is
incredibly
helpful !!!

Capture “Data Drift” Over TimeBehavior Changes (pricing, competition)
CurrentScoring
Data
TrainingData
Think about what you want the model to be
general on, capture behavior VARIETY:
satellite images only during afternoon
Christmas or vacation
spending spikes
The best model is limited by fitting
the TRAINING data surface
Do you have a large enough sample by behavior pocket?
“Non-Stationary Data” DOES change
over training to scoring time

MODEL DRIFT DETECTOR in N dimensions• Change in distribution of most important input fields
Diagnose CAUSES, what is changing, how much…Out of the top 25% of the most important input fields…Which had the largest change?
Tracking Model Drift
Distribution of
important variable
X (where Y=15)
changes from one
peak to two
x
z (target)
x
z (target)TRAINING DATA SCORING DATA
General

Capture “Data Drift” Over TimeBehavior Changes (pricing, competition)
Use “Training Data” as the baseline • Create 20 equal frequency bins of the forecast variable (5.0% / bin)• Save the original, Training, bin thresholds
Check the Scored data over time (i.e. daily, monthly) Chi-Sqare or
KS-Statistic
To measure
The slow
changes
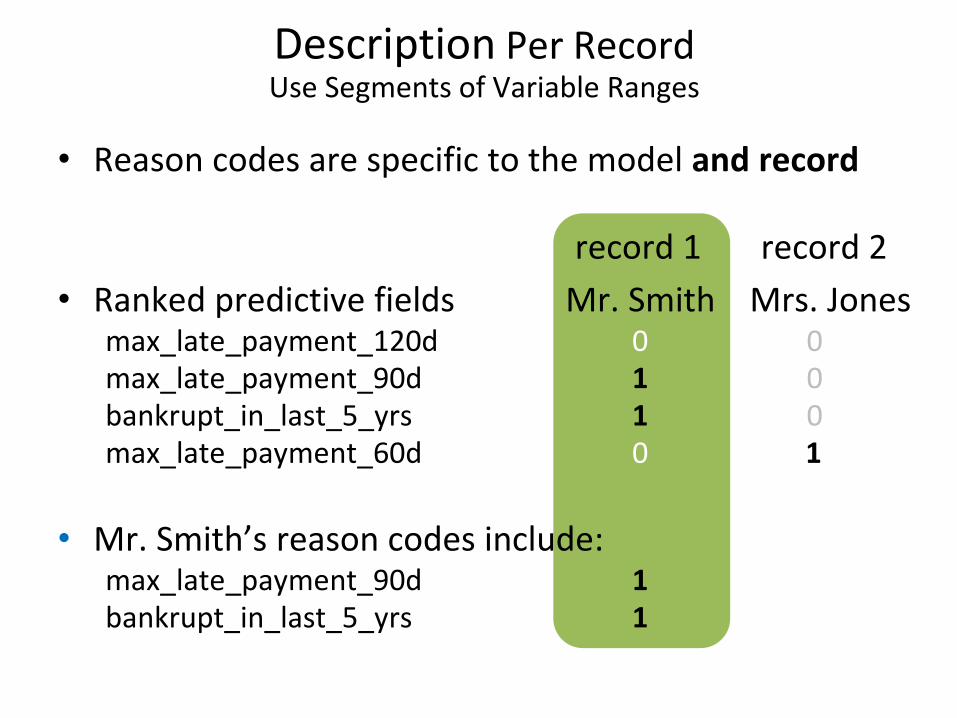
Description Per RecordUse Segments of Variable Ranges
• Reason codes are specific to the model and record
record 1 record 2
• Ranked predictive fields Mr. Smith Mrs. Jonesmax_late_payment_120d 0 0max_late_payment_90d 1 0bankrupt_in_last_5_yrs 1 0max_late_payment_60d 0 1
• Mr. Smith’s reason codes include:max_late_payment_90d 1bankrupt_in_last_5_yrs 1

Description Per Record
Need ”reasons” that apply to some people (records) but not others
A given variable has some value for everybody
Need “sub-ranges” that only apply to some people, i.e.• Very Low, Low, Medium, High, Very High• Create 5 “bins”, with a roughly equal number of records per bin• Focus on the sub-ranges or bins that have the highest sensitivity


21
5. Model Training Demo/Lab with HMEQ (Home Equity) DataLine of credit loan application, using existing home as loan equity.
5,960 records
COLUMNrec_IDBAD
CLAGECLNODEBTINCDELINQDEROGJOBLOANMORTDUENINQREASONVALUEYOJ
DATA ROLEKeyTarget
ApplicantApplicantApplicantApplicantApplicantApplicantLoan applicPropertyApplicantLoan applicPropertyApplicant
DESCRIPTIONRecord ID or key field, for each line of credit loan or personAfter 1 year, loan went in default, (=1, 20%) vs. still being paid (=0)
Credit Line Age, in months (for another credit line)Credit Line NumberDebt to Income ratioNumber of delinquent credit linesNumber of major derogatory reportsJob, 6 occupation categoriesRequested loan amountAmount due on existing mortgageNumber of recent credit inquiries“DebtCon“ = debt consolidation, “HomeImp“ = home improvement
Value of current property Years on present job
https://inclass.kaggle.com/c/pred-411-2016-04-u2-bonus-hmeq/data?heloc.csv

Rules or Queries to DetectorsSimple Example
Select 1 as detect_prospect (result field has 0 or 1 values)
where (.6 < recency) and
(.7 < frequency) and
(.3 < time)
Select recency + frequency + time as detect_prospect
where (.6 < recency) and (has 100’s of values
(.7 < frequency) and in the [0..1] range)
(.3 < time)
Develop “fuzzy” detectors, result in [0..1]
22
Accurate
General
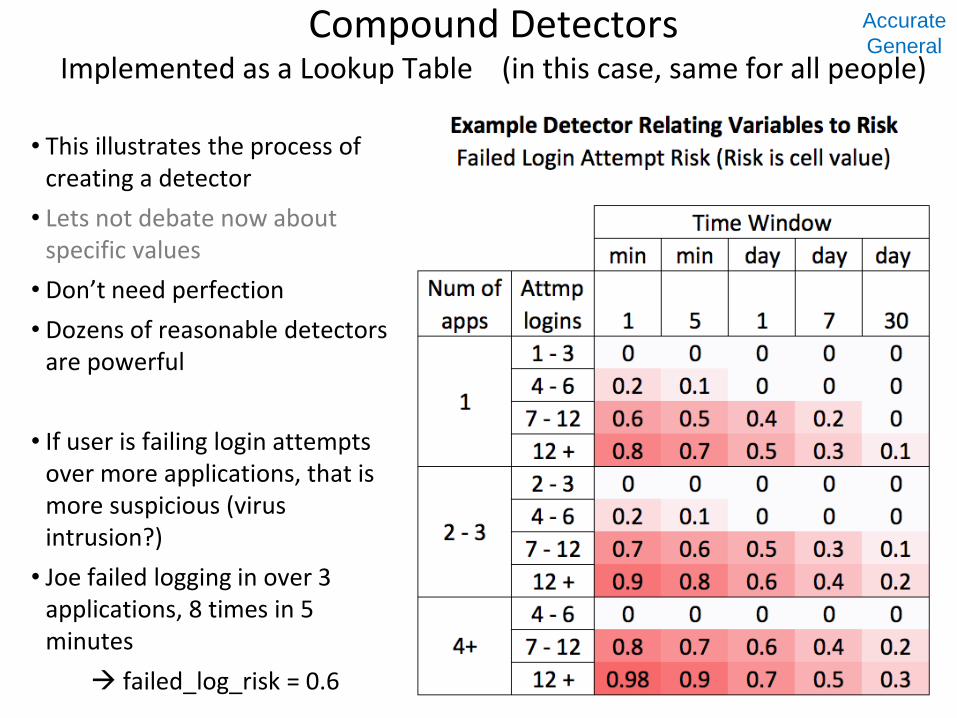
Compound Detectors Implemented as a Lookup Table (in this case, same for all people)
• This illustrates the process of creating a detector
• Lets not debate now about specific values
• Don’t need perfection
• Dozens of reasonable detectors are powerful
• If user is failing login attempts over more applications, that is more suspicious (virus intrusion?)
• Joe failed logging in over 3 applications, 8 times in 5 minutes
failed_log_risk = 0.6
Accurate
General