predictive models for condensate gas ratio (cgr) – part 1 ... · through detailed mechanisms such...
TRANSCRIPT

____________________________________________________________________________________________
*Corresponding author: E-mail: [email protected];
British Journal of Applied Science & Technology3(4): 1533-1547, 2013
SCIENCEDOMAIN internationalwww.sciencedomain.org
Predictive Models for Condensate Gas Ratio(CGR) – Part 1: For Western Niger Delta Region
S. S. Ikiensikimama1*, I. I. Azubuike1 and J. A. Ajienka1
1Department of Petroleum and Gas Engineering, University of Port Harcourt,Port Harcourt, Nigeria.
Authors’ contributions
Author JAA analyzed, verified and checked the quality of the data used in development ofthis model. Author IIA contributed in the area of literature review and development of the
model. Author SSI developed and interpreted the models. He also carried out the statisticalcomparison analysis. This work was proofread and accepted by all the authors before
submitted for publication.
Received 22nd April 2013Accepted 8th September 2013
Published 27th September 2013
ABSTRACT
Condensate-to-gas ratio (CGR) plays a significant role in sales potential assessment ofboth gas and liquid, design of the required surface processing facilities, reservoircharacterization and modeling in gas-condensate reservoirs. This work aim at the use ofregression method to develop Condensate gas ratio (CGR) correlations using datasetobtained from Western Niger Delta region. The formation was divided into three distinctgeologic zones: Transitional Paralic, Paralic and Marine Paralic zones. The basicparameters used for the correlation development are: reservoir depth (ft), reservoirpressure (psia); reservoir temperature (oF) all at (Gas – Oil – Contact (GOC) / Gas –Down – To (GDT) / Gas – Water – Contact (GWC)) and these parameters are data easilyobtained from the field. A statistical assessments show that the models predicted CGRwith a percent mean absolute error of 19.5640, correlation coefficient of 0.9539 and arank of 18.15. These results show that the models are suitable for these fields.
Keywords: Condensate to gas ratio; correlation; regression; gas condensate.
Research Article
British Journal of Applied Science & Technology, 3(4): 1533-1547, 2013
1534
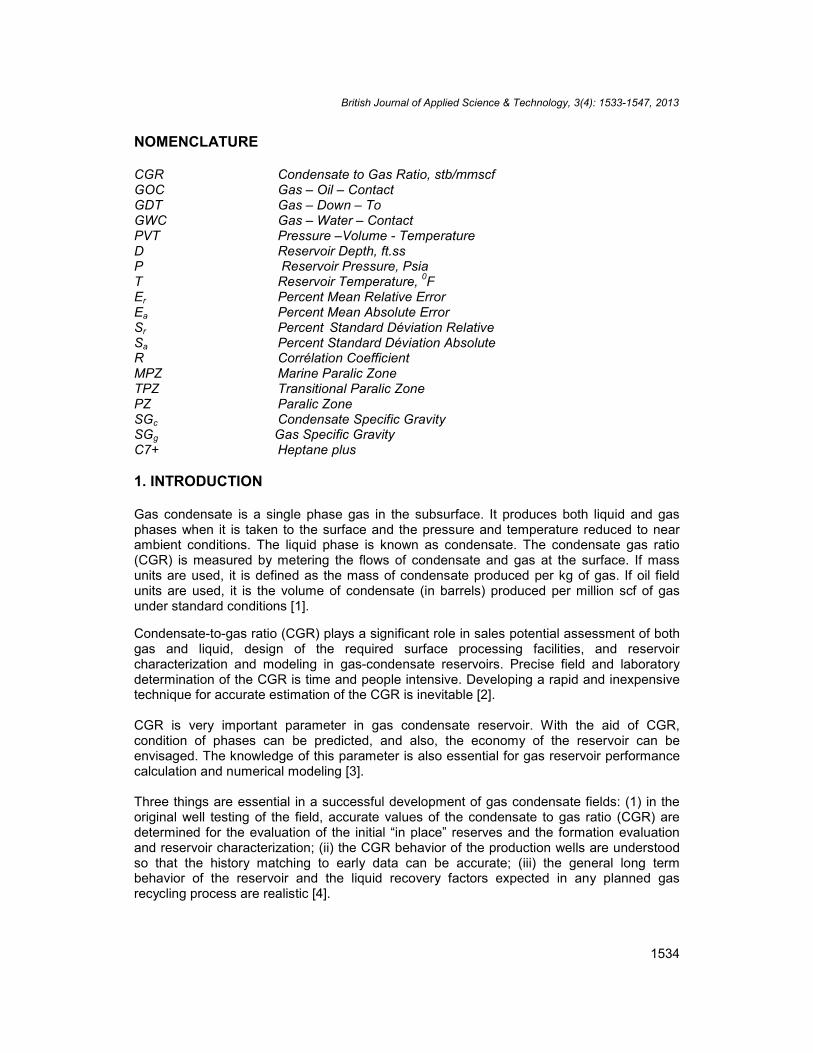
NOMENCLATURE
CGR Condensate to Gas Ratio, stb/mmscfGOC Gas – Oil – ContactGDT Gas – Down – ToGWC Gas – Water – ContactPVT Pressure –Volume - TemperatureD Reservoir Depth, ft.ssP Reservoir Pressure, PsiaT Reservoir Temperature, 0FEr Percent Mean Relative ErrorEa Percent Mean Absolute ErrorSr Percent Standard Déviation RelativeSa Percent Standard Déviation AbsoluteR Corrélation CoefficientMPZ Marine Paralic ZoneTPZ Transitional Paralic ZonePZ Paralic ZoneSGc Condensate Specific GravitySGg Gas Specific GravityC7+ Heptane plus
1. INTRODUCTION
Gas condensate is a single phase gas in the subsurface. It produces both liquid and gasphases when it is taken to the surface and the pressure and temperature reduced to nearambient conditions. The liquid phase is known as condensate. The condensate gas ratio(CGR) is measured by metering the flows of condensate and gas at the surface. If massunits are used, it is defined as the mass of condensate produced per kg of gas. If oil fieldunits are used, it is the volume of condensate (in barrels) produced per million scf of gasunder standard conditions [1].
Condensate-to-gas ratio (CGR) plays a significant role in sales potential assessment of bothgas and liquid, design of the required surface processing facilities, and reservoircharacterization and modeling in gas-condensate reservoirs. Precise field and laboratorydetermination of the CGR is time and people intensive. Developing a rapid and inexpensivetechnique for accurate estimation of the CGR is inevitable [2].
CGR is very important parameter in gas condensate reservoir. With the aid of CGR,condition of phases can be predicted, and also, the economy of the reservoir can beenvisaged. The knowledge of this parameter is also essential for gas reservoir performancecalculation and numerical modeling [3].
Three things are essential in a successful development of gas condensate fields: (1) in theoriginal well testing of the field, accurate values of the condensate to gas ratio (CGR) aredetermined for the evaluation of the initial “in place” reserves and the formation evaluationand reservoir characterization; (ii) the CGR behavior of the production wells are understoodso that the history matching to early data can be accurate; (iii) the general long termbehavior of the reservoir and the liquid recovery factors expected in any planned gasrecycling process are realistic [4].
British Journal of Applied Science & Technology, 3(4): 1533-1547, 2013
1535
Moreover, condensate liquid components have been more valuable than the gas, because ofeasy transportation especially in the places far from gas market or transport system [5]. As aresult, understanding nonlinear and complex behavior of gas condensate reservoir is veryimportant and also its one of the most difficult, onerous and challenging problem inpetroleum reservoir engineering [6]. On the other hand behavior of gas condensate reservoiris mainly controlled by fluid properties and accurate knowledge of these PVT characteristics[7].
Gas condensates are becoming increasingly important throughout the world but the gascondensate reservoir behavior is complex and is not yet wholly understood. However, effortshave been made by Dawe and Grattoni [8] to explain gas condensate reservoir behaviorthrough detailed mechanisms such as visualization of pore-scale phase flow mechanisms togive an insight to fluid displacements at the core scale and help the interpretation ofproduction behavior at reservoir scale. Thomas et al. [9] also worked on optimizingproduction from a gas condensate reservoir and Cho et al. [10] developed a correlation topredict maximum condensation for retrograde condensation fluids and its use in pressuredepletion calculations. Also, an approach for forecasting viability of gas condensate wellsand predicting Condensate Gas Ratio (CGR) using reservoir volumetric balance has beendeveloped, Olaberinjo et al. [11].
CGR can be calculated using three methods; experimental data, equation of states andcorrelations. By using PVT tests, CGR can be measured but reservoir fluid samples areneeded. Sampling of the gas condensate reservoir has its problems. As a result obtainingCGR from experimental data is expensive, complex, energy and time consuming [2].
Some of the literature cited earlier, were directed at explaining gas condensate reservoirbehavior, and noted that much work has not been done in the area of correlationdevelopment for gas condensate reservoirs. It was also clear that no correlation exist for gascondensate reservoirs for the Niger Delta in the open literature. Therefore, this work is aimedat developing Condensate Gas Ratio (CGR) correlations using datasets obtained fromWestern Niger Delta region via regression method. It will also be necessary to note thatmodels using the correlating parameters of this study are not available in the (open)literature to make easy comparison and very scarce and limited data are available on thissubject in the region.
2. REPORT VALIDATION/ DATA SOURCE
All the PVT reports used were validated using the basic validation techniques of Campbellplots and Material balance diagrams. 48 PVT report that met validation requirements wereused.
Gas condensate reservoir PVT data from different fields in the Western Niger Delta wereused. These are:- Delta State, Western Bayelsa: Bomadi, Burutu and Nun areas of oilfieldsoperations in the region were put together. Table 1 shows the distribution of the validatedPVT reports used for the study in terms of geologic zones. Table 2 shows the datadistribution use for the work (see Appendix for comprehensive data).

British Journal of Applied Science & Technology, 3(4): 1533-1547, 2013
1536
Table 1. Distribution of PVT reports used in this study
Geologic Zones Reservoir FieldsTransitional Paralic 21 7Paralic 11 8Marine Paralic 24 5Total 46
Table 2. Data range used for the development of the correlations
GeologicZones
Pressure(psia)(@GOC/GDT/GWC)
Depth, D(ft)(@GOC/GDT/GWC)
Temp (oF)(@GOC/GDT/GWC)
CGR(stb/MMscf)
TransitionalParalic
3226 - 4284 7292 - 9802 138 - 209 1.37 - 46.39
Paralic 4387 - 4953 10074 - 11256 153 - 272 10.8 - 62.76MarineParalic
4861 - 8356 11541 - 12620 196 - 223 6.75 - 127.8
3. DATA ORGANIZATION AND CORRELATION PERFORMANCE EVALUATION(ZONING OF THE FORMATION)
Most of the condensate reservoirs are found in the Paralic zone [12] (much of the Agbadaformation) between 6,000 and 18,000 ft. and correlating all data obtained for condensatereservoirs show some level of complexity and gave no recognizable pattern. It was thennecessary to adopt a procedure of dividing this formation into three distinct geologic zones -Transitional Paralic (6,330 – 9,999 ft.ss), Paralic (10,000 – 11,499 ft.ss) and Marine Paralic(11,500 – 16,500 ft.ss) respectively.
4. CORRELATIONS/MODELS DEVELOPMENT
Fundamentally, three correlations were developed. The basic parameters used for thecorrelation development are (see Table 2): reservoir depth (ft), reservoir pressure (psia);reservoir temperature (ºF) (all @ GOC/GDT/GWC). These parameters are easily obtainablefrom the field; this gave the reason for their choice.
4.1 Correlating Parameters
The Model as shown in Equation 1 was developed using linear and non-linear multipleregression analysis with non-linear least square curve fits via MATLAB [13] sessions with thein-built Microsoft Excel Solver functionalities in Microsoft Excel Application [14]. Regressionequation as given by Equation 1 with CGR as a function of P, D and T was derived for eachzone. Owing to the limited amount of data in each zone (see Table 1), the best regressionequation was derived by using one condensate reservoir as a control data point whilegenerating a regression equation from the remaining data. The regression equation soobtained is used to estimate the CGR of the control reservoir data. The estimate is thencompared to the CGR of the PVT report. The regression equation who’s estimated CGR forthe control has the minimum deviation from the measured PVT value is selected as the bestequation.

British Journal of Applied Science & Technology, 3(4): 1533-1547, 2013
1537
4.2 CGR as function of Dept (D), Pressure (P) and Temperature (T)
Several models were tried for the CGR correlation using only easily obtainable parameterssuch as depth, reservoir pressure and reservoir temperature. However, the best model wasobtained using a 3-parameter correlation for CGR as a function of D, P, and T given byEquation 1. The coefficients of Equation 1 are given in Table 3 for the Transitional Paralic(TP), Paralic (P) and Marine Paralic (MP) Zones.
43243
2432
1312111098
7654321
TXTXTXTXDXDX
DXDXPXPXPXPXXCGR
(1)
WhereP = Reservoir pressure at GOC/GWC/GDT (psia)D = Reservoir depth at GOC/GWC/GDT (ft. ss.)T = Reservoir temperature (oF)X1 to X13 are coefficients of the model.
This model actually is similar to an in-house model use for some other studies, but thecoefficients were optimized such that it gave the model flexibility to give better predictionspossible. The model took the form of a fourth order polynomial for the depth (D), reservoirpressure (P) as well as reservoir temperature (T).
Table 3. Coefficients for Developed Correlation
5. QUANTITATIVE AND QUALITATIVE SCREENING
Different authors have used different statistical measures to choose the best correlationdeveloped. Some have used percent Mean Relative Error (MRE), percent Relative StandardDeviation (SDR) [15] and coefficient of determination (R2) as the criteria to choose [16] whileothers used percent Mean Absolute Error (MAE) and percent Absolute Standard Deviation(SDA) with or without performance plot [17,18].
3 –parameter ModelsVariables Transitional Paralic Zone Paralic Zone Marine Paralic ZoneX1 6.0870844602000 E04 1.4913197869499 E06 3.7155404208897 E08X2 -2.8284399437000 E02 1.0167040445870 E03 -2.60320652925947 E05X3 1.1690515217857 E-01 9.2124506870644 E02 7.5156717039050 E01X4 -2.1373616911844 E-05 -6.9466028549798 E05 -9.63697790639015 E-03X5 1.458371612461 E-09 6.5506494481022 E-09 4.6306880586121 E-07X6 1.0708930138388 E02 -1.0619224161765E-03 1.7144411586871 E04X7 -1.9393478658181 E-02 7.41248838581947 E-02 -2.4015736387775X8 1.5524148249463 E-06 -2.77556669551227 E-07 1.4743846845262 E-04X9 -4.6343400333374 E-11 -8.7716144942317 E-11 -3.3561612216975 E-09X10 -6.2695708581095 E02 1.4252356335767 E03 -1.4865931268216 E06X11 5.6162835619106 -9.9058335168366 1.0516705270328 E04X12 -2.2157109070268 E-02 3.0472025288091 E-02 -3.3045848907682 E01X13 3.25016027846853 E-05 -3.49387943673943 E-05 3.8915288290495 E02
British Journal of Applied Science & Technology, 3(4): 1533-1547, 2013
1538
Al-Marhoun [19], pointed out that the most important indicator of the accuracy of an empiricalcorrelation is the percent MAE; having assessed different combinations of available criteriafound in the literature, it became clear that no one parameter is outstanding to be used inmaking the choice and that these different independent assessments are not sufficient tomake an excellent choice. Therefore, to make a brilliant selection multiple combinations ofthese statistical parameters should be adopted in the selection criteria of the developedcorrelations. To compare the performance and accuracy of the new models, two forms ofanalysis were performed which include quantitative and qualitative. For quantitativescreening method, statistical error analysis was used. The statistical parameters used for theassessment were percent mean relative error (Er), percent mean absolute error (Ea), percentstandard deviation relative (Sr), percent standard deviation absolute (Sa) and correlationcoefficient (R).
The new approach, combines all the statistical parameters mentioned earlier (Er, Ea, Sr, Saand R) into a single comparable parameter called Rank [20,21,22]. The use of multiplecombinations of statistical parameters in selecting the best correlation can be modeled as aconstraint optimization problem with the function formulated as;
m
jjijii qSZMin
1,, (2)
Subject to
n
ijiS
1, 1 (3)
With 10 , jiS (4)
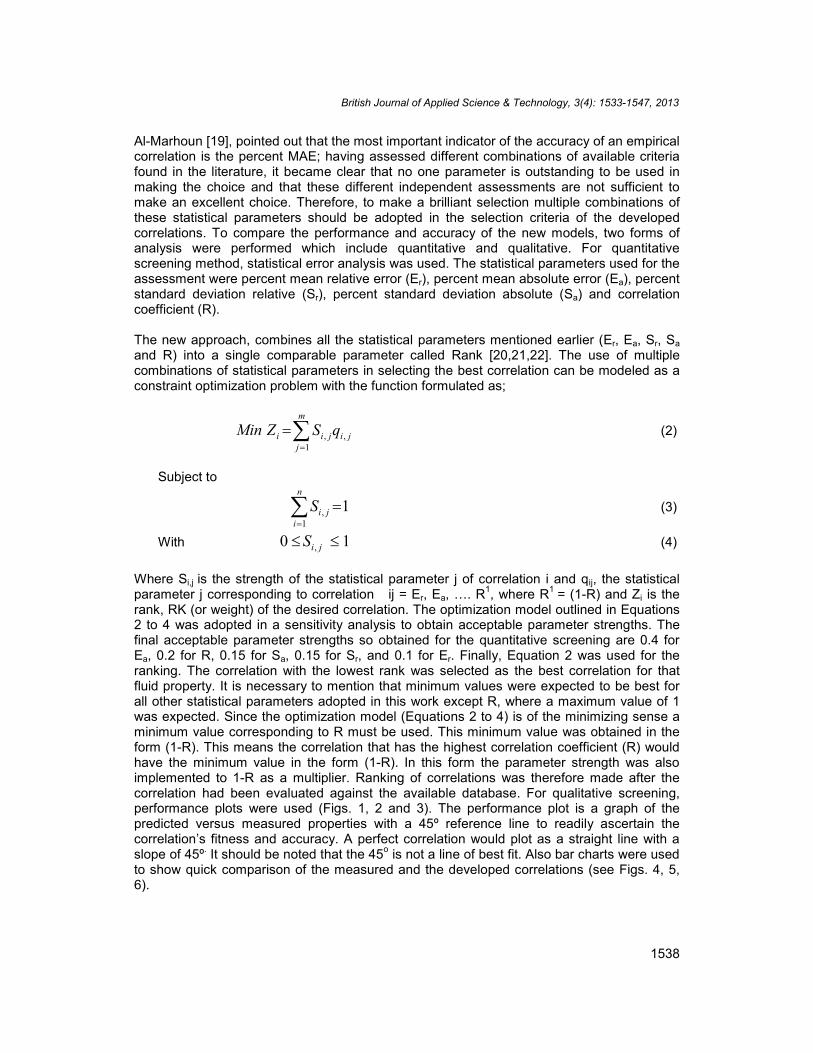
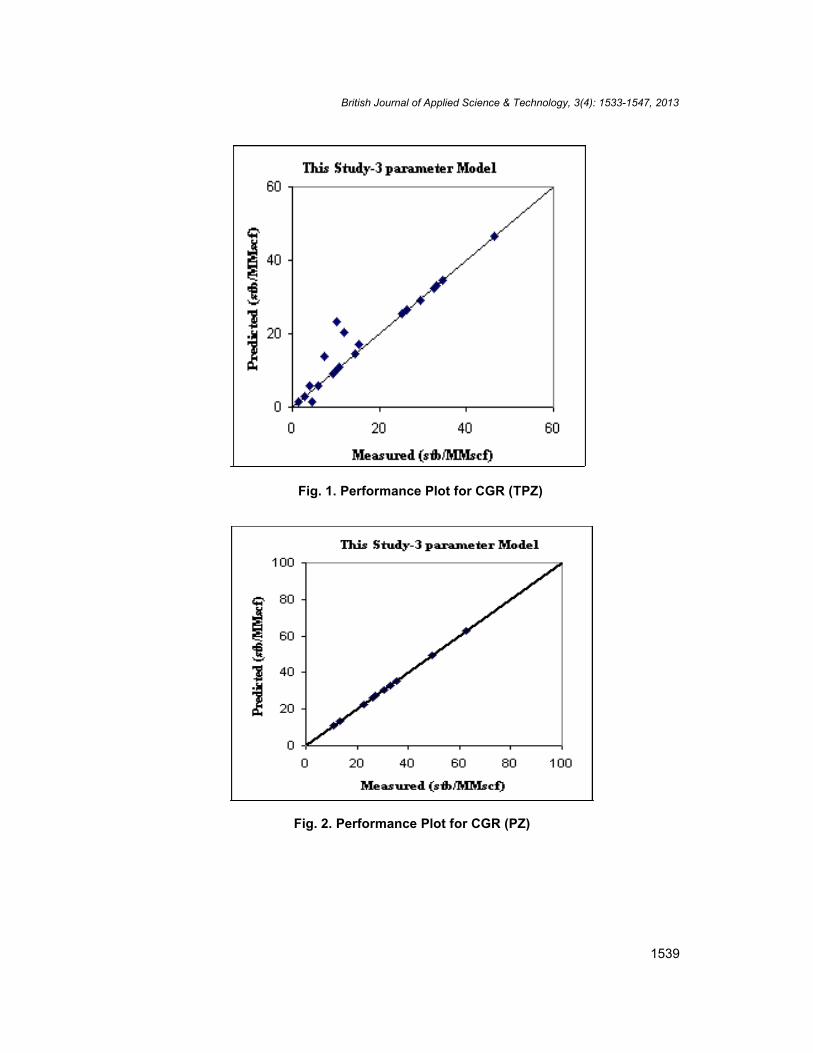
Where Si,j is the strength of the statistical parameter j of correlation i and qij, the statisticalparameter j corresponding to correlation ij = Er, Ea, …. R1, where R1 = (1-R) and Zi is therank, RK (or weight) of the desired correlation. The optimization model outlined in Equations2 to 4 was adopted in a sensitivity analysis to obtain acceptable parameter strengths. Thefinal acceptable parameter strengths so obtained for the quantitative screening are 0.4 forEa, 0.2 for R, 0.15 for Sa, 0.15 for Sr, and 0.1 for Er. Finally, Equation 2 was used for theranking. The correlation with the lowest rank was selected as the best correlation for thatfluid property. It is necessary to mention that minimum values were expected to be best forall other statistical parameters adopted in this work except R, where a maximum value of 1was expected. Since the optimization model (Equations 2 to 4) is of the minimizing sense aminimum value corresponding to R must be used. This minimum value was obtained in theform (1-R). This means the correlation that has the highest correlation coefficient (R) wouldhave the minimum value in the form (1-R). In this form the parameter strength was alsoimplemented to 1-R as a multiplier. Ranking of correlations was therefore made after thecorrelation had been evaluated against the available database. For qualitative screening,performance plots were used (Figs. 1, 2 and 3). The performance plot is a graph of thepredicted versus measured properties with a 45º reference line to readily ascertain thecorrelation’s fitness and accuracy. A perfect correlation would plot as a straight line with aslope of 45º. It should be noted that the 45o is not a line of best fit. Also bar charts were usedto show quick comparison of the measured and the developed correlations (see Figs. 4, 5,6).
British Journal of Applied Science & Technology, 3(4): 1533-1547, 2013
1539
Fig. 2. Performance Plot for CGR (PZ)
Fig. 1. Performance Plot for CGR (TPZ)
British Journal of Applied Science & Technology, 3(4): 1533-1547, 2013
1540
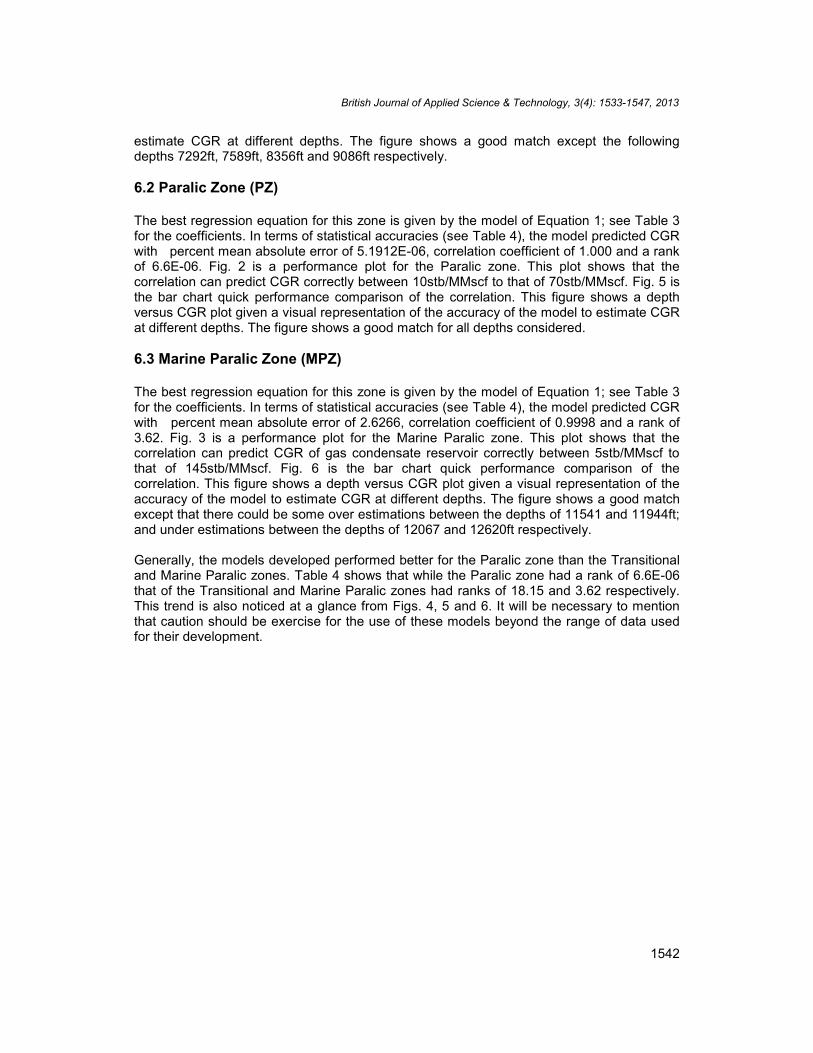
Fig. 4. Performance plot of CGR versus Depth (3-p Correlations) – (TPZ)
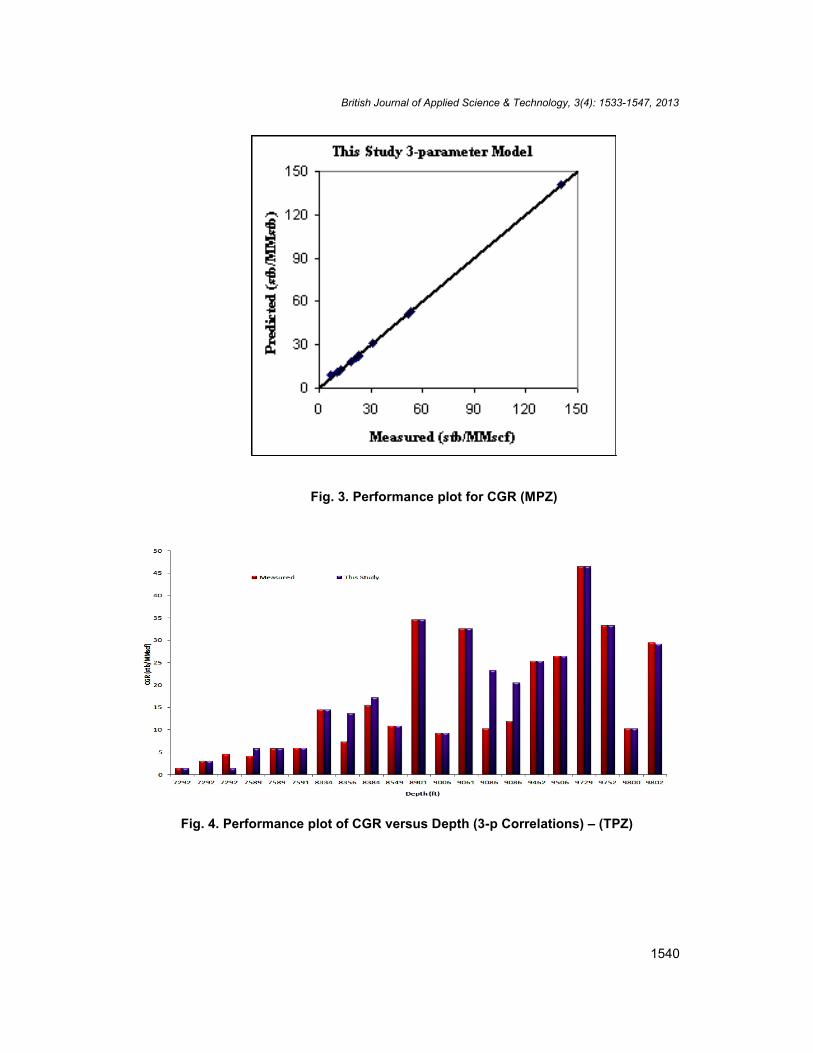
Fig. 3. Performance plot for CGR (MPZ)

British Journal of Applied Science & Technology, 3(4): 1533-1547, 2013
1541
Fig. 5. Performance plot of CGR versus Depth (3-p Correlations) – (PZ)
Fig. 6. Performance plot of CGR versus Depth (3-p Correlations) – (MPZ)
6. RESULTS AND DISCUSSION
6.1 Transitional Paralic Zone (TPZ)
The best regression equation for this zone is given by the model of Equation 1; see Table 3for the coefficients. In terms of statistical accuracies (Table 4), the model predicted CGR withpercent mean absolute error of 19.5640, correlation coefficient of 0.9539 and a rank of18.15. Fig. 1 is a performance plot for the Transitional Paralic zone. This plot shows that thecorrelation can predict CGR correctly between 1stb/MMscf to that of 55stb/MMscf. However,between 10stb/MMscf and 18stb/MMscf, there could be some over estimations of the CGRvalues. Fig. 1 is the bar chart quick performance comparison of the correlation. This Fig. 4shows a depth versus CGR plot given a visual representation of the accuracy of the model to
British Journal of Applied Science & Technology, 3(4): 1533-1547, 2013
1542
estimate CGR at different depths. The figure shows a good match except the followingdepths 7292ft, 7589ft, 8356ft and 9086ft respectively.
6.2 Paralic Zone (PZ)
The best regression equation for this zone is given by the model of Equation 1; see Table 3for the coefficients. In terms of statistical accuracies (see Table 4), the model predicted CGRwith percent mean absolute error of 5.1912E-06, correlation coefficient of 1.000 and a rankof 6.6E-06. Fig. 2 is a performance plot for the Paralic zone. This plot shows that thecorrelation can predict CGR correctly between 10stb/MMscf to that of 70stb/MMscf. Fig. 5 isthe bar chart quick performance comparison of the correlation. This figure shows a depthversus CGR plot given a visual representation of the accuracy of the model to estimate CGRat different depths. The figure shows a good match for all depths considered.
6.3 Marine Paralic Zone (MPZ)
The best regression equation for this zone is given by the model of Equation 1; see Table 3for the coefficients. In terms of statistical accuracies (see Table 4), the model predicted CGRwith percent mean absolute error of 2.6266, correlation coefficient of 0.9998 and a rank of3.62. Fig. 3 is a performance plot for the Marine Paralic zone. This plot shows that thecorrelation can predict CGR of gas condensate reservoir correctly between 5stb/MMscf tothat of 145stb/MMscf. Fig. 6 is the bar chart quick performance comparison of thecorrelation. This figure shows a depth versus CGR plot given a visual representation of theaccuracy of the model to estimate CGR at different depths. The figure shows a good matchexcept that there could be some over estimations between the depths of 11541 and 11944ft;and under estimations between the depths of 12067 and 12620ft respectively.
Generally, the models developed performed better for the Paralic zone than the Transitionaland Marine Paralic zones. Table 4 shows that while the Paralic zone had a rank of 6.6E-06that of the Transitional and Marine Paralic zones had ranks of 18.15 and 3.62 respectively.This trend is also noticed at a glance from Figs. 4, 5 and 6. It will be necessary to mentionthat caution should be exercise for the use of these models beyond the range of data usedfor their development.
British Journal of Applied Science & Technology, 3(4): 1533-1547, 2013
1543
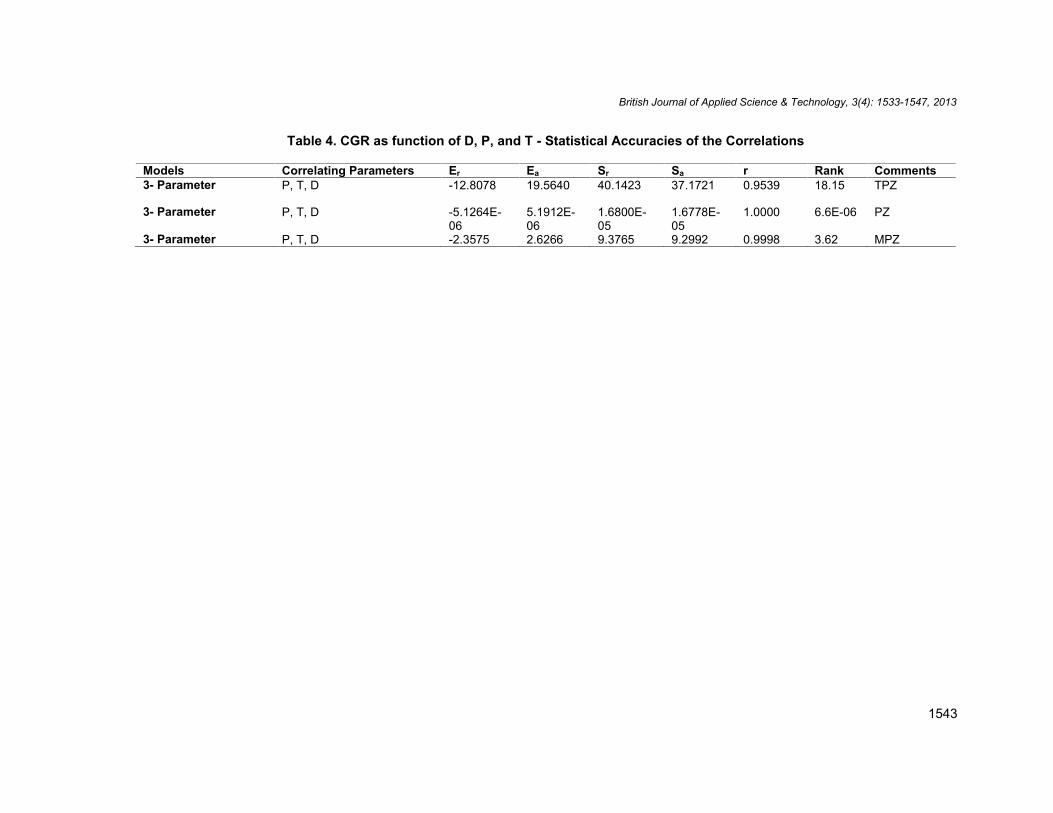
Table 4. CGR as function of D, P, and T - Statistical Accuracies of the Correlations
Models Correlating Parameters Er Ea Sr Sa r Rank Comments3- Parameter P, T, D -12.8078 19.5640 40.1423 37.1721 0.9539 18.15 TPZ
3- Parameter P, T, D -5.1264E-06
5.1912E-06
1.6800E-05
1.6778E-05
1.0000 6.6E-06 PZ
3- Parameter P, T, D -2.3575 2.6266 9.3765 9.2992 0.9998 3.62 MPZ
British Journal of Applied Science & Technology, 3(4): 1533-1547, 2013
1544
7. CONCLUSIONS
Predictive CGR models have been developed for the Niger Delta for the Western operationsof oilfields in the region using different models for three predefined geological zones– theTransitional Paralic, Paralic and Marine Paralic zones with easily available field data. Bothquantitative and qualitative assessments show that the models are very impressive withgood statistical parameters, good ranks and better performance plots.
COMPETING INTERESTS
Authors declare that there are no competing interests.
REFERENCES
1. Tarek A. Reservoir Engineering Hand Book” Copyright, Elsevier Inc. Gulf Publishing.30 Corporate Drive. Suite 400. Burlington, MA 01803, USA. 2006;7-13.
2. Mohammad E, Mohammad AA, Shahab G, Reza A. Application of A Fuzzy DecisionTree Analysis for Prediction Condensate Gas Ratio. International Journal of ComputerApplications, New York, USA. 2012;39(8):23-28.
3. Elsharkawy AM. Characterization of the Plus Fraction and Prediction of the DewpointPressure for Gas Condensate Reservoirs. Paper SPE 68776 presented at the SPEWestern Regional Meeting, Bakers-field, California; 2001. DOI: 10.2118/68776-MS
4. Wheaton RJ, Zhang HR. Condensate Banking Dynamics in Gas Condensate Fields:Compositional Changes and Condensate accumulation around production wells” SPEpaper 62930 presented at the SPE Annual Technical Conference and Exhibition, 1-4Oct. Dallas, USA; 2000.
5. Fan Li, Harris Billy W, Jamaluddin AJ, Kamath Jairam, Mott Robert, Pope Gary A,Shandygin Alexander, Whitson CH. Understanding Gas- Condensate Reservoirs”,Oilfield Review. 2005;17(4):14-27
6. Eissa M, Shokri El-M. Dewpoint Pressure Model for Gas Condensate ReservoirsBased on Genetic Programming, CIPC/SPE Gas Technology Symposium 2008 JointConference, Calgary, Alberta, Canada, 16-19 June; 2008.
7. Savary D. Gas Condensate Reservoir Evaluation Using an Equation of State PVTPackage. Middle East Oil Show, Bahrain, 16-19 November; 1990.
8. Dawe RA, Grattoni CA. Fluid flow behavior of gas-condensate and near-miscible fluidsat pore scale. Journal of Petroleum Science and Engineering; 2007.
9. Thomas FB, Bennion DW, Zhou XL. Towards optimizing gas condensate reservoir.Petroleum Society of CIM and CANMET. 1995;95-09.
10. Cho SJ, Civan F, Starling KE. A correlation to predict maximum condensation forretrograde condensation fluids and its use in pressure depletion calculations. SPEPaper 14268; 1985.
11. Olaberinjo AF, Oyewola MO, Obiyemi OA, Adeyanju OA, Adaramola MS. KPIM ofGas/Condensate Productivity: Prediction of Condensate/Gas Ratio Using ReservoirVolumetric Balance. Journal of Applied Sciences. 2006;6(15):3068-3074.
12. Reynolds T. Paralic Oil and Gas Fields - What Makes Them Distinctive: From the PoreScale to the Reservoir Scale. Distinguished lecture series - The American Associationof Petroleum Geologists; 2005.Available:(http://www.searchanddiscovery.com/documents/abstracts/2005Distinguished%20Lectures/reynolds02/reynolds02.HTM (25/03/13).

British Journal of Applied Science & Technology, 3(4): 1533-1547, 2013
1545
13. Palm WJ. Introduction to Matlab 6 for Engineers, McGraw-Hill Publishing Co. Inc.,New York; 1998.
14. Person R. Using EXCEL Version 5 for Windows, Que Corp., Indianapolis, Indiana;1997.
15. Ostermann RD, Ehlig-Economides CA, Owolabi OO. Correlation for the Reservoir FluidProperties of Alaskan Crudes” (SPE paper 11703), presented at the 1983 SPECalifornian Regional Meeting Ventura. 1983;23-25:357–368.
16. Obomanu DA, Okpobori GA. Correlating the PVT Properties of Nigerian Crudes.Trans. ASME. 1987;109:214-24.
17. De Ghetto G, Paone F, Villa M. Reliability Analysis on PVT Correlation” (SPE paper28904), presented at the European Petroleum Conference held in London, UK.1994;26-27:375-389.
18. Kartoatmodjo T, Schmidt Z. New Correlations for Crude Oil Physical Properties” (SPEpaper 23556), (Unsolicited). 1991;1–11.
19. Al-Shammasi AA. A Review of Bubblepoint Pressure and Oil Formation Volume FactorCorrelations” (SPE paper 71302) SPE Reservoir Evaluation & Engineering. 2001;146-160.
20. Al-Marhoun MA. The Coefficient of Isothermal Compressibility of Black Oils” (SPEpaper 81432) Paper prepared for presentation at the SPE 13th Middle East Oil Show &Conference to be held in Bahrain. 2003;5-8:1-7.
21. Ikiensikimama SS, Egbe T, Effiong EU, Ogboja O. New Screening Technique for PVTCorrelations as Applied to the Niger Delta Crude,” Refereed Proceedings, Paper SPE119710. 32nd Annual International Conference of the SPE Nigerian Council, 4-6thAugust 2008, Abuja, Nigeria; 2008.
22. Ikiensikimama SS. Reservoir Fluid Property Correlations. Advances in PetroleumEngineering, Chi Ikoku Petroleum Engineering series; PEEKAY Productions, PortHarcourt, Rivers State, Nigeria. 2009;354.

British Journal of Applied Science & Technology, 3(4): 1533-1547, 2013
1546
Appendix
Correlation development Data
TRANSITIONAL PARALICZONE
FIELD Area SGg P D T CGRPsia ft.ss oF Stb/mmscfat GOC/GDT/GWC
TRANS 1 W 0.572 3240 7292 140 1.37TRANS 2 W 0.595 3238 7292 138 2.94TRANS 3 W 0.582 3935 9006 155 9.24TRANS 4 W 0.578 3240 7292 140 4.47TRANS 5 W 0.620 3369 7589 147 4.07TRANS 6 W 0.608 3370 7591 147 5.86TRANS 7 W 0.620 3369 7589 147 5.81TRANS 8 W 0.641 3932 9800 151 10.22TRANS 9 W 0.671 3916 9086 156 10.22TRANS 10 W 0.603 3928 9086 156 11.90TRANS 11 W 0.695 3675 8356 162 7.29TRANS 12 W 0.630 3570 8384 179 15.41TRANS 13 W 0.664 3549 8549 156 10.81TRANS 14 W 0.680 3226 9061 178 32.50TRANS 15 W 0.600 4142 9506 163 26.40TRANS 16 W 0.693 3673 8334 163 14.46TRANS 17 W 0.680 3827 8901 177 34.50TRANS 18 W 0.630 4102 9462 204 25.29TRANS 19 W 0.650 4284 9802 151 29.41TRANS 20 W 0.667 4241 9752 206 33.19TRANS 21 W 0.670 4240 9729 209 46.39
British Journal of Applied Science & Technology, 3(4): 1533-1547, 2013
1547
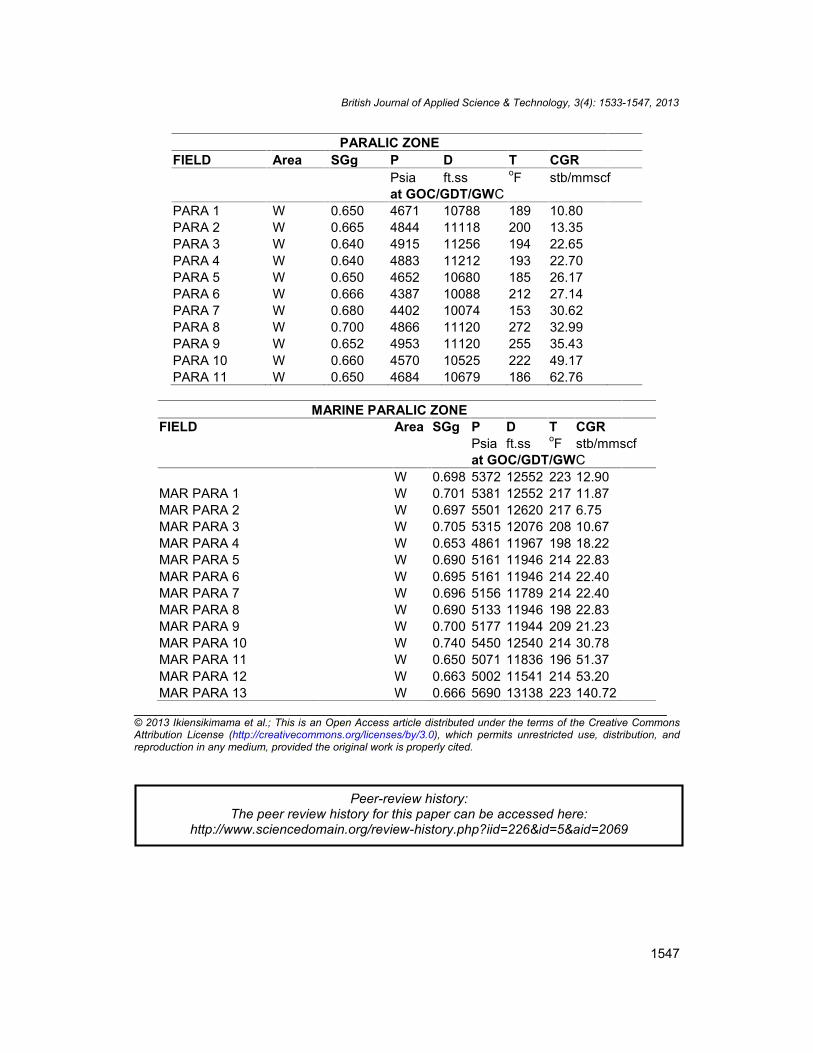
PARALIC ZONEFIELD Area SGg P D T CGR
Psia ft.ss oF stb/mmscfat GOC/GDT/GWC
PARA 1 W 0.650 4671 10788 189 10.80PARA 2 W 0.665 4844 11118 200 13.35PARA 3 W 0.640 4915 11256 194 22.65PARA 4 W 0.640 4883 11212 193 22.70PARA 5 W 0.650 4652 10680 185 26.17PARA 6 W 0.666 4387 10088 212 27.14PARA 7 W 0.680 4402 10074 153 30.62PARA 8 W 0.700 4866 11120 272 32.99PARA 9 W 0.652 4953 11120 255 35.43PARA 10 W 0.660 4570 10525 222 49.17PARA 11 W 0.650 4684 10679 186 62.76
MARINE PARALIC ZONEFIELD Area SGg P D T CGR
Psia ft.ss oF stb/mmscfat GOC/GDT/GWC
W 0.698 5372 12552 223 12.90MAR PARA 1 W 0.701 5381 12552 217 11.87MAR PARA 2 W 0.697 5501 12620 217 6.75MAR PARA 3 W 0.705 5315 12076 208 10.67MAR PARA 4 W 0.653 4861 11967 198 18.22MAR PARA 5 W 0.690 5161 11946 214 22.83MAR PARA 6 W 0.695 5161 11946 214 22.40MAR PARA 7 W 0.696 5156 11789 214 22.40MAR PARA 8 W 0.690 5133 11946 198 22.83MAR PARA 9 W 0.700 5177 11944 209 21.23MAR PARA 10 W 0.740 5450 12540 214 30.78MAR PARA 11 W 0.650 5071 11836 196 51.37MAR PARA 12 W 0.663 5002 11541 214 53.20MAR PARA 13 W 0.666 5690 13138 223 140.72
________________________________________________________________________© 2013 Ikiensikimama et al.; This is an Open Access article distributed under the terms of the Creative CommonsAttribution License (http://creativecommons.org/licenses/by/3.0), which permits unrestricted use, distribution, andreproduction in any medium, provided the original work is properly cited.
Peer-review history:The peer review history for this paper can be accessed here:
http://www.sciencedomain.org/review-history.php?iid=226&id=5&aid=2069