preface - f01. web view03/09/2014 · for example, the gross profit percentage increased...
TRANSCRIPT

Tilly Owusuwaa: Summer, Pendarvis
Note to the user:
This Word document provides a structured template for preparing your responses to the
questions in the annual report project. If you did not purchase the workbook you are not permitted
to use this template.
INTRODUCTION TO THE CORPORATE ANNUAL REPORT:
A Business Application with IFRS Content
4th edition
Copyright 2015 by Applied Accounting Analytics. All rights reserved. Reproduction or translation of this book beyond that permitted by the applicable copyright law without Applied Accounting Analytics’ permission is prohibited.
1
Tilly Owusuwaa: Summer, Pendarvis
To be completed by the student and submitted with the completed annual report project according to your instructor’s requirements.
Complete the following before you submit your assignment. This step is required to
validate your compliance with sections 107 or 108 of the 1976 United States Copyright
Act.
1. Remove the front cover of the workbook and identify:
Student Name: Tilly Owusuwaa
Term: Summer
Selected Company: Click here to enter text.
Instructor: Pendarvis
2. Print out your completed electronic template.
3. Attach the following:
This front cover (completed) Electronic solution template Printed reports as specified by the instructions that immediately follow
Chapter 1: Select a Company and Gather Documents – Question 1
2
Tilly Owusuwaa: Summer, Pendarvis
CHAPTER 1 - INTRODUCTIONSelect a Company and Gather Documents
Chapter 1: Select a Company and Gather Documents—Question 1
Identify with an “X” the primary source of data for this project.
Example for The Home Depot 2013 Annual Report: http://www.homedepotar.com/
Click here to enter
text.Annual report to shareholders
Click here to enter
text.Annual report to shareholders with a letter from Chief Executive Officer and SEC Form 10-K as part of the annual report to shareholders.
Click here to enter
text.SEC Form 10-K and the company website.
Fill in the page numbers from the annual report where the following are located.
Required information for this workbook project.
Page No.
Required information for this workbook project.
Page No.
Financial Highlights Click here to enter text.
Chief Executive Officer Letter Click here to enter text.
Management’s Discussion and Analysis (MD&A) Click
here to enter text.
Notes to Financial Statements Click here to enter text.
Income Statement Click here to enter text.
Report of Independent Accountants or Independent
Auditors’ Report
Click here to enter text.
Balance Sheet Click Five- or Ten-Year Summary of Click
3

Tilly Owusuwaa: Summer, Pendarvis
here to enter text.
Operating Results here to enter text.
Statement of Change in Stockholder’s Equity
Click here to enter text.
Management’s Report (Responsibility) on Internal
Control over Financial Reporting
Click here to enter text.
Statement of Cash Flows Click here to enter text.
Investor and Company Information or Shareholder
Information
Click here to enter text.
Identify Why You Selected This CompanyChapter 1: Identify Why You Selected This Company – Question 1
A) What is/are your motivation(s) or interest(s) in selecting this company? [See above for examples.]
B) What question(s) are you seeking to answer? [For example, is the company profitable? Can the company change and develop new products and services to be competitive? Would I invest in this company? Will the company provide rewarding career opportunities? In chapter 5 you will have pulled together the financial and nonfinancial information to answer these question(s).]
A)
Click here to enter text.
B)
Click here to enter text.
Company and Annual Report EssentialsChapter 1: Company and Annual Report Essentials – Question 1
What is the company’s complete name?
4

Tilly Owusuwaa: Summer, Pendarvis
Click here to enter text.
Chapter 1: Company and Annual Report Essentials – Question 2
What is the address of your company’s corporate headquarters?
Click here to enter text.
Chapter 1: Company and Annual Report Essentials – Question 3
Identify the company’s website address.
Click here to enter text.
Chapter 1: Company and Annual Report Essentials – Question 4
Identify the telephone number and e-mail address of the company’s Investor Relations Department.
Click here to enter text. Click here to enter text.
Chapter 1: Company and Annual Report Essentials – Question 5
Which stock exchange lists your company?
Click here to enter text.
Chapter 1: Company and Annual Report Essentials – Question 6
What is your company’s stock exchange trading symbol?
Click here to enter text.
Chapter 1: Company and Annual Report Essentials – Question 7
What is your company’s Standard Industrial Classification (SIC) and sector? Run a search on “Standard Industrial Classification,” and the classification and code will be identified. Your company may list more than one SIC code numbers. The first listed is considered the primary SIC for the company.
For example, search – The Home Depot SIC – brings up a listing of sources. Once you locate this code, search on the Department of Labor website at https://www.osha.gov/pls/imis/sicsearch.html to find out more about your Company’s SIC.
5

Tilly Owusuwaa: Summer, Pendarvis
SIC Code: 5211Sector: Basic Materials, Construction, Retail
Industry: Lumber and other building materials
Click here to enter text.
Chapter 1: Company and Annual Report Essentials – Question 8
Locate the board of directors listing. How many board members does your company have?
Click here to enter text.
Chapter 1: Company and Annual Report Essentials – Question 9
How many of the directors are company employees, labeled inside directors? And how many are non-company directors, labeled outside directors? Why does a company want and need outside directors?(Inside and outside directors are typically identified as such by their title and company.)
Click here to enter text.
Chapter 1: Company and Annual Report Essentials – Question 10
Leadership addresses the stockholders, typically, once a year at the annual stockholders meeting. Identify where and when this occurred, as reported in your annual report.
Click here to enter text.
The previous series of questions provides basic company information. All are building blocks of a complete study of a company through the annual report.
Company Strategy and Business Environment
Chapter 1: Company Strategy and Business Environment – Question 1
Review the chairman’s message of your company’s annual report. Does it appear to be uplifting or somewhat apologetic? Identify phrases that support your position.
6

Tilly Owusuwaa: Summer, Pendarvis
Click here to enter text.
Chapter 1: Company Strategy and Business Environment – Question 2
Check below the one primary company strategy identified in the chairman’s message. Support your answer with phrases found in the chairman’s message that pointed you to the identified corporate strategy.
Growth: Vertical Click here to enter text. Horizontal___Click here to enter text. Concentric Click here to enter text. Conglomerate Click here to enter text. Stability Click here to enter text. Retrenchment Click here to enter text. .
Phrases to support your conclusion: Click here to enter text.
Chapter 1: Company Strategy and Business Environment – Question 3
Briefly summarize the company’s discussion found in Item 1 of SEC Form 10-K.
Type of business:
Click here to enter text.Major business segments:
Click here to enter text.
Primary customers:
Click here to enter text.
Primary products and/or services:
Click here to enter text.Other:
Click here to enter text.
Chapter 1: Company Strategy and Business Environment – Question 4
Identify broad-based social, political, economic, and technological concerns that may affect your company. Put N/A if one of the categories does not apply.
Social:
Click here to enter text.
7
Tilly Owusuwaa: Summer, Pendarvis
Political:
Click here to enter text.
Economic:
Click here to enter text.
Technological:
Click here to enter text.
Other:
Click here to enter text.
Wrap-up Chapter 1: Wrap-up – Question 1
After further review of additional information you should now be confident in identifying the one primary company strategy, beyond the insight provided by the chairman’s message?
Check below the one primary company strategy identified in the chairman’s message and all other supporting documents. Support your answer with phrases.
Growth: Vertical Click here to enter text. Horizontal Click here to enter text. Concentric Click here to enter text. Conglomerate Click here to enter text. Stability Click here to enter text. Retrenchment Click here to enter text. .
Phrases to support your conclusion from information gathered from the chairman’s message, Item 1 of the SEC Form 10-K and other insight gained from completing Chapter 1.
Click here to enter text.
8
Tilly Owusuwaa: Summer, Pendarvis
CHAPTER 2 - ANNUAL REPORT STRUCTUREFinancial Highlights
Chapter 2: Financial Highlights – Question 1
Review the financial highlights of your company’s annual report to the shareholders. Identify net sales or revenues, net income, basic earnings per share (BEPS), and total assets for the current and preceding years. These are the most common values included in financial highlights. If your company reports something different, simply cross out an item here and recap what is reported. SEC Form 10-K does not provide financial highlights. You may find this information on the company website. If not available put N/A in the first row of boxes.
Categories Current Year One Year Prior Two Years Prior
Net sales or revenues Click here to enter text.
Click here to enter text.
Click here to enter text.
Net income Click here to enter text.
Click here to enter text.
Click here to enter text.
Basic EPS Click here to enter text.
Click here to enter text.
Click here to enter text.
Total Assets Click here to enter text.
Click here to enter text.
Click here to enter text.
Based on your preliminary review, is your company performing better than, equal to, or less favorably than in the prior year? Briefly explain.
Click here to enter text.
General Company and Marketing InformationChapter 2: General Company and Marketing Information – Question 1
Look for pictures of product and people that are colorful and send a positive company signal to the reader.
Category
Example: Volunteer Activities
Message
Ongoing and contributing to the success of the community
Click here to enter text. Click here to enter text.
Click here to enter text. Click here to enter text.
Click here to enter text. Click here to enter text.
9
Tilly Owusuwaa: Summer, Pendarvis
Click here to enter text. Click here to enter text.
Click here to enter text. Click here to enter text.
What is the broader message from this information?
Click here to enter text.
Management’s Discussion and AnalysisChapter 2: Management’s Discussion and Analysis – Question 1
Results of Operations:
Identify the primary drivers/issues that explain current and future results of operations discussed in the MD&A. For example, the gross profit percentage increased because of improved buyer/supplier relations resulting in greater overall operating performance. Or an increase in operating expenses because of increased fuel costs reduced profits. List the six major drivers/issues of performance you find in the MD&A section of the annual report.
Click here to enter text.
Click here to enter text.
Click here to enter text.
Click here to enter text.
Click here to enter text.
Click here to enter text.
Liquidity:
Recap what you find about your company’s liquidity in the MD&A section of the annual report. Look for information about the ability of the company to satisfy short-term cash needs and the ability to generate operating cash flows, for example.
Click here to enter text.
Capital Resources:
Recap what you find about your company’s capital resources in the MD&A section of the annual report. Look for information about cash reserves and credit availability. For example, your company’s MD&A section may have a disclosure about an established line of credit to fund future growth.
Click here to enter text.
10
Tilly Owusuwaa: Summer, Pendarvis
Reports by ManagementChapter 2: Reports by Management – Question 1
Review the Management’s Report (Responsibility) on Internal Control over Financial Reporting in your company’s annual report. Answer the following questions.
Who is responsible for maintaining the internal controls designed to provide reasonable assurance that the books and records reflect the transactions of the company?
Click here to enter text.
Record the statement that identifies management’s conclusion about internal controls.
Click here to enter text.
Who audited management’s assessment of the effectiveness of your company’s internal control over financial reporting?
Click here to enter text.
Independent Auditors’ ReportChapter 2: Independent Auditors’ Report – Question 1
Review the Independent Auditors’ Report of your company’s annual report and answer the following questions.
Who was the company’s auditor and where is it located?
Click here to enter text.
What is the responsibility of the auditor?
Click here to enter text.
Who is responsible for the preparation of and information within the company’s financial statement?
Click here to enter text.
The audit was conducted in accordance with what?
Click here to enter text.
What was the opinion of the auditor?
Click here to enter text.
11
Tilly Owusuwaa: Summer, Pendarvis
Five- or Ten-Year Summary of Operating ResultsChapter 2: Five- or Ten-Year Summary of Operating Results – Question 1
Identify the major components provided in the five- or ten-year summary. Summarize the insight provided by each. Look for stable, increasing or decreasing trends. Consistent, slightly improving performance signals management has control of the business. Inconsistent performance signals management does not have control of the business.
Component
Example: The Home Depot
Summary of Insight
Sales and earnings have grown significantly over time. Operating expenses are decreasing.
Click here to enter text. Click here to enter text.
Click here to enter text. Click here to enter text.
Click here to enter text. Click here to enter text.
Click here to enter text. Click here to enter text.
Click here to enter text. Click here to enter text.
Click here to enter text. Click here to enter text.
12

Tilly Owusuwaa: Summer, Pendarvis
CHAPTER 3 - FINANCIAL STATEMENTSThe Balance Sheet
Chapter 3: Balance Sheet – Question 1
Identify the date shown at the top of your selected company’s balance sheet.
Current Year Prior Year
Click here to enter text. Click here to enter text.
Does the company’s fiscal year follow the calendar year? Yes, No Click here to enter text.
If not, why do you think it is different?
Click here to enter text.
Chapter 3: Balance Sheet – Question 2
Review the current asset section of your selected company’s balance sheet. Explain why the order of individual items begins with cash. In your opinion, would it be more or less appropriate to order these items according to dollar magnitude? Explain.
Click here to enter text.
Chapter 3: Balance Sheet – Question 3
Review your company’s balance sheet (or SEC Form 10-K) and compare accumulated depreciation to the historical cost of Plant and Equipment (PE) using the following ratio.
Compute the following:
Accumulated depreciation /
Plant and Equipment
Click here to enter text.
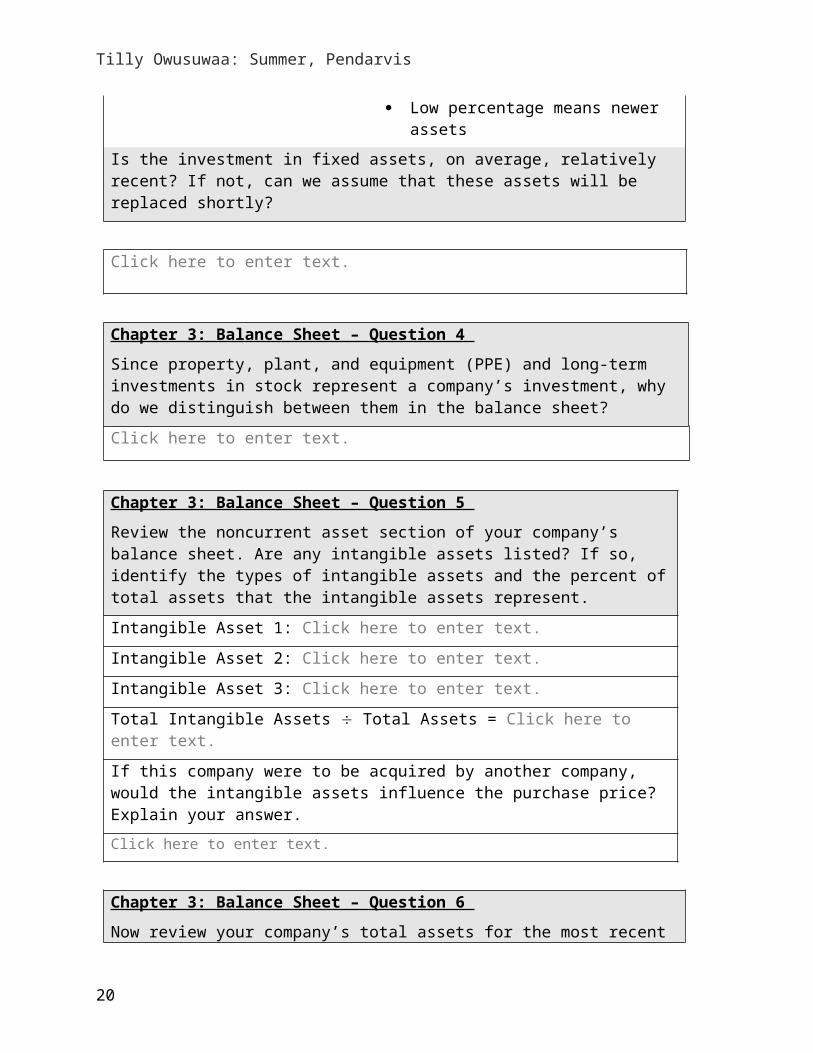
Percentage of Asset Life Remaining
High percentage means older assets
Low percentage means newer assets
Is the investment in fixed assets, on average, relatively recent? If not, can we assume that these assets will be replaced shortly?
Click here to enter text.
13
Tilly Owusuwaa: Summer, Pendarvis
Chapter 3: Balance Sheet – Question 4
Since property, plant, and equipment (PPE) and long-term investments in stock represent a company’s investment, why do we distinguish between them in the balance sheet?
Click here to enter text.
Chapter 3: Balance Sheet – Question 5
Review the noncurrent asset section of your company’s balance sheet. Are any intangible assets listed? If so, identify the types of intangible assets and the percent of total assets that the intangible assets represent.
Intangible Asset 1: Click here to enter text.
Intangible Asset 2: Click here to enter text.
Intangible Asset 3: Click here to enter text.
Total Intangible Assets Total Assets = Click here to enter text.
If this company were to be acquired by another company, would the intangible assets influence the purchase price? Explain your answer.
Click here to enter text.
Chapter 3: Balance Sheet – Question 6
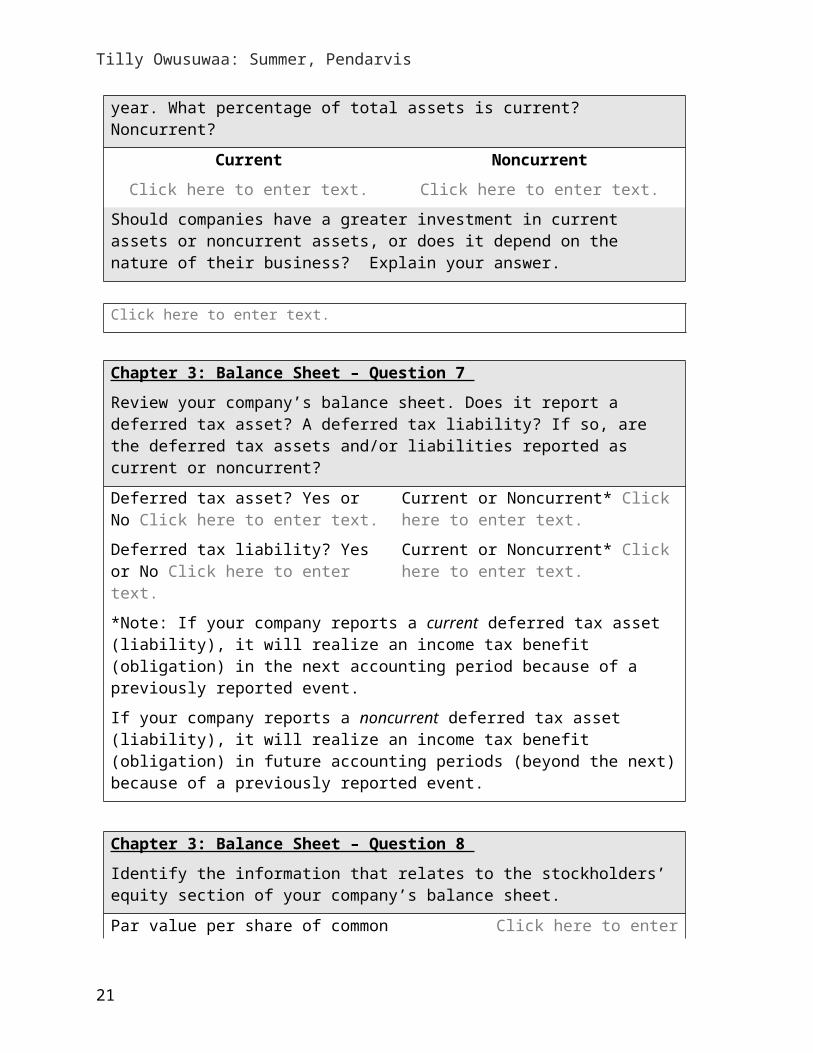
Now review your company’s total assets for the most recent year. What percentage of total assets is current? Noncurrent?
Current Noncurrent
Click here to enter text. Click here to enter text.
Should companies have a greater investment in current assets or noncurrent assets, or does it depend on the nature of their business? Explain your answer.
Click here to enter text.
Chapter 3: Balance Sheet – Question 7
Review your company’s balance sheet. Does it report a deferred tax asset? A deferred tax liability? If so, are the deferred tax assets and/or liabilities reported as current or noncurrent?
Deferred tax asset? Yes or No Click here to enter text.
Current or Noncurrent* Click here to enter text.
Deferred tax liability? Yes or No Click here to enter text.
Current or Noncurrent* Click here to enter text.
14

Tilly Owusuwaa: Summer, Pendarvis
*Note: If your company reports a current deferred tax asset (liability), it will realize an income tax benefit (obligation) in the next accounting period because of a previously reported event.
If your company reports a noncurrent deferred tax asset (liability), it will realize an income tax benefit (obligation) in future accounting periods (beyond the next) because of a previously reported event.
Chapter 3: Balance Sheet – Question 8
Identify the information that relates to the stockholders’ equity section of your company’s balance sheet.
Par value per share of common stock? Click here to enter text.
Number of common shares authorized? Click here to enter text.
Number of common shares issued? Click here to enter text.
Number of common shares outstanding? Click here to enter text.
Number of treasury shares held by the company? Click here to enter text.
Chapter 3: Balance Sheet – Question 9
Answer the following questions relative to the stockholders’ equity section of the balance sheet.
By what amount did retained earnings increase or decrease from the prior year?
Click here to enter text.
Was the increase or decrease in retained earnings equal to the company’s current year net income or net loss?
Yes or N
Click here to enter text.*
* If No, then dividends were paid (or declared) by your selected company or certain events took place during the year where the accounting for the events directly affected the retained earnings account.
Chapter 3: Balance Sheet – Question 10
List (write-in) each financial statement element as shown in your company’s balance sheet.
Assets Liabilities Stockholders’ Equity
Click here to enter text. Click here to enter text. Click here to enter text.
Click here to enter text. Click here to enter text. Click here to enter text.
Click here to enter text. Click here to enter text. Click here to enter text.
Click here to enter text. Click here to enter text. Click here to enter text.
15

Tilly Owusuwaa: Summer, Pendarvis
Click here to enter text. Click here to enter text. Click here to enter text.
Click here to enter text. Click here to enter text. Click here to enter text.
Click here to enter text. Click here to enter text. Click here to enter text.
Click here to enter text. Click here to enter text. Click here to enter text.
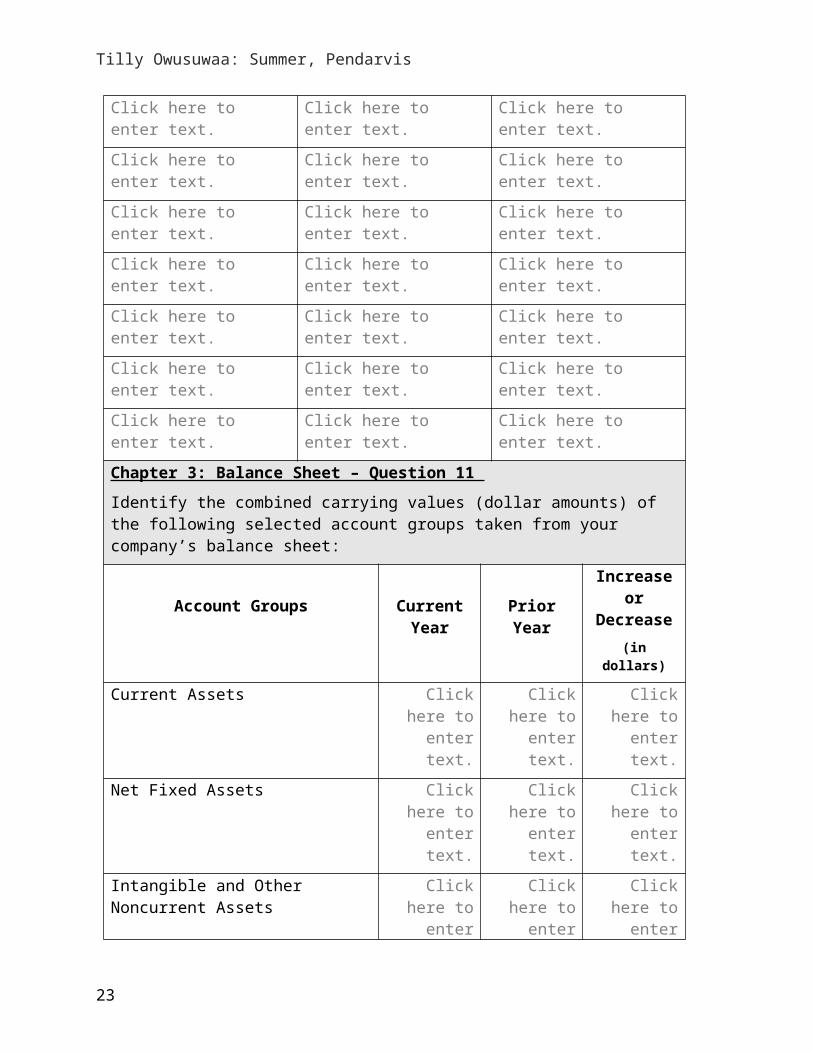
Chapter 3: Balance Sheet – Question 11
Identify the combined carrying values (dollar amounts) of the following selected account groups taken from your company’s balance sheet:
Account Groups Current Year
Prior Year
Increase or Decrease(in dollars)
Current Assets Click here to enter text.
Click here to enter text.
Click here to enter text.
Net Fixed Assets Click here to enter text.
Click here to enter text.
Click here to enter text.
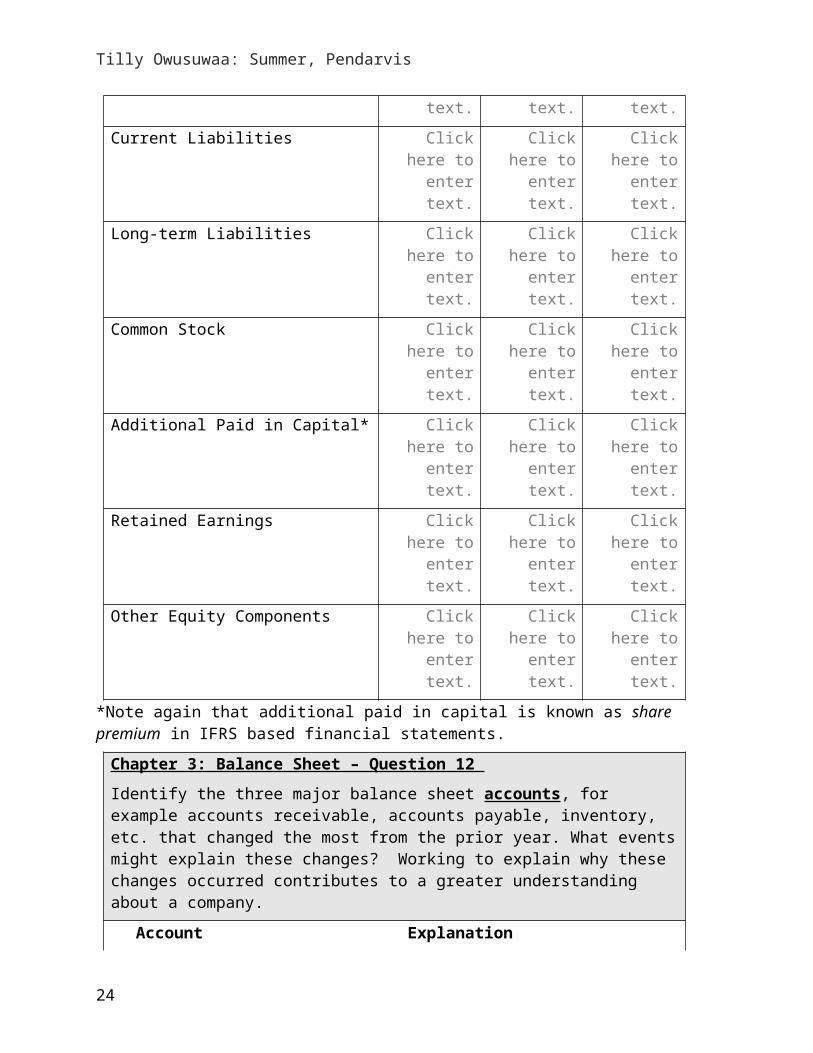
Intangible and Other Noncurrent Assets Click here to enter text.
Click here to enter text.
Click here to enter text.
Current Liabilities Click here to enter text.
Click here to enter text.
Click here to enter text.
Long-term Liabilities Click here to enter text.
Click here to enter text.
Click here to enter text.
Common Stock Click here to enter text.
Click here to enter text.
Click here to enter text.
Additional Paid in Capital* Click here to enter text.
Click here to enter text.
Click here to enter text.
Retained Earnings Click here to enter text.
Click here to enter text.
Click here to enter text.
Other Equity Components Click here to enter text.
Click here to enter text.
Click here to enter text.
*Note again that additional paid in capital is known as share premium in IFRS based financial statements.
Chapter 3: Balance Sheet – Question 12
Identify the three major balance sheet accounts, for example accounts receivable, accounts payable, inventory, etc. that changed the most from the prior year. What events might explain these changes? Working to explain why these changes occurred contributes to a greater understanding about a company.
Account Explanation
Example: Example:
16

Tilly Owusuwaa: Summer, Pendarvis
Account Receivable
An increase in accounts receivable should coincide with an increase in sales, i.e., a 10% increase in sales would explain a 10% increase in accounts receivable. If accounts receivable are increasing and sales decreasing, the signal is unfavorable.
Click here to enter text.
Click here to enter text.
Click here to enter text.
Click here to enter text.
Click here to enter text.
Click here to enter text.
Chapter 3: Balance Sheet – Question 13
Prepare a common-sized balance sheet (expressed in percentages) using the following account groups shown in your selected company’s balance sheet.
Account Group Current Year
Prior Year
Increase or Decrease(current year percent minus
prior year percent)
Current Assets Click here to enter text.
Click here to enter text.
Click here to enter text.
Net Fixed Assets Click here to enter text.
Click here to enter text.
Click here to enter text.
Intangible and Other Noncurrent Assets Click here to enter text.
Click here to enter text.
Click here to enter text.
Total Assets 100% 100%
Current Liabilities Click here to enter text.
Click here to enter text.
Click here to enter text.
Long-term Liabilities Click here to enter text.
Click here to enter text.
Click here to enter text.
Common Stock Click here to enter text.
Click here to enter text.
Click here to enter text.
Additional Paid in Capital Click here to enter text.
Click here to enter text.
Click here to enter text.
Retained Earnings Click here to enter text.
Click here to enter text.
Click here to enter text.
17

Tilly Owusuwaa: Summer, Pendarvis
Other Equity Components Click here to enter text.
Click here to enter text.
Click here to enter text.
Total Liabilities and Stockholders’ Equity
100% 100%
Chapter 3: Balance Sheet – Question 14
Identify the three balance sheet groups from question 13 above that changed most significantly. Within each of these groups, identify the primary balance sheet element that drove this change. What events might explain these changes?
Group Name:
Current Assets
Explanation:
(Example – sales increased by 22%, thus accounts receivable increased by approximately 22%)
Click here to enter text.
Click here to enter text.
Click here to enter text.
Click here to enter text.
Click here to enter text.
Click here to enter text.
Chapter 3: Balance Sheet – Question 15
Did your company become more or less liquid when comparing this year to last year?
Current Year:
Current Assets minus Current Liabilities =
Click here to enter text.
Prior Year:
Current Assets minus Current Liabilities =
Click here to enter text.
Explain why?
Click here to enter text.
Chapter 3: Balance Sheet – Question 16
Did your company increase or decrease its financial leverage when comparing total debt to total stockholders’ equity from this year to last?
Current Year:
Total debt Total stockholders’ equity =
Click here to enter text.
Prior Year:
Total debt Total stockholders’ equity = Click here to enter text.
18

Tilly Owusuwaa: Summer, Pendarvis
Explain why:
Click here to enter text.
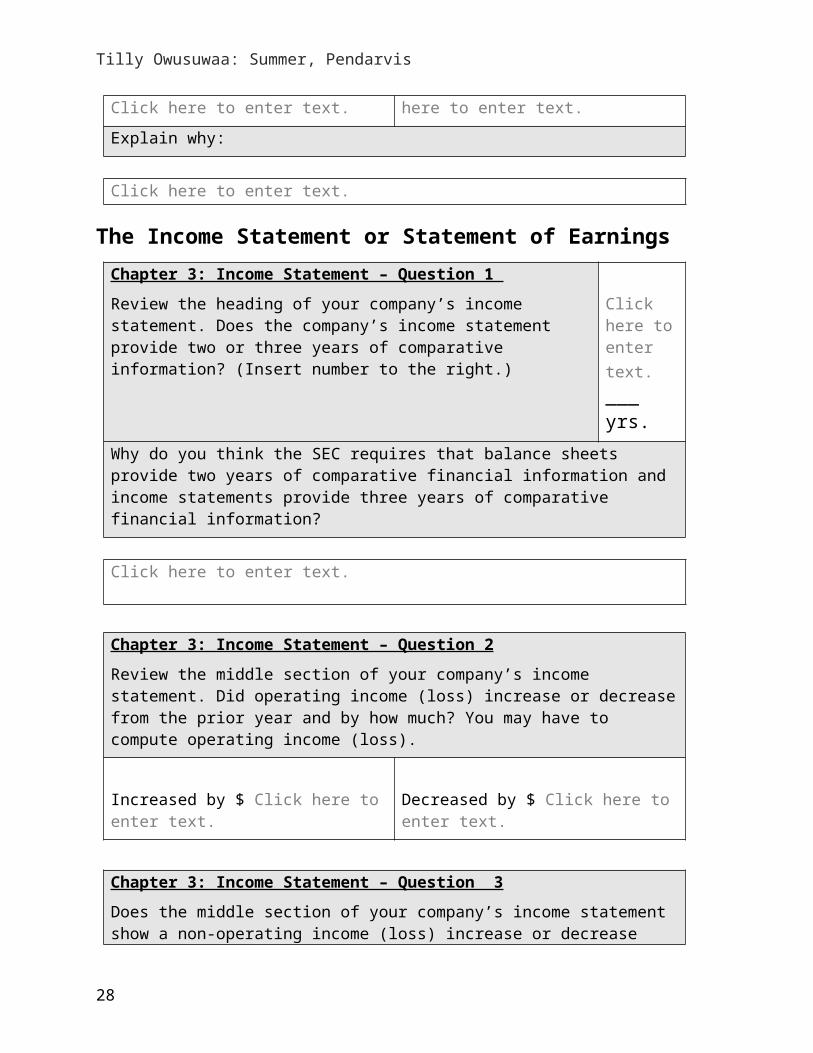
The Income Statement or Statement of EarningsChapter 3: Income Statement – Question 1
Review the heading of your company’s income statement. Does the company’s income statement provide two or three years of comparative information? (Insert number to the right.)
Click here to enter text. ___ yrs.
Why do you think the SEC requires that balance sheets provide two years of comparative financial information and income statements provide three years of comparative financial information?
Click here to enter text.
Chapter 3: Income Statement – Question 2
Review the middle section of your company’s income statement. Did operating income (loss) increase or decrease from the prior year and by how much? You may have to compute operating income (loss).
Increased by $ Click here to enter text. Decreased by $ Click here to enter text.
Chapter 3: Income Statement – Question 3
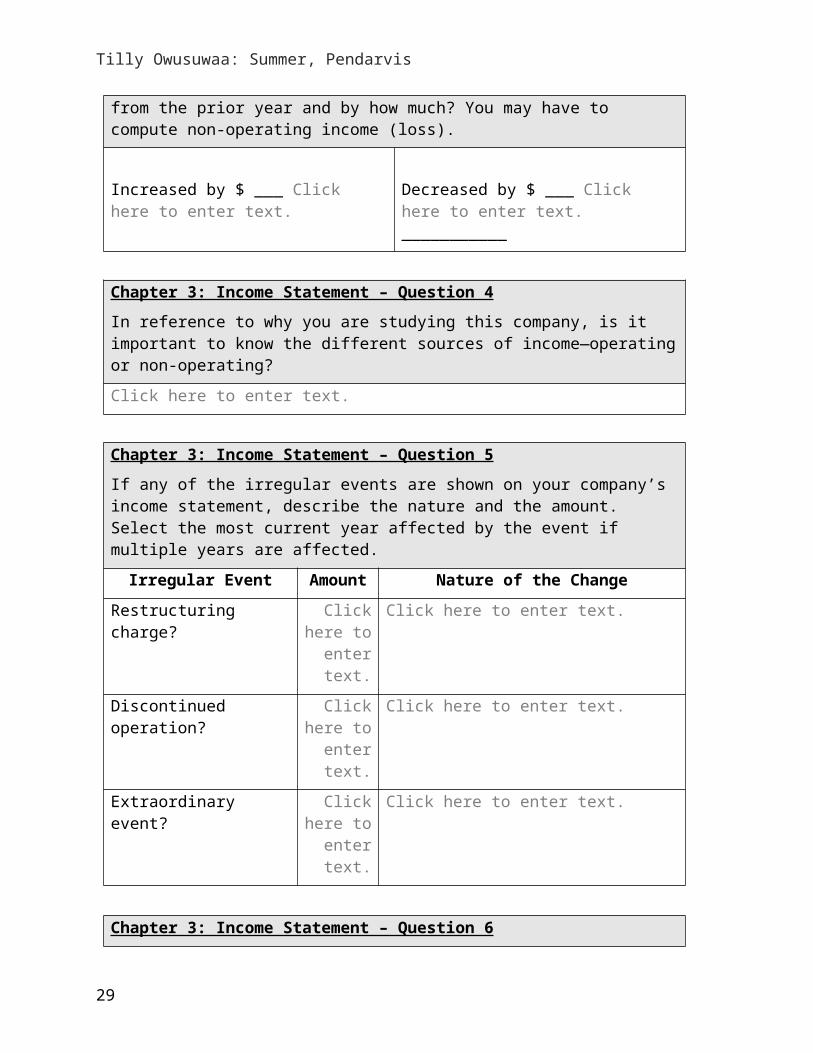
Does the middle section of your company’s income statement show a non-operating income (loss) increase or decrease from the prior year and by how much? You may have to compute non-operating income (loss).
Increased by $ ___ Click here to enter text. Decreased by $ ___ Click here to enter text. ___________
Chapter 3: Income Statement – Question 4
In reference to why you are studying this company, is it important to know the different sources of income—operating or non-operating?
Click here to enter text.
19
Tilly Owusuwaa: Summer, Pendarvis
Chapter 3: Income Statement – Question 5
If any of the irregular events are shown on your company’s income statement, describe the nature and the amount. Select the most current year affected by the event if multiple years are affected.
Irregular Event Amount Nature of the Change
Restructuring charge? Click here to enter
text.
Click here to enter text.
Discontinued operation? Click here to enter
text.
Click here to enter text.
Extraordinary event? Click here to enter
text.
Click here to enter text.
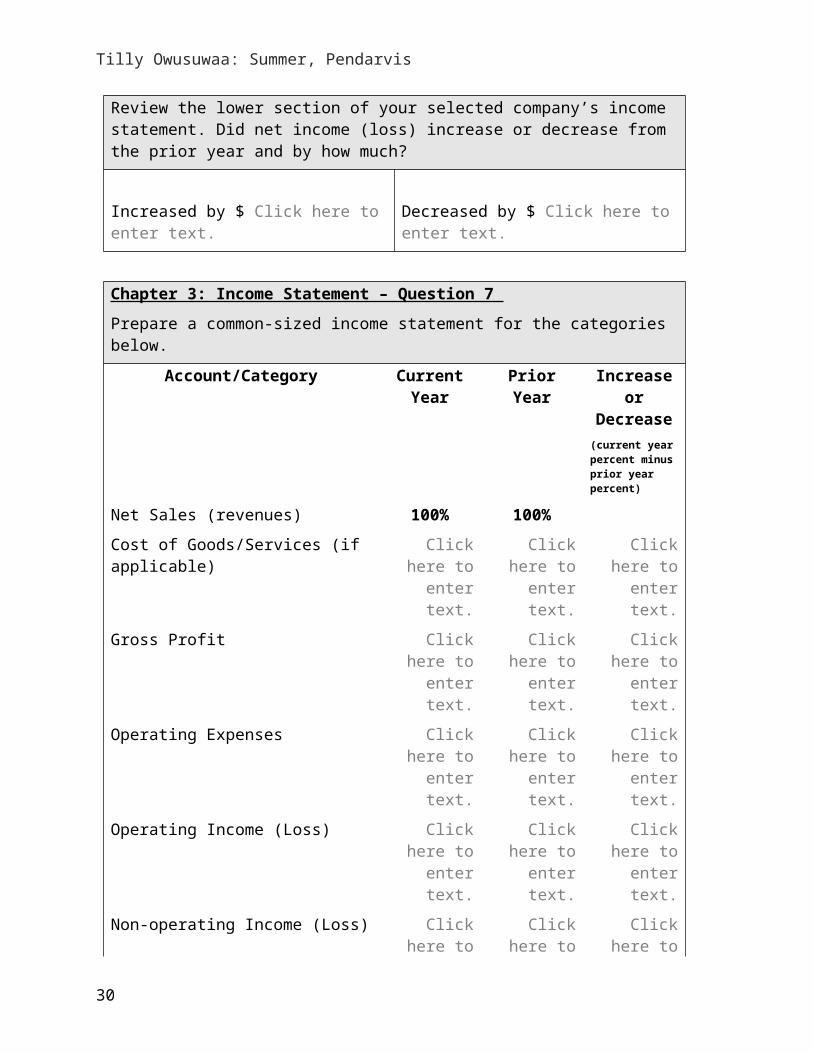
Chapter 3: Income Statement – Question 6
Review the lower section of your selected company’s income statement. Did net income (loss) increase or decrease from the prior year and by how much?
Increased by $ Click here to enter text. Decreased by $ Click here to enter text.
Chapter 3: Income Statement – Question 7
Prepare a common-sized income statement for the categories below.
Account/Category Current Year
Prior Year Increase or Decrease
(current year percent minus prior year percent)
Net Sales (revenues) 100% 100%
Cost of Goods/Services (if applicable) Click here to enter text.
Click here to enter text.
Click here to enter text.
Gross Profit Click here to enter text.
Click here to enter text.
Click here to enter text.
Operating Expenses Click here to enter text.
Click here to enter text.
Click here to enter text.
Operating Income (Loss) Click here to enter text.
Click here to enter text.
Click here to enter text.
Non-operating Income (Loss) Click here to Click here to Click here to
20
Tilly Owusuwaa: Summer, Pendarvis
enter text. enter text. enter text.
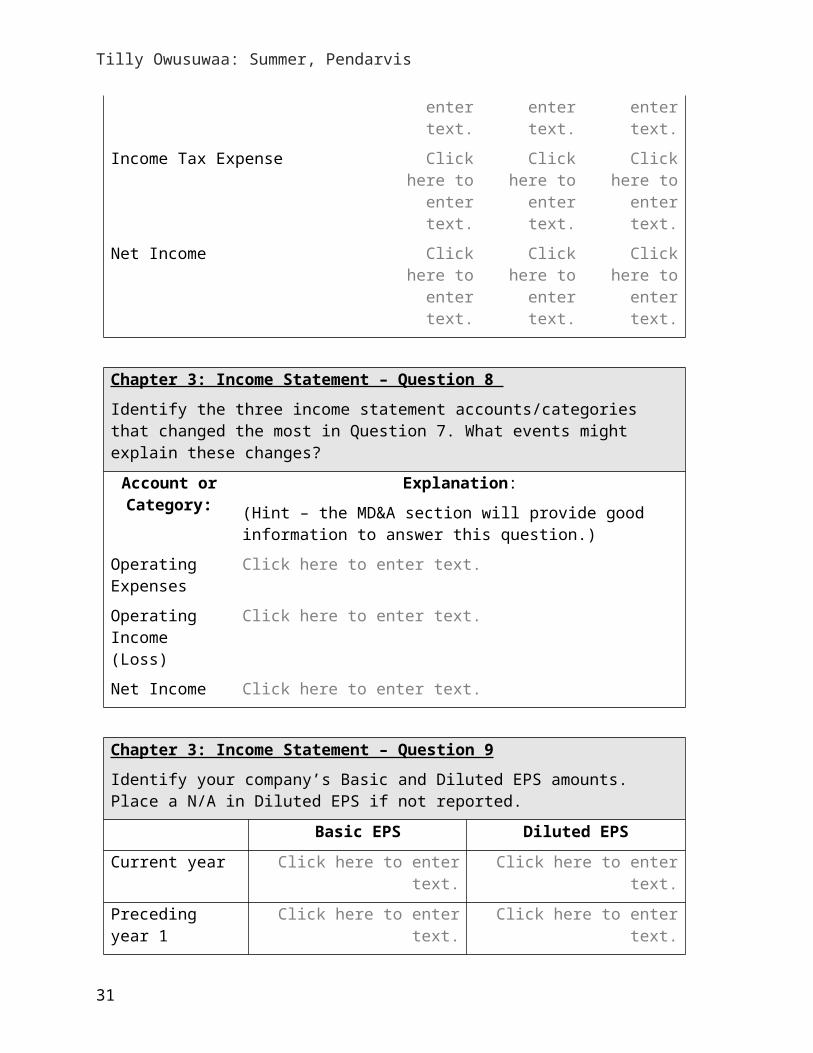
Income Tax Expense Click here to enter text.
Click here to enter text.
Click here to enter text.
Net Income Click here to enter text.
Click here to enter text.
Click here to enter text.
Chapter 3: Income Statement – Question 8
Identify the three income statement accounts/categories that changed the most in Question 7. What events might explain these changes?
Account or Category:
Explanation:
(Hint – the MD&A section will provide good information to answer this question.)
Operating Expenses
Click here to enter text.
Operating Income (Loss)
Click here to enter text.
Net Income Click here to enter text.
Chapter 3: Income Statement – Question 9
Identify your company’s Basic and Diluted EPS amounts. Place a N/A in Diluted EPS if not reported.
Basic EPS Diluted EPS
Current year Click here to enter text. Click here to enter text.
Preceding year 1 Click here to enter text. Click here to enter text.
Preceding year 2 Click here to enter text. Click here to enter text.
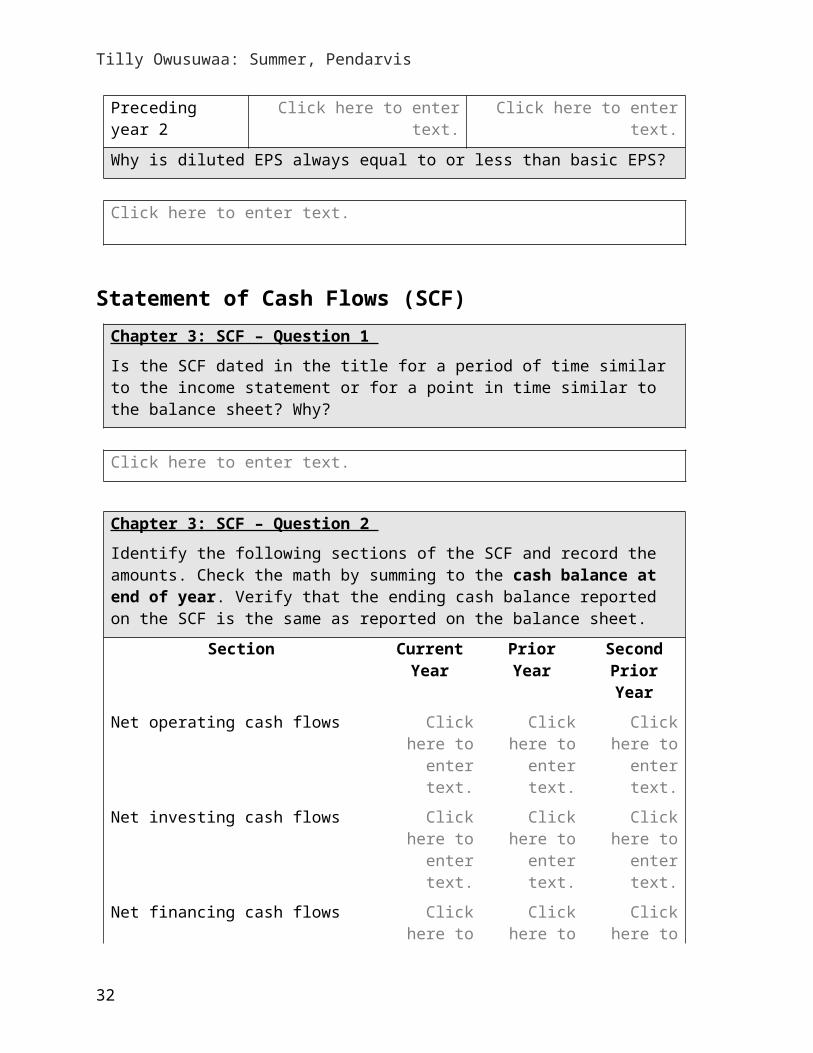
Why is diluted EPS always equal to or less than basic EPS?
Click here to enter text.
Statement of Cash Flows (SCF)Chapter 3: SCF – Question 1
Is the SCF dated in the title for a period of time similar to the income statement or for a point in time similar to the balance sheet? Why?
21

Tilly Owusuwaa: Summer, Pendarvis
Click here to enter text.
Chapter 3: SCF – Question 2
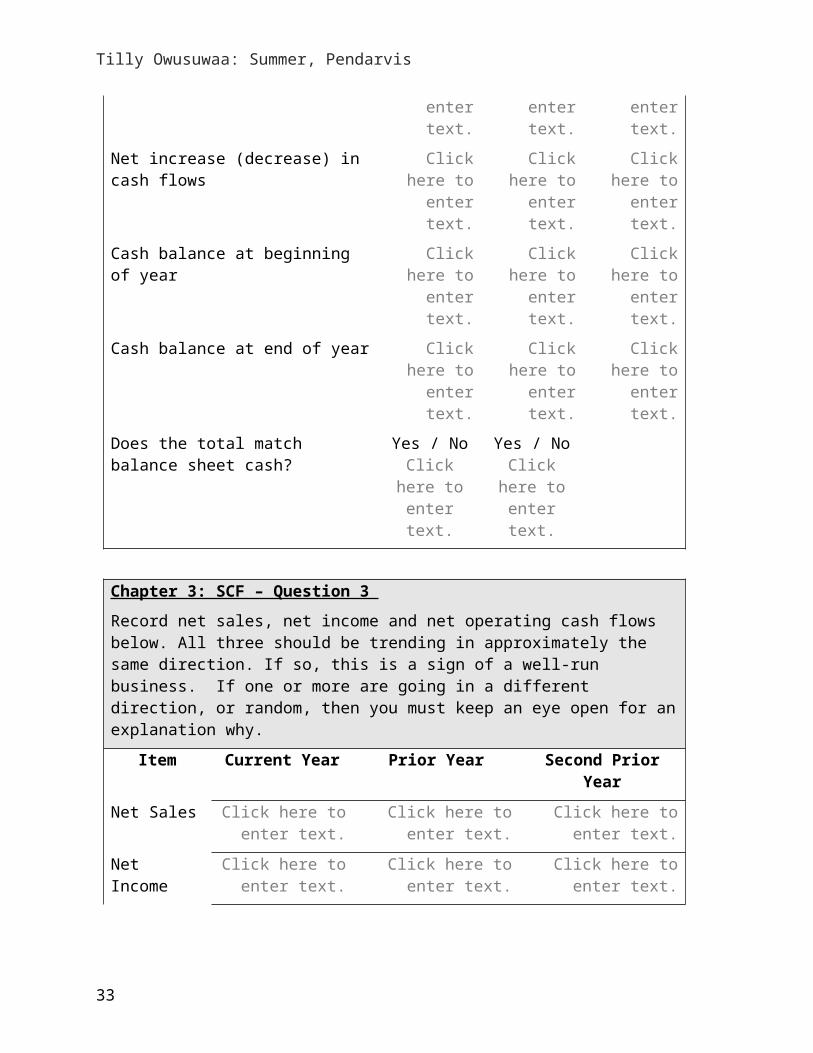
Identify the following sections of the SCF and record the amounts. Check the math by summing to the cash balance at end of year. Verify that the ending cash balance reported on the SCF is the same as reported on the balance sheet.
Section Current Year
Prior Year Second Prior Year
Net operating cash flows Click here to enter text.
Click here to enter text.
Click here to enter text.
Net investing cash flows Click here to enter text.
Click here to enter text.
Click here to enter text.
Net financing cash flows Click here to enter text.
Click here to enter text.
Click here to enter text.
Net increase (decrease) in cash flows Click here to enter text.
Click here to enter text.
Click here to enter text.
Cash balance at beginning of year Click here to enter text.
Click here to enter text.
Click here to enter text.
Cash balance at end of year Click here to enter text.
Click here to enter text.
Click here to enter text.
Does the total match balance sheet cash? Yes / No Click here to
enter text.
Yes / No Click here to
enter text.
Chapter 3: SCF – Question 3
Record net sales, net income and net operating cash flows below. All three should be trending in approximately the same direction. If so, this is a sign of a well-run business. If one or more are going in a different direction, or random, then you must keep an eye open for an explanation why.
Item Current Year Prior Year Second Prior Year
Net Sales Click here to enter text.
Click here to enter text. Click here to enter text.
Net Income Click here to enter text.
Click here to enter text. Click here to enter text.
Net Operating Cash Flows
Click here to enter text.
Click here to enter text. Click here to enter text.
22
Tilly Owusuwaa: Summer, Pendarvis
Explain why net sales, net income and net operating cash flows are trending together or differently. (Hint: Look at depreciation expense and substantial changes in inventory, accounts receivable and accounts payable balances. Explaining why is a key learning point.)
Click here to enter text.
Chapter 3: SCF – Question 4
Identify the primary cash outflows and inflows from investing activities.
Description of Activity Amount
Cash outflow: Click here to enter text.
Cash inflow: Click here to enter text.
Consider three key issues at this point. Is the company adding assets? This is a sign of growth. Is the company replacing assets? This is a sign of growth and stability. Is the company only selling assets? This is a sign of retrenchment.
Click here to enter text.
Chapter 3: SCF – Question 5
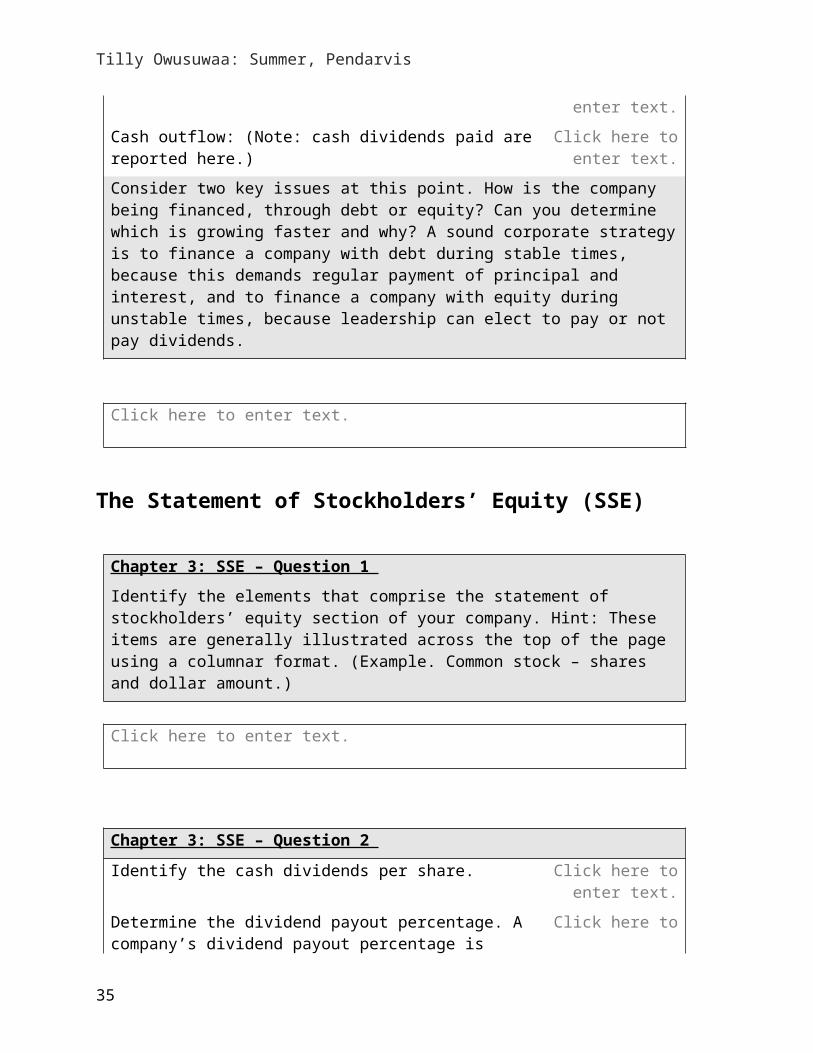
Identify the primary cash inflow and outflow from financing activities.
Description of Activity Amount
Cash inflow: Click here to enter text.
Cash outflow: (Note: cash dividends paid are reported here.) Click here to enter text.
Consider two key issues at this point. How is the company being financed, through debt or equity? Can you determine which is growing faster and why? A sound corporate strategy is to finance a company with debt during stable times, because this demands regular payment of principal and interest, and to finance a company with equity during unstable times, because leadership can elect to pay or not pay dividends.
Click here to enter text.
23
Tilly Owusuwaa: Summer, Pendarvis
The Statement of Stockholders’ Equity (SSE)
Chapter 3: SSE – Question 1
Identify the elements that comprise the statement of stockholders’ equity section of your company. Hint: These items are generally illustrated across the top of the page using a columnar format. (Example. Common stock – shares and dollar amount.)
Click here to enter text.
Chapter 3: SSE – Question 2
Identify the cash dividends per share. Click here to enter text.
Determine the dividend payout percentage. A company’s dividend payout percentage is computed by dividing dividend per common share by net income or earnings per common share. (Hint: If your company reported a net loss for the year, the answer lacks meaning.)
Click here to enter text.
Compute dividend yield. A company’s dividend yield is computed by dividing dividend per common share by market price per common share. (Hint: Use the current per share price for your selected company.)
Click here to enter text.
Is your company’s dividend yield a reasonable return given current market conditions?
Click here to enter text.
Notes to the Financial Statements Chapter 3: Notes to the Financial Statements – Question 1
How does your company define “cash and cash equivalents”?
Click here to enter text.
Chapter 3: Notes to the Financial Statements – Question 2
How does your company value its “inventories”? Explain the meaning of the inventory
24

Tilly Owusuwaa: Summer, Pendarvis
valuation method. Are domestic and international inventories valued the same? Service companies will typically not have inventory.
Click here to enter text.
Chapter 3: Notes to the Financial Statements – Question 3
Does your company report any investments in marketable securities? Identify the respective amount(s) invested.
Category Current Year Amount
Trading Securities Click here to enter text.
Available-for-Sale Securities Click here to enter text.
Held-to-Maturity Debt Securities Click here to enter text.
Chapter 3: Notes to the Financial Statements – Question 4
Note 1 and a separate note on income taxes should provide the information to answer this question.
What was your company’s income tax expense for the current year?
Click here to enter text.
How much cash was paid for income taxes in the current year? (Hint: Review the SCF. The difference generally relates to the accrual basis of accounting.)
Click here to enter text.
Identify the three major elements, such as depreciation or other post-employment benefits, that gave rise to deferred tax assets or deferred tax liabilities:
Deferred Tax Assets Deferred Tax Liabilities
Click here to enter text. Click here to enter text.
Click here to enter text. Click here to enter text.
Click here to enter text. Click here to enter text.
What is this year’s effective tax rate for your company? What is the current year statutory rate?
Effective Tax Rate: __ Click here to enter text. ____%
Statutory Tax Rate: ___ Click here to enter text. ___%
25

Tilly Owusuwaa: Summer, Pendarvis
Chapter 3: Notes to the Financial Statements – Question 5
Reviewing note #1, any related supporting notes, and/or the 10-K, identify the fixed asset group(s), depreciation methods used, and the estimated useful lives of these fixed assets.
Fixed Asset Group Depreciation Method Estimated Lives (range)
Click here to enter text. Click here to enter text. Click here to enter text.
Click here to enter text. Click here to enter text. Click here to enter text.
Click here to enter text. Click here to enter text. Click here to enter text.
Click here to enter text. Click here to enter text. Click here to enter text.
Click here to enter text. Click here to enter text. Click here to enter text.
Chapter 3: Notes to the Financial Statements – Question 6
Review the balance sheet, note #1, and any related notes and identify the amount of goodwill reported in the current year.
Amount reported in current year. Click here to enter text.
Identify the amount of any significant write-down of goodwill that occurred during the current year.
Click here to enter text.
How does management describe how it accounts for goodwill as disclosed in the note(s) to the financial statements?
Click here to enter text.
Chapter 3: Notes to the Financial Statements – Question 7
Given present executive compensation packages, why would the user of financial information prefer a company follow SFAS No. 123(R) instead of APBO No.25? Explain.
Click here to enter text.
Chapter 3: Notes to the Financial Statements – Question 8
Review your company’s lease note (and related balance sheet information), then identify the following amounts:
Minimum lease payments under operating leases Click here to enter text.
26

Tilly Owusuwaa: Summer, Pendarvis
Minimum lease payments under capital leases Click here to enter text.
Ratio of operating lease payments to capital lease payments
Click here to enter text.
As a user of reported financial information, would you be concerned about a significant amount of operating leases that are not reported in the balance sheet? Explain.
Click here to enter text.
Chapter 3: Notes to the Financial Statements – Question 9
Review your company’s long-term debt note and identify the following (consider the three most significant liabilities only):
Instrument Maturity Date Rate Amount Due
Click here to enter text.
Click here to enter text.
Click here to enter text.
Click here to enter text.
Click here to enter text.
Click here to enter text.
Click here to enter text.
Click here to enter text.
Click here to enter text.
Click here to enter text.
Click here to enter text.
Click here to enter text.
How much interest expense was recognized in the current year?
Click here to enter text.
How much cash was paid for interest in the current year? (Hint: Look in the SCF.*)
Click here to enter text.
*The difference between interest expense and cash paid for interest is due to the accrual basis of accounting (and in some cases, the capitalization of interest).
Chapter 3: Notes to the Financial Statements – Question 10
Review your company’s pension and OPEB note (if applicable) and answer the following questions.
Pensions OPEB
How much is the Projected Benefit Obligation (PBO) and Accumulated Postretirement Benefit Obligation (APBO) for your company at the end of the current year?
Click here to enter text. Click here to enter text.
27
Tilly Owusuwaa: Summer, Pendarvis
What was the amount of pension or OPEB benefits paid to plan participants during the current year?
Click here to enter text. Click here to enter text.
What amount of cash did the company contribute to the respective funds during the current year? This is known as “employer contributions.”
Click here to enter text. Click here to enter text.
What is the value of the plan assets at the end of the current year?
Click here to enter text. Click here to enter text.
Based on your review of the plan assets and the projected benefit obligation (or accumulated postretirement benefit obligation), has your company sufficiently funded its employee benefit plans (this is known as funded status)?
Click here to enter text.
An expected average return on invested plan assets is used to reduce the volatility in the reporting of pension or OPEB expense. Higher expected average returns reduce pension or OPEB expense, and lower expected returns increase pension expense. What rate of return on plan assets does your company use to compute pension or OPEB expense? Does this appear reasonable, given present market conditions?
Rate employed? _____ Click here to enter text. ___
Response:Click here to enter text.
Chapter 3: Notes to the Financial Statements – Question 11
Based on your review of the contingencies note, briefly identify specific events that have led to the accrual of contingent liabilities in your selected company’s the balance sheet.
Click here to enter text.
Chapter 3: Notes to the Financial Statements – Question 12
Based on your review of the segment-reporting note to the financials, identify the reported operating segments, their related revenues, and operating income. Identify the largest three if more than three are disclosed.
Reportable Operating Segments Net Sales Revenue Net Operating Income
28
Tilly Owusuwaa: Summer, Pendarvis
Click here to enter text. Click here to enter text.
Click here to enter text.
Click here to enter text. Click here to enter text.
Click here to enter text.
Click here to enter text. Click here to enter text.
Click here to enter text.
Chapter 3: Notes to the Financial Statements – Question 13
Based on your review of the segment-reporting note to the financials, identify the geographical segments and their related revenues. Identify the largest three if more than three are disclosed.
Country Net Sales Revenue
Click here to enter text. Click here to enter text.Click here to enter text. Click here to enter text.Click here to enter text. Click here to enter text.
Chapter 3: Notes to the Financial Statements—Question 14
Based on your review of the notes to the financials or the statement of stockholders’ equity, identify the components (no more than four) that comprise Other Comprehensive Income for your company.
Component Amount
Click here to enter text. Click here to enter text.
Click here to enter text. Click here to enter text.
Click here to enter text. Click here to enter text.
Click here to enter text. Click here to enter text.
29
Tilly Owusuwaa: Summer, Pendarvis
CHAPTER 4 - FINANCIAL ANALYSIS
Evaluating the financial performance of your company consists of interpreting current measures compared to prior years and industry average benchmarks. You can locate industry average data at:
http://investing.money.msn.com/investments/key-ratios?symbol=ibm
o Reported on a rolling four quarter basis.
Your library holdings
Other sources from the web
Summary Financial Analysis Report
Profit Margin % - Identify source for industry data Click here to enter text.
Answers how well the business performed.
Company Two Years Prior
Company One Year Prior Company Industry
Gross Margin
Gross Profit /Total Revenue
Click here to enter text.
Click here to enter text.
Click here to enter text.
Click here to enter text.
Pre-Tax Margin
Operating Income / Total Revenue
Click here to enter text.
Click here to enter text.
Click here to enter text.
Click here to enter text.
Net Profit Margin
Net Income /Total Revenue
Click here to enter text.
Click here to enter text.
Click here to enter text.
Click here to enter text.
Sales Financial Statement
Click here to enter text.
Click here to enter text.
Click here to enter text. Not required
Operating Income
Financial Statement
Click here to enter text.
Click here to enter text.
Click here to enter text. Not required
Operating Cash Flows
Financial Statement
Click here to enter text.
Click here to enter text.
Click here to enter text. Not required
Evaluate Profitability (Think about the corporate strategy in providing a response. Following
30
Tilly Owusuwaa: Summer, Pendarvis
are general guidelines, yet each company situation is unique. For a company with a growth strategic focus you will likely find increasing performance, above or below industry average. For a company with a stability strategic focus you will likely find stable performance, above or below industry average. For a company in a retrenchment strategic focus you will likely find poor performance, below industry average with efforts to improve and approach industry average. Note: Sales, operating income and operating cash flows should trend in approximately the same direction. This signals a stable operating business environment. If the three measures are not trending together, this signals lack of control by management.) An analysis stock report may also provide useful insight.
Click here to enter text.
Financial Condition - Identify source for industry data Click here to enter text.
Signals ability to take on additional debt and liquidity.
Company Two Years Prior
Company One Year Prior Company Industry
Debt/ Equity Ratio
(Total Liabilities – Current Liabilities)
/ Total equity
Click here to enter text.
Click here to enter text.
Click here to enter text.
Click here to enter text.
Current Ratio
Current assets /Current liabilities
Click here to enter text.
Click here to enter text.
Click here to enter text.
Click here to enter text.
Quick Ratio
(Cash and Short Term Investments
+ Short Term
Investments + Total Receivables,
Net) / Current Liabilities
Click here to enter text.
Click here to enter text.
Click here to enter text.
Click here to enter text.
Interest Coverage
(Net income + tax expense + interest expense) / interest
expense
Click here to enter text.
Click here to enter text.
Click here to enter text.
Click here to enter text.
Evaluate Financial Condition (often labeled liquidity and solvency analysis) (Think about the corporate strategy in providing a response. Following are general guidelines, yet each company situation is unique. For a company with a growth strategic focus you will likely find stable or slightly decreasing liquidity, above or below industry average. Debt to equity often is increasing in a growing company. For a company with a stability strategic focus you will likely find stable liquidity, above or below industry average. Debt to equity often is stable as
31
Tilly Owusuwaa: Summer, Pendarvis
well. For a company with a retrenchment strategic focus you will likely find poor liquidity, below industry average with efforts to improve and approach industry liquidity. Debt to equity often is decreasing in a company during retrenchment.) An analysis stock report may also provide useful insight.
Click here to enter text.
Investment Return % - Identify source for industry data Click here to enter text.
Signals performance for managers and owners.
Company Two Years Prior
Company One Year Prior Company Industry
Average is defined: (beginning of the year + end of the year) / 2To compute “Company Two Years Prior” and “Company One Year Prior” go to the company website and pull the prior annual reports for the necessary data.
Return On Equity
Net Income /Average Total
Equity
Click here to enter text.
Click here to enter text.
Click here to enter text.
Click here to enter text.
Return On Assets
Net Income /Average Total
Assets
Click here to enter text.
Click here to enter text.
Click here to enter text.
Click here to enter text.
Evaluate Investment Return (Think about the corporate strategy in providing a response. Following are general guidelines, yet each company situation is unique. For a company with a growth strategic focus you will likely find increasing returns. For a company with a stability strategic focus you will likely find stable investment returns. For a company in a retrenchment strategic focus you will likely find poor and stable investment solvency, below industry average.) An analysis stock report may also provide useful insight.
Click here to enter text.
Management Efficiency - Identify source for industry data Click here to enter text.
Signals how well the company was run by
management.Company Two
Years PriorCompany One
Year Prior Company Industry
Average is defined: (beginning of the year + end of the year) / 2To compute “Company Two Years Prior” and “Company One Year Prior” go to the company website and pull the prior annual reports for the necessary data.
Receivable Turnover Total Revenue /
Average
Click here to enter text.
Click here to enter text.
Click here to enter text.
Click here to enter text.
32
Tilly Owusuwaa: Summer, Pendarvis
Accounts Receivable - Trade, Net
Inventory Turnover
Cost of Revenue,
Total / Average Total Inventory
Click here to enter text.
Click here to enter text.
Click here to enter text.
Click here to enter text.
Asset Turnover
Total Revenue / Average Total
Assets
Click here to enter text.
Click here to enter text.
Click here to enter text.
Click here to enter text.
Evaluate Management Efficiency (Think about the corporate strategy in providing a response. Following are general guidelines, yet each company situation is unique. For a company with a growth strategic focus you will likely find improving efficiency, above or below industry average. For a company with a stability strategic focus you will likely find stable efficiency, above or below industry average. For a company in a retrenchment strategic focus you will likely find poor efficiency, below industry average with efforts to improve and approach industry average.) An analysis stock report may also provide useful insight.
Click here to enter text.
33

Tilly Owusuwaa: Summer, Pendarvis
CHAPTER 5 - DECISION-MAKING PROCESSN ow you must make two decisions.
Chapter 5: Decision-making Process – Question 1
Based upon your review, do the numbers support the company’s explicit strategic focus: a growth, stability or retrenchment focus? Why or why not?
Click here to enter text.
Chapter 5: Decision-making Process – Question 2
Return to the first question in this project. Chapter 1: Identify Why You Selected This Company—Question 1
A) What is/are your motivation(s) or interest(s) in selecting this company?
B) What question(s) are you seeking to answer?
You were asked to explain why you were investigating this company’s annual report. You have likely uncovered numerous pieces of information, some with conflicting insight. This may involve both financial and nonfinancial information. In addition, you may have found certain information to be incomplete for decision-making purposes. This is real world analysis. Most business decisions are made with as much reliable information as possible, yet common to the decision-maker is a desire for more information.
Prepare a thorough, yet concise answer to your original questions A and B above. For example, would you work for this company, why or why not? Support your response with the information gathered throughout your annual report study.
Click here to enter text.
34
Tilly Owusuwaa: Summer, Pendarvis
Chapter 5: Validate Your Conclusion – Question 1
The Altman Z-score is a predictive model created by Edward Altman in the 1960’s. The score combines and weights financial ratios and other measures to estimate the likelihood of a company going bankrupt. The lower the Altman Z-score the higher the odds of bankruptcy. Research findings suggest the Z-score predicts 72 - 80% of corporate bankruptcies two years prior to the actual filing.
Z-score > than 3 = considered healthy
Z-score between 1.8 and 3 = considered a warning sign
Z-score < than 1.8 = could be headed for bankruptcy
Computing the Z-score for your company is very simple. Go to one of the Websites listed below and compute the Z-scores for the respective years identified below. Print out your results and turn them in with this workbook.
www.jaxworks.com/calc2a.htm
www.ironwoodadvisory.com/zscore.htm
Two Years Prior One Year Prior Current Year
Z-score Click here to enter text. Click here to enter text. Click here to enter text.
Z-score interpretation compared to the financial analysis. Does the Z-score agree or disagree with your analysis?
Click here to enter text.
Congratulations.
Now submit to your instructor your completed workbook per the instructions provided at the beginning of this document.
35