preface - · pdf filepreface in 1991 the united states international trade commission...
TRANSCRIPT


1 The information and analysis provided in this report are for the purposes of this report only.Nothing in this report should be construed to indicate how the Commission would find in aninvestigation conducted under statutory authority covering the same or similar subject matter.
i
PREFACE
In 1991 the United States International Trade Commission initiated its current Industry andTrade Summary series of informational reports on the thousands of products imported intoand exported from the United States. Each summary addresses a differentcommodity/industry area and contains information on product uses, U.S. and foreignproducers, and customs treatment. Also included is an analysis of the basic factors affectingtrends in consumption, production, and trade of the commodity, as well as those bearing onthe competitiveness of U.S. industries in domestic and foreign markets.1
This report on bakery products covers the period 1998 through 2002. Listed below are theindividual summary reports published to date on the agriculture and forest products sectors.
USITCpublicationnumber Publication date Title2459 November 1991 . . . . . . . . . . . . . . Live Sheep and Meat of Sheep2462 November 1991 . . . . . . . . . . . . . . Cigarettes2477 January 1992 . . . . . . . . . . . . . . . . Dairy Products2478 January 1992 . . . . . . . . . . . . . . . . Oilseeds2511 March 1992 . . . . . . . . . . . . . . . . . Live Swine and Fresh, Chilled, or
Frozen Pork2520 June 1992 . . . . . . . . . . . . . . . . . . . Poultry2544 August 1992 . . . . . . . . . . . . . . . . . Fresh or Frozen Fish2545 November 1992 . . . . . . . . . . . . . . Natural Sweeteners2551 November 1992 . . . . . . . . . . . . . . Newsprint2612 March 1993 . . . . . . . . . . . . . . . . . Wood Pulp and Waste Paper2615 March 1993 . . . . . . . . . . . . . . . . . Citrus Fruit2625 April 1993 . . . . . . . . . . . . . . . . . . Live Cattle and Fresh, Chilled, or
Frozen Beef and Veal2631 May 1993 . . . . . . . . . . . . . . . . . . . Animal and Vegetable Fats and Oils2635 June 1993 . . . . . . . . . . . . . . . . . . . Cocoa, Chocolate, and
Confectionery2636 May 1993 . . . . . . . . . . . . . . . . . . . Olives2639 June 1993 . . . . . . . . . . . . . . . . . . . Wine and Certain Fermented
Beverages2693 October 1993 . . . . . . . . . . . . . . . . Printing and Writing Paper2702 November 1993 . . . . . . . . . . . . . . Fur Goods2726 January 1994 . . . . . . . . . . . . . . . . Furskins2737 March 1994 . . . . . . . . . . . . . . . . . Cut Flowers

ii
PREFACE—Continued
USITCpublicationnumber
Publicationdate Title
2749 March 1994 . . . . . . . . . . . . . . . . . Paper Boxes and Bags2762 April 1994 . . . . . . . . . . . . . . . . . . Coffee and Tea2859 May 1995 . . . . . . . . . . . . . . . . . . . Seeds2865 April 1995 . . . . . . . . . . . . . . . . . . Malt Beverages2875 May 1995 . . . . . . . . . . . . . . . . . . . Certain Fresh Deciduous Fruits2898 June 1995 . . . . . . . . . . . . . . . . . . . Certain Miscellaneous Vegetable
Substance and Products2917 October 1995 . . . . . . . . . . . . . . . . Lumber, Flooring, and Siding2918 August 1995 . . . . . . . . . . . . . . . . . Printed Matter2928 November 1995 . . . . . . . . . . . . . . Processed Vegetables3015 February 1997 . . . . . . . . . . . . . . . Hides, Skins, and Leather3020 March 1997 . . . . . . . . . . . . . . . . . Nonalcoholic Beverages3022 April 1997 . . . . . . . . . . . . . . . . . . Industrial Papers and Paperboards3080 January 1998 . . . . . . . . . . . . . . . . Dairy Products3083 February 1998 . . . . . . . . . . . . . . . Canned Fish, Except Shellfish3095 March 1998 . . . . . . . . . . . . . . . . . Milled Grains, Malts, and Starches3096 April 1998 . . . . . . . . . . . . . . . . . . Millwork3145 December 1998 . . . . . . . . . . . . . . Wool and Related Animal Hair3148 December 1998 . . . . . . . . . . . . . . Poultry3171 March 1999 . . . . . . . . . . . . . . . . . Dried Fruits Other Than Tropical3268 December 1999 . . . . . . . . . . . . . . Eggs3275 January 2000 . . . . . . . . . . . . . . . . Animal Feeds3350 September 2000 . . . . . . . . . . . . . . Grain (Cereals)3352 September 2000 . . . . . . . . . . . . . . Edible Nuts3355 September 2000 . . . . . . . . . . . . . . Newsprint3373 November 2000 . . . . . . . . . . . . . . Distilled Spirits3391 January 2001 . . . . . . . . . . . . . . . . Cotton3461 October 2001 . . . . . . . . . . . . . . . . Cured Fish3463 October 2001 . . . . . . . . . . . . . . . . Fresh or Frozen Fish3490 February 2002 . . . . . . . . . . . . . . . Wood Pulp and Waste Paper3576 February 2003 . . . . . . . . . . . . . . . Oilseeds3579 February 2003 . . . . . . . . . . . . . . . Live Sheep and Meat of Sheep3580 February 2003 . . . . . . . . . . . . . . . Cut Flowers3592 April 2003 . . . . . . . . . . . . . . . . . . Pasta

iii
CONTENTSPage
Preface . . . . . . . . . . . . . . . . . . . . . . . . . . . . . . . . . . . . . . . . . . . . . . . . . . . . . . . . . . . . . . . . . . . i
Abstract . . . . . . . . . . . . . . . . . . . . . . . . . . . . . . . . . . . . . . . . . . . . . . . . . . . . . . . . . . . . . . . . . 1
Introduction . . . . . . . . . . . . . . . . . . . . . . . . . . . . . . . . . . . . . . . . . . . . . . . . . . . . . . . . . . . 3
U.S. industry profile . . . . . . . . . . . . . . . . . . . . . . . . . . . . . . . . . . . . . . . . . . . . . . . . . 3
Commercial and retail bakeries . . . . . . . . . . . . . . . . . . . . . . . . . . . . . . . . . . . . . . . . . . . . . . 4Employment . . . . . . . . . . . . . . . . . . . . . . . . . . . . . . . . . . . . . . . . . . . . . . . . . . . . . . . . . . 4Capacity and capacity utilization . . . . . . . . . . . . . . . . . . . . . . . . . . . . . . . . . . . . . . . . . . 5
Frozen cakes, pies, and other pastries manufacturers . . . . . . . . . . . . . . . . . . . . . . . . . . . . . 6Employment . . . . . . . . . . . . . . . . . . . . . . . . . . . . . . . . . . . . . . . . . . . . . . . . . . . . . . . . . . 6Capacity and capacity utilization . . . . . . . . . . . . . . . . . . . . . . . . . . . . . . . . . . . . . . . . . . 6
Cookie and cracker manufacturers . . . . . . . . . . . . . . . . . . . . . . . . . . . . . . . . . . . . . . . . . . . 7Employment . . . . . . . . . . . . . . . . . . . . . . . . . . . . . . . . . . . . . . . . . . . . . . . . . . . . . . . . . . 7Capacity and capacity utilization . . . . . . . . . . . . . . . . . . . . . . . . . . . . . . . . . . . . . . . . . . 7
Flour mixes and dough manufacturers . . . . . . . . . . . . . . . . . . . . . . . . . . . . . . . . . . . . . . . . 8Employment . . . . . . . . . . . . . . . . . . . . . . . . . . . . . . . . . . . . . . . . . . . . . . . . . . . . . . . . . . 8Capacity and capacity utilization . . . . . . . . . . . . . . . . . . . . . . . . . . . . . . . . . . . . . . . . . . 8
Tortilla manufacturers . . . . . . . . . . . . . . . . . . . . . . . . . . . . . . . . . . . . . . . . . . . . . . . . . . . . . 9Employment . . . . . . . . . . . . . . . . . . . . . . . . . . . . . . . . . . . . . . . . . . . . . . . . . . . . . . . . . . 9Capacity and capacity utilization . . . . . . . . . . . . . . . . . . . . . . . . . . . . . . . . . . . . . . . . . . 9
Marketing practices and prices . . . . . . . . . . . . . . . . . . . . . . . . . . . . . . . . . . . . . . . . . . . . . . 9Channels of distribution . . . . . . . . . . . . . . . . . . . . . . . . . . . . . . . . . . . . . . . . . . . . . . . . . 9Prices . . . . . . . . . . . . . . . . . . . . . . . . . . . . . . . . . . . . . . . . . . . . . . . . . . . . . . . . . . . . . . . 11
U.S. market . . . . . . . . . . . . . . . . . . . . . . . . . . . . . . . . . . . . . . . . . . . . . . . . . . . . . . . . . . . . 12
Consumer characteristics and factors affecting demand . . . . . . . . . . . . . . . . . . . . . . . . . . . 12Commercial and retail bakery products . . . . . . . . . . . . . . . . . . . . . . . . . . . . . . . . . . . . . 14Frozen cakes, pies, and other pastry products . . . . . . . . . . . . . . . . . . . . . . . . . . . . . . . . 15Cookie and cracker products . . . . . . . . . . . . . . . . . . . . . . . . . . . . . . . . . . . . . . . . . . . . . 16Mixes and dough products . . . . . . . . . . . . . . . . . . . . . . . . . . . . . . . . . . . . . . . . . . . . . . . 17Tortilla products . . . . . . . . . . . . . . . . . . . . . . . . . . . . . . . . . . . . . . . . . . . . . . . . . . . . . . . 18
U.S. shipments . . . . . . . . . . . . . . . . . . . . . . . . . . . . . . . . . . . . . . . . . . . . . . . . . . . . . . . . . . 18Factors affecting production . . . . . . . . . . . . . . . . . . . . . . . . . . . . . . . . . . . . . . . . . . . . . . . . 19
Energy and other manufacturing costs . . . . . . . . . . . . . . . . . . . . . . . . . . . . . . . . . . . . . . 19Labor costs . . . . . . . . . . . . . . . . . . . . . . . . . . . . . . . . . . . . . . . . . . . . . . . . . . . . . . . . . . . 19Wheat and wheat flour costs . . . . . . . . . . . . . . . . . . . . . . . . . . . . . . . . . . . . . . . . . . . . . 19Sugar costs . . . . . . . . . . . . . . . . . . . . . . . . . . . . . . . . . . . . . . . . . . . . . . . . . . . . . . . . . . . 20Other ingredient costs . . . . . . . . . . . . . . . . . . . . . . . . . . . . . . . . . . . . . . . . . . . . . . . . . . 20Production process and technology changes . . . . . . . . . . . . . . . . . . . . . . . . . . . . . . . . . 20

iv
CONTENTS—ContinuedPage
U.S. trade . . . . . . . . . . . . . . . . . . . . . . . . . . . . . . . . . . . . . . . . . . . . . . . . . . . . . . . . . . . . . . . 21
Overview . . . . . . . . . . . . . . . . . . . . . . . . . . . . . . . . . . . . . . . . . . . . . . . . . . . . . . . . . . . . . . . 21U.S. imports . . . . . . . . . . . . . . . . . . . . . . . . . . . . . . . . . . . . . . . . . . . . . . . . . . . . . . . . . . . . 22
Principal suppliers and import levels . . . . . . . . . . . . . . . . . . . . . . . . . . . . . . . . . . . . . . . 23Canada . . . . . . . . . . . . . . . . . . . . . . . . . . . . . . . . . . . . . . . . . . . . . . . . . . . . . . . . . . . . 23European Union . . . . . . . . . . . . . . . . . . . . . . . . . . . . . . . . . . . . . . . . . . . . . . . . . . . . 25Mexico . . . . . . . . . . . . . . . . . . . . . . . . . . . . . . . . . . . . . . . . . . . . . . . . . . . . . . . . . . . . 26
U.S. trade measures . . . . . . . . . . . . . . . . . . . . . . . . . . . . . . . . . . . . . . . . . . . . . . . . . . . . 27Tariff and nontariff measures . . . . . . . . . . . . . . . . . . . . . . . . . . . . . . . . . . . . . . . . . . 27
U.S. exports . . . . . . . . . . . . . . . . . . . . . . . . . . . . . . . . . . . . . . . . . . . . . . . . . . . . . . . . . . . . . 27Foreign trade measures . . . . . . . . . . . . . . . . . . . . . . . . . . . . . . . . . . . . . . . . . . . . . . . . . . . . 28
Bakery products . . . . . . . . . . . . . . . . . . . . . . . . . . . . . . . . . . . . . . . . . . . . . . . . . . . . . . . 28Mixes and dough products . . . . . . . . . . . . . . . . . . . . . . . . . . . . . . . . . . . . . . . . . . . . . . . 28
Foreign investments . . . . . . . . . . . . . . . . . . . . . . . . . . . . . . . . . . . . . . . . . . . . . . . . . . . . . . 29Foreign market and industry profiles . . . . . . . . . . . . . . . . . . . . . . . . . . . . . . . . . . . . . . . . . 29
Canada . . . . . . . . . . . . . . . . . . . . . . . . . . . . . . . . . . . . . . . . . . . . . . . . . . . . . . . . . . . . . . 29European Union . . . . . . . . . . . . . . . . . . . . . . . . . . . . . . . . . . . . . . . . . . . . . . . . . . . . . . . 32Mexico . . . . . . . . . . . . . . . . . . . . . . . . . . . . . . . . . . . . . . . . . . . . . . . . . . . . . . . . . . . . . . 33
AppendixesA. Explanation of tariff and trade agreement terms . . . . . . . . . . . . . . . . . . . . . . . . . . . . . . . . . . . . A-1B. Statistical tables . . . . . . . . . . . . . . . . . . . . . . . . . . . . . . . . . . . . . . . . . . . . . . . . . . . . . . . . . . . . . B-1
Figures1. Channels of distribution for the U.S. bakery products industry . . . . . . . . . . . . . . . . . . . . . . . . 102. Trends in U.S. shipments of bakery products, 1998-2001 . . . . . . . . . . . . . . . . . . . . . . . . . . . . 183. U.S. imports for consumption of all bakery products, by major sources, 1998-2002 . . . . . . . . 224. U.S. imports for consumption of bread, cake, and pastry products, by major sources,
1998-2002 . . . . . . . . . . . . . . . . . . . . . . . . . . . . . . . . . . . . . . . . . . . . . . . . . . . . . . . . . . . . . . . 235. U.S. imports for consumption of cookie and cracker products, by major sources,
1998-2002 . . . . . . . . . . . . . . . . . . . . . . . . . . . . . . . . . . . . . . . . . . . . . . . . . . . . . . . . . . . . . . . 246. U.S. imports of bakery products from Canada, by selected product types, 1998-2002 . . . . . . 247. U.S. imports of bakery products from the EU, by selected product types, 1998-2002 . . . . . . . 26
TablesB-1. Bakery products industry: Number of establishments, employment, and value of
shipments, 1998-2001 . . . . . . . . . . . . . . . . . . . . . . . . . . . . . . . . . . . . . . . . . . . . . . . . . . . . B-3B-2. Bakery products: Selected consumer price index data, January 1998-December 2002 . . . . B-4B-3. White pan bread prices, selected major U.S. cities, 1998-2001 . . . . . . . . . . . . . . . . . . . . . . B-5

CONTENTS—ContinuedPage
v
Tables—ContinuedB-4. Bakery products: U.S. shipments, U.S. exports of domestic merchandise, U.S.
imports for consumption, U.S. apparent consumption, and merchandise tradebalance, 1998-2002 . . . . . . . . . . . . . . . . . . . . . . . . . . . . . . . . . . . . . . . . . . . . . . . . . . . . . . B-5
B-5. Cookie and cracker products: U.S. shipments, U.S. exports of domestic merchandise,U.S. imports of consumption, U.S. apparent consumption, and merchandise tradebalance, 1998-2002 . . . . . . . . . . . . . . . . . . . . . . . . . . . . . . . . . . . . . . . . . . . . . . . . . . . . . . B-5
B-6. Mixes and dough products: U.S. shipments, U.S. exports of domestic merchandise,U.S. imports for consumption, U.S. apparent consumption, and merchandisetrade balance, 1998-2002 . . . . . . . . . . . . . . . . . . . . . . . . . . . . . . . . . . . . . . . . . . . . . . . . . B-5
B-7. Bakery products industry: Cost of materials, value of shipments, and ratio of costof materials to shipments, 1998-2001 . . . . . . . . . . . . . . . . . . . . . . . . . . . . . . . . . . . . . . . . B-6
B-8. U.S. wheat: Prices of hard red winter, soft red winter, and hard red spring wheat, inselected U.S. cities, June 1997-Feb. 2003 . . . . . . . . . . . . . . . . . . . . . . . . . . . . . . . . . . . . . B-7
B-9. U.S. domestic production of wheat flour, 1997-2002, and bakery flour prices, inselected U.S. cities, marketing years 1997/98-2001/02 . . . . . . . . . . . . . . . . . . . . . . . . . . B-8
B-10. Wheat flour, producer price index, Jan. 1998-Feb. 2003 . . . . . . . . . . . . . . . . . . . . . . . . . . . B-9B-11. U.S. raw sugar price, New York, Jan.1998-Mar. 2003 . . . . . . . . . . . . . . . . . . . . . . . . . . . . . B-9B-12. World raw sugar price, Jan. 1998-Mar. 2003 . . . . . . . . . . . . . . . . . . . . . . . . . . . . . . . . . . . . B-9B-13. Bakery products: U.S. domestic exports, U.S. imports, for consumption, and U.S.
merchandise trade balance, 1998-2002 . . . . . . . . . . . . . . . . . . . . . . . . . . . . . . . . . . . . . . . B-10B-14. Bakery products: U.S. imports for consumption, by selected countries, 1998-2002 . . . . . . B-11B-15. Bread, pastry, and cake products: U.S. imports for consumption, by selected
countries, 1998-2002 . . . . . . . . . . . . . . . . . . . . . . . . . . . . . . . . . . . . . . . . . . . . . . . . . . . . . B-11B-16. Cookie and cracker products: U.S. imports for consumption, by selected countries,
1998-2002 . . . . . . . . . . . . . . . . . . . . . . . . . . . . . . . . . . . . . . . . . . . . . . . . . . . . . . . . . . . . . B-12B-17. Mixes and dough products: U.S. imports for consumption, by selected countries,
1998-2002 . . . . . . . . . . . . . . . . . . . . . . . . . . . . . . . . . . . . . . . . . . . . . . . . . . . . . . . . . . . . . B-12B-18. Bakery products: U.S. exports of domestic merchandise, by selected countries,
1998-2002 . . . . . . . . . . . . . . . . . . . . . . . . . . . . . . . . . . . . . . . . . . . . . . . . . . . . . . . . . . . . . B-13B-19. Bread, pastry, and cake products: U.S. exports of domestic merchandise, by
selected countries, 1998-2002 . . . . . . . . . . . . . . . . . . . . . . . . . . . . . . . . . . . . . . . . . . . . . . B-14B-20. Cookie and cracker products: U.S. exports of domestic merchandise, by selected
countries, 1998-2002 . . . . . . . . . . . . . . . . . . . . . . . . . . . . . . . . . . . . . . . . . . . . . . . . . . . . . B-15B-21. Mixes and dough products: U.S. exports of domestic merchandise, by selected
countries, 1998-2002 . . . . . . . . . . . . . . . . . . . . . . . . . . . . . . . . . . . . . . . . . . . . . . . . . . . . . B-16B-22. Bakery products: U.S. imports for consumption from Canada, by Customs District,
1998-2002 . . . . . . . . . . . . . . . . . . . . . . . . . . . . . . . . . . . . . . . . . . . . . . . . . . . . . . . . . . . . . B-17B-23. Bakery products: Harmonized Tariff Schedule subheading; description; U.S. col. 1
rate of duty as of Jan. 1, 2003; bound concession rate of duty; U.S. exports, 2002;and U.S. imports, 2002 . . . . . . . . . . . . . . . . . . . . . . . . . . . . . . . . . . . . . . . . . . . . . . . . . . B-18


1
ABSTRACT
This summary analyzes trade and industry conditions in the U.S. bakery products marketfor the period 1998-2002. Bakery products include bread, rolls, tortillas, cakes, pastries,cookies, crackers, mixes and dough, and related products.
• Imports increased significantly during the 1998-2002 period; however, imports
still account for a small portion of total consumption. Imports increased byapproximately 50 percent; however, they still accounted for only 2.4 percent ofapparent U.S. consumption in 2001. Canada is the largest source of imports of alltypes of bakery products, and imports from Canada increased significantly.
• The United States has a sizeable, and growing, trade deficit in bakery products.U.S. exports have increased only marginally, while imports have grownsignificantly. The U.S. trade deficit in bakery products increased from$395 million in 1998 to $778 million in 2002. However, the United States doeshave a slight trade surplus in mixes and dough products. This appears, in part, tobe attributable to lower levels of imports, which face tariff barriers, unlike mostother bakery products.
• There has been some merger and acquisition activity in the U.S. bakery productsindustry, which has led to some rationalization of production capacity.Improvements in processing technology now allow producers to ship fresh bakeryproducts longer distances and to serve wider markets. Further improvements in,and adoption of, new processing technologies will likely further increasecompetition, both from domestic producers serving previously distant markets andfrom increasing imports.
• During 2002, producers faced sharply rising input costs for wheat flour, cocoa,and other ingredients. Wheat flour prices increased sharply as a result of droughtconditions in major wheat producing regions that resulted in lower wheatproduction. Cocoa costs increased as a result of political strife in Côte D’Ivoire,the major cocoa producing region.


1 Calculations of trends in the bakery industry, as a whole, based on U.S. Census Bureau datafor 1998 are not possible because of a misclassification error in the 1998 data for retail bakeries.This error led to the inclusion of firm data that should not have been classified as retail bakeries.Trends not incorporating data for the retail bakery segment are possible as these data are properlyclassified. 2 U.S. Bureau of the Census, Annual Survey of Manufacturers 2002, Dec. 20, 2002.
3
INTRODUCTION
This summary provides information on bakery products, such as bread, rolls, cookies,crackers, pastries, and mixes and dough. Bread, roll, cake, cookie, cracker, and pastryproducts are classified under heading 1905 of the Harmonized Tariff Schedule of the UnitedStates (HTS). However, snack food products classified under HTS subheading 1905.90.90are excluded from this summary. Flour mixes and dough products are classified under HTSsubheading 1901.20. This report provides information on the U.S. and some foreignindustries, domestic and foreign tariff and nontariff barriers, and the conditions ofcompetition in these markets. This analysis generally covers the period from 1998-2002;however, some limited historical data are included to show long-term trends and significantindustry changes.
U.S. industries producing bakery products are experiencing a variety of changes in theirmarkets. Consolidation has recently occurred in certain segments of the domestic industry,such as wholesale bakeries. International trade is an increasingly important and significantfactor both through goods trade and foreign direct investment. Imports have increasedsubstantially from 1998 through 2002. Canada is the largest source of bakery productsimports and is the largest export market for U.S.-produced products.
U.S. INDUSTRY PROFILE
U.S. industries producing bakery products represent a wide range of products, includingfresh and frozen bread, cakes, cookies, mixes and dough, and tortillas. These industries areclassified under several different six-digit North American Industry Classification System(NAICS) codes. The relevant NAICS codes include 311811, retail bakeries; 311812,commercial bakeries; 311813, frozen cakes, pies, and other pastries manufacturing; 311821,cookie and cracker manufacturing; 311822, flour mixes and dough manufacturing frompurchased flour; and 311830, tortilla manufacturing. In total there were 10,637establishments classified under these NAICS codes in 1999, the latest year for whichestablishment data are available (table B-1). These industries employed 318,680 workers in2001, which is an increase of approximately 2.6 percent from 1999.1 The value of shipmentsfrom all these industries totaled $47.9 billion in 2001, an increase of 5.4 percent since 1999.2According to data published in the 2001 Bakery Production and Marketing Red Book, thereare more than 3,400 bakery operations producing these products. This figure approximates

3 Data published in the Bakery Production and Marketing Red Book are based on surveys of theindustry. The sample, data collection, and survey methods may vary from those used by the U.S.Bureau of the Census. Therefore, direct comparison of these data is not possible; however, thedata are useful in corroborating trends in the U.S. Bureau of the Census data. 4 Calculations of trends in the bakery industry, as a whole, based on U.S. Census Bureau datafor 1998 are not possible because of a misclassification error in the 1998 data for retail bakeries.This error led to the inclusion of firm data that should not have been classified as retail bakeries.Trends not incorporating data for the retail bakery segment are possible as these data are properlyclassified.
4
the number of baking operations along product type; therefore, a single plant may be countedmore than once if multiple products are produced in the same facility.3
Commercial and Retail Bakeries
Commercial bakeries had shipments valued at $25.7 billion in 2001, an increase of17.6 percent from $21.9 billion in 1998 (table B-1). Products produced by commercialbakeries classified under NAICS 311812 include fresh and frozen bread, rolls, bagels, andfresh snack cakes, cakes, pies and other pastry products. Major commercial bread producersinclude Interstate Bakeries Corp., Sara Lee Corp., Flowers Foods, Pepperidge Farm, AlphaBaking Company, and United States Bakery. There is significant foreign participation in theU.S. commercial baking market. Bimbo Bakeries USA, is an affiliate of Grupo Bimbo,Mexico’s largest wholesale bakery company. Two Canadian companies, Canada Bread(owned by Maple Leaf Foods) and George Weston Ltd., also have a significant presence inthe U.S. market.
Retail bakeries, as classified under NAICS 311811, had shipments valued at $2.5 billion in2001. Shipments increased from $2.2 billion in 1999 to $2.6 billion in 2000, before decliningslightly in 2001. Most retail bakeries are small, independently owned operations with oneor two production/retail locations. Major retail chains include, Panera Bread Company,Krispy Kreme Bakery, Montana Mills Bread Company, Dunkin’ Donuts, and Tim Horton’s.
Employment
Employment in the commercial and retail bakery sectors increased slightly during the1999-2001 period. Total employment increased by approximately 2.2 percent, whileproduction-related employment increased by approximately 0.7 percent (table B-1).However, all the growth in employment can be attributed to the commercial bakery segment.Total employment in the commercial bakery segment increased by 13,314 positions between1999-2001. The number of production-related workers increased by 7,067 positions. Totalemployment in the retail bakery segment declined by 539 positions, while production-relatedworkers declined by 945 positions between 1999-2001.4

5 U.S. Bureau of the Census, Survey of Plant Capacity 2000, Jan. 2002. 6 U.S. Bureau of the Census, Annual Survey of Manufacturers 2002, Dec. 20, 2002. 7 It is unclear to what degree this decline in operations is the result of the missclassificationerror in the Census data and how much of the decline represents an actual reduction in theindustry. 8 Bakery Production and Marketing Red Book, 1998 and 2001. 9 Ibid.
5
Capacity and Capacity Utilization
The commercial bakery industry has experienced some recent consolidation and is currentlyundergoing significant changes in how products are marketed and distributed. Thisconsolidation may have been spurred by some excess capacity in the industry. The latestfigures from the U.S. Census Bureau (Census) reported capacity utilization rates of only 72percent for commercial bakeries in 2000. This is down from utilization rates of 76 percentin 1999 and 74 percent in 1998.5 Examples of consolidations within this segment include thepurchase of Metz Baking by The Earthgrains Company and the subsequent purchase of TheEarthgrains Company by Sara Lee in 2002. This acquisition vaulted Sara Lee to the secondoverall position in fresh bread production, behind Interstate Bakeries Corp. Other examplesof consolidation in the industry are the purchase of Bestfoods Baking by George Weston Ltd.(which had made Weston the number two bakery in the United States prior to the Earthgrains- Sara Lee merger), and the purchase of Mrs. Baird’s bakery operations in the South andSouthwest United States by Grupo Bimbo USA. In the retail sector, Krispy Kreme recentlypurchased Montana Mills Bread Company.
Consolidation has resulted in a significant decline in bakery operations. Census data indicatethat the number of commercial and retail bakery operations declined from 10,438 to 9,509from 1998 to 1999, the latest year for which data are available.6 The decline in retail bakeryoperations was more significant than the decline in commercial operations and accounted forthe majority of the total reduction in number of operations. The number of retail bakeries fellfrom 7,673 in 1998 to 6,780 in 1999.7 The number of commercial bakeries declined from2,765 in 1998 to 2,729 in 1999. More recent data indicate these declines continued after1999. Data compiled in the Bakery Production and Marketing Red Book indicate that thenumber of commercial bakery plants declined from 1,441 in 1998 to 1,151 in 2001.8
Production operations associated with multi-store, retail bakeries declined from 213 facilitiesin 1998 to 160 facilities in 2001.9
A greater share of the contraction in production facilities was accounted for by smalleroperations. The number of commercial operations employing 1-99 workers fell from 983 in1998 to 794 in 2001. The number of multi-store, retail production facilities with 1-99employees fell from 180 to 124 during the same period. Generally, however, the number offacilities of all sizes declined. The number of commercial operations with 100-499employees declined from 365 to 293 and those with 500 or more employees declined from93 to 64. The number of multi-store, retail facilities with 100-499 employees increased from28 in 1998 to 32 in 2001, while those with 500 or more employees declined slightly from 5to 4.
Not captured in these figures, however, is the impact of improvements in productiontechnology. High speed production lines have doubled production speed over the last 10years. Thus, bakeries have been able to significantly increase production withoutcorresponding increases in employment.

10 U.S. Bureau of the Census, Annual Survey of Manufacturers 2002, Dec. 20, 2002. 11 Bakery Production and Marketing Red Book, 1998 and 2001.
6
Frozen Cakes, Pies, and Other Pastries Manufacturers
Many of the major commercial bakery companies are also involved in the frozen cakes, pies,and other pastries manufacturing. For example, Sara Lee Corp., Pepperidge Farm, and Mrs.Smith’s Bakeries are leading producers of frozen cakes and pies. Additionally, severalcompanies active in the mixes and dough segment also produce frozen bakery products, suchas the Pillsbury Co. Another company involved in the frozen segment is Edwards FineFoods. Shipments of frozen cakes, pies, and other pastry products have increased steadilyfrom 1998 to 2001. Shipments remained largely stable in 1998 and 1999 at approximately$2.6 billion. However, shipments increased to $2.9 billion in 2000, and increased to over$3.0 billion in 2001.
Employment
Employment in the frozen cakes, pies and other pastries manufacturing sector increased byapproximately 8 percent from 1998 to 2001. The total number of employees increased from15,402 in 1998 to 16,742 in 2001.10 The number of production-related workers increasedfrom 12,554 in 1998 to 13,744 in 2001.
Capacity and Capacity Utilization
The merger and acquisition activity that characterized the commercial bakery market during1998-2002 also impacted producers of frozen products, since many commercial producersof fresh products also produce frozen products. A recent example of merger and acquisitionactivity specifically relating to frozen cakes and pies is the sale by Flowers Foods of its Mrs.Smith’s frozen desert business to the Schwan Food Company.
U.S. Census Bureau data indicate that despite an increase in employment in this sector, thenumber of production facilities has declined. Specifically, the Census data show a declinein the number of facilities from 242 in 1998 to 233 in 1999. Although not directlycomparable, data on the number of operations producing cakes, pies and other pastries of alltypes, frozen and non-frozen, indicate a decline in the number of operations as well. Datafrom the Bakery Production and Marketing Red Book indicate a decline from 4,512 in 1998to 4,201 in 2001.11

12 Snack Food & Wholesale Bakery, June 2002. 13 U.S. Bureau of the Census, Annual Survey of Manufacturers 2002, Dec. 20, 2002. 14 Ibid. 15 Milling & Baking News, Cracker Sales Grow, Apr. 29, 2003. 16 Ibid. 17 Ibid. 18 U.S. Bureau of the Census, Survey of Plant Capacity 2000, Jan. 2002.
7
Cookie and Cracker Manufacturers
Cookies, crackers, sweet biscuits, waffles, and wafers represent a fairly diverse group ofproducts. The industry in this segment is characterized by a very high rate of productintroductions and market share is dominated by a handful of major corporations. Nabisco(now owned by Kraft Foods) and the Keebler Co. (now owned by the Kellogg Company)account for the vast majority of the market. In 2001, cookie products produced by Nabiscoand the Keebler Co. accounted for 8 of the top 10 cookie brands.12 Shipments in the cookieand cracker market increased from $10.3 billion in 1998 to $10.5 billion in 2001.
Employment
Employment in the cookie and cracker segment has declined. Total employment declinedfrom 42,189 in 1998 to 39,556 in 2001.13 The number of production-related workers declinedfrom 32,726 in 1998 to 31,129 in 2001.
Capacity and Capacity Utilization
The number of production facilities in the cookie and cracker segment declined from 411 in1998 to 401 in 1999 according to Census data.14 Data published in the Bakery Productionand Marketing Red Book indicate a decline in production operations from 1,182 in 1998 to947 in 2001. This segment also experienced some transformation with the mergers andacquisitions of Nabisco and Kraft Foods and the acquisition of Keebler Foods by Kellogg.While these mergers and acquisitions increased industry concentration in the cookie andcracker market, a number of other firms are also significant participants. In 2002, KraftFoods and Nabisco branded products combined accounted for approximately 49 percent ofall retail sales of cracker products.15 Branded products produced by Keebler Foods accountedfor approximately 25 percent of all retail sales.16 Other significant participants in the retailcracker market include Pepperidge Farm, Lance Inc., and Red Oval Farms. These three firmsaccounted for approximately 11.5 percent of retail sales in 2002.17 The latest data fromCensus indicated significant underutilization of plant capacity in 2000. Census reported autilization rate of only 67 percent in 2000.
Although this is an improvement from a utilization rate of 63 percent in 1999, it is downfrom a utilization rate of 70 percent in 1998.18

19 Milling & Baking News, Refrigerated Dough Showdown, Apr. 13, 2002. 20 Ibid. 21 Milling & Baking News, Taking Shape, Jan. 21, 2003. 22 U.S. Bureau of the Census, Annual Survey of Manufacturers 2002, Dec. 20, 2002. 23 U.S. Bureau of the Census, Survey of Plant Capacity 2000, Jan. 2002.
8
Flour Mixes and Dough Manufacturers
Products manufactured by this industry consist of products utilized by in-store bakerydepartments, other retail bakery operations, and the food service industry, as well as retailproducts. Commercial operations, such as retail and in-store bakeries, often utilize pre-mademixes and dough in their operations.
Major retail frozen and refrigerated dough manufacturers include The Earthgrains Company(now owned by Sara Lee), Pillsbury (now owned by General Mills), Mrs. Smith's Bakeries,and the Nestlé company. Major wholesale mix and dough producers are Bunge Foods, RichProducts Corp., Dawn Food Products, George Weston Bakeries, and the Canada BreadCompany (the latter two are Canadian companies). Significant merger activity occurred in2001 as General Mills purchased Pillsbury and Sara Lee Corp. acquired The EarthgrainsCompany. Pillsbury holds approximately 80 percent of the retail market for brandedrefrigerated dough, with Nestle as the number two supplier. Sara Lee controls much of theprivate label segment of the market.19 These three companies now control virtually all theretail refrigerated dough market.20 Growth in the retail market for refrigerated doughproducts is driven primarily by new product development.21
The value of shipments in the mixes and dough segment has declined irregularly during the1998-2001 period. Shipments increased from $5.0 billion in 1998 to $5.3 billion in 1999.However, shipments declined to $4.6 billion in 2000, before recovering slightly to$4.8 billion in 2001.
Employment
Employment in the flour mixes and dough segment increased steadily during the 1998 to2001 period. Total employment increased from 15,232 in 1998 to 19,962 in 2001.22 Thenumber of production-related workers increased from 11,843 in 1998 to 15,914 in 2001.
Capacity and Capacity Utilization
The latest available Census data indicate that despite the increase in employment in thissector the number of production facilities has declined. Census data show a decline from 250facilities in 1998 to 247 facilities in 1999. Census data further indicate an irregular declinein capacity utilization rates from 79 in 1998 to 76 percent in 2000.23 The 2001 edition of theBakery Production and Marketing Red Book identifies 347 operations producing frozendough. This is a sharp decline from 420 such operations in 1998. The majority of mix anddough operations are wholesale producers, while the next largest segment consists ofoperations that are part of larger baked goods manufacturers.
24 U.S. Bureau of the Census, Annual Survey of Manufacturers 2002, Dec. 20, 2002. 25 U.S. Bureau of the Census, Survey of Plant Capacity 2000, Jan. 2002.
9
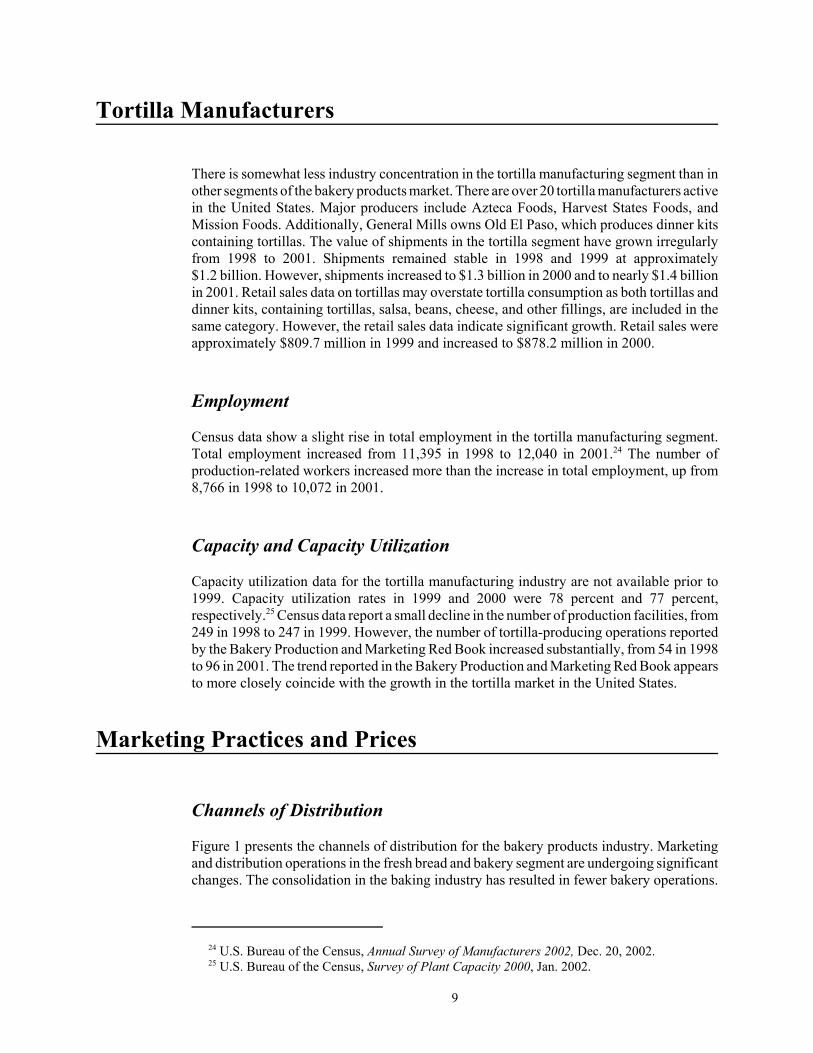
Tortilla Manufacturers
There is somewhat less industry concentration in the tortilla manufacturing segment than inother segments of the bakery products market. There are over 20 tortilla manufacturers activein the United States. Major producers include Azteca Foods, Harvest States Foods, andMission Foods. Additionally, General Mills owns Old El Paso, which produces dinner kitscontaining tortillas. The value of shipments in the tortilla segment have grown irregularlyfrom 1998 to 2001. Shipments remained stable in 1998 and 1999 at approximately$1.2 billion. However, shipments increased to $1.3 billion in 2000 and to nearly $1.4 billionin 2001. Retail sales data on tortillas may overstate tortilla consumption as both tortillas anddinner kits, containing tortillas, salsa, beans, cheese, and other fillings, are included in thesame category. However, the retail sales data indicate significant growth. Retail sales wereapproximately $809.7 million in 1999 and increased to $878.2 million in 2000.
Employment
Census data show a slight rise in total employment in the tortilla manufacturing segment.Total employment increased from 11,395 in 1998 to 12,040 in 2001.24 The number ofproduction-related workers increased more than the increase in total employment, up from8,766 in 1998 to 10,072 in 2001.
Capacity and Capacity Utilization
Capacity utilization data for the tortilla manufacturing industry are not available prior to1999. Capacity utilization rates in 1999 and 2000 were 78 percent and 77 percent,respectively.25 Census data report a small decline in the number of production facilities, from249 in 1998 to 247 in 1999. However, the number of tortilla-producing operations reportedby the Bakery Production and Marketing Red Book increased substantially, from 54 in 1998to 96 in 2001. The trend reported in the Bakery Production and Marketing Red Book appearsto more closely coincide with the growth in the tortilla market in the United States.
Marketing Practices and Prices
Channels of Distribution
Figure 1 presents the channels of distribution for the bakery products industry. Marketingand distribution operations in the fresh bread and bakery segment are undergoing significantchanges. The consolidation in the baking industry has resulted in fewer bakery operations.

26 U.S. Bureau of the Census, Transportation Commodity Flow Survey 1997, Dec. 9, 1999. 27 Ibid. 28 For example, in the last few years Interstate Bakeries has significantly increased the shelf lifeof its products and a Canadian company has reportedly achieved a shelf life of up to 21 days for itsproducts. See Factors Affecting Production section below for additional information.
10
Mixes & dough producers
Commercial, and retail bakeries, frozen bakery products, cookie and cracker producers
Distributors
Retail or food service outlets
Consumers
Figure 1Channels of distribution of the U.S. bakery products industry
As a result, the remaining bakeries are serving wider geographic markets. Prior studies foundthat in 1993, shipments from bakeries to their customers averaged 74 miles per shipment.26
Consolidation, improvement in transportation methods, and the development of extendedshelf life (ESL) products increased the average miles per shipment to 96 miles by 1997. Forall milled grain and bakery products, the average miles per shipment increased from 89 milesin 1993 to 122 miles in 1997.27 Additional consolidation and technology improvements havelikely increased average miles per shipment further since 1997.28 In some cases industryparticipants reported shipments of fresh bakery products to markets 400 miles from the

29 U.S. industry officials, interview by USITC staff, Washington, DC, Sep. 4, 2002. 30 These seven U.S. cities are Boston, Chicago, Cleveland, Detroit, New York City, Pittsburgh,and Washington, DC.
11
bakery.29 Additionally, these distribution and marketing changes have increased the abilityof imported products to successfully compete in U.S. markets. Previously, the perishablenature of many bakery products limited the ability of imported products to have a significantrole in the market.
Many bakery products, including breads, cookies and crackers, and pastry products, aredistributed to the retail and vending outlets through direct-to-store delivery (DSD) systems.This system utilizes dedicated delivery staff who are responsible for a specific route or groupof stores. The delivery driver is responsible for ensuring that fresh product remains on thestore shelves and that the store is sufficiently stocked with product.
The overwhelming majority of retail purchases of bread and other bakery products are madeat grocery stores. Mass merchandisers, such as Wal Mart and Costco, represent the nextlargest distribution outlet. Additionally, the food service market is an extremely importantmarket for bread products. This market includes hospital, school, and prison cafeterias, aswell as restaurants and catering outlets. Although not as large as the retail market, the foodsservice market is sizeable.
Product distribution for cookie and cracker products is somewhat more diverse than forbread products. Although a significant share of sales is made through the grocery store/massmerchant outlets, a significant portion of sales also occur through the convenience store andvending machine outlets.
Prices
Consumer price index (CPI) data for bread indicate a fairly regular increase in bread pricesbetween January 1998 and December 2002 (table B-2). The CPI data for bread are also fairlystable, with few large swings in bread prices from month to month. The CPI data for cookiesare somewhat more volatile. The data exhibit several instances of significant swings in priceson a month to month basis. This includes sharp increases in prices during the September-December 1999, February-March 2000, and August-December 2002 periods. The sharpincreases in prices during the latter half of 2002 may be partially attributable to a sharp risein ingredient costs in 2002. The CPI data for crackers are even more volatile, exhibitingnumerous sharp increases and decreases in prices during the 1998-2002 period. Prices forfrozen bakery products exhibited significant increases during 1998-99 and 2000-01 and2001-02.
Prices for bread products can vary significantly across geographic regions. Data collectedby the Economist Intelligence Unit table for seven major U.S. cities indicate a wide rangeof prices for white pan bread (table B-3).30 The average price fluctuated somewhat,decreasing from $2.94 to $2.88 per kilogram from 1998 to 1999. The average price thenincreased to $2.92 per kg in 2000 and to $3.04 in 2001. Price variations across citiesfluctuated to an even greater degree. The average difference from the highest reported priceto the lowest reported price in any year averaged $1.89 per kg. During the 1998 to 2001period the highest reported price averaged $3.70 per kg, while the lowest reported price

31 For a more detailed review see USITC Office of Industries Working Paper: DynamicRelationships Among Selected U.S. Commodity-Based, Value-Added Markets– ApplyingDirected Acyclic Graphs to a Time Series Model, Publication ID-07, July 2003. 32 Bureau of Labor Statistics, U.S. Department of Labor, Consumer Expenditure Survey,Apr. 2002. 33 Milling & Baking News, New Product Introductions Expand in 2002; Confectionary, BakeryStrong, Jan. 21, 2003.
12
averaged $1.82 per kg. When the highest and lowest reported prices for each year aredisregarded, the variability in prices is still significant, with the reported prices differing by$0.45 in 1998, $0.41 in 1999, $1.12 in 2000, and $1.27 in 2001.
Additionally, recent analysis appears to indicate that bread prices are an important andpotentially leading indicator of the movement in prices in other grain-based foods. A vector-autoregression model of the impact of shocks on the price of wheat on wheat-based foodsrevealed that changes in the price of bread accounted for an important portion of changes inthe prices of cookie and cracker products, flour products, and mix and dough products.31 CPIdata for bread products are widely reported among the bakery industry. Thus, other segmentsof the grain-based foods industry may be following the lead of bread prices.
U.S. MARKET
U.S. consumption of bakery products was estimated to be $48.5 billion in 2001 (table B-4).U.S. consumption increased each year from 1998 to 2001 by approximately 3 percent peryear. Imports as a share of consumption increased slightly during this period, from 2.0percent in 1998 to 2.4 percent in 2001.
Consumer Characteristics and Factors Affecting Demand
Consumption of bakery products generally increased over the 1998-2001 period. However,this trend varies, depending on the market segment and region examined (tables B-4, B-5,and B-6). In 2001, the national average weekly expenditure on cereal and bakery productswas $8.69.32 This is a slight decline from the average weekly expenditures of $8.71 in 2000.However, average weekly expenditures increased in the Northeast and South regions of theUnited States, while average weekly expenditure declined in the Midwest and West. From1998 to 2001, average expenditures increased in all four regions. Bakery products accountfor approximately two-thirds of the expenditures on cereal and bakery products. In 2001, theaverage weekly expenditure on bakery products was $5.69; this is a slight decline from $5.71in 2000. The regional trend in bakery product expenditures mirrors that of cereal and bakeryproduct expenditures.
As a result of the mature nature of the bakery products markets, growth in the retail segmentof the market is driven primarily by new product introductions and extensions of existingproduct lines. In 2002, bakery products producers introduced 1,145 new products.33 The

34 Ibid. 35 Milling & Baking News, Restaurant industry group sees 4.5% sales increase in new year,Jan. 7, 2003. 36 World-Grain.com, Survey affirms worsening U.S. image of grain foods, Mar. 26, 2003. 37 Ibid. 38 Atlanta Journal Constitution, Even bread cutting carbs, Feb. 24, 2003. 39 FACT Company Press Release, Apr. 17, 2003. 40 U.S. Food and Drug Administration, U.S. Department of Health and Human Services, FDADraft Action Plan for Acrylamide in Food, Sep. 20, 2002. 41 Ibid.
13
cookie and cracker segment alone had 493 new product introductions, while the bakingingredients and mixes category had 251 new introductions. The bread and bread productscategory had 185 new products.34 Producers of cakes, pastries, and other sweet goodsintroduced 216 new products in 2002.
Several factors have been suggested to explain recent changes in bakery productconsumption. The three most important are increasing convenience/quick preparation timein the marketing of foods, the prevalence of fad diets that stress the avoidance ofcarbohydrate rich foods, and the detection of acrylamide, a potentially cancer causingsubstance in baked and fried foods.
Consumers are increasingly relying on semi-prepared, restaurant-prepared, and otherconvenient, ready-to-eat meal options. Restaurant industry sales are expected to increase4.5 percent in 2003.35 At least some of this anticipated growth comes at the expense ofsupermarkets and grocery stores, which have been experiencing declines in sales values. Theoverall impact of these trends is unclear on the bakery products market. Both the restaurantand grocery store markets are important channels for bakery products. However, as discussedbelow, the drive for increased convenience may be shifting consumption between differenttypes of bakery products.
The most recent years analyzed in this report are characterized by the surging popularity oflow-carbohydrate diets, such as the Atkin’s diet. These diets have changed consumers’perceptions regarding the health benefits of grain-based foods. A Gallup Poll, sponsored bythe American Bakers Association and the Wheat Foods Council, found a significant increasein the number of American consumers that believe grain-based foods are fattening.36 Thesurvey results found that consumers who believe bread is fattening rose from 38 percent in1996 to 56 percent of respondents in 2002.37 This perception has had a negative impact onthe consumption of grain-based foods. To date the grain-based foods industry has attemptedto deal with this perception in several ways. Industry associations have stressed theimportance of a balanced diet, including grain-based foods. Additionally, some members ofthe industry have reformulated product to reduce the amount of carbohydrates. For example,Flowers Foods is marketing a reduced carbohydrate loaf of bread.38 Another company,FACT Corporation in Freehold, NJ, provides a low carbohydrate mix that can be used toproduce bread and bagel products.39
On April 24, 2002, researchers at the Swedish National Food Administration and StockholmUniversity reported finding the chemical acrylamide, in a variety of fried and oven-bakedfoods. The initial Swedish finding most closely associated the presence of acrylamide withhigh temperature cooking processes for carbohydrate-rich foods, including bakeryproducts.40 Acrylamide is a potential human carcinogen.41 The World Health Organization
42 Milling & Baking News, Consumers watch prices closely, but most ignore acrylamide issue,Mar. 25, 2003. 43 Milling & Baking News, Fiercely fighting for growth, Mar. 18, 2003. 44 Snack Food & Wholesale Bakery, June 2002, June 2001, and June 2000. 45 Ibid., and Milling & Baking News, Fiercely fighting for growth, Mar. 18, 2003. 46 Ibid. 47 Ibid. 48 Baking Production and Marketing Red Book, 2001. 49 Snack Food & Wholesale Bakery, June 2000, June 2001, and June 2002 and Milling &Baking News, Fiercely fighting for growth, Mar. 18, 2003. 50 Ibid. 51 Milling & Baking News, Grain-based foods industry outlook 2003: Qualified optimism,Mar. 18, 2003.
14
and the Food and Agriculture Organization issued statements in June 2002 recommendingthat consumers eat a balanced diet, but neither of these organizations, nor the U.S. Food andDrug Administration, have altered their current dietary recommendations as a result of thisresearch. Most of the focus on acrylamide in food has been on fried foods, such as potatochips and french fries. To date, the presence of acrylamide in foods has somewhat impactedconsumption patterns. Two surveys conducted by the Grocery Manufacturers Associationover the last two years found that 8 percent and 12 percent of consumers surveyed hadchanged their diets as a result of acrylamide in food.42
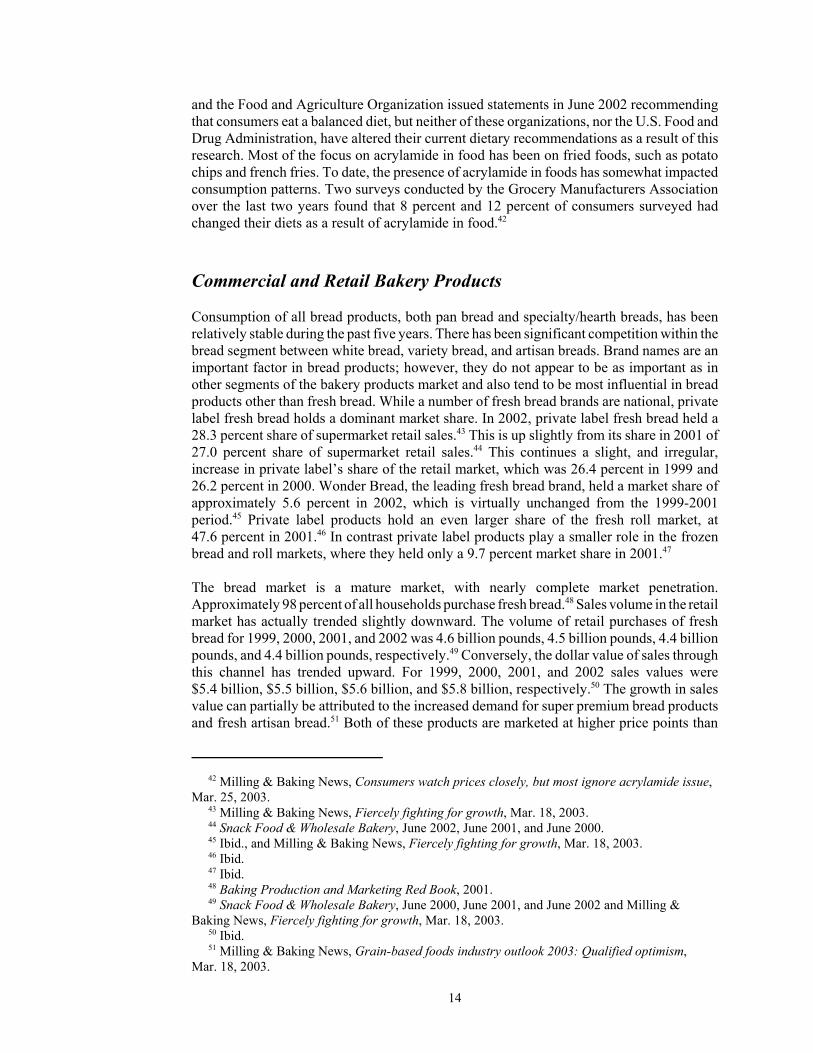
Commercial and Retail Bakery Products
Consumption of all bread products, both pan bread and specialty/hearth breads, has beenrelatively stable during the past five years. There has been significant competition within thebread segment between white bread, variety bread, and artisan breads. Brand names are animportant factor in bread products; however, they do not appear to be as important as inother segments of the bakery products market and also tend to be most influential in breadproducts other than fresh bread. While a number of fresh bread brands are national, privatelabel fresh bread holds a dominant market share. In 2002, private label fresh bread held a28.3 percent share of supermarket retail sales.43 This is up slightly from its share in 2001 of27.0 percent share of supermarket retail sales.44 This continues a slight, and irregular,increase in private label’s share of the retail market, which was 26.4 percent in 1999 and26.2 percent in 2000. Wonder Bread, the leading fresh bread brand, held a market share ofapproximately 5.6 percent in 2002, which is virtually unchanged from the 1999-2001period.45 Private label products hold an even larger share of the fresh roll market, at47.6 percent in 2001.46 In contrast private label products play a smaller role in the frozenbread and roll markets, where they held only a 9.7 percent market share in 2001.47
The bread market is a mature market, with nearly complete market penetration.Approximately 98 percent of all households purchase fresh bread.48 Sales volume in the retailmarket has actually trended slightly downward. The volume of retail purchases of freshbread for 1999, 2000, 2001, and 2002 was 4.6 billion pounds, 4.5 billion pounds, 4.4 billionpounds, and 4.4 billion pounds, respectively.49 Conversely, the dollar value of sales throughthis channel has trended upward. For 1999, 2000, 2001, and 2002 sales values were$5.4 billion, $5.5 billion, $5.6 billion, and $5.8 billion, respectively.50 The growth in salesvalue can partially be attributed to the increased demand for super premium bread productsand fresh artisan bread.51 Both of these products are marketed at higher price points than

52 Snack Food & Wholesale Bakery, June 2000, June 2001, and June 2002. 53 Ibid. 54 Milling & Baking News, Moisture is key, Nov. 26, 2002. 55 Milling & Baking News, Par-baked goods, Nov. 26, 2002. 56 Snack Food & Wholesale Bakery, June 2000, June 2001, and June 2002. 57 Ibid.
15
conventional loaves of white or wheat bread. Consumption of bagels continues to grow,although at a modest pace. This slowing growth in the bagel segment can be partiallyattributed to a decline in bagel consumption as a breakfast food for both at home and awayfrom home meals since 1998.52 Bagels have also reached a mature market position with onlylimited growth projected in the next few years.53
One sector of the bread industry that is experiencing more significant growth is the parbakedmarket. Parbaked products are cooked to 80 to 95 percent completion and then flash frozen.54
These products are generally purchased by the restaurant, retail bakery, institutional and in-store bakery market segments. The benefit of these products is that they eliminate much ofthe time and labor associated with scratch baking but restaurants and in-store bakeries canstill provide fresh bakery products to their customers. In-store bakeries are particularlyincreasing their use of parbaked products.55 In-store bakeries typically use the parbakedproducts to produce artisan style fresh bread products.
Certain segments of the retail bakery market in the United States are growing. Differing fromother countries, especially Europe, consumers do not appear to have as significant apreference for retail bakery products over those produced in commercial operations. Growthin retail bakeries has occurred in conjunction with increased trends in convenience andduring recent period of economic growth, when consumers upgraded to more expensiveproducts. Many retail bakeries provide additional consumer offerings besides bakeryproducts, such as coffees, sandwiches, soups, other food products. As a result, trends in retailbakeries may somewhat mirror those in the restaurant industry.
Frozen Cakes, Pies, and Other Pastry Products
The market for frozen cakes, pies, and other pastry products has been characterized bysignificant product innovation, new product introductions, and an overall shift in the marketto higher quality, premium products. New product introductions from the Sara Lee Corp,Pillsbury, and Kraft Foods have focused on higher quality products using better ingredientsand improved production and freezing technology.56 This has led to increases in retail salesvalue, as consumers purchase higher-priced products, without as significant increases inretail sales volumes. Another new development in the frozen dessert market has been theincreasing number of single-serving products available. In keeping with the overall trend ofincreased convenience and shorter preparation time, a number of producers are marketingsingle-serving frozen cake and pie products.
Based on market share data, brand names are important in the frozen dessert market. Forexample, Mrs. Smith’s, Sara Lee, and Edwards Foods were the three leading frozen pieproducers in 1999, 2000, and 2001.57 Additionally, different segments of the frozen dessertmarket experienced different degrees of growth. For example, the retail market for frozenpies has increased steadily from $259.6 million in 1998, to $271.6 million in 1999, to$289.5 million in 2000, to $318.8 million in 2001. However, other frozen sweet good

58 Ibid. 59 Ibid. 60 Ibid. 61 Bakery Production and Marketing: Red Book, 2001. 62 Snack Food & Wholesale Bakery, June 2000, June 2001, and June 2002. 63 Milling & Baking News, Cracker Sales Grow, Apr. 29, 2003. 64 Ibid. 65 Bakery Production and Marketing: Red Book, 2001. 66 Snack Food & Wholesale Bakery, June 2002. 67 Milling & Baking News, Cracker Sales Grow, Apr. 29, 2003. 68 U.S. industry officials, interview by USITC staff, July 7-9, 2002.
16
products, which includes other pastry products such as strudels, brownies, and cake products,declined from $374.3 million in 1998, to 350.8 million in 1999, to $326.3 million in 2000.58
As a result of these opposing trends, frozen pie products will account for the majority ofsales in this segment.
Cookie and Cracker Products
Census data indicate that cookie and cracker consumption generally increased during the1998-2002 period (table B-5). However, data on cookie and cracker sales through the retailmarket channel indicate that sales of cookies have declined, both in value and volume terms.Retail sales of cookies for 1999, 2000, and 2001 were estimated at $4.5 billion, $4.6 billion,and $4.0 billion, respectively.59 Sales volumes for these three years also declined from1.8 billion pounds in 1999 to 1.5 billion pounds in 2001.60 This situation can partially beattributed to the fact that in-home cookie consumption as a dessert product has fallensignificantly since 1990.61 Additionally, increases in sales of any one particular brand ofcookie often come at the expense of competing brands, as opposed to overall increases inconsumption.
Similar market dynamics have impacted retail sales of cracker products. Sales values for1999, 2000, and 2001 are estimated at $3.5 billion, $3.6 billion, and $3.3 billion,respectively.62 However, retail market data indicate an upward swing in the value of crackersales in 2002, despite a decline in unit sales. Retail cracker sales in 2002 were estimated at$3.4 billion.63 Similar to the retail bread, market sales values are increasing despite declinesin unit sales.64 Sales are largely being driven by product line extensions and new, moreconvenient packaging. The sandwich cracker portion of the cracker market has seen moresignificant growth over the last five years. Sandwich cracker sales volumes and values haveincreased by 37 percent over the last five years.65 Sandwich crackers are generally definedas two cracker wafers containing a filling, often cheese or peanut butter.
Unlike the bread market, private label products do not hold as important a position in thecookie and cracker market. In 2001, private label products held an 8.5 percent retail marketshare for cookies.66 In 2002, private label products accounted for 7.5 percent of retail crackersales.67 However, the private label portion of the market is believed to be a major outlet forimported products, particularly products imported from Canada.68
For both the cookie and cracker markets, the most recent trend in consumption reflects adecline in the health-focused segments of the market. In 1996, more than one-quarter of newproducts in the cookie market made low-fat or no-fat claims on their packaging, while
69 Baking Business.Com, 82% of Americans Indulge in Cookies, Pushing Market Sales to$6.2 Billion, July 17, 2002. 70 Ibid. 71 Milling & Baking News, Frozen Dough from niche to core product June 11, 2002. 72 Ibid. 73 Ibid. 74 Saskatchewan Wheat Pool Company Press Release, Saskatchewan Wheat Pool EntersAgreement to Sell CSP Food To Dawn Food Products, Feb. 25, 2002. 75 The Buffalo News, Rich Products to Spend $15 million, add 40 jobs in Fort Erie Expansion,July 29, 2002.
17
projections for 2002 put the percentage of new cookie products that will have reducedamounts of fat at only 9 percent.69 However, demand for sugar-free products may beincreasing, possibly due to the improved quality of non-sugar sweeteners. Demand forlow-fat or low-calorie products has declined and consumers are increasingly turning toricher, more indulgent varieties.70
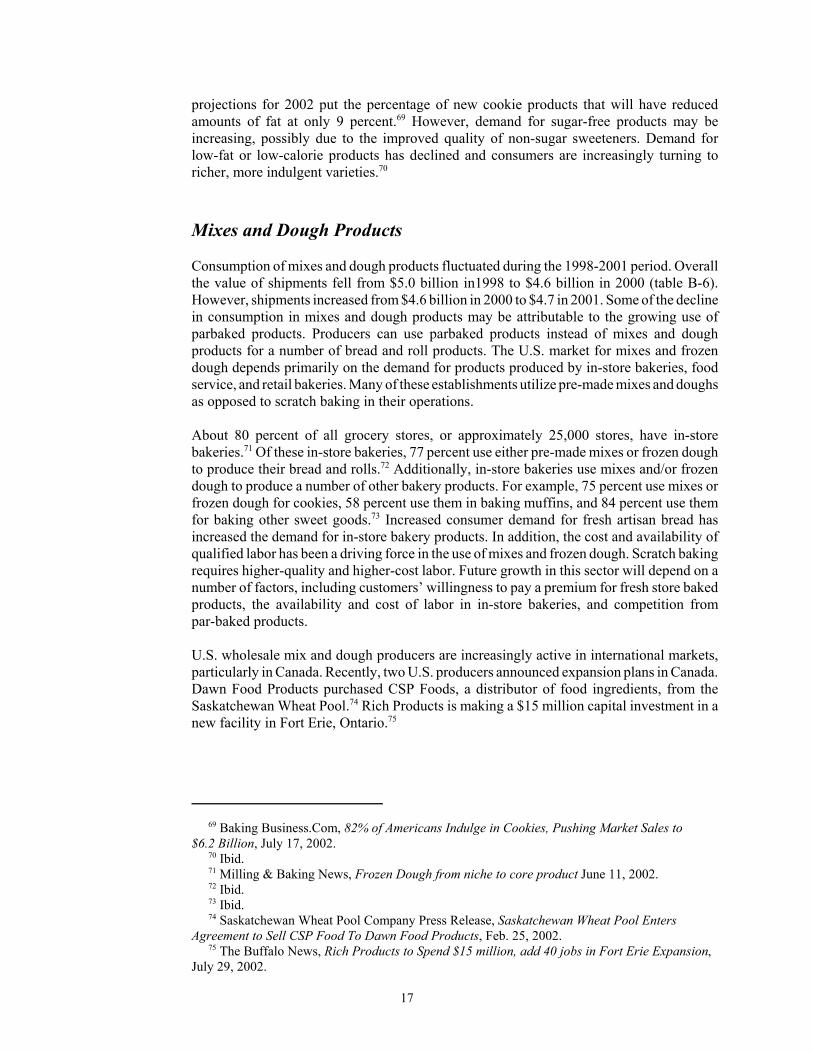
Mixes and Dough Products
Consumption of mixes and dough products fluctuated during the 1998-2001 period. Overallthe value of shipments fell from $5.0 billion in1998 to $4.6 billion in 2000 (table B-6).However, shipments increased from $4.6 billion in 2000 to $4.7 in 2001. Some of the declinein consumption in mixes and dough products may be attributable to the growing use ofparbaked products. Producers can use parbaked products instead of mixes and doughproducts for a number of bread and roll products. The U.S. market for mixes and frozendough depends primarily on the demand for products produced by in-store bakeries, foodservice, and retail bakeries. Many of these establishments utilize pre-made mixes and doughsas opposed to scratch baking in their operations.
About 80 percent of all grocery stores, or approximately 25,000 stores, have in-storebakeries.71 Of these in-store bakeries, 77 percent use either pre-made mixes or frozen doughto produce their bread and rolls.72 Additionally, in-store bakeries use mixes and/or frozendough to produce a number of other bakery products. For example, 75 percent use mixes orfrozen dough for cookies, 58 percent use them in baking muffins, and 84 percent use themfor baking other sweet goods.73 Increased consumer demand for fresh artisan bread hasincreased the demand for in-store bakery products. In addition, the cost and availability ofqualified labor has been a driving force in the use of mixes and frozen dough. Scratch bakingrequires higher-quality and higher-cost labor. Future growth in this sector will depend on anumber of factors, including customers’ willingness to pay a premium for fresh store bakedproducts, the availability and cost of labor in in-store bakeries, and competition frompar-baked products.
U.S. wholesale mix and dough producers are increasingly active in international markets,particularly in Canada. Recently, two U.S. producers announced expansion plans in Canada.Dawn Food Products purchased CSP Foods, a distributor of food ingredients, from theSaskatchewan Wheat Pool.74 Rich Products is making a $15 million capital investment in anew facility in Fort Erie, Ontario.75

76 Tortilla Industry Association, The State of the Tortilla Industry: 2000. 77 Data provided by the Tortilla Industry Association. 78 Ibid.
18
Figure 2 Trends in U.S. shipments of bakery products, 1998-2001
0
5
10
15
20
25
30
1998 1999 2000 2001
($ b
illio
ns)
Retail bakeries
Commercial bakeries
Frozen cakes, pies,and pastries
Cookies and crackers
Mixes and doughs
Tortillas
Tortilla Products
Sales of tortilla products in 2000 were estimated at approximately $4 billion, only slightlybehind sales of fresh bread.76 There has been rapid growth in tortilla consumption. Thetortilla market has grown from $2.8 billion in 1996 to $4.4 billion in 2000 and is expectedto grow to $5.7 billion in 2002.77 Although the growth in the Hispanic population in theUnited States is an important factor in this growth, most market participants believe that thegrowing popularity of tortillas among non-Hispanics is the main source of growth.78
U.S. Shipments
Figure 2 presents the value of U.S. shipments for each segment of the bakery productsindustry. Overall, total shipments have increased from 1998 to 2001.
Source: Compiled from official statistics of the U.S. Department of Commerce.

79 U.S. industry officials, telephone interview by USITC staff, United States, Aug. 13, 2002. 80 Milling & Baking News, Surging health care costs to baking fore, Dec. 10, 2002. 81 Ibid. 82 Harwood, Joy, Leath, Mack, and Heid, Walto, USDA, ERS, The U.S. Milling and BakingIndustries, Dec. 1989.
19
Factors Affecting Production
Overall, the cost of materials as a share of the total value of shipments in the bakery industryhas declined slightly from 37 percent in 1998 to 35 percent in 2001 (table B-7).Manufacturers of frozen cakes and pies and producers of cookie and cracker productsexperienced some increase from 2000 to 2001. However, these data do not capturesignificant increases in ingredient costs during 2002.
Energy and Other Manufacturing Costs
For almost all producers of grain based foods, energy costs are an important factor. Most ofthese products are baked or dried in high temperature ovens. Therefore, rising energy costs,and in particular spikes in energy costs in the recent past, have adversely impacted theprofitability of grain-based food producers. An example of the impact of energy shortagesis the rolling blackouts in California in 2001, which shut down bakeries without notice.These energy outages resulted in bakeries losing entire production runs.79
Labor Costs
Recent increases in the costs associated with health care and retirement expenses have raisedconcern among bakery product producers.80 Bakery production tends to be relatively morelabor-intensive, because the short shelf life of the products requires frequent inventoryturnover and prevents companies from achieving large economies of scale. This requiresmultiple production locations to serve different geographic markets. According toprojections developed by the American Bakers Association (ABA), health care expenses areprojected to increase by approximately 76 percent between 2002 and 2007.81 Salary costs areprojected by the ABA to increase approximately 22 percent over the same period.
Wheat and Wheat Flour Costs
For bread and roll producers, flour is estimated to represent between 15 percent and20 percent of the cost of production. The supply and price of wheat flour are importantfactors in bakery operations. The type of wheat flour utilized depends on the type of bakeryproduct. Bread and roll producers generally use hard wheat, which has higher protein levels.Conversely, cookie, pastry, cake, and cereal producers generally use soft wheat.82 For allclasses of wheat, prices generally declined until 2002, although hard red spring and soft redwinter wheat prices increased somewhat in the 2000/01 crop year (table B-8). As a result ofpoor weather in 2002 in several wheat-producing regions, prices for hard and soft wheatincreased sharply. Hard wheat prices have averaged approximately $1.00 per bushel more

83 Bureau of Labor Statistics, U.S. Department of Labor, PPI series WPU02120301. 84 See USITC Honey from Argentina and China, Inv. Nos. 701-TA-402 and 731-TA-892-893(Final), USITC pub. no. 3470, Nov. 2001.
20
during the 2002/03 crop year than in the 2001/02 crop year. Prices for soft wheat haveaveraged approximately $0.80 per bushel more during the 2002/03 crop year.
U.S. flour production fluctuated considerably during the 1998-2002 period. Flour priceswere generally on a steady decline until 2002 (table B-9). Wheat flour prices are stronglytied to wheat prices; thus, as wheat prices spiked in 2002, flour prices increased sharply aswell. The Bureau of Labor Statistics Producer Price Index (PPI) for wheat flour shows agreat deal of volatility, with a particularly sharp rise during 2002 (table B-10). During 2002,the PPI for wheat flour rose from 109.6 in January to 123.0 in October. Preliminary statisticsfor the first two months of 2003 do not indicate any significant declines in wheat flourprices.83
Sugar Costs
For cookie, pastry, and other sweet good products, sugar is also an important factor ofproduction. Sugar as a share of the total cost of production varies considerably among theseproducts. U.S. sugar prices have also fluctuated considerably during this period (table B-11).U.S. sugar prices are significantly higher than world prices, averaging 12.5 cents per poundmore during the 1998-2002 period (tables B-11 and B-12). This differential in sugar pricesmay result in a competitive disadvantage for U.S. producers versus imports, particularlyimports from Canada where bakers have access to sugar at world prices.
Other Ingredient Costs
There were significant increases in other bakery product ingredient costs, such as shorteningand honey, in 2002. Honey prices rose sharply in 2001 and 2002, from approximately$0.59 per pound in 2001 to more than $1.26 per pound in 2002. The sharp increase in honeyprices is a result of declines in U.S. production and yields and the imposition of antidumpingand countervailing duties on imports of honey from China and Argentina.84 Cocoa pricesincreased during 2002 as a result of turmoil in the Côte D’Ivoire, a major cocoa producingcountry. Bakery shortening prices have also increased.
Production Process and Technology Changes
There have been important production technology advancements in the commercial bakeryindustry. These advancements center on the development of ESL technology. A standardcost for commercial bakeries is the cost associated with returns of unsold, stale bread andother fresh bakery products. ESL technology extends the shelf life of the bread or otherbakery products, allowing the product to remain on the store shelves longer and thusreducing returns. The ability to extend the shelf life of bread and other bakery products canhave a profound impact on the cost structure of the manufacturer and on related markets aswell. For example, according to trade press reports the development of ESL technology hasenabled Interstate Bakeries to eliminate more than 1,000 delivery routes. This has resulted

85 Milling & Baking News, Transforming baking for less than a penny a loaf, Aug. 6, 2002. 86 World-grain.com, Shelf life gains may require ADM milling capacity cuts, Aug.1, 2002. 87 Milling & Baking News, Full impact of ESL emerging, Dec. 10, 2002.
21
in cost savings in labor, trucks, fuel, insurance, and delivery vehicle accidents.85
Additionally, as a result of fewer returns, bakeries need to produce fewer loaves of bread andother bakery products to maintain store inventories. The impact of ESL technology hasprompted members of the flour milling industry to consider capacity reductions, as bakerieswill need less flour.86 Several other bakery companies have begun implementing ESLtechnology, including Flowers Foods and Sara Lee.87 ESL technology has the potential toradically alter the structure of the baking industry. By extending the shelf life of bakeryproducts, manufacturers are able to serve more customers in a wider geographic market. Thisopens regional markets to greater competition as more bakeries have the capability to serveadditional markets. Widespread implementation of ESL technology could result insignificant increases in competition between bakeries.
U.S. TRADE
Overview
The United States has a significant and growing trade deficit in bakery products (table B-13).The trade deficit increased from $394.6 million in 1998 to $777.5 million in 2002. Themajority of the trade deficit can be attributed to deficits with Canada and the EU. The U.S.trade deficit with Canada increased from $155.8 million in 1998 to $372.6 million in 2002,an increase of 139 percent. The U.S. trade deficit with the EU has also increased, althoughat a slower pace. The U.S. deficit with the EU increased from $240.5 million in 1998 to$310.7 million in 2002. The only major trading partner with which the U.S. has a tradesurplus in bakery products is Japan. The U.S. trade surplus with Japan has fluctuated duringthe 1998-2002 period, but was larger in 2002 than in 1998. The United States ran a slighttrade surplus with all other countries in 1998, however, that surplus has steadily become atrade deficit during the 1999-2002 period.
In spite of rising import levels, imports of bakery products are still small relative to the sizeof the total U.S. market. However, imports can have a significant impact on certain segmentsof the market or geographic regions along the U.S.-Canadian border. Improvedtransportation systems and ESL technology have enabled imports to penetrate heretoforedistant markets.

22
Figure 3U.S. imports for consumption of all bakery products, by major sources, 1998-2002
-
200
400
600
800
1,000
1,200
1,400
1998 1999 2000 2001 2002
($ m
illio
ns) All others
Mexico
EU
Canada
U.S. Imports
Figure 3 shows U.S. imports of all bakery products by major import source for the1998-2002 period. Imports of all bakery products increased by 50 percent between 1998 and2002. Imports from Canada experienced the largest increase in dollar terms, from$434.2 million in 1998 to $673.3 million in 2002 (table B-14). Imports from Brazil,Indonesia, China and Mexico showed the sharpest increase in percentage terms.
Figure 4 shows the share of total U.S. imports of bread, cake, and pastry products by importsource for the 1998-2002 period. Fresh bread products are generally classified under HTSsubheading 1905.90.10.70, which includes not only loaves of bread, but such products asbread crumbs, pitas, and tortillas. Fresh rolls and similar products are generally classifiedunder subheading 1905.90.10.90. Frozen bread and rolls, including parbaked products, areclassified under subheading 1905.90.10.41 and subheading 1905.90.10.49. However, thesesubheadings, particularly subheadings 1905.90.10.41 and subheading 1905.90.10.90, containa number of other pastry products that would not commonly be referred to as bread.Therefore, definitive import levels for bread versus rolls versus other bakery products cannotbe determined. The total import value of bread, rolls, pastry and related products hasincreased during the 1998-2002 period. The value of imports increased from approximately$378.6 million in 1998 to approximately $685.0 million in 2002 (table B-15).
Source: Compiled from official statistics of the U.S. Department of Commerce.

23
Figure 4U.S. imports for consumption of bread, cake, and pastry products, by major sources, 1998-2002
-
100
200
300
400
500
600
700
800
1998 1999 2000 2001 2002
($m
illio
ns) All Others
Mexico
EU
Canada
Imports of products classified under HTS subheadings 1905.31, sweet biscuits and 1905.32,waffles and wafers, can generally be considered cookie and cracker products. Figure 5 showsthe share of total U.S. imports of cookie products by import sources for the 1998-2002period. Imports of these products grew considerably during the 1998-2002 period. The valueof imports increased from approximately $345.8 million in 1998 to approximately$458.8 million in 2002, an increase of 33 percent (table B-16).
Principal Suppliers and Import Levels
Canada
Imports of all bakery products from Canada accounted for 52 percent, by value, of totalimports in 2002. Figure 6 presents trends in U.S. imports from Canada by product type.Imports from Canada are distributed nationwide, although they are generally believed to beconcentrated in the eastern and upper-midwest regions and the northeast in particular.Additionally, imports of all bakery products from Canada have increased significantly since
Source: Compiled from official statistics of the U.S. Department of Commerce.

24
Figure 6U.S. imports of bakery products from Canada, by selected product types, 1998-2002
-
50
100
150
200
250
300
350
400
1998 1999 2000 2001 2002
($ m
illio
ns)
Mix and dough products
Cookie and cracker products
Bread, pastry, and cake products
Figure 5U.S. imports for consumption of cookie and cracker products, by major sources, 1998-2002
-
50
100
150
200
250
300
350
400
450
500
1998 1999 2000 2001 2002
($ m
illio
ns) All Others
Mexico
EU
Canada
Source: Compiled from official statistics of the U.S. Department of Commerce.
Source: Compiled from official statistics of the U.S. Department of Commerce.
88 U.S. industry officials, interview by USITC staff, New York City, July 7-9, 2002. 89 U.S. industry officials and European industry officials, telephone interviews by USITC staff,United States, June 26 - July 16, 2002.
25
1998. Imports from Canada have increased from approximately $434.2 million in 1998 toapproximately $673.3 million in 2002, or by 55 percent.
At the beginning of the 1998-2002 period, imports of cookie and cracker products fromCanada accounted for a larger share of imports from Canada than bread, cake, and pastryproducts. However, in 2001 and 2002, imports of bread, cake, and pastry products accountedfor a larger share of total imports from Canada. In particular, imports classified under HTSsubheading 1905.90.10.70, bread, and 1905.90.10.90, which are typically rolls and similarproducts, increased from $48.7 million in 1998 to $77.6 million in 2002, an increase of59 percent. Imports of frozen bread and roll products increased even more significantly, from$29.8 million in 1998 to $88.6 million in 2002, an increase of nearly 2 fold. Bread productsproduced under store brands or for private label customers are an important segment of U.S.imports from Canada. There are indications that Canadian bakers are providing private labelor store brand bakery products to major grocery store chains in the northeastern UnitedStates.88
Imports of cookie and cracker products from Canada include branded products produced formajor U.S. multinational corporations, and private label products that are capturing largershares of the private label market, particularly along the U.S.-Canadian border. One factorthat may be encouraging imports of cookies from Canada is the differing market dynamicsfor imported sugar in each country. These characteristics are discussed in more detail in theprofile of the Canadian industry below.
Imports of mixes and dough products from Canada increased from $109.5 million in 1998to $119.5 million in 2000 before declining in both 2001and 2002 to $106.8 million and$103.2 million, respectively. Canada accounts for virtually all U.S. imports of mixes anddough products. Imports from Canada held an import share of between 95 and 98 percentduring the 1998-2002 period (table B-17).
European Union
The EU is the second largest source of U.S. bakery product imports. Imports from the EUconsist of a wide variety of products. Figure 7 presents trends in U.S. imports of bakeryproducts from the EU by selected product types for the period 1998-2002. Certain EUmember countries have successful niche products that dominate their exports to the UnitedStates. For example, imports from Denmark consist primarily of butter cookies, while asignificant share of imports from the United Kingdom consist of biscuits.89
The EU was the second largest source of imports of bread, cake, and pastry productsthroughout the 1998-2002 period. However, the EU's import share fell during this period,from 37.8 percent in 1998 to 27.7 percent in 2002. The total value of imports from the EUhas increased from $143.1 million in 1998 to $190.0 million in 2002, a rise of approximately33 percent. Imports of cookie and cracker products from the EU increased at a more modestpace, from $120.2 million in 1998 to $125.5 million, or by approximately 4 percent.

26
Figure 7 U.S. imports of bakery products from the EU, by selected product types, 1998-2002
-
50
100
150
200
250
300
350
1998 1999 2000 2001 2002
($ m
illio
ns)
Cookie and cracker products
Bread, pastry, and cake products
Imports of mixes and dough products from the EU account for a very small share of totalimports. Imports of mixes and dough products from the EU increased slightly during the1998-2002 period, from approximately $707,000 in 1998 to $1.7 million in 2002.
Mexico
Although Mexico accounts for only a small portion of U.S. imports of bakery products,imports from Mexico have increased substantially. Imports of all bakery products fromMexico increased from $49.6 million in 1998 to $104.3 million in 2002. Most of the increasein imports consisted of bread, cake, and pastry products. Imports of these products increasedfrom $30.7 million in 1998 to $65.1 million in 2002. Imports of cookie and cracker productsfrom Mexico increased from $18.0 million in 1998 to$36.8 million in 2002. Mexico is nota significant source of imports of mixes and dough products.
Source: Compiled from official statistics of the U.S. Department of Commerce.

27
U.S. Trade Measures
Tariff and nontariff measures
Many bakery products enter the United States free of duty. However, the U.S. maintainsseveral tariff-rate quotas on mixes and dough products with significant in-quota tariffs.Depending on the sugar and dairy content of the product, the quota levels and tariffs vary.Most mixes and dough products are subject to a tariff-rate quota of 5,398 metric tons withan in-quota tariff rate of 10 percent ad valorem and an over-quota tariff rate of 42.3 cents perkilogram plus 8.5 percent ad valorem. Quota fill is based on a first-come, first-serve basis.Some mixes and dough products containing higher concentrations of dairy products aresubject to a tariff-rate quota of 4,105 metric tons with an in-quota tariff rate of 10 percentand an over-quota tariff rate of 42.3 cents per kilogram plus 8.5 percent ad valorem.However, under NAFTA, Canada and Mexico receive duty free access for these products.
U.S. Exports
U.S. exports of all bakery products totaled approximately $515.3 million in 2002. Exportshave grown 9.9 percent since 1998 (table B-18). Canada is by far the largest market for U.S.exports, accounting for 58.4 percent of all exports in 2002. Canada is the largest exportmarket for U.S. bakery products for many of the same reasons that the United States isCanada's largest export market, including geographic proximity and preferential tarifftreatment. Japan is the second largest market for U.S. exports, slightly ahead of Mexico; thetwo countries accounted for 10.9 and 10.0 percent of exports, respectively, in 2002. Exportsto the EU accounted for 4.4 percent of total bakery product exports.
U.S. exports of bread, cakes, and pastry products accounted for 42.5 percent of total bakeryproduct exports in 2002. Exports of these products fluctuated during the 1998-2002 period.U.S. exports initially fell from $204.7 million in 1998 to $185.1 million and $185.7 millionin 1999 and 2000, before increasing in 2001 and 2002 to $206.5 and $219.0, respectively(table B-19). As with exports of all bakery products, Canada is the largest export market forthese products, accounting for 64.9 percent of exports in 2002.
U.S. exports of cookie and cracker products increased significantly during 1998-2000;however, exports declined in 2001 and 2002 (table B-20). The most significant decline hasbeen in exports to Canada, which declined from $89.8 million in 2001 to $78.7 million in2002. However, Canada remains the largest U.S. export market for these goods, with a66.8 percent share of total cookie and cracker exports.
U.S. exports of mixes and dough products increased from $137.4 million in 1998 to$157.6 million in 2002 (table B-21). Again, Canada is the largest U.S. export market forthese products, but unlike cookie and cracker and bread products, exports to Canada do notaccount for the majority of total exports, accounting for 42.2 percent of exports in 2002.Japan is a significant market for U.S. exports of mixes and dough products, accounting for22.2 percent of total exports in 2002. Exports to Japan are increasing at a slower rate thanexports to Canada, however.

90 For further information on tariff and non-tariff barriers see USITC publication ProcessedFoods and Beverages: A Description of Tariff and Non-Tariff Barriers for Major Products andTheir Impact on Trade, pub. No. 3455, Investigation No. 332-421, Oct. 2001. 91 Mercosur countries are Argentina, Brazil, Paraguay, and Uruguay.
28
Foreign Trade Measures90
Bakery Products
The EU utilizes complex tariffs for most bakery products. The range of duties that can beapplied is quite variable and depends on whether the duties are applied to an agriculturalcomponent, a sugar component, or a flour component. In 2000, the agricultural component(EA) ranged from zero to i275.82 per 100 kg. The sugar component (S/Z) ranged from zeroto i38.99 per 100 kg. The flour component ranged from zero to i19.99 per 100 kg.Additionally, sweet biscuits and other bakers’ wares are subject to a minimum ad valoremrate (9.0 percent in 2000) in addition to the agricultural component at a higher ad valoremrate (24.2 percent or 20.7 percent), plus additional duties for either the sugar or flourcomponent.
The Mercosur common external tariff is set at 35 percent ad valorem for cookies, crackers,and other bakery products.91 Other Latin American nations apply a range of tariffs.Venezuela applies tariffs of 40 percent ad valorem on breads and other bakery products.Colombia maintains an ad valorem tariff of 90 percent on breads and other bakery products.
In Asian markets, Japanese tariffs are relatively high, ranging from a low of 9 percent advalorem for breads to a high of 34 percent ad valorem for other bakery goods. In the case ofother bakery products, Japan places its highest tariffs on traditional rice-based products.Korean tariffs are 8 percent ad valorem, while Taiwan applies a range of duties of up to32.5 percent ad valorem.
Mixes and Dough Products
Tariffs on flour mixes and doughs vary. Japanese tariffs range from 12 percent to 24 percentad valorem, and EU tariffs are 7.6 percent ad valorem plus the agricultural component toaccount for the milk, starch, and sugar content of the product. Tariffs in other markets rangefrom 5 percent ad valorem in Australia to 17 percent ad valorem in Brazil. Some flour mixesand doughs, depending upon the amount of sugar or dairy ingredients they contain, aresubject to sugar and dairy TRQs. For example, certain flour mixes and doughs entering Japanfall under one of three TRQs covering wheat and wheat products, dairy products, andstarches. In Korea, some flour mixes and doughs fall under a TRQ covering rice and riceproducts. The differences between in-quota duties and over-quota duties are significant. InJapan the in-quota rate ranges between free and 25 percent ad valorem, depending on whichof three TRQs the products is classified under, with over-quota tariffs ranging between¥90/kg to ¥375/kg.
92 Milling & Baking News, Refrigerated Dough Showdown, Apr. 13, 2002. 93 Agriculture and Agri-Food Canada, Did you know...? Facts about the Canadian Agri-FoodIndustry, 2001. 94 Based on staff interviews with Canadian producers and U.S. importers.
29
Foreign Investment
There is some foreign investment in the bakery market both by foreign companies active inthe United States and by U.S. companies overseas. Additionally, Sara Lee, through itspurchase of the Earthgrains Company, produces private label refrigerated dough productsfor sale in Mexico and produces some branded refrigerated dough products in Europe, suchas CroustiPate branded pizza dough, bread and rolls, and pastry.92 The Canadian firm,George Weston Bakeries purchased Bestfoods Baking and became a significant producer inthe United States. Also, Bimbo Bakeries USA, an affiliate of Grupo Bimbo, Mexico’s largestwholesale baking company purchased Mrs. Baird’s Bakeries in 1998 and therefore becamea major producer in the South and Southwest United States.
Foreign Market and Industry Profiles
Canada
Canadian agri-food industries are heavily dependent on the U.S. market. In 2000, 61 percentof all Canadian agri-food exports were to the United States.93 Canadian exporters of grain-based foods are even more dependent on the U.S. market than Canadian food exporters asa whole. Canada is both the largest source of imports of bakery products and the largestexport market for U.S. producers.
Canadian exporters enjoy advantages not available to other exporting nations. Foremostamong these are NAFTA preferences and geographic proximity to major U.S. markets.While almost all bakery products became eligible for duty free entry into the United Statesfollowing the Uruguay Round, NAFTA has provided Canada with zero tariffs on the smallnumber of products not normally conferred duty free status. Canadian exporters have alsoindicated that the increased efficiency and speed with which imports are processed by theU.S. Customs Service are the real benefits of the NAFTA system.94 This is particularlyimportant with perishable products like bread and fresh bakery products.
Additionally, Canadian producers enjoy a geographic proximity to major U.S. East Coastmarkets that most other exporting countries do not have. This is a significant competitiveadvantage when dealing with perishable food products. The Canadian industry is positionedto take advantage of this proximity. With approximately 60 percent of its population in theProvinces of Quebec and Ontario, the Canadian bakery industry is also heavily concentratedin the eastern portion of the country. Prior Canadian census data report that approximately78 percent of bakery employment is concentrated in Quebec and Ontario and an additional

95 Human Resources Development Canada, Human Resource Profile, Bakery ProductsIndustry, 2001. 96 Canada Bread Company, company press releases, Oct. 10, 2002 and Dec. 11, 2002. 97 Canada Bread Company, 2002 Annual Report, 2003. 98 Canada Bread Company, company press release, July 18, 2002. 99 Ibid., Oct. 12, 2001. 100 The Food Bureau, Agriculture and Agri-Food Canada, The Canadian Bread and BakeryIndustry Sub-Sector Profile, July 2000.
30
6 percent in the Atlantic region.95 This facilitates the export process as the major U.S. EastCoast markets are easily served from eastern Canada. This geographic concentration of theCanadian industry can be seen in the pattern of imports from Canada. In 2002, 86.5 percentof imports of bakery products from Canada entered the United States through bordercrossing in Detroit, MI; Buffalo, NY; Ogdensburg, NY; and Portland, ME (table B-22).
There has been some significant consolidation in the Canadian bakery industry in 2001 and2002, particularly among producers of bread and roll products. Maple Leaf Foods, a largeCanadian agri-food business is the majority owner of Canada Bread Company. At the endof 2002, Maple Leaf Foods and Canada Bread Company instituted a corporate restructuringwhereby all of Maple Leaf Foods bakery operations were consolidated into the CanadaBread Company.96 This consolidation resulted in an expansion of the Canada BreadCompany, which now has operations in Canada, the United Kingdom, and the United States.Canada Bread Company’s U.S. operations include the Grace Baking Company, whichproduces fresh and frozen artisan bread products in San Francisco, CA and Maple LeafBakery U.S., a producer of frozen par-baked bread, rolls, and bagels.97 Prior to theconsolidation of Maple Leaf Foods bakery operations into the Canada Bread Company, theCanada Bread Company engaged in other merger and acquisition activity. In July 2002, theCanada Bread Company purchased Olafson’s Baking Company in British Columbia.Olafson’s Baking Company produces a range of bread and sweet good products.98 In October2001, the Canada Bread Company obtained 100-percent ownership in Multi-Marques, aCanadian bakery producer with operations in Quebec and Ontario.99 As part of thisacquisition, Canada Bread Company also became the majority owner of Ben’s Bakery, aproducer of fresh bread and roll products, with operations in Nova Scotia and NewBrunswick.
The Canadian commercial bread and bakery industry has developed more centralized, largescale production operations. These operations have pursued cost reductions through theimplementation of higher levels of plant mechanization. Improvements in productionprocesses have resulted in a decline in the number of establishments from 555 in 1982 to 471in 1997.100 However, the remaining, larger firms have undertaken capacity increases. Duringthe same period, real sales per establishment increased from C$4.1 million to C$4.4 million.
The development of larger production facilities is apparent from the distribution ofestablishments by number of employees over the same period. Small establishments, withless than 20 employees, accounted for less than 10 percent of total shipments. Mediumestablishments, 20-200 employees, accounted for approximately 50 percent of totalshipments, while large establishments, 200 or more employees, accounted for the remaining40 percent of shipments. Further, there is a high degree of concentration of ownership withinthe industry. In 2000, the four leading enterprises accounted for about 50 percent of total

101 Ibid. 102 Ibid. 103 World Baking Guide, 2002. 104 The Food Bureau, Agriculture and Agri-Food Canada, The Canadian Bread and BakeryIndustry Sub-Sector Profile, July 2000. 105 Agriculture and Agri-Food Canada,Canada’s Grain-Based Products Industry, 2001. 106 World Baking Guide, 2002. 107 U.S. and Canadian industry officials, telephone interviews by USITC staff, June 26-July 17,2002. 108 Ibid. 109 U.S. industry officials, interviews by USITC staff, Sep. 4, 2002 and Apr. 11, 2003.
31
industry shipments. This measure likely understates the level of concentration, as several ofthe largest firms own minority shares in other wholesale bakery firms.101
The Canadian bread and bakery industry had shipments valued at C$2.8 billion in 1997, up28 percent from 1988 levels.102 More recent data on retail sales of bakery products indicatescontinued growth in the Canadian market. Retail sales of bread, pastry, and cake productsincreased from US$1.7 billion in 1996 to US$2.1 billion in 2000.103 Coincident with theincrease in shipments and sales has been the increasing importance of export sales toCanadian bakers. Exports rose from 5 percent of shipments in 1988 to more than 14 percentof shipments in 1997.104 The United States is by far Canada’s most important export market.In 1999, more than 96 percent of all bakery exports were to the United States.
The Canadian cookie and cracker industry consisted of 32 manufacturing establishments in1997, more than 85 percent of which were located in Ontario and Quebec.105 Theseestablishments had shipments valued at C$804.5 million, C$206.1 million of which wereexported. Of those exports, C$199 million were to the United States. The retail market forcookie and cracker products in Canada is estimated at US$665.2 million in 2000, up fromUS$583.7 million in 1996.106 The Canadian market for cookie and cracker products has notgrown as rapidly as the bread, pastry, and cake market. Canada’s trade surplus in cookie andcracker products with the United States is relatively new. As recently as 1996, Canada hada trade deficit with the United States in these products.
Imports from Canada can serve a complimentary role in the U.S. market. In several casesimports of bread products from Canada consist of products that will be used in furtherprocessing, such as bread crumbs, or to round out U.S. producers' product offerings.107
However, in other cases increases in imports may have come at the expense of U.S.production. For example, there are some indications that imports of bread products fromCanada have had an impact in northeastern U.S markets.108 Individual Canadian producersare marketing fresh bread and roll products produced using ESL technology resulting in upto a 21-day shelf life. Canadian producers are marketing these products in major U.S. EastCoast markets such as New York City. These Canadian producers are also reportedly sellingat very low prices.109 Given the significant merger and acquisition activity within theCanadian industry, there is potential for dissemination of this ESL technology throughoutlarge segments of the Canadian industry. The dissemination of this technology couldincrease competition in U.S. markets from imports from Canada.
The presence of state trading entities (STE) in the Canadian wheat market may haveimportant ramifications for the Canadian baking industry. The Canadian Wheat Board, aFederal Government agency, maintains monopolistic control over the market for hard wheat
110 USITC, Wheat Trading Practices: Competitive Conditions Between U.S. and CanadianWheat, Pub. 3465, Dec. 2001. 111 Ontario Wheat Producers’ Marketing Board, The Farm Products Marketing Act, RegulationNo. 1-02. 112 U.S. industry officials, telephone interviews by USITC staff, United States, Aug. 13, 2002. 113 Euromonitor, Packaged Food Country Reports, for EU member countries, Nov. 2001. 114 Ibid. 115 World Baking Guide, 2002. 116 Ibid.
32
in Canada, an important ingredient in bread flour.110 There are concerns within the U.S.industry that the Canadian Wheat Board’s domestic pricing policies ensure lower-cost wheatto Canadian millers, which in turn, could result in lower-cost bakery flour for Canadianbakers. Additionally, the Ontario Wheat Producers’ Marketing Board, a Provincial STE,maintains a similar form of control over the production and distribution of soft wheat inOntario, the major soft wheat producing region in Canada.111 The Ontario milling and bakingindustry has had a government-imposed, preferential purchasing relationship with theOntario Wheat Producers’ Marketing Board. The Ontario milling and baking industrycontracts with the Ontario Wheat Producers’ Marketing Board for milling wheat every 24months. As a result, the contracted price is set for 24 months. This ensures stable, anddepending on market fluctuations over the next 24 months, possibly favorable bakery flourprices.
Canadian producers of bakery products, especially sweet goods producers, may benefit fromvariations in the sugar markets in the United States and Canada. As a result of significantU.S. trade barriers on imports of sugar, sugar prices in the United States are considerablyhigher than world prices. These higher prices result in increased production costs for U.S.bakers. Canadian bakers have access to sugar at world prices through a variety of programs,including preferential tariff programs for Caribbean and developing countries. Theseprograms provide Canadian bakers with sugar at prices below those available to U.S. bakers.Most bakery products imported into the United States are not subject to the tariff-rate quotason sugar and sugar-containing products. There are indications that U.S. producers have andare continuing to move production to Canada to take advantage of cheaper sugar prices.112
Europe Union
The bakery market in the EU is mature with thousands of bakery operations. The retailmarket for bakery products was estimated to be approximately i65.5 billion in 2000.113
Market growth has varied among EU countries. For example, the retail market for bakeryproducts in Italy and Sweden grew by 12 percent and 17 percent from 1998 to 2000,respectively. However, in larger markets such as France and Germany, the markets grew byapproximately 4 percent and 3 percent, respectively.114 Per capita consumption of bakeryproducts in the EU varies across countries but is generally high, with per capita consumptionof bread at 85 kg in Germany, 53.5 kg in France, 80 kg in Italy, and 77 kg in the Netherlandsin 2000.115
Retail bakeries continue to play a very important role in the bakery market in the EU. Of theestimated 25 million metric tons of bread production in Europe, approximately 17 millionmetric tons is produced by retail, “craft” bakers.116 Germany and France are generally thelargest bakery producers in the EU, accounting for 6.5 million metric tons and 3.6 million

117 Ibid. 118 U.S. industry officials, interviews with USITC staff, New York City, July 7-9, 2002. 119 Euromonitor, Packaged Food in Mexico, Nov. 2001. 120 Ibid. 121 Ibid. 122 Ibid. 123 U.S. industry official, telephone interview by USITC staff, United States, Aug. 13, 2002.
33
metric tons, respectively, of production in 2000.117 The EU market has seen much slowergrowth in large supermarkets or hypermarkets than in the United States. This has maintainedthe importance of retail bakeries in the EU market. However, large supermarket chains aremaking important and significant inroads in the EU market and are exerting significantdownward price pressure on the bakery products market.
Extra-EU imports face significant difficulties in penetrating the EU bakery products market.Tariffs on imports into the EU provide competitive advantages to intra-EU trade, which doesnot face any tariffs. As noted earlier, EU tariffs on bakery products can be quite significant.Additionally, geographic proximity is an important advantage. Numerous U.S. producershave indicated that, due to the lengthy shipment times to Europe, it is extremely difficult tomeet shelf life requirements.118
Mexico
In 2000 Mexico’s retail bakery market was estimated at pesos 84.6 billion, or approximately,U.S. $8.9 billion.119 Mexico’s bakery market is growing rapidly; retail sales grew38.8 percent from 1998 to 2000.120 In 2000, bread, pastry, and cake products accounted forapproximately 81 percent of the retail market, while cookie and cracker products accountedfor approximately 10 percent.121 Per capita bread consumption in Mexico is relatively lowat 15 kg; however, bread consumption is increasing, generally at the expense of tortillaconsumption. The Mexican market is similar to the EU market in that small, craft bakeriesdominate the market. These small retail bakeries accounted for approximately 73 percent ofretail sales in 2000.122 The largest commercial baker in Mexico is Grupo Bimbo. U.S.industry officials are projecting that the Mexican industry will become more significantlyinvolved in the U.S. bakery products market. U.S. industry officials believe that U.S.companies may shift some production to Mexico to take advantage of low sugar prices inMexico.123


APPENDIX AEXPLANATION OF TARIFF AND TRADEAGREEMENT TERMS


A-3
TARIFF AND TRADE AGREEMENTTERMS
In the Harmonized Tariff Schedule of the United States (HTS), chapters 1 through 97 coverall goods in trade and incorporate the internationally adopted Harmonized CommodityDescription and Coding System through the 6-digit level of product description. SubordinateU.S. 8-digit rate lines, either enacted by Congress or proclaimed by the President, allowmore narrowly applicable duty rates; nonlegal 10-digit statistical reporting numbers providedata of national interest. Chapters 98 and 99 contain special U.S. classifications andtemporary rate provisions, respectively. The HTS replaced the Tariff Schedules of the UnitedStates (TSUS) effective Jan. 1, 1989. The HTS is updated by published supplements and byelectronic revisions at http://www.usitc.gov/taffairs.htm#HTS ; see preface pages and changerecords in each document.
Duty rates in the general subcolumn of HTS column 1 are normal trade relations rates; manygeneral rates have been eliminated or are being reduced due to concessions resulting fromthe Uruguay Round of Multilateral Trade Negotiations. General duty rates apply to allcountries except those listed in HTS general note 3(b) (Cuba, Laos, and North Korea) plusSerbia and Montenegro, which are subject to the statutory rates set forth in column 2.Specified goods from designated general-rate countries may be eligible for reduced rates ofduty or duty-free entry under preferential tariff programs, as set forth in the specialsubcolumn of HTS rate of duty column 1 or in the general notes. If eligibility for specialtariff rates is not claimed or established, goods are dutiable at general rates. The HTS doesnot list countries covered by a total or partial embargo; it likewise does not containantidumping or countervailing duties (consult the International Trade Administration of theDepartment of Commerce).
The Generalized System of Preferences (GSP) affords nonreciprocal duty-free entry tocertain goods of designated beneficiary developing countries. The U.S. GSP, under title Vof the Trade Act of 1974, as amended, now applies to merchandise imported on or after Jan.1, 1976, and before the close of Dec. 31, 2006. Indicated by the symbol "A", "A*", or "A+"in the special subcolumn, The legal framework of the GSP is set forth in HTS general note4; eligible articles must be the product of and imported directly from designated beneficiarydeveloping countries. Eligible products of listed sub-Saharan African countries may qualifyfor duty-free entry under the African Growth and Opportunity Act (AGOA) (see HTS gen.note 16) through Sept. 30, 2008, as indicated by the symbol “D” in the special subcolumn;see subchapter XIX of chapter 98.
The Caribbean Basin Economic Recovery Act (CBERA) affords nonreciprocal tariffpreferences to designated Caribbean Basin developing countries. The CBERA--enacted intitle II of Pub. Law 98-67, implemented by Presidential Proclamation 5133 of Nov. 30, 1983,and amended by the Customs and Trade Act of 1990, applies to goods entered, or withdrawnfrom warehouse for consumption, on or after Jan. 1, 1984. Indicated by the symbol "E" or"E*" in the special subcolumn, CBERA provides duty-free entry to eligible articles, andreduced-duty treatment to certain other articles, which are the product of and importeddirectly from designated countries (see HTS gen. note 7). Other eligible products of listedbeneficiary countries may qualify for duty-free or reduced-duty entry under the Caribbean

A-4
Basin Trade Partnership Act (CBTPA) (see HTS gen. note 17), through Sept. 30, 2008, asindicated by the symbol “R” in the special subcolumn; see also subchapter XX of chapter 98.
Free rates of duty in the special subcolumn followed by the symbol "IL" are applicable toproducts of Israel under the United States-Israel Free Trade Area Implementation Act of1985 (IFTA), as provided in general note 8 to the HTS; see also subchapter VIII ofchapter 99.
Nonreciprocal duty-free treatment in the special subcolumn followed by the symbol "J" or"J*" in parentheses is afforded to eligible articles from designated beneficiary countriesunder the Andean Trade Preference Act (ATPA), enacted as title II of Pub. Law 102-182(effective July 22, 1992; see HTS gen. note 11) and renewed through December 31, 2006,by the Andean Trade Promotion and Drug Eradication Act of 2002. Goods eligible for newbenefits under the latter act are designated by a “J+” in the special subcolumn; see alsosubchapter XXI of chapter 98.
Preferential free rates of duty in the special subcolumn followed by the symbol "CA" areapplicable to eligible goods of Canada, and rates followed by the symbol "MX" areapplicable to eligible goods of Mexico, under the North American Free Trade Agreement(NAFTA), as provided in general note 12 to the HTS and implemented effective Jan. 1,1994, by Presidential Proclamation 6641 of Dec. 15, 1993. Goods must originate in theNAFTA region under rules set forth in general note 12(t) and meet other requirements of thenote and applicable regulations.
Preferential rates of duty in the special subcolumn followed by the symbol “JO” areapplicable to eligible goods of Jordan under the United States-Jordan Free Trade AreaImplementation Act, (JFTA) effective as of Dec. 17, 2001; see HTS gen. note 18 andsubchapter IX of chapter 99.
Other special tariff treatment applies to particular products of insular possessions (gen. note3(a)(iv)), products of the West Bank and Gaza Strip (gen. note 3(a)(v)), goods covered bythe Automotive Products Trade Act (APTA) (gen. note 5) and the Agreement on Trade inCivil Aircraft (ATCA) (gen. note 6), articles imported from freely associated states (gen.note 10), pharmaceutical products (gen. note 13), and intermediate chemicals for dyes(gen. note 14).
The General Agreement on Tariffs and Trade 1994 (GATT 1994), pursuant to theAgreement Establishing the World Trade Organization and based upon the earlier GATT1947 (61 Stat. (pt. 5) A58; 8 UST (pt. 2) 1786), is the primary multilateral system ofdiscipline and principles governing international trade. The agreements mandatemost-favored-nation treatment, maintenance of scheduled concession rates of duty, andnational treatment for imported goods; GATT provides the legal framework for customsvaluation standards, "escape clause" (emergency) actions, antidumping and countervailingduties, dispute settlement, and other measures. Results of the Uruguay Round of multilateraltariff negotiations are set forth in separate schedules of concessions for each participatingcontracting party, with the U.S. schedule designated as Schedule XX. Pursuant to theAgreement on Textiles and Clothing (ATC) of the GATT 1994, member countries arephasing out restrictions on imports under the prior "Arrangement Regarding InternationalTrade in Textiles" (known as the Multifiber Arrangement (MFA)). Under the MFA, adeparture from GATT 1947 provisions, importing and exporting countries negotiatedbilateral agreements limiting textile and apparel shipments, and importing countries could

A-5
take unilateral action to control shipments. Quantitative limits were established on textilesand apparel of cotton, other vegetable fibers, wool, man-made fibers or silk blends in aneffort to prevent or limit market disruption in the importing countries. The ATC establishesnotification and safeguard procedures, along with other rules concerning the customstreatment of textile and apparel shipments, and calls for the eventual complete integrationof this sector into the GATT 1994 and the phase-out of quotas over a ten-year period, or byJan. 1, 2005.


APPENDIX BSTATISTICAL TABLES


B-3
Table B-1Bakery products industry: Number of establishments, employments, and value of shipments, 1998-2001
Employment Value ofshipments
($1,000)Industry segmentNumber of
establishments AllProduction
related
Bakery products manufacturing:1998 . . . . . . . . . . . . . . . . . . . . . . . . . . . . . . . . . . . . . . . . . . . 11,590 323,557 201,211 44,259,2841999 . . . . . . . . . . . . . . . . . . . . . . . . . . . . . . . . . . . . . . . . . . . 10,637 310,475 188,328 45,428,0282000 . . . . . . . . . . . . . . . . . . . . . . . . . . . . . . . . . . . . . . . . . . . (1) 314,798 194,052 46,803,4182001 . . . . . . . . . . . . . . . . . . . . . . . . . . . . . . . . . . . . . . . . . . . (1) 318,680 193,616 47,895,965
Retail bakeries:2
1998 . . . . . . . . . . . . . . . . . . . . . . . . . . . . . . . . . . . . . . . . . . . 7,673 74,653 47,134 3,304,8891999 . . . . . . . . . . . . . . . . . . . . . . . . . . . . . . . . . . . . . . . . . . . 6,780 52,919 28,447 2,166,0192000 . . . . . . . . . . . . . . . . . . . . . . . . . . . . . . . . . . . . . . . . . . . (1) 52,367 27,937 2,625,1612001 . . . . . . . . . . . . . . . . . . . . . . . . . . . . . . . . . . . . . . . . . . . (1) 52,380 27,502 2,501,063
Commercial bakeries :1998 . . . . . . . . . . . . . . . . . . . . . . . . . . . . . . . . . . . . . . . . . . . 2,765 164,686 88,188 21,862,5611999 . . . . . . . . . . . . . . . . . . . . . . . . . . . . . . . . . . . . . . . . . . . 2,729 172,514 93,459 23,897,3592000 . . . . . . . . . . . . . . . . . . . . . . . . . . . . . . . . . . . . . . . . . . . (1) 175,635 97,395 24,963,7952001 . . . . . . . . . . . . . . . . . . . . . . . . . . . . . . . . . . . . . . . . . . . (1) 178,000 95,255 25,710,038
Frozen cakes, pies, & other pastries manufacturing:1998 . . . . . . . . . . . . . . . . . . . . . . . . . . . . . . . . . . . . . . . . . . . 242 15,402 12,554 2,594,8961999 . . . . . . . . . . . . . . . . . . . . . . . . . . . . . . . . . . . . . . . . . . . 233 15,047 12,173 2,637,7712000 . . . . . . . . . . . . . . . . . . . . . . . . . . . . . . . . . . . . . . . . . . . (1) 16,473 13,546 2,937,0902001 . . . . . . . . . . . . . . . . . . . . . . . . . . . . . . . . . . . . . . . . . . . (1) 16,742 13,744 3,008,063
Cookie and cracker manufacturing:1998 . . . . . . . . . . . . . . . . . . . . . . . . . . . . . . . . . . . . . . . . . . . 411 42,189 32,726 10,288,8051999 . . . . . . . . . . . . . . . . . . . . . . . . . . . . . . . . . . . . . . . . . . . 401 40,107 30,943 10,281,8322000 . . . . . . . . . . . . . . . . . . . . . . . . . . . . . . . . . . . . . . . . . . . (1) 39,655 30,629 10,383,5442001 . . . . . . . . . . . . . . . . . . . . . . . . . . . . . . . . . . . . . . . . . . . (1) 39,556 31,129 10,519,185
Flour mixes and dough:1998 . . . . . . . . . . . . . . . . . . . . . . . . . . . . . . . . . . . . . . . . . . . 250 15,232 11,843 5,028,9161999 . . . . . . . . . . . . . . . . . . . . . . . . . . . . . . . . . . . . . . . . . . . 247 17,196 13,249 5,288,6692000 . . . . . . . . . . . . . . . . . . . . . . . . . . . . . . . . . . . . . . . . . . . (1) 17,874 14,010 4,639,1402001 . . . . . . . . . . . . . . . . . . . . . . . . . . . . . . . . . . . . . . . . . . . (1) 19,962 15,914 4,769,750
Tortilla manufacturing:1998 . . . . . . . . . . . . . . . . . . . . . . . . . . . . . . . . . . . . . . . . . . . 249 11,395 8,766 1,179,2171999 . . . . . . . . . . . . . . . . . . . . . . . . . . . . . . . . . . . . . . . . . . . 247 12,692 10,057 1,156,3782000 . . . . . . . . . . . . . . . . . . . . . . . . . . . . . . . . . . . . . . . . . . . (1) 12,794 10,535 1,254,6882001 . . . . . . . . . . . . . . . . . . . . . . . . . . . . . . . . . . . . . . . . . . . (1) 12,040 10,072 1,387,866
1 Not available.2 Data for retail bakery operations in 1998 is not directly comparable to prior and subsequent years. The 1998 data suffer from a
misclassification error that resulted in additional firms being improperly classified in this category.
Source: U.S. Census Bureau, Annual Survey of Manufacturers, Feb. 11, 2002, and Dec. 20, 2002, 1997 Economic Census, andStatistics of U.S. Businesses, 1997-1999.

B-4
Table B-2Bakery products: Selected consumer price index data, January 1998-December 2002
January February March April May June July August September October November December
Bread1
1998 99.4 100.2 99.8 100.0 100.7 101.2 101.8 102.0 102.2 101.5 102.0 102.51999 103.4 103.7 103.1 104.1 103.1 104.1 104.1 103.1 103.7 103.9 105.0 104.52000 104.5 105.8 105.4 106.4 107.1 107.7 109.4 108.9 107.2 108.3 108.3 109.32001 109.6 110.6 111.4 111.2 112.6 112.5 113.6 113.2 113.5 113.3 113.9 115.02002 114.3 114.8 113.8 114.8 114.9 115.5 115.2 115.3 115.6 117.3 116.6 116.2
Cookies2
1998 182.7 183.5 181.7 182.1 181.2 183.8 183.2 185.5 180.9 182.7 183.9 186.11999 187.9 186.9 185.3 185.3 186.6 184.9 187.4 186.5 184.8 189.2 189.7 193.62000 188.4 186.4 190.7 187.3 186.5 181.8 187.7 188.5 186.7 189.0 187.6 191.02001 188.3 188.7 189.6 189.5 189.2 188.3 188.2 190.5 192.2 193.5 194.4 196.220 02 196.6 197.8 197.9 195.0 196.0 193.6 193.6 191.3 194.4 195.0 201.1 201.6
Crackers3
1998 211.4 207.1 211.4 215.7 216.8 214.2 213.5 212.0 215.8 218.4 220.8 219.51999 217.6 215.7 217.4 217.9 220.0 220.2 223.4 212.5 218.7 218.1 217.4 223.82000 222.6 224.3 214.9 220.2 223.7 222.1 226.4 228.1 227.2 230.5 229.2 231.22001 229.5 231.0 230.2 233.3 229.7 231.0 231.6 234.3 232.6 231.7 234.0 230.52002 233.1 234.3 238.3 237.1 236.1 238.5 236.0 235.7 239.1 235.8 235.8 232.8
Frozen and refrigerated bakery products4
1998 183.7 183.0 186.3 186.6 183.2 188.1 186.1 188.9 188.3 190.5 191.3 190.01999 188.4 188.7 187.5 190.0 188.8 186.9 188.4 188.5 191.5 190.6 190.9 190.12000 188.8 188.8 189.6 189.8 191.1 190.4 192.9 193.5 191.6 192.6 194.1 196.92001 199.4 199.1 202.0 198.4 200.8 203.2 201.9 203.0 203.5 204.8 201.3 203.72002 208.0 206.6 205.7 207.2 209.1 206.9 207.2 209.8 209.6 208.1 209.5 205.6
1 Bureau of Labor Statistics, consumer price index, current series CUUR0000SEFB01, U.S. city average.2 Bureau of Labor Statistics, consumer price index, current series CUSR0000SS02042, U.S. city average.3 Bureau of Labor Statistics, consumer price index, current series CUSR0000SS0206A, U.S. city average.4 Bureau of Labor Statistics, consumer price index, current series CUSR0000SS0206B, U.S. city average.
Source: U.S. Bureau of Labor Statistics, U.S. Department of Labor.

B-5
Table B-3White pan bread prices, selected major U.S. cities, 1998-2001
1998 1999 2000 2001––––––––––––––––– Dollars (per kilogram) –––––––––––––––––
Average price . . . . . . . . . . . . . . . . . . . . . . . . . 2.94 2.88 2.92 3.04Highest reported price . . . . . . . . . . . . . . . . . . 3.59 3.59 3.87 3.76Lowest reported price . . . . . . . . . . . . . . . . . . . 1.57 1.96 1.87 1.87Second highest reported price . . . . . . . . . . . . 3.29 3.27 3.37 3.52Second lowest reported price . . . . . . . . . . . . . 2.84 2.86 2.25 2.25Source: Economist Intelligence Unit.
Table B-4Bakery products: U.S. shipments, U.S. exports of domestic merchandise, U.S. imports forconsumption, and merchandise trade balance, 1998-2002
YearU.S.
shipments Exports ImportsApparent
consumptionTrade
balanceRatio of importsto consumption
–––––––––––––––––––––Value (1,000 dollars)–––––––––––––––––––––– Percentage
1998 . . . . . . . . 44,259,284 468,877 863,492 44,653,900 -394,616 1.91999 . . . . . . . . 45,428,028 475,014 980,431 45,933,445 -505,417 2.12000 . . . . . . . . 46,803,418 489,050 1,074,756 47,389,124 -585,706 2.32001 . . . . . . . . 47,895,965 505,575 1,153,341 48,543,730 -647,765 2.42002 . . . . . . . . (1) 515,348 1,292,868 (1) -777,520 (1)
1 Not available.
Source: U.S. Census Bureau, Annual Survey of Manufacturers, Dec. 11, 2002, and data compiled from official statisticsof the U.S. Department of Commerce.
Table B-5Cookie and cracker products: U.S. shipments, U.S. exports of domestic merchandise, U.S. importsfor consumption, and merchandise trade balance, 1998-2002
YearU.S.
shipments Exports ImportsApparent
consumptionTrade
balanceRatio of importsto consumption
–––––––––––––––––––––Value (1,000 dollars)–––––––––––––––––––––– Percentage
1998 . . . . . . . . 10,288,805 99,179 345,797 10,535,423 -246,618 3.31999 . . . . . . . . 10,281,832 130,040 395,800 10,547,592 -265,760 3.82000 . . . . . . . . 10,383,544 133,095 435,843 10,686,292 -302,748 4.12001 . . . . . . . . 10,519,185 130,035 427,180 10,816,330 -297,145 4.92002 . . . . . . . . (1) 117,832 458,845 (1) -341,012 (1)
1 Not available.
Source: U.S. Census Bureau, Annual Survey of Manufacturers, Dec. 11, 2002, and data compiled from official statisticsof the U.S. Department of Commerce.
Table B-6Mixes and dough products: U.S. shipments, U.S. exports of domestic merchandise, U.S. importsfor consumption, and merchandise trade balance, 1998-2002
YearU.S.
shipments Exports ImportsApparent
consumptionTrade
balanceRatio of importsto consumption
–––––––––––––––––––––Value (1,000 dollars)–––––––––––––––––––––– Percentage
1998 . . . . . . . . 5,028,916 137,440 112,079 5,003,555 25,361 2.21999 . . . . . . . . 5,288,669 141,850 120,936 5,267,755 20,914 2.32000 . . . . . . . . 4,639,140 153,352 122,645 4,608,432 30,708 2.72001 . . . . . . . . 4,769,750 152,153 110,352 4,727,950 41,800 2.32002 . . . . . . . . (1) 157,572 107,584 (1) 49,988 (1)
1 Not available.
Source: U.S. Census Bureau, Annual Survey of Manufacturers, Dec. 11, 2002, and data compiled from official statisticsof the U.S. Department of Commerce.

B-6
Table B-7Bakery products industry: Cost of materials, value of shipments, and ratio of cost of materials to shipments, 1998-2001
Industry segment and yearCost of
materialsValue of
shipments
Ratio of cost ofmaterials to
shipments––––––––––$1,000–––––––––– Percent
Bakery products manufacturing:1998 . . . . . . . . . . . . . . . . . . . . . . . . . . . . . . . . . . . . . . . . . . . . . . . . . 16,529,145 44,259,284 37.31999 . . . . . . . . . . . . . . . . . . . . . . . . . . . . . . . . . . . . . . . . . . . . . . . . . 16,032,531 45,428,028 35.32000 . . . . . . . . . . . . . . . . . . . . . . . . . . . . . . . . . . . . . . . . . . . . . . . . . 16,316,496 46,803,418 34.92001 . . . . . . . . . . . . . . . . . . . . . . . . . . . . . . . . . . . . . . . . . . . . . . . . . 16,566,543 47,895,965 34.6
Retail bakeries:1
1998 . . . . . . . . . . . . . . . . . . . . . . . . . . . . . . . . . . . . . . . . . . . . . . . . . 1,236,368 3,304,889 37.41999 . . . . . . . . . . . . . . . . . . . . . . . . . . . . . . . . . . . . . . . . . . . . . . . . . 795,825 2,166,019 36.72000 . . . . . . . . . . . . . . . . . . . . . . . . . . . . . . . . . . . . . . . . . . . . . . . . . 898,642 2,625,161 34.22001 . . . . . . . . . . . . . . . . . . . . . . . . . . . . . . . . . . . . . . . . . . . . . . . . . 866,521 2,501,063 34.6
Commercial bakeries :1998 . . . . . . . . . . . . . . . . . . . . . . . . . . . . . . . . . . . . . . . . . . . . . . . . . 7,420,512 21,862,561 33.91999 . . . . . . . . . . . . . . . . . . . . . . . . . . . . . . . . . . . . . . . . . . . . . . . . . 7,597,294 23,897,359 31.82000 . . . . . . . . . . . . . . . . . . . . . . . . . . . . . . . . . . . . . . . . . . . . . . . . . 7,869,365 24,963,795 31.52001 . . . . . . . . . . . . . . . . . . . . . . . . . . . . . . . . . . . . . . . . . . . . . . . . . 8,001,912 25,710,038 31.1
Frozen cakes, pies, & other pastries manufacturing:1998 . . . . . . . . . . . . . . . . . . . . . . . . . . . . . . . . . . . . . . . . . . . . . . . . . 1,185,236 2,594,896 45.71999 . . . . . . . . . . . . . . . . . . . . . . . . . . . . . . . . . . . . . . . . . . . . . . . . . 1,216,350 2,637,771 46.12000 . . . . . . . . . . . . . . . . . . . . . . . . . . . . . . . . . . . . . . . . . . . . . . . . . 1,346,964 2,937,090 45.92001 . . . . . . . . . . . . . . . . . . . . . . . . . . . . . . . . . . . . . . . . . . . . . . . . . 1,438,122 3,008,063 47.8
Cookie and cracker manufacturing:1998 . . . . . . . . . . . . . . . . . . . . . . . . . . . . . . . . . . . . . . . . . . . . . . . . . 3,566,480 10,288,805 34.71999 . . . . . . . . . . . . . . . . . . . . . . . . . . . . . . . . . . . . . . . . . . . . . . . . . 3,286,050 10,281,832 32.02000 . . . . . . . . . . . . . . . . . . . . . . . . . . . . . . . . . . . . . . . . . . . . . . . . . 3,165,933 10,383,544 30.52001 . . . . . . . . . . . . . . . . . . . . . . . . . . . . . . . . . . . . . . . . . . . . . . . . . 3,243,344 10,519,185 30.8
Flour mixes and dough:1998 . . . . . . . . . . . . . . . . . . . . . . . . . . . . . . . . . . . . . . . . . . . . . . . . . 2,626,006 5,028,916 52.21999 . . . . . . . . . . . . . . . . . . . . . . . . . . . . . . . . . . . . . . . . . . . . . . . . . 2,657,342 5,288,669 50.22000 . . . . . . . . . . . . . . . . . . . . . . . . . . . . . . . . . . . . . . . . . . . . . . . . . 2,527,541 4,639,140 54.52001 . . . . . . . . . . . . . . . . . . . . . . . . . . . . . . . . . . . . . . . . . . . . . . . . . 2,478,279 4,769,750 52.0
Tortilla manufacturing:1998 . . . . . . . . . . . . . . . . . . . . . . . . . . . . . . . . . . . . . . . . . . . . . . . . . 494,543 1,179,217 41.91999 . . . . . . . . . . . . . . . . . . . . . . . . . . . . . . . . . . . . . . . . . . . . . . . . . 479,670 1,156,378 41.52000 . . . . . . . . . . . . . . . . . . . . . . . . . . . . . . . . . . . . . . . . . . . . . . . . . 508,051 1,254,688 40.52001 . . . . . . . . . . . . . . . . . . . . . . . . . . . . . . . . . . . . . . . . . . . . . . . . . 538,365 1,387,866 38.8
1 Data for retail bakery operations in 1998 is not directly comparable to prior and subsequent years. The 1998 data suffer from amisclassification error that resulted in additional firms being improperly classified in this category.
Source: U.S. Census Bureau, Annual Survey of Manufacturers, Feb. 11, 2002, and Dec. 20, 2002, 1997 Economic Census, andStatistics of U.S. Businesses, 1997-1999.

B-7
Table B-8U.S. wheat: Prices of hard red winter, soft red winter, and hard red spring wheat, in selected U.S. cities, June 1997-Feb. 2003Year June July Aug. Sep. Oct. Nov. Dec. Jan. Feb. Mar. Apr. May Average
––––––––––––––––––––––––––––––––––––––––––– Dollars (per bushel) ––––––––––––––––––––––––––––––––––––––––––––––
KANSAS CITY, NO. 1 HARD RED WINTER (13 % PROTEIN)
1997/98 . . . . . . . $4.19 $3.80 $4.11 $4.07 $4.09 $4.09 $4.01 $3.80 $3.86 $3.49 $3.82 $3.75 $3.961998/99 . . . . . . . 3.57 3.57 3.12 3.17 3.67 3.89 3.74 3.61 3.35 3.34 3.34 3.49 3.491999/00 . . . . . . . 3.22 3.39 3.42 3.52 3.40 3.54 3.44 3.46 3.37 3.29 3.30 3.52 3.412000/01 . . . . . . . 3.59 3.25 3.13 3.32 3.59 3.60 3.60 3.64 3.46 3.50 3.49 3.64 3.482001/02 . . . . . . . 3.47 3.35 3.27 3.27 3.33 3.44 3.36 3.41 3.37 3.32 3.31 3.28 3.352002/03 . . . . . . . 3.61 3.91 4.30 5.05 5.10 4.75 4.39 4.05 4.09
CHICAGO, NO. 2 SOFT RED WINTER
1997/98 . . . . . . . 3.38 3.30 3.52 3.49 3.51 3.44 3.31 3.27 3.26 3.25 2.91 2.87 3.291998/99 . . . . . . . 2.72 2.51 2.39 2.32 2.56 2.58 2.49 2.46 2.28 2.63 2.31 2.24 2.461999/00 . . . . . . . 2.20 1.94 2.09 2.12 1.98 1.96 2.12 2.34 2.38 2.34 2.30 2.45 2.192000/01 . . . . . . . 2.41 2.14 2.08 2.13 2.36 2.42 2.47 2.57 2.49 2.56 2.52 2.51 2.392001/02 . . . . . . . 2.40 2.56 2.57 2.57 2.68 2.75 2.83 2.96 2.74 2.76 2.75 2.73 2.692002/03 . . . . . . . 2.81 3.19 3.42 3.92 3.89 3.85 3.53 3.32 3.44
MINNEAPOLIS, DARK NO. 1 SPRING (13% PROTEIN)
1997/98 . . . . . . . 4.31 4.08 4.34 4.33 4.32 4.30 4.18 4.03 4.05 4.19 4.19 4.06 4.201998/99 . . . . . . . 3.91 3.83 3.46 3.39 3.87 3.98 3.86 3.72 3.67 3.75 3.55 3.53 3.711999/00 . . . . . . . 3.65 3.46 3.29 3.32 3.23 3.42 3.38 3.19 3.37 3.44 3.50 3.50 3.402000/01 . . . . . . . 3.50 3.24 2.99 3.10 3.52 3.64 3.60 3.60 3.53 3.45 3.59 3.69 3.452001/02 . . . . . . . 3.63 3.51 3.37 3.47 3.68 3.61 3.54 3.51 3.51 3.46 3.52 3.56 3.532002/03 . . . . . . . 3.55 4.06 4.44 5.20 5.12 5.00 4.50 4.30 4.54Source: Economic Research Service, USDA, Wheat Yearbook Tables.

B-8
Table B-9U.S. domestic production of wheat flour, 1997-2002, and bakery flour prices, in selected cities,marketing years 1997/98-2001/02
YearDomestic flour
production1 Market YearBakery flour price
at Kansas City at Minneapolis1,000 hundred
weights––––––– Dollars (per hundred weight) ––––––––
1997 . . . . . . . . . . . . 404,143 1997/98 $9.98 $10.621998 . . . . . . . . . . . . 398,914 1998/99 9.06 9.801999 . . . . . . . . . . . . 411,968 1999/2000 8.86 9.302000 . . . . . . . . . . . . 421,270 2000/01 9.36 9.282001 . . . . . . . . . . . . 404,521 22001/02 8.99 9.162002 . . . . . . . . . . . . 400,458
1 Commercial production of wheat flour, whole wheat, industrial, and durum flour and farina.2 Projected.
Note.—Totals may not reconcile because of rounding.
Source: Wheat Situation and Outlook Yearbook, Economic Research Service, USDA, Mar. 2002. U.S. Bureau of theCensus, Flour Milling Products: 2001, Aug. 2002 and Flour Milling Products, Fourth Quarter 2002, Feb. 2003.

B-9
Table B-10Wheat flour, producer price index, Jan. 1998-Feb. 2003
Year Jan. Feb. Mar. Apr. May Jun. July Aug. Sept. Oct. Nov. Dec.Annual
average1998 . . . . . . . . 106.8 108.1 111.5 110.1 109.9 106.4 105.5 101.8 100.9 106.6 107.8 104.8 106.71999 . . . . . . . . 104.8 102.7 105 100.5 102.2 102.7 100.7 103.5 101.4 99.8 101.4 96.8 101.82000 . . . . . . . . 99.9 99.9 100.2 99.4 100.1 101.7 100.2 100.4 101.2 105.2 103.6 104.4 101.42001 . . . . . . . . 104.7 105.1 106.2 105.7 106.9 108.2 107.9 106.8 107.4 110 109.5 108.8 107.32002 . . . . . . . . 109.6 109.6 110.6 106.5 108.2 108.8 112.6 115.5 120.9 123 1120.3 1117.9 1114.02003 . . . . . . . . 1119.9 1122.2
1 Preliminary.
Source: Bureau of Labor Statistics, U.S. Department of Labor, PPI series WPU02120301.
Table B-11U.S. raw sugar price, New York, Jan. 1998-Mar. 20031
Year Jan. Feb. Mar. Apr. May June July Aug. Sept. Oct. Nov. Dec. Annual
average––––––––––––––––––––––––––––––––––––––––––––––––––––– Cents per pound––––––––––––––––––––––––––––––––––––––––––––––––––––––
1998 . . . . . . . 21.85 21.79 21.74 22.14 22.31 22.42 22.66 22.19 21.92 21.67 21.83 22.19 22.06 1999 . . . . . . . 22.41 22.38 22.55 22.57 22.65 22.61 22.61 21.24 20.10 19.50 17.45 17.87 21.16 2000 . . . . . . . 17.70 17.24 18.46 19.43 19.12 19.31 17.64 18.12 18.97 21.15 21.39 20.56 19.09 2001 . . . . . . . 20.81 21.18 21.40 21.51 21.19 21.04 20.64 21.10 20.87 20.90 21.19 21.43 21.11 2002 . . . . . . . 21.03 20.69 19.92 19.73 19.52 19.93 20.86 20.91 21.65 21.94 22.22 22.03 20.87 2003 . . . . . . . 21.62 21.91 22.14 21.89
1 Contract No. 14, duty fee paid New York.
Source: Economic Research Service, USDA, Sugar and Sweeteners Yearbook Tables, Apr. 1, 2003.
Table B-12World raw sugar price, Jan. 1998-Mar. 20031
Year Jan. Feb. Mar. Apr. May June July Aug. Sept. Oct. Nov. Dec. Annual
average––––––––––––––––––––––––––––––––––––––––––––––––––––––Cents per pound –––––––––––––––––––––––––––––––––––––––––––––––––––––
1998 . . . . . . 11.71 11.06 10.66 10.27 10.17 9.33 9.70 9.50 8.21 8.24 8.73 8.59 9.68 1999 . . . . . . 8.40 7.05 6.11 5.44 5.83 6.67 6.11 6.39 6.98 6.90 6.54 6.00 6.54 2000 . . . . . . 5.64 5.51 5.54 6.48 7.33 8.72 10.18 11.14 10.35 10.96 10.02 10.23 8.51 2001 . . . . . . 10.63 10.26 9.64 9.27 9.96 9.80 9.48 8.77 8.60 7.15 7.80 8.02 9.12 2002 . . . . . . 7.96 6.81 7.27 7.12 7.33 7.07 8.02 7.86 8.54 8.84 8.87 8.81 7.88 2003 . . . . . . 8.56 9.14 8.50 8.73
1 Contract No. 11-f.o.b. stowed Caribbean port, including Brazil, bulk spot price.
Source: Economic Research Service, USDA, Sugar and Sweetener Yearbook Tables, Apr. 1, 2003.
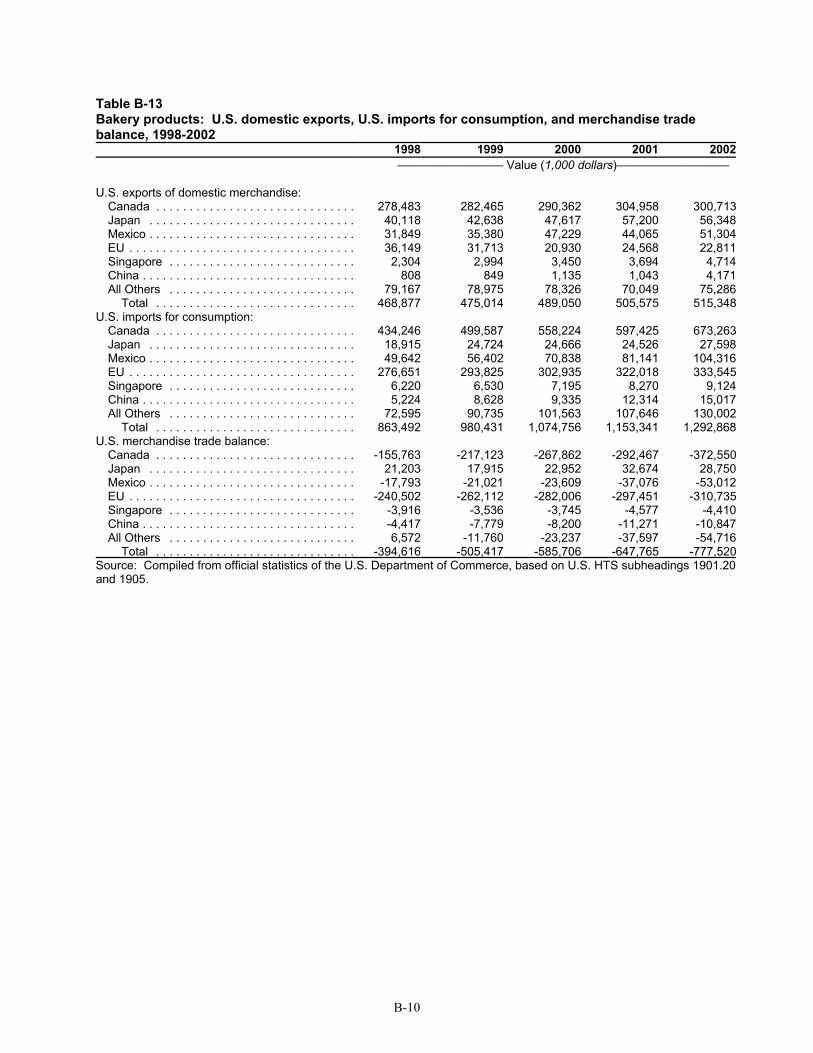
B-10
Table B-13Bakery products: U.S. domestic exports, U.S. imports for consumption, and merchandise tradebalance, 1998-2002
1998 1999 2000 2001 2002–––––––––––––––– Value (1,000 dollars)–––––––––––––––––
U.S. exports of domestic merchandise:Canada . . . . . . . . . . . . . . . . . . . . . . . . . . . . . . 278,483 282,465 290,362 304,958 300,713Japan . . . . . . . . . . . . . . . . . . . . . . . . . . . . . . . 40,118 42,638 47,617 57,200 56,348Mexico . . . . . . . . . . . . . . . . . . . . . . . . . . . . . . . 31,849 35,380 47,229 44,065 51,304EU . . . . . . . . . . . . . . . . . . . . . . . . . . . . . . . . . . 36,149 31,713 20,930 24,568 22,811Singapore . . . . . . . . . . . . . . . . . . . . . . . . . . . . 2,304 2,994 3,450 3,694 4,714China . . . . . . . . . . . . . . . . . . . . . . . . . . . . . . . . 808 849 1,135 1,043 4,171All Others . . . . . . . . . . . . . . . . . . . . . . . . . . . . 79,167 78,975 78,326 70,049 75,286
Total . . . . . . . . . . . . . . . . . . . . . . . . . . . . . . 468,877 475,014 489,050 505,575 515,348U.S. imports for consumption:
Canada . . . . . . . . . . . . . . . . . . . . . . . . . . . . . . 434,246 499,587 558,224 597,425 673,263Japan . . . . . . . . . . . . . . . . . . . . . . . . . . . . . . . 18,915 24,724 24,666 24,526 27,598Mexico . . . . . . . . . . . . . . . . . . . . . . . . . . . . . . . 49,642 56,402 70,838 81,141 104,316EU . . . . . . . . . . . . . . . . . . . . . . . . . . . . . . . . . . 276,651 293,825 302,935 322,018 333,545Singapore . . . . . . . . . . . . . . . . . . . . . . . . . . . . 6,220 6,530 7,195 8,270 9,124China . . . . . . . . . . . . . . . . . . . . . . . . . . . . . . . . 5,224 8,628 9,335 12,314 15,017All Others . . . . . . . . . . . . . . . . . . . . . . . . . . . . 72,595 90,735 101,563 107,646 130,002
Total . . . . . . . . . . . . . . . . . . . . . . . . . . . . . . 863,492 980,431 1,074,756 1,153,341 1,292,868U.S. merchandise trade balance:
Canada . . . . . . . . . . . . . . . . . . . . . . . . . . . . . . -155,763 -217,123 -267,862 -292,467 -372,550Japan . . . . . . . . . . . . . . . . . . . . . . . . . . . . . . . 21,203 17,915 22,952 32,674 28,750Mexico . . . . . . . . . . . . . . . . . . . . . . . . . . . . . . . -17,793 -21,021 -23,609 -37,076 -53,012EU . . . . . . . . . . . . . . . . . . . . . . . . . . . . . . . . . . -240,502 -262,112 -282,006 -297,451 -310,735Singapore . . . . . . . . . . . . . . . . . . . . . . . . . . . . -3,916 -3,536 -3,745 -4,577 -4,410China . . . . . . . . . . . . . . . . . . . . . . . . . . . . . . . . -4,417 -7,779 -8,200 -11,271 -10,847All Others . . . . . . . . . . . . . . . . . . . . . . . . . . . . 6,572 -11,760 -23,237 -37,597 -54,716
Total . . . . . . . . . . . . . . . . . . . . . . . . . . . . . . -394,616 -505,417 -585,706 -647,765 -777,520Source: Compiled from official statistics of the U.S. Department of Commerce, based on U.S. HTS subheadings 1901.20and 1905.

B-11
Table B-14Bakery products: U.S. imports for consumption, by selected countries, 1998-2002Country 1998 1999 2000 2001 2002
–––––––––––––––––––– Value (1,000 dollars) ––––––––––––––––––––––
Canada . . . . . . . . . . . . . . . . . . . . . . . . . . . 434,246 499,587 558,224 597,425 673,263EU . . . . . . . . . . . . . . . . . . . . . . . . . . . . . . . 276,651 293,825 302,935 322,018 333,545Mexico . . . . . . . . . . . . . . . . . . . . . . . . . . . 49,642 56,402 70,838 81,141 104,316Japan . . . . . . . . . . . . . . . . . . . . . . . . . . . . 18,915 24,724 24,666 24,526 27,598China . . . . . . . . . . . . . . . . . . . . . . . . . . . . 5,224 8,628 9,335 12,314 15,017Taiwan . . . . . . . . . . . . . . . . . . . . . . . . . . . 9,758 10,184 11,387 11,148 11,738Indonesia . . . . . . . . . . . . . . . . . . . . . . . . . 1,161 1,861 5,369 7,885 11,709Israel . . . . . . . . . . . . . . . . . . . . . . . . . . . . . 7,898 8,585 8,725 10,194 9,900Singapore . . . . . . . . . . . . . . . . . . . . . . . . . 6,220 6,530 7,195 8,270 9,124Brazil . . . . . . . . . . . . . . . . . . . . . . . . . . . . . 663 9,258 10,371 6,655 8,353All others . . . . . . . . . . . . . . . . . . . . . . . . . . 53,116 60,847 65,711 71,763 88,303
Total . . . . . . . . . . . . . . . . . . . . . . . . . . . 863,492 980,431 1,074,756 1,153,341 1,292,868
––––––––––––––––––––––– Percent –––––––––––––––––––––––––––
Canada . . . . . . . . . . . . . . . . . . . . . . . . . . . 50.3 51.0 51.9 51.8 52.1EU . . . . . . . . . . . . . . . . . . . . . . . . . . . . . . . 32.0 30.0 28.2 27.9 25.8Mexico . . . . . . . . . . . . . . . . . . . . . . . . . . . 5.7 5.8 6.6 7.0 8.1Japan . . . . . . . . . . . . . . . . . . . . . . . . . . . . 2.2 2.5 2.3 2.1 2.1China . . . . . . . . . . . . . . . . . . . . . . . . . . . . 0.6 0.9 0.9 1.1 1.2Taiwan . . . . . . . . . . . . . . . . . . . . . . . . . . . 1.1 1.0 1.1 1.0 0.9Indonesia . . . . . . . . . . . . . . . . . . . . . . . . . 0.1 0.2 0.5 0.7 0.9Israel . . . . . . . . . . . . . . . . . . . . . . . . . . . . . 0.9 0.9 0.8 0.9 0.8Singapore . . . . . . . . . . . . . . . . . . . . . . . . . 0.7 0.7 0.7 0.7 0.7Brazil . . . . . . . . . . . . . . . . . . . . . . . . . . . . . 0.1 0.9 1.0 0.6 0.6All others . . . . . . . . . . . . . . . . . . . . . . . . . . 6.2 6.2 6.1 6.2 6.8
Total . . . . . . . . . . . . . . . . . . . . . . . . . . . 100.0 100.0 100.0 100.0 100.0Source: Compiled from official statistics of the U.S. Department of Commerce, based on US HTS subheading1901.20, 1905.10.00, 1905.20.00, 1905.31.00, 1905.32.00, 1905.40.00, and 1905.90.10.
Table B-15Bread, pastries, and cake products: U.S. imports for consumption, by selected countries,1998-2002Country 1998 1999 2000 2001 2002
––––––––––––––––– Value (1,000 dollars) –––––––––––––––––
Canada . . . . . . . . . . . . . . . . . . . . . . . . . . . . . . . 126,863 148,376 186,973 241,346 303,266EU . . . . . . . . . . . . . . . . . . . . . . . . . . . . . . . . . . . 143,094 154,838 154,565 182,985 189,952Mexico . . . . . . . . . . . . . . . . . . . . . . . . . . . . . . . 30,656 33,808 43,685 47,797 65,091Japan . . . . . . . . . . . . . . . . . . . . . . . . . . . . . . . . 17,119 22,102 21,876 22,473 25,655China . . . . . . . . . . . . . . . . . . . . . . . . . . . . . . . . 4,478 7,343 8,102 11,101 13,893All others . . . . . . . . . . . . . . . . . . . . . . . . . . . . . . 56,387 60,349 65,973 71,300 87,128
Total . . . . . . . . . . . . . . . . . . . . . . . . . . . . . . . 378,597 426,816 481,175 577,002 684,985
–––––––––––––––––––––– Percent –––––––––––––––––––––––
Canada . . . . . . . . . . . . . . . . . . . . . . . . . . . . . . . 33.5 34.8 38.9 41.8 44.3EU . . . . . . . . . . . . . . . . . . . . . . . . . . . . . . . . . . . 37.8 36.3 32.1 31.7 27.7Mexico . . . . . . . . . . . . . . . . . . . . . . . . . . . . . . . 8.1 7.9 9.1 8.3 9.5Japan . . . . . . . . . . . . . . . . . . . . . . . . . . . . . . . . 4.5 5.2 4.5 3.9 3.7China . . . . . . . . . . . . . . . . . . . . . . . . . . . . . . . . 1.2 1.7 1.7 1.9 2.0All others . . . . . . . . . . . . . . . . . . . . . . . . . . . . . . 14.9 14.1 13.7 12.4 12.7
Total . . . . . . . . . . . . . . . . . . . . . . . . . . . . . . . 100.0 100.0 100.0 100.0 100.0Source: Compiled from official statistics of the U.S. Department of Commerce, based on US HTS subheading1905.90.10.

B-12
Table B-16Cookie and cracker products: U.S. imports for consumption, by selected countries, 1998-2002Country 1998 1999 2000 2001 2002
––––––––––––––––––Value (1,000 dollars) –––––––––––––––––––
Canada . . . . . . . . . . . . . . . . . . . . . . . . . . . . . . 186,824 218,402 237,282 233,757 248,303EU . . . . . . . . . . . . . . . . . . . . . . . . . . . . . . . . . . 120,236 120,314 132,115 120,786 125,540Mexico . . . . . . . . . . . . . . . . . . . . . . . . . . . . . . 17,975 21,371 25,500 31,468 36,769Indonesia . . . . . . . . . . . . . . . . . . . . . . . . . . . . 708 1,550 5,118 7,806 11,652Brazil . . . . . . . . . . . . . . . . . . . . . . . . . . . . . . . . 100 8,557 8,884 4,907 4,582All others . . . . . . . . . . . . . . . . . . . . . . . . . . . . . 19,955 25,606 26,944 28,455 31,999
Total . . . . . . . . . . . . . . . . . . . . . . . . . . . . . . 345,797 395,800 435,843 427,180 458,845
––––––––––––––––––––––– Percent –––––––––––––––––––––––
Canada . . . . . . . . . . . . . . . . . . . . . . . . . . . . . . 54.0 55.2 54.4 54.7 54.1EU . . . . . . . . . . . . . . . . . . . . . . . . . . . . . . . . . . 34.8 30.4 30.3 28.3 27.4Mexico . . . . . . . . . . . . . . . . . . . . . . . . . . . . . . 5.2 5.4 5.9 7.4 8.0Indonesia . . . . . . . . . . . . . . . . . . . . . . . . . . . . 0.2 0.4 1.2 1.8 2.5Brazil . . . . . . . . . . . . . . . . . . . . . . . . . . . . . . . . 0.0 2.2 2.0 1.1 1.0All others . . . . . . . . . . . . . . . . . . . . . . . . . . . . . 5.8 6.5 6.2 6.7 7.0
Total . . . . . . . . . . . . . . . . . . . . . . . . . . . . . . 100.0 100.0 100.0 100.0 100.0Source: Compiled from official statistics of the U.S. Department of Commerce, based on U.S. HTS subheading1905.31.00, and 1905.32.00.
Table B-17Mixes and dough products: U.S. imports for consumption, by selected countries, 1998-2002Country 1998 1999 2000 2001 2002
–––––––––––––––––Value (1,000 dollars) ––––––––––––––––––
Canada . . . . . . . . . . . . . . . . . . . . . . . . . . . . . . . 109,513 117,741 119,470 106,817 103,171EU . . . . . . . . . . . . . . . . . . . . . . . . . . . . . . . . . . . 707 1,240 1,213 1,086 1,684Israel . . . . . . . . . . . . . . . . . . . . . . . . . . . . . . . . . 80 110 151 490 443Argentina . . . . . . . . . . . . . . . . . . . . . . . . . . . . . 21 70 136 189 386Taiwan . . . . . . . . . . . . . . . . . . . . . . . . . . . . . . . 540 474 514 434 351All others . . . . . . . . . . . . . . . . . . . . . . . . . . . . . . 1,218 1,301 1,160 1,336 1,549
Total . . . . . . . . . . . . . . . . . . . . . . . . . . . . . . . 112,079 120,936 122,645 110,352 107,584
–––––––––––––––––––––– Percent –––––––––––––––––––––––
Canada . . . . . . . . . . . . . . . . . . . . . . . . . . . . . . . 97.7 97.4 97.4 96.8 95.9EU . . . . . . . . . . . . . . . . . . . . . . . . . . . . . . . . . . . 0.6 1.0 1.0 1.0 1.6Israel . . . . . . . . . . . . . . . . . . . . . . . . . . . . . . . . . 0.1 0.1 0.1 0.4 0.4Argentina . . . . . . . . . . . . . . . . . . . . . . . . . . . . . 0.0 0.1 0.1 0.2 0.4Taiwan . . . . . . . . . . . . . . . . . . . . . . . . . . . . . . . 0.5 0.4 0.4 0.4 0.3All others . . . . . . . . . . . . . . . . . . . . . . . . . . . . . . 1.1 1.1 0.9 1.2 1.4
Total . . . . . . . . . . . . . . . . . . . . . . . . . . . . . . . 100.0 100.0 100.0 100.0 100.0Source: Compiled from official statistics of the U.S. Department of Commerce, based on U.S. HTS subheading1901.20.

B-13
Table B-18Bakery products: U.S. exports of domestic merchandise, by selected countries, 1998-2002Country 1998 1999 2000 2001 2002
–––––––––––––––––Value (1,000 dollars) ––––––––––––––––––
Canada . . . . . . . . . . . . . . . . . . . . . . . . . . . . . . . . 278,483 282,465 290,362 304,958 300,713Japan . . . . . . . . . . . . . . . . . . . . . . . . . . . . . . . . . 40,118 42,638 47,617 57,200 56,348Mexico . . . . . . . . . . . . . . . . . . . . . . . . . . . . . . . . 31,849 35,380 47,229 44,065 51,304EU . . . . . . . . . . . . . . . . . . . . . . . . . . . . . . . . . . . . 36,149 31,713 20,930 24,568 22,811Hong Kong . . . . . . . . . . . . . . . . . . . . . . . . . . . . . 3,466 3,373 4,211 4,164 6,589Korea . . . . . . . . . . . . . . . . . . . . . . . . . . . . . . . . . 2,249 3,980 5,189 4,606 6,079Singapore . . . . . . . . . . . . . . . . . . . . . . . . . . . . . . 2,304 2,994 3,450 3,694 4,714China . . . . . . . . . . . . . . . . . . . . . . . . . . . . . . . . . 808 849 1,135 1,043 4,171Dominican Republic . . . . . . . . . . . . . . . . . . . . . . 3,044 3,217 4,068 3,929 3,993Philippines . . . . . . . . . . . . . . . . . . . . . . . . . . . . . 1,210 2,529 1,619 2,918 3,300All others . . . . . . . . . . . . . . . . . . . . . . . . . . . . . . . 69,198 65,877 63,240 54,431 55,325
Total . . . . . . . . . . . . . . . . . . . . . . . . . . . . . . . . 468,877 475,014 489,050 505,575 515,348
––––––––––––––––––––––– Percent ––––––––––––––––––––––
Canada . . . . . . . . . . . . . . . . . . . . . . . . . . . . . . . . 59.4 59.5 59.4 60.3 58.4Japan . . . . . . . . . . . . . . . . . . . . . . . . . . . . . . . . . 8.6 9.0 9.7 11.3 10.9Mexico . . . . . . . . . . . . . . . . . . . . . . . . . . . . . . . . 6.8 7.4 9.7 8.7 10.0EU . . . . . . . . . . . . . . . . . . . . . . . . . . . . . . . . . . . . 7.7 6.7 4.3 4.9 4.4Hong Kong . . . . . . . . . . . . . . . . . . . . . . . . . . . . . 0.7 0.7 0.9 0.8 1.3Korea . . . . . . . . . . . . . . . . . . . . . . . . . . . . . . . . . 0.5 0.8 1.1 0.9 1.2Singapore . . . . . . . . . . . . . . . . . . . . . . . . . . . . . . 0.5 0.6 0.7 0.7 0.9China . . . . . . . . . . . . . . . . . . . . . . . . . . . . . . . . . 0.2 0.2 0.2 0.2 0.8Dominican Republic . . . . . . . . . . . . . . . . . . . . . . 0.6 0.7 0.8 0.8 0.8Philippines . . . . . . . . . . . . . . . . . . . . . . . . . . . . . 0.3 0.5 0.3 0.6 0.6All others . . . . . . . . . . . . . . . . . . . . . . . . . . . . . . . 14.8 13.9 12.9 10.8 10.7
Total . . . . . . . . . . . . . . . . . . . . . . . . . . . . . . . . 100.0 100.0 100.0 100.0 100.0Source: Compiled from official statistics of the U.S. Department of Commerce, based on U.S. Schedule B numbers1901.20, 1905.10.00, 1905.20.00, 1905.31.00, 1905.32.00, 1905.40.00, and 1905.90.10.

B-14
Table B-19Bread, pastry, and cake products: U.S. exports of domestic merchandise, by selected countries,1998-2002Country 1998 1999 2000 2001 2002
––––––––––––––––––––Value (1,000 dollars)––––––––––––––––––––––
Canada . . . . . . . . . . . . . . . . . . . . . . . . . . 142,802 134,604 127,674 139,129 142,208Japan . . . . . . . . . . . . . . . . . . . . . . . . . . . 5,938 5,634 7,054 11,088 17,458Mexico . . . . . . . . . . . . . . . . . . . . . . . . . . 7,842 7,345 9,225 12,274 16,902EU . . . . . . . . . . . . . . . . . . . . . . . . . . . . . . 15,496 11,437 10,795 15,997 13,889Korea . . . . . . . . . . . . . . . . . . . . . . . . . . . 601 1,467 3,061 2,386 2,882China . . . . . . . . . . . . . . . . . . . . . . . . . . . 439 564 693 404 2,553Singapore . . . . . . . . . . . . . . . . . . . . . . . . 203 696 1,291 1,583 2,037Taiwan . . . . . . . . . . . . . . . . . . . . . . . . . . 762 1,317 1,100 1,763 1,499Guatemala . . . . . . . . . . . . . . . . . . . . . . . 356 536 744 872 1,396Australia . . . . . . . . . . . . . . . . . . . . . . . . . 2,933 812 2,055 1,576 1,222All others . . . . . . . . . . . . . . . . . . . . . . . . . 27,370 20,706 22,043 19,377 16,984
Total . . . . . . . . . . . . . . . . . . . . . . . . . . 204,743 185,117 185,735 206,450 219,031
––––––––––––––––––––––––– Percent ––––––––––––––––––––––––––
Canada . . . . . . . . . . . . . . . . . . . . . . . . . . 69.7 72.7 68.7 67.4 64.9Japan . . . . . . . . . . . . . . . . . . . . . . . . . . . 2.9 3.0 3.8 5.4 8.0Mexico . . . . . . . . . . . . . . . . . . . . . . . . . . 3.8 4.0 5.0 5.9 7.7EU . . . . . . . . . . . . . . . . . . . . . . . . . . . . . . 7.6 6.2 5.8 7.7 6.3Korea . . . . . . . . . . . . . . . . . . . . . . . . . . . 0.3 0.8 1.6 1.2 1.3China . . . . . . . . . . . . . . . . . . . . . . . . . . . 0.2 0.3 0.4 0.2 1.2Singapore . . . . . . . . . . . . . . . . . . . . . . . . 0.1 0.4 0.7 0.8 0.9Taiwan . . . . . . . . . . . . . . . . . . . . . . . . . . 0.4 0.7 0.6 0.9 0.7Guatemala . . . . . . . . . . . . . . . . . . . . . . . 0.2 0.3 0.4 0.4 0.6Australia . . . . . . . . . . . . . . . . . . . . . . . . . 1.4 0.4 1.1 0.8 0.6All others . . . . . . . . . . . . . . . . . . . . . . . . . 13.4 11.2 11.9 9.4 7.8
Total . . . . . . . . . . . . . . . . . . . . . . . . . . 100.0 100.0 100.0 100.0 100.0Source: Compiled from official statistics of the U.S. Department of Commerce, based on U.S. Schedule B number1905.90.10.

B-15
Table B-20Cookie and cracker products: U.S. exports of domestic merchandise, by selected countries,1998-2002Country 1998 1999 2000 2001 2002
–––––––––––––––––––Value (1,000 dollars)––––––––––––––––––––––
Canada . . . . . . . . . . . . . . . . . . . . . . . . . . . 71,552 80,018 87,261 89,812 78,710Mexico . . . . . . . . . . . . . . . . . . . . . . . . . . . 6,450 9,014 14,783 14,141 12,687Japan . . . . . . . . . . . . . . . . . . . . . . . . . . . . 3,488 4,892 2,986 8,000 3,616Philippines . . . . . . . . . . . . . . . . . . . . . . . . 494 1,458 654 1,247 1,749Singapore . . . . . . . . . . . . . . . . . . . . . . . . . 731 1,369 1,185 1,099 1,741Venezuela . . . . . . . . . . . . . . . . . . . . . . . . . 384 242 454 467 1,651EU . . . . . . . . . . . . . . . . . . . . . . . . . . . . . . . 2,136 14,448 4,649 2,059 1,314Korea . . . . . . . . . . . . . . . . . . . . . . . . . . . . 170 1,324 965 894 1,296Bahamas . . . . . . . . . . . . . . . . . . . . . . . . . 456 920 604 898 1,152Taiwan . . . . . . . . . . . . . . . . . . . . . . . . . . . 175 185 365 566 1,050All others . . . . . . . . . . . . . . . . . . . . . . . . . . 13,144 16,172 19,189 10,851 12,868
Total . . . . . . . . . . . . . . . . . . . . . . . . . . . 99,179 130,040 133,095 130,035 117,832
–––––––––––––––––––––––– Percent ––––––––––––––––––––––––––
Canada . . . . . . . . . . . . . . . . . . . . . . . . . . . 72.1 61.5 65.6 69.1 66.8Mexico . . . . . . . . . . . . . . . . . . . . . . . . . . . 6.5 6.9 11.1 10.9 10.8Japan . . . . . . . . . . . . . . . . . . . . . . . . . . . . 3.5 3.8 2.2 6.2 3.1Philippines . . . . . . . . . . . . . . . . . . . . . . . . 0.5 1.1 0.5 1.0 1.5Singapore . . . . . . . . . . . . . . . . . . . . . . . . . 0.7 1.1 0.9 0.8 1.5Venezuela . . . . . . . . . . . . . . . . . . . . . . . . . 0.4 0.2 0.3 0.4 1.4EU . . . . . . . . . . . . . . . . . . . . . . . . . . . . . . . 2.2 11.1 3.5 1.6 1.1Korea . . . . . . . . . . . . . . . . . . . . . . . . . . . . 0.2 1.0 0.7 0.7 1.1Bahamas . . . . . . . . . . . . . . . . . . . . . . . . . 0.5 0.7 0.5 0.7 1.0Taiwan . . . . . . . . . . . . . . . . . . . . . . . . . . . 0.2 0.1 0.3 0.4 0.9All others . . . . . . . . . . . . . . . . . . . . . . . . . . 13.3 12.4 14.4 8.3 10.9
Total . . . . . . . . . . . . . . . . . . . . . . . . . . . 100.0 100.0 100.0 100.0 100.0Source: Compiled from official statistics of the U.S. Department of Commerce, based on U.S. Schedule B numbers1905.31.00, and 1905.32.00.

B-16
Table B-21Mixes and dough products: U.S. exports of domestic merchandise, by selected countries,1998-2002Country 1998 1999 2000 2001 2002
–––––––––––––––––––––Value (1,000 dollars) ––––––––––––––––––––––
Canada . . . . . . . . . . . . . . . . . . . . . . . . 53,182 56,116 62,129 63,462 66,466Japan . . . . . . . . . . . . . . . . . . . . . . . . . 30,599 31,840 37,414 37,724 34,972Mexico . . . . . . . . . . . . . . . . . . . . . . . . 16,888 18,523 22,559 17,078 19,601EU . . . . . . . . . . . . . . . . . . . . . . . . . . . . 4,717 4,848 5,107 6,018 6,388Hong Kong . . . . . . . . . . . . . . . . . . . . . 946 1,033 1,546 2,227 4,941Dominican Republic . . . . . . . . . . . . . . 385 653 918 2,110 2,413Korea . . . . . . . . . . . . . . . . . . . . . . . . . 1,478 1,181 1,163 1,327 1,753Jamaica . . . . . . . . . . . . . . . . . . . . . . . 437 510 606 1,557 1,638Panama . . . . . . . . . . . . . . . . . . . . . . . 893 875 699 983 1,316Kuwait . . . . . . . . . . . . . . . . . . . . . . . . . 842 1,085 993 783 1,131All others . . . . . . . . . . . . . . . . . . . . . . . 27,074 25,185 20,219 18,884 16,954
Total . . . . . . . . . . . . . . . . . . . . . . . . 137,440 141,850 153,352 152,153 157,572
––––––––––––––––––––––––– Percent ––––––––––––––––––––––––––––
Canada . . . . . . . . . . . . . . . . . . . . . . . . 38.7 39.6 40.5 41.7 42.2Japan . . . . . . . . . . . . . . . . . . . . . . . . . 22.3 22.4 24.4 24.8 22.2Mexico . . . . . . . . . . . . . . . . . . . . . . . . 12.3 13.1 14.7 11.2 12.4EU . . . . . . . . . . . . . . . . . . . . . . . . . . . . 3.4 3.4 3.3 4.0 4.1Hong Kong . . . . . . . . . . . . . . . . . . . . . 0.7 0.7 1.0 1.5 3.1Dominican Republic . . . . . . . . . . . . . . 0.3 0.5 0.6 1.4 1.5Korea . . . . . . . . . . . . . . . . . . . . . . . . . 1.1 0.8 0.8 0.9 1.1Jamaica . . . . . . . . . . . . . . . . . . . . . . . 0.3 0.4 0.4 1.0 1.0Panama . . . . . . . . . . . . . . . . . . . . . . . 0.6 0.6 0.5 0.6 0.8Kuwait . . . . . . . . . . . . . . . . . . . . . . . . . 0.6 0.8 0.6 0.5 0.7All others . . . . . . . . . . . . . . . . . . . . . . . 19.7 17.8 13.2 12.4 10.8
Total . . . . . . . . . . . . . . . . . . . . . . . . 100.0 100.0 100.0 100.0 100.0Source: Compiled from official statistics of the U.S. Department of Commerce, based on U.S. Schedule B number1901.20.

B-17
Table B-22Bakery products: U.S. imports for consumption from Canada, by Customs District, 1998-2002Customs District 1998 1999 2000 2001 2002
––––––––––––––––– Value (1,000 dollars) –––––––––––––––––––
Detroit, MI . . . . . . . . . . . . . . . . . . . . . . . . . . . . . 187,546 207,518 237,687 268,909 307,275Buffalo, NY . . . . . . . . . . . . . . . . . . . . . . . . . . . . 156,597 182,993 188,755 181,291 207,166Seattle, WA . . . . . . . . . . . . . . . . . . . . . . . . . . . . 25,357 28,603 34,414 39,888 48,616Ogdensburg, NY . . . . . . . . . . . . . . . . . . . . . . . . 35,212 43,848 47,589 48,632 43,415Portland, ME . . . . . . . . . . . . . . . . . . . . . . . . . . . 8,575 10,715 16,301 14,960 24,208Great Falls, MT . . . . . . . . . . . . . . . . . . . . . . . . . 2,573 8,321 11,985 18,553 19,615Pembina, ND . . . . . . . . . . . . . . . . . . . . . . . . . . 6,078 9,310 9,334 17,070 17,745St. Albans, VT . . . . . . . . . . . . . . . . . . . . . . . . . . 10,126 6,586 10,546 7,101 4,871San Juan, PR . . . . . . . . . . . . . . . . . . . . . . . . . . 239 209 176 43 84New York, NY . . . . . . . . . . . . . . . . . . . . . . . . . . 23 28 3 6 76Miami, FL . . . . . . . . . . . . . . . . . . . . . . . . . . . . . 3 - 8 22 65Los Angeles, CA . . . . . . . . . . . . . . . . . . . . . . . . - 27 57 20 51Duluth, MN . . . . . . . . . . . . . . . . . . . . . . . . . . . . 916 560 550 392 35Chicago, IL . . . . . . . . . . . . . . . . . . . . . . . . . . . . 5 42 57 141 22Tampa, FL . . . . . . . . . . . . . . . . . . . . . . . . . . . . 39 2 - 7 8Philadelphia, PA . . . . . . . . . . . . . . . . . . . . . . . . - - - - 8Cleveland, OH . . . . . . . . . . . . . . . . . . . . . . . . . - - - 7 3Anchorage, AK . . . . . . . . . . . . . . . . . . . . . . . . . 868 715 698 346 -Columbia-Snake, OR . . . . . . . . . . . . . . . . . . . . - - 8 - -Dallas-Fort Worth, TX . . . . . . . . . . . . . . . . . . . . - 10 - - -Honolulu, HI . . . . . . . . . . . . . . . . . . . . . . . . . . . 26 21 20 13 -Houston-Galveston, TX . . . . . . . . . . . . . . . . . . - - - 3 -Laredo, TX . . . . . . . . . . . . . . . . . . . . . . . . . . . . - 11 - - -Minneapolis, MN . . . . . . . . . . . . . . . . . . . . . . . . - 20 - - -New Orleans, LA . . . . . . . . . . . . . . . . . . . . . . . . - 4 - 15 -Norfolk, VA . . . . . . . . . . . . . . . . . . . . . . . . . . . . - - 6 - -San Diego, CA . . . . . . . . . . . . . . . . . . . . . . . . . 18 - - 6 -San Francisco, CA . . . . . . . . . . . . . . . . . . . . . . 26 - 11 - -Savannah, GA . . . . . . . . . . . . . . . . . . . . . . . . . 15 - 17 - -St. Louis, MO . . . . . . . . . . . . . . . . . . . . . . . . . . - 30 - - -Unknown . . . . . . . . . . . . . . . . . . . . . . . . . . . . . . 3 16 - - -
Total . . . . . . . . . . . . . . . . . . . . . . . . . . . . . . 434,242 499,571 558,224 597,425 673,263Source: Compiled from official statistics of the U.S. Department of Commerce.

B-18
Table B-23Bakery products: Harmonized Tariff Schedule subheading; description; U.S. col 1 rate of duty as of Jan. 1, 2003; bound concession rate of duty; U.S. exports, 2002; andU.S. Imports, 2002
HTSsubheading Description
Column 1 rate of duty, as of Jan 1, 2003 Bound duty, UruguayRound
U.S. exports,2002
U. S. imports,2002General Special1
–––––––1,000 dollars –––––––
Mixes and doughs for the preparation of bakers’ wares ofheading 1905:
Containing over 25 percent by weight of butterfat, not put up for retail sale: . . . . . . . . . . . . . .
1901.20.02 Described in general note 15 of the tariff schedule and entered pursuant to its provisions . . . . . . . . . . . . . . . . . . . . . . . . . . . . . . . . . 10% Free (A, CA, E, IL, J, JO, MX) 20% 4Other:
Dairy products described in additional U.S. note 1 to chapter 4:
1901.20.05 Described in additional U.S. note 10 to chapter 4 and enter pursuant to its
provisions . . . . . . . . . . . . . . . . . . . . . . . . . . . . 10% Free (A, CA, E, IL, J, JO) 20% 34,236 01901.20.15 Other . . . . . . . . . . . . . . . . . . . . . . . . . . . . . . . 42.3¢/kg+8.5% Free (MX)
See 9909.04.05, 9909.04.48(JO) 49.8¢/kg+10% 48,321 0
Other:Articles containing over 65 percent by dry weight of sugar described inadditional U.S. note 2 to chapter 17:
1901.20.20 Described in additional U.S. note 7 to chapter 17 and enter pursuant to its provisions . . . . . . . . . . . . . . . . . . . . . 10% 20%
1901.20.25 Other . . . . . . . . . . . . . . . . . . . . . . . . . . . 42.3¢/kg+8.5% Free (MX)See 9909.17.05, 9909.17.60(JO) 49.8¢/kg+10% 75,015 0
Mixes and doughs described in additional U.S. note 1 to chapter 19:
1901.20.30 Described in additional U.S. note 3 to this chapter and enter pursuant to its provisions . . . . . . . . . . . . . . . . . . . 10% Free (A, CA, E, IL, J, JO) 20% 54
1901.20.35 Other . . . . . . . . . . . . . . . . . . . . . . . . . . . 42.3¢/kg+8.5% Free (MX)See 9909.04.05, 9909.04.48(JO)
49.8¢/kg+10% 0
1901.20.40 Other . . . . . . . . . . . . . . . . . . . . . . . . . . . . . . . 8.5% Free (A, CA, E, IL, J, MX)2.1% (JO)
20% 872
Other:1901.20.42 Described in general note 15 of the
tariff schedule and entered pursuant to its provisions . . . . . . . . . . . . . . . . . . . . . . . . . . . . . . 10% Free (A, CA, E, IL, J, JO, MX) 20% 13
See footnotes at end of table.

B-19
Table B-23—ContinuedBakery products: Harmonized Tariff Schedule subheading; description; U.S. col 1 rate of duty as of Jan. 1, 2003; bound concession rate of duty; U.S. exports, 2002; andU.S. Imports, 2002
HTSsubheading Description
Column 1 rate of duty, as of Jan 1, 2003 Bound duty, UruguayRound
U.S. exports,2002
U. S. imports,2002General Special1
–––––––1,000 dollars –––––––
Other:Dairy products described in
additional U.S. note 1 to chapter 4:1901.20.45 Described in additional U.S. note
10 to chapter 4 and enter pursuant to its provisions . . . . . . . . . . . . . . . . . 10% Free (A, CA, E, IL, J, JO) 20% 3
1901.20.50 Other . . . . . . . . . . . . . . . . . . . . . . . . . . . . 42.3¢/kg+8.5% Free (MX)See 9909.04.05, 9909.04.48(JO)
49.8¢/kg+10% 58
Other:Articles containing over 65 percent by dry weight of sugar described in additional U.S. note 2 to chapter 17:
1901.20.55 Described in additional U.S. note 7 to chapter 17 and enter pursuant to its provisions . . . 10% 20%
1901.20.60 Other . . . . . . . . . . . . . . . . . . . . . . . . . 42.3¢/kg+8.5% Free (MX)See 9909.17.05, 9909.17.60(JO) 49.8¢/kg+10% 0
Mixes and doughs described in additional U.S. note 1 to chapter 19:
1901.20.65 Described in additional U.S. note 3 to this chapter and enter pursuant to it provisions . . . . 10% Free (A, CA, E, IL, J, JO) 20% 4,551
1901.20.70 Other1 . . . . . . . . . . . . . . . . . . . . . . . . . 42.3¢/kg+8.5% Free (MX)See 9909.04.05, 9909.04.48(JO) 49.8¢/kg+10% 2,597
1901.20.80Other . . . . . . . . . . . . . . . . . . . . . . . . . . . . . . . . . . 8.5%
Free (A, CA, E, IL, J, MX)2.1% (JO) 20% 99,432
Bread, pastry, cakes, biscuits and other bakers’ wares,whether or not containing cocoa; communion wafers, emptycapsules of a kind suitable for pharmaceutical use, sealingwafers, rice paper and similar products:
1905.10.00 Crispbread . . . . . . . . . . . . . . . . . . . . . . . . . . . . . . . . . . . Free 30% 3,839 13,2181905.20.00 Gingerbread and the like . . . . . . . . . . . . . . . . . . . . . . . . Free 30% 930 16,2151905.31.00 Sweet biscuits . . . . . . . . . . . . . . . . . . . . . . . . . . . . . . . Free 30% 82,471 355,501
Frozen:1905.31.0021 Containing peanuts or peanut
products . . . . . . . . . . . . . . . . . . . . . . . . . .1905.31.0029 Other . . . . . . . . . . . . . . . . . . . . . . . . . . . . . . .
See footnotes at end of table.

Table B-23—ContinuedBakery products: Harmonized Tariff Schedule subheading; description; U.S. col 1 rate of duty as of Jan. 1, 2003; bound concession rate of duty; U.S. exports, 2002; andU.S. Imports, 2002
HTSsubheading Description
Column 1 rate of duty, as of Jan 1, 2003 Bound duty, UruguayRound
U.S. exports,2002
U. S. imports,2002General Special1
–––––––1,000 dollars –––––––
B-20
Other:1905.31.0041 Containing peanuts or peanut
products . . . . . . . . . . . . . . . . . . . . . . . . . .1905.31.0049 Other . . . . . . . . . . . . . . . . . . . . . . . . . . . . . . .1905.32.00 Waffles and wafers frozen . . . . . . . . . . . . . . . . . . . . . . Free 30% 35,361 103,344
Frozen:1905.32.0021 Containing peanuts or peanut
products . . . . . . . . . . . . . . . . . . . . . . . . . .1905.32.0029 Other . . . . . . . . . . . . . . . . . . . . . . . . . . . . . . .
Other:1905.32.0041 Containing peanuts or peanut
products . . . . . . . . . . . . . . . . . . . . . . . . . .1905.32.0049 Other . . . . . . . . . . . . . . . . . . . . . . . . . . . . . . .1905.40.00 Rusks, toasted bread and similar toasted
products . . . . . . . . . . . . . . . . . . . . . . . . . . . . . . . . Free 30% 16,143 12,021Other:
1905.90.10 Bread, pastry, cakes, biscuits and similar baked products, and puddings, whether or
not containing chocolate, fruit, nuts or confectionery . . . . . . . . . . . . . . . . . . . . . . . . . Free 30% 219,031 684,985
Frozen:1905.90.1041 Pastries, cakes and similar sweet baked
products; puddings . . . . . . . . . . . . . . . . . .1905.90.1049 Other . . . . . . . . . . . . . . . . . . . . . . . . . . . . . . .
Other:1905.90.1050 Pastries, cakes and similar sweet baked
products; puddings . . . . . . . . . . . . . . . . . .1905.90.1070 Bread . . . . . . . . . . . . . . . . . . . . . . . . . . . . . . .1905.90.1090 Other . . . . . . . . . . . . . . . . . . . . . . . . . . . . . . .
1 Programs under which special tariff treatment may be provided, and the corresponding symbols for such programs as they are indicated in the “Special subcolumn, are as follows;Generalized System of Preferences (A) or (A+); North America free Trade Agreement (NAFTA), goods of Canada (CA); NAFTA, goods of Mexico (MX); Caribbean Basin EconomicRecovery Act (E); United States-Israel Free Trade Agreement (IL); Andean Trade Preference Act (J); and United States-Jordan Free Trade Area Implementation Act (JO).