prelim finalitv plc results for year ended 31 december...
TRANSCRIPT

Press Release 5th March 2008
ITV plc results for year ended 31 December 2007
Turnaround plan on track: ITV viewing increased and advertising revenues stabilised in 2007; ITV outperforming the market in 2008.
Financial summary
12 months to 31 December (£m) 2007 2006 Change %
Group revenue 2,082 2,181 (5)
Operating EBITA* 311 375 (17)
Profit before tax 188 288 (35)
Adjusted EPS** 5.0 6.3 (21)
Full year dividend 3.15 3.15 -
* Before exceptional items ** Before exceptional items, amortisation and tax adjustments
Group revenue impacted by reduction in PRS revenues of £58m and reduction in
external Global Content revenues of £37m. Operating EBITA impacted by increased investment in digital channels; reduction in PRS
profits; and anticipated broadband start-up losses. Operating summary Total viewing of ITV family of channels increased year-on-year for the first time since the
early 1990s. ITV1 and ITV digital channels outperformed their terrestrial and digital competitors. Reviews of CRR and PSB secured and underway. ITV’s five year content-led growth strategy and targets announced. Senior executive team strengthened. Appointment to Board of Dawn Airey and Rupert Howell; Finance Director recruitment
underway; Peter Fincham to join as ITV Director of TV. Segmental highlights Broadcasting ITV family ITV net advertising revenue (NAR) held at £1,489 million (2006: £1,494 million) ITV digital channel NAR up 33% to £209 million (2006: £157 million) ITV family viewing share increased to 23.2% (2006: 23.1%) Commercial impact volume rose 3.3% and share held at 41.7% (2006: 42.2%)
ITV1 NAR fell 4% to £1,224 million, vs decline of 12% in 2006 and 10% CRR ratchet Viewing share down 2.1%, compared to double digit declines for C4 and five Volume of impacts up 1%, with share down 3.3% (2006: down 10.5%)

Global Content Integration of all UK and worldwide production and distribution under Dawn Airey Senior appointments with Peter Iacono joining as MD ITV Worldwide from Sony; Paul
Buccieri joining as CEO Granada America from Fox’s Twentieth Television ITV Productions delivered 75% of all commissioned programmes on all UK channels
attracting audiences of over 10 million Acquisition of 12 Yard building presence in key international game show genre
Online itv.com monthly unique users (UUs) reached 6 million following H2 2007 relaunch itvlocal monthly UUs reached 0.75 million following roll-out across ITV plc regions Friends Reunited revenue increased 36% with strong growth across all core sites
Current trading • Broadcasting: ITV outperforming the market in revenues and ratings
- Total ITV NAR estimated to be up 1.9% for Q1 with total TV down 0.7%. - Total TV estimated to be down around 1% for April - ITV family viewing up year to date at 23.2% (2007: 23.0%) and SOCI held at 41.5%
(2007: 41.7%) • Global Content: strong on-screen performance and international production
- Performance highlights in new schedule: Dancing on Ice, Lewis, Coronation Street, Emmerdale, Ant and Dec’s Saturday Night Takeaway.
- Major commissions secured for networks in US and Germany • Online: strategic momentum maintained into 2008
- Streaming technology improvements leading to increased video views on itv.com - Increased Friends Reunited focus on advertising as core site evolves in 2008
Executive Chairman Michael Grade said “In my first year back at ITV, we put together a growth strategy for the business and strengthened the senior team. The first priority for ITV was to stem the decline. We did more than that, delivering an increase in viewing to the ITV family for the first time in over a decade. For the first time in many years, ITV1 outperformed its competitors and we’ve continued to do so into 2008. “We are heartened by the positive response of advertisers to the improved on-screen performance and our investment in channels and online. Having stabilised our advertising revenues last year, we’ve been able to increase ITV television advertising revenues nearly 2% year on year for the first quarter of 2008, running well ahead of the total market. “We have made real progress towards delivering on our 3-5 year growth strategy. We’ve reached agreements to launch Freesat, Kangaroo and an HD ITV service this year. We’ve taken a stake in Mammoth Screen, a controlling position in Jaffe Braunstein Entertainment and acquired 12 Yard. We’ve re-launched itv.com, completed the roll out of itvlocal.com and continued to grow Friends Reunited. “The Board’s decision to recommend holding the dividend reflects their confidence in the strategy for growth and the team we have in place to deliver it. The Turnaround Plan is on track.”
- ends -

NOTES: 1) Impacts refer to adult impacts. Share of viewing refers to all-time share of all individuals viewing. ITV family
includes ITV1, GMTV and ITV digital channels (ITV2/+1, ITV3/+1, ITV, Citv, M&M, GMTV+1, GMTV2). Viewing share data and commercial impact data sourced to BARB/TNS. Year to date figures cited run to 24 February 2008 (and equivalent period in 2007).
2) Net advertising revenue figures based on ITV data and estimates. ITV1 NAR refers to ITV plc share of ITV1 NAR.
For further enquiries please contact: ITV plc Tel: 0844 8818000 Press queries Mark Gallagher - Group Director of Corporate Affairs Jim Godfrey - Director of Corporate Affairs Tel: 084488 18434 Investor queries James Tibbitts - Company Secretary Tel: 084488 15656 Christy Swords - Director of Investor Relations Tel: 084488 15651 Pippa Strong - Head of Investor Relations Tel: 0844 8814767 Tulchan Communications Group Tel: 020 7353 4200 Andrew Grant Susanna Voyle David Allchurch Website: www.itv.com, investor information: www.itvplc.com
An analysts presentation will be held at 09:30hrs on 5th March 2008 at the City Presentation
Centre, 4 Chiswell Street, London EC1Y 4UP
Message from the Executive Chairman Michael Grade 2007 was a watershed year for ITV plc. We put in place the strategy and the team to meet the challenges of the new digital era. With a much improved performance on-screen, we have countered the myth that ITV is a business managing decline. We have set out ambitious targets for our Global Content and Online businesses. Our focus now is on implementing the Turnaround strategy and delivering sustainable growth. In November 2007 digital switchover in the UK started as the town of Whitehaven turned off its analogue signal. By 2012 the whole of the UK will have switched over to digital. The transition to digital marks the start of a new era for ITV. For 25 years, ITV1 lost share to new services, for example Channel 4, five and Sky. The UK’s leading commercial channel appeared locked into an inexorable cycle of decline, exacerbated by poor performance. By the end of 2007, over 85% of UK homes had converted to digital. The multichannel fragmentation effect began to ease and ITV’s performance improved. ITV1’s audience started to stabilise and the channel enjoyed a number of programming successes – from enduring favourites like Coronation Street and I’m A Celebrity…Get Me Out of Here! to new hits, like Britain’s Got Talent, Kingdom and Primeval. A “blue chip” roster of major sports included Champions League football, Formula 1 motor racing and the Rugby World Cup. Structural changes to the schedule paid off with gains in daytime and over the summer. Over the full course of 2007, ITV1 actually delivered to its advertisers more viewers than it had the previous year, in terms of commercial impacts. ITV Productions played its part, delivering half of the channel’s original commissions – and more than half of its total impacts – with a slate extending from Emmerdale to Mobile, from Parkinson to Ant and Dec’s Saturday Night Takeaway, from This Morning to Tonight with Trevor McDonald. ITV productions for both ITV1 and other broadcasters continued to win plaudits and prizes, with successes including The Queen, See No Evil, The Street and Longford. 75% of all programmes (excluding sport) on all UK channels delivering audiences over 10 million in 2007 were made by ITV Productions. However, ITV Productions was not able to deliver revenue growth to match such on-screen successes, with drama for ITV1 and production for other UK channels both down compared to 2006. The new strategy and structure, together with personnel changes made towards the end of the year, are aimed at improving this performance in 2008. ITV’s digital channels came of age in 2007, generating in excess of £200 million of advertising and sponsorship revenues. itv.com completed its successful relaunch and now offers a state of the art broadband experience. In November, ITV announced a joint venture with BBC Worldwide and Channel 4 to provide a broadband service offering access to thousands of hours of archive programming from the UK’s top broadcasters. We are determined that ITV’s strong on-screen performance in 2007 should mark the beginning of a revival in the Company’s fortunes. To this end, during the year, we put in place the team and the strategy to deliver future growth. The ITV Senior Executive team was considerably strengthened in 2007. In Global Content, we recruited Dawn Airey, latterly of Sky and five. Rupert Howell, a major figure from the advertising sector, joined us in the crucial post of Managing Director of ITV Brand and Commercial. Carolyn Fairbairn, formerly of the BBC and McKinsey, leads our strategy and development function. Entering 2008, we have confirmed that Peter Fincham, the controller of BBC1 until October 2007, will join ITV as Director of Television. In this role, Peter will replace Simon Shaps, who has performed a great job for ITV over many years and has been Director of Television since 2005. ITV’s clarity of purpose is evident in the Turnaround strategy that we set out in September 2007. Our vision is for ITV to be the UK’s favourite source of free entertainment. We set a revenue target for the Company of 3-5% compound annual growth to 2010, rising to 5% to 2012. The Global Content business aims to double its annual revenues by 2012. Our broadcast channels aim to deliver a share of commercial impacts at or above 38.5% in 2012. We also plan to deliver £150 million of Online annual revenues by 2010. Our plan will be self-funding. We have continued with the programme of disposing of non-core businesses, which has now raised over £600 million since merger. During 2007, we disposed of our stakes in Liverpool FC, Arsenal FC, MUTV and ITFC. Such disposals will fund acquisitions which are consistent with our content-led growth plan. During the year, we took a majority stake in US producer Jaffe/Braunstein Entertainment, a 25% stake in new producer Mammoth and acquired UK independent producer 12 Yard. Our Turnaround strategy is not founded on any assumptions of regulatory relief. However significant regulatory relaxation is overdue in commercial public service broadcasting (PSB). Ahead of the launch of the Ofcom PSB review, ITV set out its detailed plans for modernising regional news. We recognise that these will have implications in terms of regional staffing, but we believe that it is right to be open about our plans and their rationale. Our plans would ensure that every home in the country retains access to a high-quality ITV regional news service from 2009, whilst maximising investment in original network programming, where the core public interest lies. It should be remembered that terrestrial television has always faced limitations in delivering at the sub-regional and local levels with multiple unresolved boundary issues stretching back over decades. Broadband delivery faces no such technical limitations and puts regional choice with the viewer, rather than the broadcaster. itvlocal.com was rolled out across all our regions during 2007, supplementing our on-air regional coverage and allowing us to target local classified and display advertising, a new market for ITV. In other areas, regulatory reform remains imperative. In September 2007, the OFT confirmed its intention to review the Contract Rights Renewal (“CRR”) mechanism which has applied to the sale of ITV1 advertising since 2003. Our improved on-screen performance in 2007 has mitigated the worst effects of CRR. But in a rapidly changing market, ITV still remains unduly restricted: ITV now faces competitors who didn’t even exist in 2003. We look forward to participating in the review process over the coming year. 2007 was also a year when trust in broadcasting came to the fore. All the major UK broadcasters faced issues over their operation of premium rate services (PRS) and allegations of misleading viewers. ITV acted swiftly when problems started to emerge, suspending all our PRS activities until systems were independently assessed by Deloitte & Touche LLP (“Deloitte”). We commissioned Deloitte to undertake a review going back over two years. Where problems have been established, we have
made full disclosure, offered full recompense to viewers and improved our systems. We have committed to donating in full to charity any viewer refunds that are not claimed. ITV is also co-operating fully with Ofcom’s inquiry into the PRS incidents on ITV channels and we await the outcome of their adjudication. GMTV, which is 75% owned by ITV, faced serious PRS issues of its own in 2007 relating to the conduct of its on-screen competitions and received a substantial fine from the regulator. Such incidents for the most part appeared to stem from misguided editorial judgments taken with a view to maximising viewer enjoyment, not from any desire to maximise PRS revenues. Nonetheless we let our viewers down and that is inexcusable. We are determined to restore public trust in ITV and UK broadcasting as a whole. The Remuneration Committee of the Board has taken account of PRS issues in calculating annual bonuses awarded to the executive team. I am confident that the business is in better shape going into 2008. The launch of the new ITV1 schedule shows our commitment to innovation. We have launched a succession of ambitious dramas, from Honest to the genre-busting Moving Wallpaper/Echo Beach. We have brought News at Ten back to ITV1. The weekend schedule is underpinned by great entertainment, from Dancing on Ice to Harry Hill’s TV Burp. As the year progresses, football fans will have Euro 2008 and England’s home games to enjoy on ITV, as well as the Champions League. Our valuable production business needs to grow and deliver programmes for ITV, other UK broadcasters and the international market. We have the considerable advantage of being an integrated producer/broadcaster. Our emphasis needs to shift from producing linear programmes for one-off transmission on a single channel to “360 degree” exploitation of the lifetime value of our content, across multiple platforms and territories. We will also be investing for the future: in monetising itv.com; in building on the success of ITV2; and in rolling out an HD service as part of our Freesat project with the BBC. BSkyB’s acquisition of a 17.9% stake in ITV plc was subject to a Competition Commission review in 2007. In January 2008, the Secretary of State confirmed that BSkyB would be required to reduce its stake to below 7.5%, although the decision is being appealed. The Board will continue to act in the best interest of all shareholders. The Board has reviewed the level of the final dividend in light of the performance of the Company over the course of 2007, current trading conditions and the outlook going forward. In 2007, ITV plc NAR fell by 0.3% on the previous year with strong growth in ITV digital channels offsetting a decline in ITV1 revenues. In the first quarter of 2008, ITV plc NAR is expected to be up around 1.9%, growing ahead of the total market. In the light of this trading context and the Company’s stated policy of building back to 2 to 2.5 times dividend cover in the medium term, the Board proposes that the final dividend for the year should be held at 1.8 pence per share to be paid on 1 July 2008 to shareholders on the register on 18 April 2008. In February 2007 Sir James Crosby was appointed senior independent director and Chairman of the Nomination Committee. Agnès Touraine and Heather Killen joined the Board in August 2007 and John Ormerod in January 2008. Sir Robert Phillis resigned from the Board in 2007 and John McGrath in early 2008. The Board is grateful to Bob and John for their significant contribution to ITV plc over the last few years. In February 2008, Dawn Airey and Rupert Howell were appointed directors, providing strengthened executive representation at board level. We confirmed our intention to appoint a dedicated Finance Director, freeing up John Cresswell to focus on his responsibilities as Chief Operating Officer. The Board has also extended my appointment as Executive Chairman to the end of 2010. All of my contractual terms – including the terms and period of the Turnaround Incentive Award – remain unchanged. The decision provides my management team and I with the space to focus on the job to be done over the next crucial years, without distraction. ITV made measurable progress over the course of 2007. The operational performance in the year was better than it has been for some time. We have also started to lay the foundation for sustainable growth in the future. I would like to thank all of my colleagues at ITV for their considerable effort, dedication and creativity in serving the needs of our viewers, advertisers and shareholders. Michael Grade Executive Chairman

Operating review It was a tough year for ITV and all UK broadcasters, with the issues of trust coming to the fore, in particular in the context of premium rate services (“PRS”). ITV’s strategy was set out publicly in September 2007, following an in-depth analysis of the market, competitive trends and the opportunities and challenges facing ITV. The strategy is reflected in a new segmental structure for the Company, incorporating Broadcasting, Global Content and Online. Broadcasting remains the primary revenue driver of the Company with ITV1 in particular still delivering over 50% of the Company’s total revenues in 2007. Broadcast incorporates all our advertising funded television channels. Simon Shaps is Director of Television, responsible for commissioning and scheduling across all ITV channels. In February 2008 we announced that Peter Fincham, former controller of BBC1, would be taking over from Simon later this year. In November, Rupert Howell took up a new position as Managing Director of Brand and Commercial, responsible for sales and marketing across all our channels. Together with our advertising-funded channels, for reporting purposes, Broadcasting incorporates the wholly owned SDN which is a platform business operating a digital terrestrial multiplex. Our strategy is driven by our content. Global Content was created during 2007 to pull together all production for ITV and other UK broadcasters; international production and distribution; merchandising and other commercial ventures. Dawn Airey took up a new position as Managing Director of Global Content in October 2007, working closely with John Whiston as Director of ITV Productions. Finally Online incorporates our consumer-facing online activities, notably itv.com, itvlocal.com, Friends Reunited and the new broadband joint venture with BBC Worldwide and Channel 4. Our Online division is headed by Jeff Henry as Managing Director, of ITV Consumer. Over the course of 2007, we have also significantly strengthened core central functions. Carolyn Fairbairn joined the Company from McKinsey as Director of Strategy and Development and is responsible for strategy, development and regulation across the Company. Mark Gallagher joined the Company from Camelot as Director of Group Corporate Affairs and has established an integrated communications and public affairs function. Andrew Garard also joined as Group Legal Director. Outside the core divisions, ITV retains a number of businesses identified as non-core and candidates for sale or exit. These include Carlton Screen Advertising, Screenvision and broadband ventures related to football clubs in which ITV no longer retains a stake. Key operational developments in the major business areas and with respect to these non-core activities in 2007 are described in the following sections.
Broadcasting 2007 saw improvement in ITV1’s schedule and performance, with ITV’s digital family of channels continuing to grow. Following steep declines in 2006, the performance of the ITV1 schedule was more stable in 2007. In absolute terms, ITV1 actually delivered a higher level of commercial impacts – individual viewings of 30 second commercials – in 2007 compared to 2006. Key long-running programmes – in particular Coronation Street and Emmerdale in peak and This Morning and The Jeremy Kyle Show in daytime – continued to perform well, underpinning the schedule as a whole. Performance in the afternoons improved with the introduction of a new schedule architecture which saw ITV’s children’s programming focused on the Citv channel and on weekends on ITV1. The channel’s sporting output was boosted by the explosive debut season of Lewis Hamilton in Formula 1, England defying the odds in the Rugby World Cup, and the enduring excitement of Champions League football. The ITV1 schedule was refreshed with a number of successful new shows, including Britain’s Got Talent, Primeval and Kingdom, all of which return in 2008. In total ITV1 launched 23 new shows in 2007 which secured audiences in excess of 5 million viewers (2006: 32 new shows). ITV News continued to set the agenda with award winning programmes, reporting and special broadcasts. The year began successfully with ITV News picking up four prestigious Royal Television Society Journalism awards, including the Programme of the Year award for the ITV Evening News. Following January’s “Big Melt” climate change report from Antarctica, ITV News continued its on location reports with a week long “Iraq Week” special in March and “Zimbabwe Week” in September – the latter including interviews with Prime Minister Gordon Brown and Archbishop Desmond Tutu. ITV1 remained the leading free-to-air commercial channel in the UK, with a lead over all channels (including BBC1) in peak time between 7.00 pm and 10.30 pm in the evening. Across all time, ITV1 recorded its best year-on-year performance in share of viewing terms since 2001, with a fall of just 2.1% year-on-year. This compared to losses of 3.2% at BBC1, 2.9% at BBC2, 10.3% at Channel 4 and 10.1% at five. ITV1’s volume of commercial impacts was up 1.1% year-on-year across all adults and was up 1.3% in terms of the ABC1 adults prized by advertisers. However ITV1’s share of commercial impacts (SOCI) – the core currency for advertisers under the CRR mechanism – fell to 32.0% compared to 33.1% in 2006. This is because the total universe of commercial impacts continues to grow rapidly as the UK transitions to digital and the BBC loses viewing in the process. However this SOCI loss of 3.3% represents a significant improvement over 2006, when ITV1 registered a decline of 10.5%. As important as on-screen progress during the year, ITV1 also laid the foundation in 2007 for the new schedule launch in January 2008. In March 2007 ITV secured the terrestrial rights to FA Cup football and England home internationals from the 2008/09 season. In Autumn 2007, ITV confirmed that News at Ten would return in 2008 with Trevor McDonald joined by Julie Etchingham and Mark Austin. A raft of new programmes and returning favourites were commissioned during the year to hit ITV1 screens in early 2008. These included exciting new dramas Honest, The Fixer and Rock Rivals, returning hits including Kingdom, Harry Hill’s TV Burp, Primeval and Dancing On Ice. Beyond ITV1, ITV’s digital channels also had a successful year in 2007. ITV2 moved into the next phase of its development with increased commissioning of exclusive content. Secret Diary of a Call Girl starring Billie Piper peaked with an audience of 2.2 million in September, an exceptional audience for a digital-only channel. Investment in such channel-defining, original content has further cemented ITV2’s proposition as a bespoke channel for younger audiences, distinct from and complementary to ITV1.

ITV2’s share of viewing across 2007 in multichannel homes was 2.2%, up 11.9% on 2006. ITV2 was named non-terrestrial channel of the year at Broadcast magazine’s awards and at the 2007 Edinburgh International Television Festival. ITV3 was the UK’s ninth most popular channel for 2007 with a share of viewing of 1.4% in multichannel homes. ITV4 grew its audience share in multichannel homes by almost 25% over the year as high quality sporting events in particular attracted large audiences to the channel. In its first full year of broadcasting the Citv channel played an important role in reaching children in digital homes and in particular on the DTT platform, where it is the only free-to-air commercial children’s channel. Citv represents a far more effective means of reaching children than children’s programming on ITV1, which reduced in volume in 2007. However the Citv channel was impacted by regulatory restrictions on food advertising to children, which came into force in 2007 and apply in full to children’s channels from 2008. The ITV Play digital channel was closed in March 2007. Revenues had been impacted by the PRS issues referred to earlier. Closure of the channel freed up DTT spectrum which ITV has redeployed to launch the time-shifted ITV2+1 service on the platform. Between them, ITV’s digital channels were responsible for 37.5% of the growth in multichannel viewing in the UK during the year and overall advertising revenue from our digital channels grew by 33% to £209 million. The contribution from ITV’s digital channels meant that ITV overall increased its volume of commercial impacts year-on-year by 3.2%. In SOCI terms, ITV plc channels accounted for 41.7% of all UK commercial impacts (2006: 42.2%), a 1.2% decline (2006: 5%). ITV’s strong on-screen performance in 2007 was all the more impressive as it was delivered on approximately the same level of investment in programming as 2006. ITV has sought to improve schedule efficiency further by developing more long-running, returnable series, rather than one-offs or short-run series. ITV maintains tight control on costs and is one of the most efficient broadcasters in the UK as measured by the relationship between programme spend and audience share. ITV’s performance on-screen also allowed the Company to optimise its advertising revenues across the year. ITV1 advertisers could reduce their share commitment to ITV1 in 2007 by over 10% on average under the CRR ratchet because of ITV1 performance in 2006. However the channel was well-placed to attract short-term advertising revenues as ITV1 fared better than its core competitors Channel 4 and five across the year. In 2007 ITV1 accounted for 498 out of the top 500 shows on UK commercial television (2006: 499 out of 500), making it the UK’s most effective brand-building channel for advertisers by some margin. ITV television advertising revenues fell by 0.3% in 2007 compared to an 8.4% drop in 2006 and against total growth in the market in 2007 of 3.1%. A strong on-screen performance in 2007 means that ITV1 enters 2008 with the lowest CRR ratchet since merger. Rather than reducing their share commitment to ITV1 by over 10% as applied going into 2007, advertisers and agencies are entitled only to reduce their commitment by around 4% in 2008. With ITV1 schedule changes seeking to maximise audience levels in crucial peak viewing hours and ITV’s commercial competitors continuing to lose audience share, ITV will compete fiercely for revenues from advertisers and agencies over and above their contractual minimum. The continuing growth, in audience share and SOCI terms, of ITV’s digital channels also positions them well to continue strong growth in revenue terms over the course of 2008, depending on conditions in the wider market. The wholly-owned DTT multiplex operator, SDN, enjoyed a successful year in 2007. Early renewal of a significant contract with QVC underlined the ongoing strength of the Freeview capacity market, and provided for improved terms for SDN. During the course of 2007, ITV also confirmed that it had contracted with the transmission operator Arqiva to deliver the DTT transmission infrastructure that will take the channels occupying the capacity licensed to ITV and to SDN through the switchover process. Post-switchover ITV’s core capacity will reach around 98.5% of the UK with SDN channels available to over 90% of the UK. The switchover process begins in earnest in 2008 and confirmation of the post-switchover multiplex configuration (in particular for HD and PSB channels) is also expected in 2008, which should be a further positive for the platform and for SDN. In 2007 ITV also confirmed a joint venture with the BBC to launch a “Freesat” subscription-free digital satellite service in 2008. The new service will include free-to-air HD services from ITV and the BBC.
Global Content Global Content registered a number of significant achievements in 2007 and profits increased 2% to £90 million. But while profits were maintained, revenues were down in particular because sufficient and consistent commissions were not secured from ITV and other UK channels. The second series of Dancing on Ice proved a huge success for ITV1, attracting consistently high audiences across its nine week run. Overall, Dancing on Ice secured an average audience of 8.5 million with a 37.4% share in its Saturday night slot (2006: 9.5 million, 41% share). Other entertainment successes included the 7th series of I’m A Celebrity…Get Me Out of Here and the 7th series of Ant and Dec’s Saturday Night Takeaway. Lewis returned to ITV1 on Sunday nights as a series. With an average audience of 8.3 million and a 34% share, the series was one of ITV1’s top performing dramas across the year. The ITV premiere of the Oscar-winning movie The Queen delivered an average audience of 8.7 million and a 38% share. However drama production for ITV overall fell short of target. Personnel changes and a restructuring during the course of 2007 aim to return the business to growth going forward. ITV-produced soaps continued to draw impressive audiences in 2007: Coronation Street was the top-performing show in the UK in 2007, excluding sport, with the highest rating episode attracting an audience of 13.1 million, and a 49.5% share (2006: 12.6 million viewers, 52.6% share). Throughout the year it was the UK’s top performing soap, averaging an audience of 10.1 million and a 44.6% share (2006: 10.1 million viewers, 46% share). Emmerdale attracted an average audience of 7.5 million and a 37.2% share (2006: 7.6 million, 38.4% share), and was scheduled against the BBC’s biggest show, Eastenders, on 15 occasions in 2007. In 2008, that head-to-head battle becomes a fixture, with the new ITV1 schedule pitting Emmerdale against Eastenders every Tuesday evening. Across the year, ITV Productions secured around 50% of ITV1 commissions, but was slightly down on the previous year, as the network decided not to recommission a number of established programmes – in particular dramas – as part of its schedule changes. The success of ITV’s content-led strategy relies in part on ITV Productions growing its share of ITV1 commissions, with a target for the Global Content division of 75%. The Turnaround strategy also requires significant growth in commissions for UK broadcasters other than ITV. 2007 again saw a significant volume of ITV production for other UK broadcasters, including The Street, University Challenge, Come Dine With Me and Countdown. However UK production beyond ITV was down 34% year-on-year, with external drama falling short of target.

However ITV can face the challenges of delivering growth in Global Content with some confidence, as 2007 once again provided ample evidence of the quality of the Company’s output and the creativity of its staff. ITV’s Turnaround strategy targets a rate of expansion in Global Content that will not be delivered solely by organic growth. ITV has earmarked up to £200 million of proceeds from disposals for content-related acquisitions and has also committed to supplementing existing in-house operations with a variety of innovative partnerships and flexible structures to ensure that ITV continues to tap the widest range of UK production talent. In July 2007, ITV announced that it would be taking a 25% stake in Mammoth, a new drama producer set up by a team with an established track record in the genre. In December 2007 ITV confirmed the acquisition of 12 Yard, an independent producer specialising in gameshow and quiz show formats and production. Gameshows and quiz shows represent perhaps the most internationally saleable genre of programming, but have not been an area of strength for ITV historically. The majority of ITV1 gameshows and quiz shows, from Who Wants to Be a Millionaire to Goldenballs, are not in-house productions. Even where ITV has produced or co-produced such shows itself – for example, with Countdown and Gameshow Marathon – it has tended to rely on formats from third party producers. It is hoped that the acquisition of 12 Yard will help reverse this trend, with a number of possible new commissions for ITV1 under discussion. Internationally 2007 was a strong year for returning formats such as First 48, Celebrity Fit Club and Hell’s Kitchen with Gordon Ramsay in the US, Das Perfekte Dinner (Come Dine With Me) in Germany, and Dancing with the Stars in Australia. Distribution revenues at ITV Worldwide were impacted by the reduction in UK commissions and the exchange rate. Nonetheless sales were registered with TV broadcasters, home entertainment partners and new media platforms in more than 250 countries worldwide. Top sellers in 2007 included Hell’s Kitchen USA, Agatha Christie’s Marple and Northanger Abbey and Mansfield Park from ITV’s Jane Austen season. Format sales included Saturday Night Takeaway, sold to Hunan TV in China which debuted in early 2008 with an audience of 55 million viewers. Trading for Granada Ventures was challenging with price competition in areas such as DVDs eroding margins and turnover, even where volumes were maintained. There were strong campaigns around classic ITV brands like Sharpe and Inspector Morse, and strategic acquisitions in the children’s and comedy market. Mobile and online gaming products were released for Catchphrase, Bullseye and Countdown, with ITV Classic Gameshows released for Xbox, Nintendo, Sony Playstation and PSP. A number of digital “download to own” deals were agreed in 2007 and this will be a major initiative in 2008 exploiting our available catalogue. Online 2007 was a crucial year for Online with the relaunch of a video-enabled itv.com, full national roll out of itvlocal.com, continuing growth at Friends Reunited, and the agreement of joint venture terms for a broadband archive service with the BBC and Channel 4. In 2007, itv.com received a complete functional and visual overhaul, enabling it to compete with other major entertainment sites. Now equipped with a broadband video player and a much-expanded operations and editorial team, the site offers channel simulcasts for ITV1, ITV2, ITV3 and ITV4 as well as a 30-day catch-up service and access to archive material. As a result of this new look and feel, the site has achieved substantial growth, with unique users per calendar month breaking through the 6 million barrier for November. Moving forward, itv.com is developing key partnerships with other online players and the first exclusive made-for-broadband commissions. A partnership with MSN for the duration of I’m a Celebrity…Get Me Out Of Here! in November saw exclusive clips on the MSN portal in exchange for cross-promotion of itv.com. itv.com launched with Web Lives, an innovative series of short, documentary-style programmes made by Roger Graeff. In 2008 there will be further commissions, including a 12-part series of drama shorts linked to new ITV1 dramas Moving Wallpaper and Echo Beach, called The Mole. 2007 saw the completion of the full roll-out for our regional broadband service itvlocal.com. From October, the service has been available in all ITV regions, and in December, it attracted over 750,000 unique users. itvlocal.com is modernising ITV’s delivery of regional news, expanding the viewing and reach of our regional programming online. Almost 70% of visitors are coming to itvlocal.com for local news before the main regional news programme airs on ITV1 at 6pm. itvlocal.com has over 1,000 hours of news, weather, short films, documentaries, viewer videos, and other material available to be viewed on demand by broadband viewers. The Friends Reunited group of sites continued to grow during 2007 with revenues increasing by 36% on the previous year. Worldwide, Friends Reunited currently has 19 million registered members (2006: 17 million), whilst Genes Reunited has 7.9 million (2006: 5.8 million). One new name is added to Genes Reunited every second and a new member joins the Friends Reunited Dating site every two minutes. Following our recent strategy review, there are plans in development for much greater integration with each Friends Reunited business and itv.com, including a reduced emphasis on subscription fees for some parts of the sites. In November 2007, ITV announced the creation of a commercial three-way joint venture with BBC Worldwide and Channel 4 to launch an on-demand content service in 2008. The service will bring together over ten thousand hours of the UK broadcasters’ current and archive programming from the UK’s three leading broadcasters. Content will be available to be both streamed and downloaded with viewers able to watch for free, rent or buy. Going forward, itv.com will provide access to catch-up programming and clips, and will carry exclusive simulcasts of ITV channels, whilst the joint venture broadband service will be the home of the ITV archive.
Non-core businesses and efficiency savings ITV continued its programme of non-core disposals in 2007, selling stakes in Arsenal and Liverpool football clubs, MUTV and the ITFC sub-titling business. ITV retains stakes in broadband services associated with Arsenal and Liverpool, but is seeking to dispose of these businesses during the course of 2008. Carlton Screen Advertising had a challenging year in 2007. Notwithstanding healthy cinema attendances, CSA was adversely affected by falling revenues and onerous contractual commitments, which led to a continuing trading loss. ITV took an exceptional operating charge of £9 million and has entered into a dialogue with cinema operators and other parties regarding the future of the business.

Our US screen advertising joint venture with Thomson enjoyed another year of impressive double-digit revenue and profit growth. The installed installation pipeline of digital screens is currently over 7,000 out of a total screen count of just under 15,000. Our European cinema advertising business, also a 50/50 joint venture with Thomson, experienced a year of consolidation. Total revenues were constant year on year, with strong revenue growth in France offset by a disappointing performance by the Belgian business. In 2006 we announced a programme of efficiency savings across the Company aimed at achieving a cost reduction run rate of £41 million a year by 2008. This programme is on track with an annualised £29 million of savings delivered in 2007. Continuing efficiency gains and disposal of non-core businesses remain a priority for the business in the context of our turnaround strategy. Savings and disposals will fund the investment and acquisitions that are necessary to deliver sustainable growth.
Efficiency savings 2007-08
2007
£m2008F
£mBack Office 11 15Property 1 1Systems and Technology 4 7Transmission 6 7Staff related 4 6Procurement 3 5Cumulative total 29 41Cumulative cost of change 15 26Note: Efficiency gain run-rate to end of 2007 and company forecasts to 2008.

Financial review Statutory results for the year ended 31 December 2007 Total revenue for the year ended 31 December 2007 was 5% lower at £2,082 million (2006: £2,181 million). Operating profit decreased to £192 million (2006: £264 million) with operating profit before amortisation and exceptional items down 17% at £311 million (2006: £375 million). Our reportable segments have been redefined in 2007 following the adoption of IFRS 8, with 2006 numbers restated as appropriate.
2007
£m 2006
£mChange
£m
Broadcasting revenue 1,738 1,797 (59)Broadcasting EBITA 244 296 (52)Global content revenue 244 281 (37)Global content EBITA 90 88 2Online revenue 33 23 10Online EBITA (12) 1 (13)Other revenue 67 80 (13)Other EBITA (11) (10) (1)Total revenue 2,082 2,181 (99)Total EBITA 311 375 (64)Note: EBITA is stated before operating exceptional items.
The table above includes the revenue of disposed businesses (021 and Granada Learning) of £8 million in 2006 within the “Other” Segment. These businesses were sold in 2006.
Broadcasting Broadcasting revenues Broadcasting revenues comprise NAR, sponsorship income, interactive revenues (PRS and Red Button), ITV Play, SDN and other revenues. Total ITV plc NAR decreased by 0.3% during the year to £1,489 million (2006: £1,494 million).
2007
£m 2006
£mChange
£m
ITV1 1,224 1,281 (57)Multichannel NAR 209 157 52GMTV 56 56 –ITV plc NAR 1,489 1,494 (5)
ITV1’s NAR in the year was £1,224 million (2006: £1,281 million), £57 million lower than 2006. This reduction was almost offset by the strong performance of ITV2, ITV3 and ITV4 which, together with Men and Motors and Citv, contributed 33% year-on-year growth of £52 million, resulting in total NAR of £209 million (2006: £157 million) across these channels. ITV’s NAR is a function of audience share which is measured in terms of commercial impacts, prevailing advertising market conditions and television’s share of that market. 2007 was a good year for the television advertising market, with growth of 3.1% compared to a decline of 4.9% in 2006. The decrease of 4.4% in ITV1’s NAR was a significantly better performance than in the prior year and was achieved despite the considerable effect of CRR following the 10.5% decline in ITV1 SOCI in 2006. ITV1 adult SOCI declined just 3.3% to 32.0% in 2007. In 2007, ITV family’s adult SOCI on UK television was 41.7% (2006: 42.2%). Sponsorship income increased by 6% in 2007 to £56 million (2006: £53 million) due to price increases as the cost of sponsorship moves closer to airtime value and also the successful sponsorship of new programmes and events, such as the 2007 Rugby World Cup. SDN revenues grew strongly in the year, increasing by 44% in 2007 to £36 million (2006: £25 million). Other broadcasting revenues of £157 million (2006: £225 million) include airtime sales on behalf of third-parties, sales of ITV programming by the ITV Network Centre to Channel 3 licences not owned by ITV and ITV Play and interactive transactions including those from GMTV. Revenues were lower than in the prior year largely because of the significant reduction in PRS revenues. Broadcasting schedule costs Total ITV schedule costs increased by £17 million in 2007 to £1,087 million (2006: £1,070 million). This breaks down as follows:
2007
£m 2006
£mChange
£m
ITV1 837 840 (3)Regional news and non-news 114 119 (5)Total ITV1 costs 951 959 (8)ITV2, ITV3, ITV4, Citv, M&M 101 75 26GMTV 35 36 (1)Total schedule costs 1,087 1,070 17

Licence fees Licence fees comprise both a fixed annual sum (the cash bid) and a variable element representing a percentage of the Group’s ITV1 and GMTV NAR and sponsorship income (PQR Levy). The PQR Levy is reduced by the percentage of homes which receive ITV1 in digital format. The digital licence rebate for 2007 is calculated on a weighted average digital penetration of 78% (2006: 70%).
2007
£m 2006
£mChange
£m
Cash bid payment 4 4 –PQR Levy 180 187 (7)Digital rebate (140) (140) –Total 44 51 (7)
The payment will continue to fall as digital penetration increases. In 2006 the digital rebate includes £6 million relating to the agreement of prior year returns with Ofcom. Broadcasting EBITA The Broadcasting segment EBITA before exceptional items for 2007 fell by £52 million to £244 million (2006: £296 million). This was primarily due to a decline in ITV1 NAR reflecting 2006 on-screen performance, PRS issues and increased investment in digital channels.
Global Content
Global Content revenues 2007
£m 2006
£mChange
£m
Production for other broadcasters 111 138 (27)Distribution and exploitation 114 123 (9)Resources 19 20 (1)External revenues 244 281 (37)Internal revenues 320 351 (31)Total Global Content revenues 564 632 (68)
The table above includes revenues from 12 Yard, acquired in December 2007 and Jaffe/Braunstein Entertainment, acquired in May 2007. These totalled £7 million. Global content revenue includes original productions for the UK and international markets, the distribution and exploitation of internally generated and acquired rights, and studios and facilities revenue. Programming made by ITV Productions for ITV channels is not included in the reported total revenue as it represents an internal programming cost of sale and in 2007 this internal programming amounted to £320 million of ITV network programme spend (2006: £351 million). In 2007, total external sales of £244 million (2006: £281 million) included original productions for other broadcasters of £111 million (2006: £138 million), distribution and exploitation sales of £114 million (2006: £123 million) and revenue from the hire of studio and technical facilities of £19 million (2006: £20 million). The fall in revenues was partly due to the refreshment of the ITV1 schedule which led to the ceasing of production of eight ITV Productions shows and the termination of children’s production. Personnel issues also temporarily affected drama commissions. Global Content profits were maintained in 2007 at £90 million (2006: £88 million).
Online Online revenues continued to grow in 2007 and totalled £33 million for the year (2006: £23 million). This is made up of the following revenue streams:
2007
£m 2006
£mChange
£m
itv.com and other* 11 7 4Friends Reunited 22 16 6Total Online revenues 33 23 10* includes itvlocal.com, ITV Mobile and other revenues.
Revenues increased by 44% in the year, with major contributions from Friends Reunited and itvlocal.com. Online 2007 EBITA before exceptional items fell to a £12 million loss (2006: £1 million profit) due to the set up costs of relaunching itv.com and the full roll out of itvlocal.com nationally.
Other Revenues from outside of the main segments for 2007 were revenues from Carlton Screen Advertising (CSA) of £67 million (2006: £72 million). In 2006, £8 million of revenue was earned from Granada Learning and 021. In 2007 CSA EBITA contribution was a loss of £11 million due to a decline in cinema advertising revenues and high minimum guarantee payments (2006: loss of £10 million, including a £3 million loss from Granada Learning).
Exceptional items The operating exceptional items in the year total £35 million and include £18 million relating to PRS fines and reimbursements costs, and £9 million CSA onerous contract provision as a result of falling revenues and minimum guarantee commitments and £8 million reorganisation and integration costs relating to the efficiency programme.

Net financing costs
Financing income 2007
£m2006
£m
Interest income on bank deposits 30 20Expected return on defined benefit pension plan scheme assets 152 144Change in fair value of financial liabilities designated at fair value through profit or loss 14 –Foreign exchange gain – 4Other interest receivable 4 2 200 170
Financing costs 2007
£m2006
£m
Interest expense on financial liabilities measured at amortised cost (54) (35)Change in fair value of financial liabilities designated at fair value through profit or loss – (31)Foreign exchange loss (42) –Interest on defined benefit pension plan obligations (134) (126)Other interest expense (3) (4) (233) (196)Net financing costs (33) (26)
The increase in net financing costs is primarily due to the full year impact of the £250 million and €500 million bonds issued in October 2006, partially offset by fair value gains on interest rate swaps. These gains include £42 million of cross-currency swap movements which offset the foreign exchange loss on the €356 million and €500 million bonds.
Investment income Investment income of £1 million comprises dividend income from our holding in SMG plc. The 2006 £3 million of income also included dividends from our former holding in Seven Network in Australia.
Gain on sale of properties The £9 million gain on sale of properties in the year principally arose from the sale of properties in Southampton, Birmingham and Newbury.
Gain on sales of non-current assets and investments During the year the disposal of non-core businesses and investments resulted in a gain of £43 million. The sale of the investment in Liverpool Football Club and Athletic Grounds plc resulted in a gain of £7 million. The sale of the Group’s investment in Arsenal Holdings plc, along with an option over the Group’s 50% interest in Arsenal Broadband Ltd, resulted in a gain of £28 million. Negotiations for the sale of Arsenal Broadband Ltd are continuing. A profit on sale of £5 million was obtained from the sale of ITFC and £3 million from the disposal of our investment in MUTV. In addition to the above, the Group also disposed of certain assets connected to a transmission outsourcing arrangement for £4 million resulting in a nil gain or loss being booked. Offsetting these disposal profits is a £26 million impairment relating to our holding in SMG plc which has experienced a significant decline in its share price since October 2007.
Tax The effective rate of tax on profit before tax is 27%. The underlying rate of tax on operating profits is 31% as shown below. Underlying rate of tax £m
Operating profit before exceptional items, amortisation and share of profits of joint ventures and associates – Profit before tax as reported 188– Exceptional items (net) 9– Amortisation 84– Share of profits of joint ventures and associates (2) 279Underlying tax charge – Tax charge as reported 50– Net credit for exceptional items 6– Credit in respect of amortisation 19– Credit in respect of prior period items 11 86Underlying rate of tax 31%
Earnings per share Basic earnings per share are 3.5 pence (2006: 5.5 pence). Adjusted basic earnings per share before exceptional items, amortisation and tax adjustments are 5.0 pence (2006: 6.3 pence).

Dividend The Board is proposing a final dividend of 1.8 pence per share which is unchanged on the 2006 dividend. The total dividend proposed for the period is therefore 3.15 pence which is flat year-on-year and is covered 1.6 times by the adjusted basic earnings per share (before exceptional items, amortisation and tax adjustments) of 5.0 pence.
Intangible assets Total intangible assets at 31 December 2007 are £3,873 million (2006: £3,895 million) being principally goodwill and acquired intangible assets. Goodwill balances are not amortised but are instead subject to annual impairment testing. Other intangible assets are amortised over their useful lives. An impairment charge of £28 million has been recognised in 2007 relating to CSA as a result of falling revenues and minimum guarantee commitments. £20 million of the impairment relates to goodwill and the remaining £8 million to other intangible assets. The total amortisation charge for the year including the CSA impairment is £84 million (2006: £76 million). The goodwill and intangible asset additions in the year principally relate to the acquisitions of 12 Yard and Jaffe/Braunstein Entertainment and capitalised software development costs.
Cash flow and net debt The cash generated from operations was £286 million (2006: £342 million) and was down on the prior period due to a £64 million decrease in operating profit before exceptional items and amortisation and a working capital outflow of £29 million versus an outflow of £36 million in 2006. The 2007 working capital outflow was primarily due to payments for acquired US films and series. Net cash interest paid on the Group’s net debt position was £62 million. Net tax receipts of £18 million reflect taxation repayments from prior periods more than offsetting payments made relating to the current period. The equity dividends paid comprise the 2006 interim and final dividends of £52 million and £70 million respectively. Expenditure on plant, property, equipment and intangible assets totalled £59 million. This included the investment in our new itv.com site. During the year the Group acquired 12 Yard for an initial net cash consideration of £26 million and a 51% share in Jaffe/Braunstein Entertainment for £3 million. Loans granted to associates and joint ventures include loans to Freesat, ITN and Mammoth. Proceeds from the sale of assets held for sale of £94 million, sale of subsidiaries (net of cash disposed) of £5 million and sale of property, plant and equipment of £4 million are from the disposal of the following assets:
£m
Liverpool Football Club and Athletic Grounds plc 17Arsenal Holdings plc and an option over the Group’s investment in Arsenal Broadband Limited 50MUTV Limited 3Properties 20Transmission assets 4Assets held for sale 94 Independent Television Facilities Centre Limited 5Sale of subsidiaries (net of cash disposed) 5 Properties 4Sale of property, plant and equipment 4Total proceeds 103
The principal movements in net debt in the year are shown in the table below: £m £m
Net debt at 31 December 2006 (734)Cash generated from operations 286Net interest paid (62)Taxation net receipts 18Equity dividends paid (122)Expenditure on property, plant, equipment and intangible assets (59)Acquisitions of subsidiaries (net of cash) (29)Loans granted to associates and joint ventures (10)Proceeds from assets held for sale, property, plant and equipment and sale of subsidiaries 103Other movements (26) 99Defined benefit pension deficit funding (33)Net debt at 31 December 2007 (668)
During the year, a €356 million exchangeable bond and a £200 million Eurobond matured resulting in a combined cash outflow of £441 million.

Pensions The Group’s pension schemes are run independently by the schemes’ trustees. All pension scheme assets are administered separately by the trustees using a number of external fund managers and custodians. Defined contribution scheme arrangements are offered to all new joiners and a choice of investment styles is available to them. Defined benefit schemes are funded on a long term basis with advice from the scheme actuaries. Actuarial valuations of the assets and liabilities of the defined benefit schemes (upon which funding is based) are carried out by the trustees at least every three years. The main defined benefit scheme is divided into three segregated sections: A, B and C. 1. Actuarial valuations Actuarial valuations of sections B and C of the main defined benefit scheme were carried out as at 1 January 2007 and, on the bases adopted by the trustees, both were in surplus with a combined surplus of £23 million or 5% of the liabilities in those sections. An actuarial valuation of section A of the main defined benefit scheme is due as at 1 January 2008 and the trustees and actuary are currently working on that. 2. Deficit funding The Group is currently making deficit funding payments into section A of the main defined benefit scheme. In 2007 an amount of £33 million was paid by group companies as such deficit funding. No deficit funding payments are currently being paid into either section B or C of the main defined benefit scheme. When the actuarial valuation of section A of the main defined benefit scheme has been completed, the Company and trustees will discuss the terms of any recovery plan that may be appropriate, including the amount and timing of any future deficit funding. 3. IAS 19 The Group’s defined contribution schemes gave rise to an operating charge in 2007 of £3 million (2006: £2 million). IAS 19 accounting for the Group’s defined benefit schemes values the annual cost and the assets and liabilities of the schemes on disclosed bases, and includes these values in the Consolidated income statement and Consolidated balance sheet. In 2007 the IAS 19 operating charge for defined benefit schemes was £15 million (2006: £25 million). The excess of the expected return on scheme assets, less the interest cost on liabilities, gave rise to a net financing credit of £18 million (2006: £18 million). The aggregate IAS 19 deficit on defined benefit schemes at 31 December 2007 was £112 million (2006: £285 million). The reduction in the IAS 19 deficit during the year was the result principally of an increase in the discount rate applied upon valuing scheme liabilities. An actuarial gain of £111 million has been recognised as a credit to reserves in the consolidated statement of recognised income and expense. 4. Defined benefit accruals The Group’s defined benefit schemes are closed to new members. There have been historically a variety of accrual rates and normal pensionable ages for various groups of defined benefit scheme members, depending upon the separate schemes that they were originally members of and which are now merged into the Group’s main defined benefit scheme. During 2007, and following a major staff consultation process, the principal accrual factors were standardised and this was the principal reason behind the reduced IAS 19 operating charge referred to above. The changed factors are: • Accrual rate 1⁄60 pa (previously mainly 1⁄50); • Normal pensionable age 63 (previously mainly 60); • Employee contribution rate to rise to 8% (previously mainly 5%). 5. Mortality assumptions A topical issue for defined benefit pension schemes is mortality risk. In 2004 the Trustees of the ITV Pension Scheme conducted an in-depth analysis of the actual mortality experience of the Scheme. That analysis was updated in 2007 with similar results. The mortality factors that the Group has used for its IAS 19 valuation are similar to those used by the Trustees for their valuation work and reflect that analysis of the actual mortality experience. Continued longevity improvement is assumed up to 2020 for current pensioners and up to 2035 for other members. The forecast for life expectancy for a 65 year-old member based upon these factors is:
Men Women
Current pensioners 84.8 87.8Other members 85.8 88.7
The Group and Trustees will continue to review the mortality assumptions based upon both actual experience in the scheme and the guidance of the actuarial profession including the consultation launched by the Pensions Regulator in February 2008. 6. Trustees’ investment strategy The Trustees have been and are continuing to review the investment strategy for the main defined benefit scheme. This has involved the use of derivative instruments to hedge partial exposures to movements in interest rates, inflation and foreign exchange rates and may involve further changes to the asset allocations.
International Financial Reporting Standards The Group has adopted International Financial Reporting Standards as adopted by the EU. The parent Company financial statements continue to be presented under UK GAAP.

Forward look This Business review has detailed how ITV is implementing its Turnaround strategy with the aim of delivering sustainable growth in terms of revenues and earnings. Over the next five years, we aim to achieve stretching targets for each of our core business segments. In Broadcasting, we are targeting a share of commercial impacts across the ITV family of channels in excess of 38.5% in 2012. Over the same period, we are targeting Global Content annual revenues growing to £1.2 billion. We aim to generate £150 million in annual revenues in Online by 2010. Across the Company as a whole, we are seeking to deliver annual compound annual revenue growth of between 3–5% to 2010, then rising to 5% to 2012. The strategy is ambitious, but we believe achievable in a rapidly changing market context. 2008 will see some critical developments for the UK media sector in general and for ITV in particular. The process of digital switchover will get fully underway later this year, following last year’s first pilot. The ITV Border region will start the switch, completing the process in 2009. Although digital switchover is upon us, the pace of digital take up is actually slowing, with over 85% of UK homes already having made the transition. To this extent the digital fragmentation effect on ITV1 viewing in particular should continue to ease. The Ofcom second review of public service broadcasting will run throughout 2008. ITV has set out its plans for modernising its regional news services in 2009, which Ofcom will consider. But there are also much wider questions about sustaining commercial public service broadcasting – across ITV and Channel 4 – in the digital age. The Government has confirmed its own intention to review public service broadcasting, building on Ofcom’s work, and it is possible that this could lead to further broadcasting legislation around the end of this decade. A separate regulatory review of the CRR mechanism is being undertaken by the OFT, working with Ofcom. The review process is expected to run into 2009, allowing any recommendations to take effect for the trading round for 2010. The market has changed markedly since CRR was introduced in 2003. There is more competition between TV and different media, but the value of the mass audience delivered by ITV1 is perhaps greater than ever. ITV will participate actively in the review and looks forward to an outcome which maximises its ability to invest in programming to deliver UK advertisers the mass audiences that they demand. In Broadcasting, we estimate that for the first quarter of 2008 ITV plc’s total television advertising revenue will be up 1.9% at £357 million, with ITV1 advertising down 0.5% at £290 million. The total television market we estimate will be down around 0.7% over the same period. For the first time in several years ITV is outperforming the total television market, reflecting our strong performance on-screen last year and into 2008, together with the increasing confidence of advertisers in ITV. Having been created in late 2007, ITV’s new Global Content segment has made promising early progress, both in the UK market and internationally, with a high volume of exciting productions on-screen, in production or being developed. 2008 will also see significant developments in terms of Online, notably the launch of the broadband archive service with BBC Worldwide and Channel 4 and the development of Friends Reunited, building on its success to date. During the year, we also expect to take an active role in the launch of a Freesat service with the BBC and the development of free-to-air high definition television services. In a rapidly changing market of tremendous challenge and opportunity, control and exploitation of content – across UK television, in other territories and via other media – represents the key to the Company’s turnaround.

Consolidated income statement
For the year ended 31 December: Note 2007
£m
2006 Restated
£m
Revenue 2,082 2,181 Operating costs before amortisation of intangible assets and exceptional items (1,771) (1,806) Operating costs – exceptional items 2 (35) (35) Earnings before interest, tax and amortisation (EBITA) 276 340 Amortisation and impairment of intangible assets 7 (84) (76) Total operating costs (1,890) (1,917) Operating profit 192 264 Financing income 200 170 Financing costs (233) (196) Net financing costs (33) (26) Share of profits of joint ventures and associated undertakings 8 2 8 Investment income 1 3 Gain on sale of properties (exceptional items) 2 9 4 Gain on sale and impairment of subsidiaries and investments (exceptional items) 2 17 35 Profit before tax 188 288 Taxation 5 (50) (66) Profit for the year 138 222
Attributable to:
Equity shareholders of the parent company 137 219 Minority interests 1 3 Profit for the year 138 222 Basic earnings per share 3 3.5p 5.5p Diluted earnings per share 3 3.5p 5.4p
Operating exceptional items during the year mainly comprise reimbursements, fines and other costs associated with premium rate services and an onerous contract provision associated with Carlton Screen Advertising (see note 2 for details).

Consolidated balance sheet
At 31 December: Note 2007
£m
2006Restated
£m
Non-current assets Property, plant and equipment 211 193 Intangible assets 7 3,873 3,895 Investments in joint ventures and associated undertakings 8 79 66 Available for sale financial assets 9 10 37 Held to maturity investments 10 100 – Derivative financial instruments 32 3 Distribution rights 7 11 4,312 4,205 Current assets Assets held for sale 59 132 Programme rights and other inventory 440 400 Trade and other receivables due within one year 399 405 Trade and other receivables due after more than one year 8 7 Trade and other receivables 407 412 Derivative financial instruments 4 1 Cash and cash equivalents 10 498 961 1,408 1,906 Current liabilities Borrowings 10 (33) (471) Derivative financial instruments (1) (16) Trade and other payables due within one year (677) (679) Trade and other payables due after more than one year (9) (9) Trade and other payables (686) (688) Current tax liabilities (206) (159) Provisions (27) (9) (953) (1,343) Net current assets 455 563 Non-current liabilities Borrowings 10 (1,263) (1,224) Derivative financial instruments (9) (15) Defined benefit pension deficit 6 (112) (285) Net deferred tax liability 5 (75) (7) Other payables (65) (56) Provisions (4) (18) (1,528) (1,605) Net assets 3,239 3,163 Attributable to equity shareholders of the parent company Share capital 11 389 401 Share premium 11 120 120 Merger and other reserves 11 2,702 2,690 Translation reserve 11 4 (3) Available for sale reserve 11 4 17 Retained earnings 11 14 (69) Total attributable to equity shareholders of the parent company 11 3,233 3,156 Minority interest 11 6 7 Total equity 11 3,239 3,163

Consolidated cash flow statement
2007 2006 For the year ended 31 December: £m £m £m £m
Cash flows from operating activities Operating profit before exceptional items 227 299 Depreciation of property, plant and equipment 35 32 Amortisation and impairment of intangible assets 84 76 Increase in programme rights and other inventory, and distribution rights (36) (10) Decrease/(increase) in receivables 2 (33) Increase in payables 5 7 Movement in working capital (29) (36) Cash generated from operations before exceptional items 317 371 Cash flow relating to operating exceptional items: Operating loss (35) (35) Increase in payables and provisions* 4 6 Cash outflow from exceptional items (31) (29) Cash generated from operations 286 342 Defined benefit pension deficit funding (33) (207) Interest received 44 22 Interest paid on bank and other loans (103) (66) Interest paid on finance leases (3) (3) Investment income received 1 3 Net taxation received/(paid) 18 (50) (76) (301) Net cash flow from operating activities 210 41 Cash flows from investing activities
Acquisition of subsidiary undertakings, net of cash and cash equivalents acquired and debt repaid on acquisition (29) (3)
Proceeds from sale of assets held for sale 94 40 Proceeds from sale of property, plant and equipment 4 – Acquisition of property, plant and equipment (37) (79) Acquisition of intangible assets (22) (4) Acquisition of associates and investments (2) (1) Loans granted to associates and joint ventures (10) – Loans repaid by joint ventures 2 2 Proceeds from sale of subsidiaries 5 – Proceeds from sale of investments and associates – 157 Net cash flow from investing activities 5 112 Cash flows from financing activities Bank and other loans – amounts repaid (441) (13) Bank and other loans – amounts raised – 581 Capital element of finance lease payments (3) (3) Dividends paid to minority interest (2) (8) Share buy-backs – (251) Purchase of own shares via employee benefit trust (11) (31) Purchase of held to maturity investments (100) – Equity dividends paid (122) (128) Net cash (outflow)/inflow from financing activities (679) 147 Net (decrease)/increase in cash and cash equivalents (464) 300 Cash and cash equivalents at 1 January 961 663 Effects of exchange rate changes and fair value movements on cash and cash equivalents 1 (2) Cash and cash equivalents at 31 December 498 961* Includes £2 million (2006: £6 million) relating to expenditure against provisions held in respect of activities which have been previously discontinued.

Consolidated statement of recognised income and expense For the year ended 31 December: Note
2007£m
2006£m
Exchange differences on translation of foreign operations 10 2 (2)Revaluation of available for sale investments 10 3 4Disposal and impairment transferred from available for sale reserve to income statement 10 (16) (20)Movements in respect of cash flow hedges 10 5 –Actuarial gains and losses on defined benefit pension schemes 5 111 29Taxation on items taken directly to equity 4 (47) (4)Net income recognised directly in equity 58 7Profit for the year 138 222Total recognised income and expense for the year 196 229 Attributable to: Equity shareholders of the parent company 10 195 226 Minority interests 10 1 3Total recognised income and expense for the year 10 196 229

Notes to the accounts 1 Operating segmental information Management has determined the reportable segments based on the reports reviewed by the Management Committee. The Management Committee comprises the executive directors. The Management Committee considers the business primarily from a product perspective. The reportable segments are therefore Broadcasting, Global Content, Online and Other. All of the segments reported meet the quantitative thresholds required by IFRS 8. Broadcasting is responsible for commissioning and scheduling programmes on the ITV channels, marketing and programme publicity. It derives its revenue primarily from the sale of advertising airtime and sponsorship. Other sources of revenue are from premium rate services and the digital terrestrial multiplex SDN. The Broadcasting segment also includes the investments in SMG plc. Global Content derives its revenue primarily from ITV Productions in the UK (a commercial production company) and the businesses in ITV Worldwide. A proportion of revenue is generated internally via programme sales to the Broadcasting segment. ITV Worldwide is made up of Granada International, Granada Ventures and international production centres in America, Germany and Australia. Granada International sells programming worldwide. Granada Ventures is a distributor of DVD entertainment in the UK and exploits merchandising and licensing worldwide. Online derives its revenue from two main areas: broadband and mobile. Broadband includes itvlocal.com, itv.com and Friends Reunited. Mobile manages ITV’s mobile portal and arranges distribution of ITV’s channels and content on mobile networks. Other comprises the Group’s 100% interest in Carlton Screen Advertising, which sells cinema screen advertising in the UK, and its 50% interest in Screenvision, which operates cinema screen advertising businesses in continental Europe and the United States. The segment information provided to the Management Committee for the reportable segments for the years ended 31 December 2007 and 31 December 2006 is as follows:
Broadcasting Global Content Online Other Consolidated
2007
£m 2006
£m 2007
£m 2006
£m2007
£m2006
£m2007
£m2006
£m 2007
£m2006
£m
Total segment revenue 1,750 1,801 564 632 33 23 67 80 2,414 2,536Intersegment revenue (12) (4) (320) (351) – – – – (332) (355)Revenue from external customers 1,738 1,797 244 281 33 23 67 80 2,082 2,181EBITA before exceptional items 244 296 90 88 (12) 1 (11) (10) 311 375Share of profit/(loss) from joint ventures and associated undertakings (2) 3 – – 2 2 2 3 2 8Total segment assets 3,934 3,948 590 528 419 418 84 120 5,027 5,014Total assets includes: Investments in associates and joint ventures 12 7 4 – 2 – 61 59 79 66Additions to non-current assets (other than financial instruments) 46 33 68 24 8 21 1 1 123 79Total segment liabilities (389) (381) (226) (242) (74) (64) (18) (11) (707) (698)
Sales between segments are carried out at arm’s length. The revenue from external parties reported to the Management Committee is measured in a manner consistent with the income statement. Income statement and balance sheet allocations between reportable segments are performed on a consistent basis with the exception of pension costs, which are allocated, and pension assets and liabilities, which are not. This reflects the basis of reporting to the Management Committee. The Management Committee assesses the performance of the reportable segments based on a measure of EBITA before exceptional items. This measurement basis excludes the effect of non-recurring income and expenditure. Amortisation, investment income and share of profits of joint ventures and associates are also excluded as they are not reflective of the underlying business. Net financing costs are not allocated to segments as this type of activity is driven by the central treasury and taxation functions, which manage the cash and taxation position of the Group.

1 Operating segmental information continued A reconciliation of EBITA before exceptional items to profit before tax is provided as follows:
2007
£m2006
£m
EBITA before exceptional items 311 375Exceptional items (35) (35)Amortisation and impairment of intangible assets (84) (76)Net financing costs (33) (26)Share of profits of joint ventures and associated undertakings 2 8Investment income 1 3Gain on sale of properties (exceptional items) 9 4Gain on sale and impairment of subsidiaries and investments (exceptional items) 17 35Profit before tax 188 288
The amounts provided to the Management Committee with respect to total assets are measured in a manner consistent with that of the financial statements. These assets are allocated based on the operations of the segment . Reportable segments’ assets are reconciled to total assets as follows:
2007
£m2006
£m
Segment assets 5,027 5,014Unallocated: Held to maturity investments 100 –Assets held for sale 59 132Derivative financial instruments 36 4Cash and cash equivalents 498 961Total assets per the balance sheet 5,720 6,111
The amounts provided to the Management Committee with respect to total liabilities are measured in a manner consistent with that of the financial statements. These liabilities are allocated based on the operations of the segment. Reportable segments’ liabilities are reconciled to total liabilities as follows:
2007
£m2006
£m
Segment liabilities 707 698Unallocated: Interest accruals 23 20Derivative financial instruments 10 31Borrowings 1,296 1,695Current tax liabilities 206 159Net deferred tax liability 75 7Dividends 52 53Defined pension deficit 112 285Total liabilities per the balance sheet 2,481 2,948
The Group’s principal operations are in the United Kingdom. Its revenue from external customers in the United Kingdom is £1,929 million (2006: £2,012 million), and the total revenue from external customers in other countries is £153 million (2006: £169 million). The total of non-current assets other than financial instruments, deferred tax assets, and employment benefit assets (there are no rights arising under insurance contracts) located in the UK is £4,279 million (2006: £4,204 million), and the total of these non-current assets located in other countries is £1 million (2006: £1 million). Revenues of approximately £382 million (2006: £365 million), £258 million (2006: £270 million) and £250 million (2006: £234 million) are derived from three external customers. The Group’s major customers are all media buying agencies. These revenues are attributable to the Broadcasting, Online and Other segments and are from the only customers which individually represent over 10% of the Group’s revenues.
2 Exceptional items
2007
£m
2006 Restated
£m
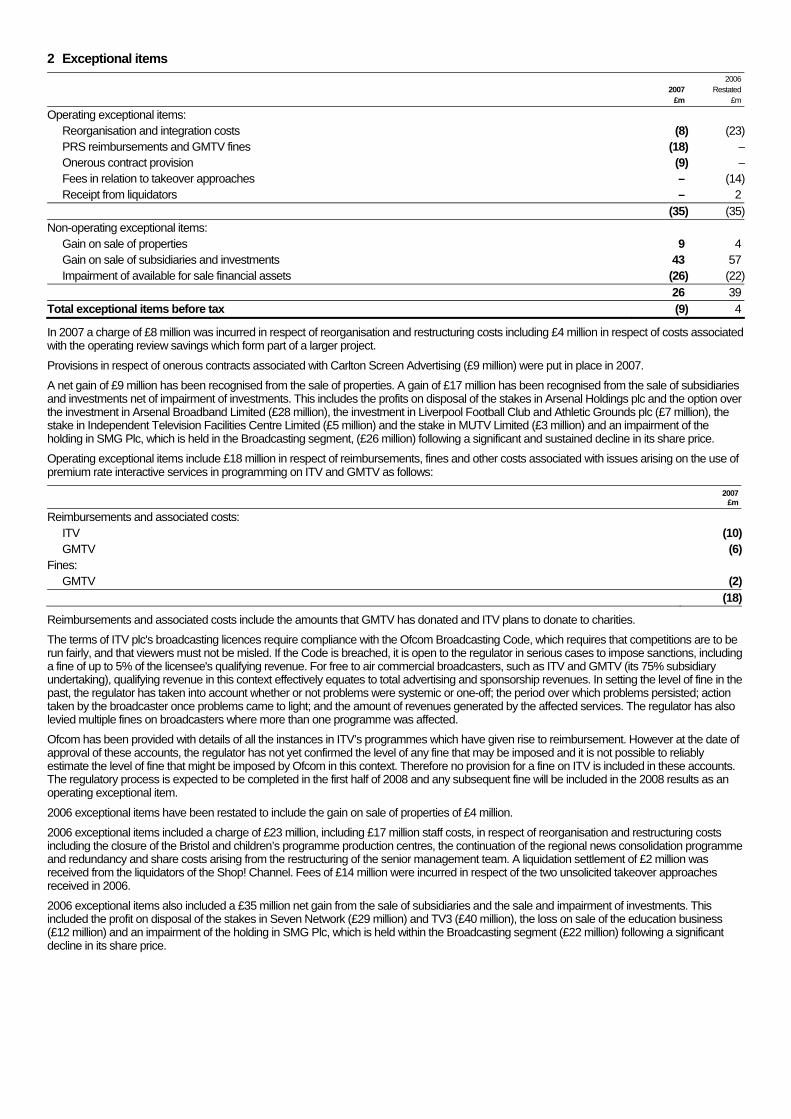
Operating exceptional items: Reorganisation and integration costs (8) (23) PRS reimbursements and GMTV fines (18) – Onerous contract provision (9) – Fees in relation to takeover approaches – (14) Receipt from liquidators – 2 (35) (35)Non-operating exceptional items: Gain on sale of properties 9 4 Gain on sale of subsidiaries and investments 43 57 Impairment of available for sale financial assets (26) (22) 26 39Total exceptional items before tax (9) 4
In 2007 a charge of £8 million was incurred in respect of reorganisation and restructuring costs including £4 million in respect of costs associated with the operating review savings which form part of a larger project.
Provisions in respect of onerous contracts associated with Carlton Screen Advertising (£9 million) were put in place in 2007. A net gain of £9 million has been recognised from the sale of properties. A gain of £17 million has been recognised from the sale of subsidiaries and investments net of impairment of investments. This includes the profits on disposal of the stakes in Arsenal Holdings plc and the option over the investment in Arsenal Broadband Limited (£28 million), the investment in Liverpool Football Club and Athletic Grounds plc (£7 million), the stake in Independent Television Facilities Centre Limited (£5 million) and the stake in MUTV Limited (£3 million) and an impairment of the holding in SMG Plc, which is held in the Broadcasting segment, (£26 million) following a significant and sustained decline in its share price. Operating exceptional items include £18 million in respect of reimbursements, fines and other costs associated with issues arising on the use of premium rate interactive services in programming on ITV and GMTV as follows:
2007£m
Reimbursements and associated costs: ITV (10) GMTV (6)Fines: GMTV (2) (18)
Reimbursements and associated costs include the amounts that GMTV has donated and ITV plans to donate to charities. The terms of ITV plc's broadcasting licences require compliance with the Ofcom Broadcasting Code, which requires that competitions are to be run fairly, and that viewers must not be misled. If the Code is breached, it is open to the regulator in serious cases to impose sanctions, including a fine of up to 5% of the licensee's qualifying revenue. For free to air commercial broadcasters, such as ITV and GMTV (its 75% subsidiary undertaking), qualifying revenue in this context effectively equates to total advertising and sponsorship revenues. In setting the level of fine in the past, the regulator has taken into account whether or not problems were systemic or one-off; the period over which problems persisted; action taken by the broadcaster once problems came to light; and the amount of revenues generated by the affected services. The regulator has also levied multiple fines on broadcasters where more than one programme was affected. Ofcom has been provided with details of all the instances in ITV’s programmes which have given rise to reimbursement. However at the date of approval of these accounts, the regulator has not yet confirmed the level of any fine that may be imposed and it is not possible to reliably estimate the level of fine that might be imposed by Ofcom in this context. Therefore no provision for a fine on ITV is included in these accounts. The regulatory process is expected to be completed in the first half of 2008 and any subsequent fine will be included in the 2008 results as an operating exceptional item.
2006 exceptional items have been restated to include the gain on sale of properties of £4 million. 2006 exceptional items included a charge of £23 million, including £17 million staff costs, in respect of reorganisation and restructuring costs including the closure of the Bristol and children’s programme production centres, the continuation of the regional news consolidation programme and redundancy and share costs arising from the restructuring of the senior management team. A liquidation settlement of £2 million was received from the liquidators of the Shop! Channel. Fees of £14 million were incurred in respect of the two unsolicited takeover approaches received in 2006. 2006 exceptional items also included a £35 million net gain from the sale of subsidiaries and the sale and impairment of investments. This included the profit on disposal of the stakes in Seven Network (£29 million) and TV3 (£40 million), the loss on sale of the education business (£12 million) and an impairment of the holding in SMG Plc, which is held within the Broadcasting segment (£22 million) following a significant decline in its share price.

3 Earnings per share
2007 2006
RestatedBasic
£m Diluted
£m Basic
£mDiluted
£m
Profit for the year attributable to equity shareholders of the parent company 137 137 219 219Exceptional items (including related tax effect of a credit of £6 million, 2006: expense of £2 million) 3 3 (2) (2)Profit for the year before exceptional items 140 140 217 217Amortisation and impairment of intangible assets (including related tax credit of £19 million, 2006: £17 million) 65 65 59 59Prior period tax adjustments (11) (11) (36) (36)Other tax adjustments – – 12 12Profit for the year before exceptional items, amortisation and impairment of intangible assets and prior period tax adjustments 194 194 252 252Weighted average number of ordinary shares in issue – million 3,874 3,874 4,017 4,017Dilution impact of share options – million – 23 – 34 3,874 3,897 4,017 4,051 Earnings per ordinary share 3.5p 3.5p 5.5p 5.4pAdjusted earnings per ordinary share Basic earnings per ordinary share 3.5p 3.5p 5.5p 5.4pAdd: Loss/(profit) per ordinary share on exceptional items 0.1p 0.1p (0.1)p (0.1)pEarnings per ordinary share before exceptional items 3.6p 3.6p 5.4p 5.3pAdd: Loss per ordinary share on amortisation and impairment of intangible assets 1.7p 1.7p 1.5p 1.5pSubtract: Profit per ordinary share on prior period tax adjustments (0.3)p (0.3)p (0.9)p (0.9)pAdd: Loss per ordinary share on other tax adjustments – – 0.3p 0.3pEarnings per ordinary share for the year before exceptional items, amortisation and impairment of intangible assets and prior period tax adjustments 5.0p 5.0p 6.3p 6.2p
An adjusted earnings per share figure has been disclosed because in the view of the directors this gives a fairer reflection of the results of the underlying business. The 2006 adjusted earnings per share figures have been restated to exclude the gain on sale of properties of £4 million to reflect more fairly the underlying business performance.
4 Dividends Dividends declared and recognised through equity in the year were:
2007
£m2006
£m
Equity shares: Final 2005 dividend of 1.8 pence per share – 74 Interim 2006 dividend of 1.35 pence per share – 53 Final 2006 dividend of 1.8 pence per share 70 – Interim 2007 dividend of 1.35 pence per share 52 – 122 127
A final dividend of 1.8 pence per share, totalling £70 million, has been proposed after the balance sheet date in respect of the year ended 31 December 2007 (2006: 1.8 pence per share, totalling £70 million). As is required by IAS 10 (Events after the balance sheet date) this amount has not been provided for at the balance sheet date.

5 Taxation Recognised in the income statement:
2007
£m2006
£m
Current tax expense: Current tax before exceptional items (58) (37) Current tax credit/(expense) on exceptional items 3 (2) (55) (39) Adjustment for prior periods 25 48 (30) 9Deferred tax: Origination and reversal of temporary differences (9) (63) Deferred tax credit on exceptional items 3 – Adjustment for prior periods (14) (12) (20) (75)Total taxation expense in the income statement (50) (66)
Reconciliation of taxation expense:
2007
£m2006
£m
Profit before tax 188 288Taxation expense at UK corporation tax rate of 30% (2006: 30%) (56) (86)Non-taxable/non-deductible exceptional items 3 (2)Non-taxable income/non-deductible expenses (7) (7)Effect of tax losses utilised 4 4Over provision in prior periods 11 36Impact of tax rate change 4 –Other (9) (11) (50) (66)
In the year ended 31 December 2007 the effective tax rate on profits is lower (2006: lower) than the standard rate of UK corporation tax primarily as a result of adjustments in respect of prior periods due to progress in the agreement with revenue authorities of prior periods’ tax liabilities (2006: adjustments in respect of prior periods due to progress in the agreement with revenue authorities of prior periods’ tax liabilities). The underlying tax rate on profits, after adjusting for the irregular tax effects caused by issues such as exceptional items, impairments, joint ventures and associates and adjustments in respect of prior periods, is 31% (2006: 30%). The current tax expense for the prior year is reduced primarily as a consequence of the reversal of temporary differences on which deferred tax assets previously were recognised relating to pension scheme deficits and funding payments. A tax expense totalling £47 million (2006: expense of £4 million) has been recognised directly in equity representing a current tax credit of £nil (2006: credit of £2 million) and a deferred tax expense of £47 million (2006: expense of £6 million).
Deferred tax assets and liabilities recognised and their movements are:
At 1 January
2007£m
Business combinations
£m
Recognised in the income
statement £m
Recognised in equity
£m
Transfer to assets held
for sale£m
At 31 December
2007£m
Property, plant and equipment (4) – (9) – – (13)Intangible assets (139) (1) 24 3 – (113)Programme rights 7 – (4) – – 3Pension scheme deficits 86 – (21) (34) – 31Pensions funding payments 21 – (10) – – 11Interest-bearing loans and borrowings, and derivatives (4) – 2 – – (2)Share-based payments 26 – (6) (16) – 4Unremitted earnings of subsidiaries, associates and joint ventures (3) – 1 – – (2)Other 3 – 3 – – 6 (7) (1) (20) (47) – (75)

5 Taxation continued At
1 January2006
£m
Business combinations
£m
Recognised in the income
statement £m
Recognised in equity
£m
Business sale£m
At 31 December
2006£m
Property, plant and equipment (3) – (2) – 1 (4)Intangible assets (155) (1) 17 – – (139)Programme rights 5 – 2 – – 7Pension scheme deficits 160 – (65) (9) – 86Pensions funding payments 29 – (8) – – 21Interest-bearing loans and borrowings, and derivatives 3 – (7) – – (4)Share-based payments 32 – (9) 3 – 26Unremitted earnings of subsidiaries, associates and joint ventures – – (3) – – (3)Other 3 – – – – 3 74 (1) (75) (6) 1 (7)
The amount of the deferred tax liability at 31 December 2007 has been reduced by £6 million as a consequence of the re-statement of the liability to the reduced, broadly 28%, rate at which the liability is expected to reverse as a consequence of changes in the UK Finance Act 2007. Of this benefit £4 million has been taken through the income statement and net £2 million through equity in accordance with IAS 12. At 31 December 2007 total deferred tax assets are £55 million (2006: £143 million) and total deferred tax liabilities are £130 million (2006: £150 million). Deferred tax assets estimated at £0.6 billion and £0.1 billion (2006: £0.6 billion and £0.1 billion) in respect of capital losses and loan relationship deficits respectively, have not been recognised due to uncertainties as to amount and whether gain or income will arise in the appropriate form and relevant territory against which such losses could be utilised. For the same reasons, deferred tax assets in respect of overseas losses of £10 million (2006: £10 million) which time expire between 2017 and 2026 have not been recognised.
6 Pension schemes The Group operates both defined benefit and defined contribution pension schemes. The pension scheme assets are held in a separate trustee-administered fund to meet long-term pension liabilities to past and present employees. The trustees of the fund are required to act in the best interest of the fund’s beneficiaries. The appointment of trustees to the fund is determined by the scheme’s trust documentation.
Defined contribution schemes Total contributions recognised as an expense in relation to defined contribution schemes during 2007 were £3 million (2006: £2 million).
Defined benefit schemes The Group provides retirement benefits to some of its former and approximately 30% of current monthly paid employees through defined benefit schemes. The Group’s main scheme was formed from a merger of a number of schemes on 31 January 2006. The level of retirement benefit is principally based on basic salary at retirement. During 2007, the Group made significant changes to the scheme benefit structure in respect of future service benefits. These changes involved a combination of an increase in normal retirement age, a reduction in the rate of benefit accrual and increased member contributions. Members were given the option to elect for alternative benefits with an equivalent adjustment to member contributions. Benefits accrued up to the date of the change were unaffected. The liabilities of the defined benefit scheme are measured by discounting the best estimate of future cash flows to be paid out by the scheme using the projected unit method. This amount is reflected in the deficit in the balance sheet. The projected unit method is an accrued benefits valuation method in which the scheme liabilities make allowance for projected earnings. The accumulated benefit obligation is an actuarial measure of the present value of benefits for service already rendered but differs from the projected unit method in that it includes an allowance for early leaver statutory revaluations rather than projected earning increases. At the balance sheet date the accumulated benefit obligation was £2,550 million (2006: £2,580 million). The assets and liabilities of all the Group’s defined benefit pension schemes recognised in the balance sheet at 31 December 2007 under IAS 19 (as explained in detail in this note) were £2,491 million and £2,603 million respectively, resulting in a net deficit in the defined benefit schemes of £112 million. An alternative method of valuation to the projected unit method is a solvency basis, often estimated using the cost of buying out benefits at the balance sheet date with a suitable insurer. This amount represents the amount that would be required to settle the scheme liabilities at the balance sheet date rather than the Group continuing to fund the ongoing liabilities of the scheme. The Group estimates the shortfall in the amount required to settle the scheme’s liabilities at the balance sheet date is £1,100 million (2006: £1,500 million). The statutory funding objective is that the scheme has sufficient and appropriate assets to pay its benefits as they fall due. This is a long term target. Future contributions will always be set at least at the level required to satisfy the statutory funding objective. The general principles adopted by the trustees are that the assumptions used, taken as a whole, will be sufficiently prudent for pensions and benefits already in payment to continue to be paid, and to reflect the commitments which will arise from members’ accrued pension rights. The most recently completed triennial actuarial valuations in respect of the Group’s retirement benefits funds was performed by an independent actuary for the Trustees of the ITV Pension Scheme and was carried out as at 1 January 2005. The Group’s main scheme, formed by merger on 31 January 2006, consists of three sections, A, B and C. The first triennial valuation of section A is due at 1 January 2008. The first triennial valuation of the other sections was completed as at 1 January 2007. The Group will monitor funding levels annually. The levels of ongoing contributions are based on the current service costs and the expected future cash flows of the defined benefit scheme. The Group estimates the present value of the duration of UK scheme liabilities will on average fall due over 16 years.

6 Pension schemes continued The movement in the present value of the defined benefit obligation for these schemes is analysed below:
2007
£m2006
£m
Defined benefit obligation at 1 January 2,657 2,604Current service cost 15 23Curtailment loss – 2Interest cost 134 126Net actuarial (gain)/loss (96) 3Contributions by scheme participants 5 4Benefits paid (112) (105)Defined benefit obligation at 31 December 2,603 2,657
The present value of the defined benefit obligation is analysed between wholly unfunded and funded defined benefit schemes in the table below:
2007
£m2006
£m
Defined benefit obligation in respect of funded schemes 2,567 2,619Defined benefit obligation in respect of wholly unfunded schemes 36 38Total defined benefit obligation 2,603 2,657
The movement in the fair value of the defined benefit scheme assets is analysed below:
2007
£m2006
£m
Fair value of assets at 1 January 2,372 2,072Expected return on assets 152 144Net actuarial gain 15 32Employer contributions 59 225Contributions by scheme participants 5 4Benefits paid (112) (105)Fair value of assets at 31 December 2,491 2,372
The assets and liabilities of the scheme are recognised in the balance sheet and shown within non-current liabilities. The total recognised is:
2007 £m
2006 £m
2005£m
2004 £m
Total defined benefit scheme assets 2,491 2,372 2,072 1,685Total defined benefit scheme obligations (2,603) (2,657) (2,604) (2,357)Net amount recognised within the balance sheet (112) (285) (532) (672)
Amounts recognised through the income statement are as follows:
2007
£m2006
£m
Amount charged to operating costs: Current service cost (15) (23) Curtailment loss – (2) (15) (25)Amount credited/(charged) to net financing costs: Expected return on pension scheme assets 152 144 Interest cost (134) (126) 18 18Total credited/(charged) in the income statement 3 (7)
The amounts recognised through the statement of recognised income and expense are:
2007
£m2006
£m
Actuarial gains and (losses): Arising on scheme assets 15 32 Arising on scheme liabilities 96 (3) 111 29
The cumulative amount of actuarial gains and losses recognised through the statement of recognised income and expense since 1 January 2004 is an actuarial gain of £52 million (2006: £59 million loss).

6 Pension schemes continued Included within actuarial gains and losses are experience adjustments as follows:
2007
£m 2006
£m 2005
£m2004
£m
Experience adjustments on scheme assets 15 32 219 56Experience adjustments on scheme liabilities (18) (12) 9 (70)
At 31 December 2007 the scheme assets were invested in a diversified portfolio that consisted primarily of equity and debt securities.
The scheme assets are shown below by major category along with the associated expected rates of return. Expected long
term rate of return
2007 %
Market value 2007
£m
Expected long term rateof return
2006%
Marketvalue2006
£m
Market value of assets – equities and property 7.7 1,284 7.6 1,436Market value of assets – bonds 4.4 – 5.9 1,087 4.5 – 5.2 898Market value of assets – other 5.0 120 5.0 38Total scheme assets 2,491 2,372
The expected return on plan assets is based on market expectations at the beginning of the financial period for returns over the life of the related obligation. Exposure through the different asset classes is obtained through a combination of executing swaps and investing in physical assets. The expected yield on bond investments with fixed interest rates can be derived exactly from their market value. Some of these bond investments are issued by the UK Government. The risk of default on these is very small. The trustees also hold corporate bonds and other fixed interest securities. There is a more significant risk of default on these which is assessed by various rating agencies. The trustees also have a substantial holding of equity investments. The investment return related to these is variable and they are generally considered much “riskier” investments. It is generally accepted that the yield on equity investments will contain a premium (“the equity risk premium”) to compensate investors for the additional risk of holding this type of investment. There is significant uncertainty about the likely size of the risk premium. The expected return for each asset class is weighted based on the target asset allocation for 2008 to develop the expected long term rate of return on assets assumption for the portfolio. The fair value of the scheme assets as a percentage of total scheme assets as at 31 December 2006 and 31 December 2007 and target allocations for 2008 are set out below. The benchmark for 2008 is to hold broadly 55% equities and 45% bonds. The majority of the equities held by the scheme are in international blue chip entities. The aim is to hold a globally diversified portfolio of equities, with a target of broadly one-third of equities being held in the UK and two-thirds of equities held overseas. Within the bond portfolio the aim is to hold 50% of the portfolio in government bonds (gilts) and 50% of the portfolio in corporate bonds and other fixed interest securities. Asset allocation is currently being reviewed by the Trustees.
The actual return on plan assets in the year ended 31 December 2007 was £167 million (2006: £176 million).
Planned
2008 2007 2006
(as a percentage of total scheme assets) Equities and property 55% 52% 61%Bonds 45% 44% 38%Other 0% 4% 1%
The principal assumptions used in the scheme valuations at the balance sheet date were: 2007 2006
Rate of general increase in salaries 4.65% 4.25%Rate of increase in pension payment (LPI 5% pension increases) 3.30% 2.90%Rate of increase to deferred pensions 3.40% 3.00%Discount rate for scheme liabilities 5.70% 5.12%Inflation 3.40% 3.00%
IAS 19 requires that the discount rate used be determined by reference to market yields at the balance sheet date on high quality fixed income investments. The currency and term of these should be consistent with the currency and estimated term of the post-employment obligations. The discount rate has been based on the yield available on AA rated corporate bonds of a term similar to the liabilities. The expected rate of inflation is an important building block for salary growth and pension increase assumption. A rate of inflation is “implied” by the difference between the yields on fixed and index-linked Government bonds. However, differences in demand for these can distort this implied figure. The Bank of England target inflation rate has also been considered in setting this assumption.

6 Pension schemes continued The Group has used PA92 tables with mortality projected to 2020 for pensioner members and to 2035 for non-pensioner members. Using these tables, the assumed life expectations on retirement are:
2007 2007 2006 2006
Retiring today at age 60 65 60 65Males 24.4 19.8 24.4 19.8Females 27.4 22.8 27.4 22.8Retiring in 20 years Males 25.5 20.8 25.5 20.8Females 28.4 23.7 28.4 23.7
The tables above reflect published mortality investigation data in conjunction with the results of investigations into the mortality experience of scheme members. The sensitivities regarding the principal assumptions used to measure the schemes liabilities are set out below. The illustrations consider the single change shown with the other assumptions assumed to be unchanged. In practice, changes in one assumption may be accompanied by offsetting changes in another assumption (although this is not always the case). The Company liability is the difference between the scheme liabilities and the scheme assets. Changes in the assumptions may occur at the same time as changes in the market value of scheme assets. These may or may not offset the change in assumptions. For example, a fall in interest rates will increase the scheme liability, but may also trigger an offsetting increase in the market value so there is no net effect on the company liability. Assumption Change in assumption Impact on scheme liabilities
Discount rate Increase/decrease by 0.5% Decrease/increase by 8%Rate of inflation Increase/decrease by 0.5% Increase/decrease by 7%Rate of salary growth Increase/decrease by 0.5% Increase/decrease by 1%Rate of mortality Increase by 1 year Increase by 3%
Normal contributions into the schemes in 2008 are expected to be in the region of £12 million assuming current contribution rates continue as agreed with the scheme trustees.
7 Intangible assets
Goodwill£m
Brands£m
Customer contracts and relationships
£mLicences
£m
Software development
£m
Film libraries and
other£m
Total£m
Cost At 1 January 2006 3,425 199 336 121 – 78 4,159Acquisition of subsidiaries 18 – 2 – – – 20Internal development – – – – 4 – 4At 31 December 2006 3,443 199 338 121 4 78 4,183Acquisition of subsidiaries 35 – – – – 5 40Internal development – – – – 22 – 22At 31 December 2007 3,478 199 338 121 26 83 4,245Amortisation and impairment At 1 January 2006 – 32 158 11 – 11 212Charge for the year – 18 24 9 – 5 56Impairment charge 20 – – – – – 20At 31 December 2006 20 50 182 20 – 16 288Charge for the year – 18 22 9 1 6 56Impairment charge 20 – 8 – – – 28At 31 December 2007 40 68 212 29 1 22 372Net book value At 31 December 2007 3,438 131 126 92 25 61 3,873At 31 December 2006 3,423 149 156 101 4 62 3,895
In the 2006 annual report software development was included in the film libraries and other category. It has been shown separately above as a result of its increasing significance. Amortisation of intangible assets is shown within operating costs in the income statement. The £28 million impairment charge in 2007 related to the Carlton Screen Advertising cash-generating unit and was a result of structural changes in the cinema advertising market. Of the £28 million, £20 million of the impairment relates to goodwill and £8 million to other intangible assets. In calculating this impairment, growth rates and discount rates consistent with those noted below have been used, and calculations have been made on a value in use basis, using cash flow projections over the next seven years. Carlton Screen Advertising is part of the Other operations segment.

7 Intangible assets continued Impairment tests for cash-generating units containing goodwill The following units have significant carrying amounts of goodwill:
2007
£m2006
£m
Broadcasting 2,707 2,707Global Content 301 267Online 376 375GMTV 54 54CSA – 20 3,438 3,423
The recoverable amount of the cash-generating units is based on value in use calculations. Those calculations use cash flow projections based on estimated operating results for the next seven years. Cash flows in perpetuity are extrapolated using a 2.5% growth rate and are appropriate because these are long-term businesses. The growth rate used is consistent with the long-term average growth rate for the industry. A pre-tax discount rate of 11.9% has been used in discounting the projected cash flows. The key assumptions and the approach to determining the cash flows of the cash-generating units are:
Broadcasting The main assumptions on which the forecast cash flows were based include the television share of advertising market, share of commercial impacts, programme costs and the level of PSB savings. The key assumptions in assessing the recoverable amount of this goodwill are the growth in the total television market and ITV’s share within that market. These assumptions have been determined by using a combination of long term trends, industry forecasts and in-house estimates. It is also assumed that ITV is able to renew its broadcasting licences in 2014. Broadcasting goodwill exceeds its carrying amount by approximately £200 million. In assessing the recoverable amount, ITV’s TV advertising revenues are assumed to have a net present value of £14.8 billion. Goodwill would be equal to its carrying amount if there were a 12% fall in the growth rate assumed in assessing ITV’s TV advertising revenues.
Global Content The main assumptions on which the forecast cash flows were based include turnover growth, share of total network programme budget obtained, and margin growth. These assumptions have been determined by using a combination of extrapolation of historical trends within the business, industry forecasts and in-house estimates of growth rates.
Online The main assumptions on which the forecast cash flows were based include page impressions, unique users, average dwell time for unique users, number of videos streamed and advertising rates. These assumptions have been determined by using a combination of industry forecasts and in-house estimates of growth rates.
GMTV The main assumptions on which the forecast cash flows were based include the television share of advertising market, share of commercial impacts, and programme costs. These assumptions have been determined by using a combination of long term trends, industry forecasts and in-house estimates.
8 Investments in joint ventures and associated undertakings
Joint ventures
£m
Associated undertakings
£mTotal
£m
At 1 January 2006 60 33 93Additions – 1 1Share of attributable profits 5 3 8Disposals – (29) (29)Repayment of loans (1) – (1)Reclassification as assets held for sale (3) – (3)Exchange movement and other (2) (1) (3)At 31 December 2006 59 7 66Additions 4 9 13Share of attributable profits – – –Repayment of loans (1) – (1)Exchange movement and other 1 – 1At 31 December 2007 63 16 79
Of the share of attributable profits of joint ventures £2 million (2006: £nil) was allocated to assets held for sale in line with their balance sheet classification. The £4 million of additions in 2007 includes an investment in Kangaroo, a joint venture with BBC Worldwide and Channel 4 seeking to offer online access to archive programming from the UK’s leading broadcasters.
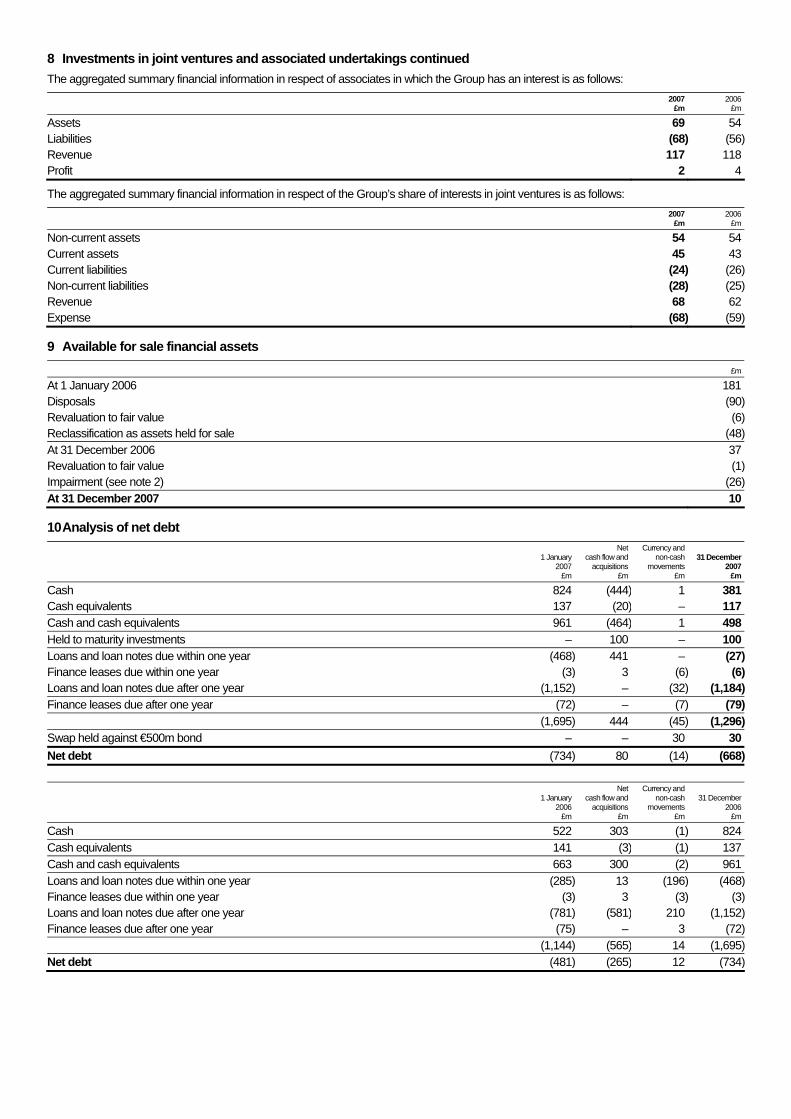
8 Investments in joint ventures and associated undertakings continued The aggregated summary financial information in respect of associates in which the Group has an interest is as follows:
2007
£m2006
£m
Assets 69 54Liabilities (68) (56)Revenue 117 118Profit 2 4
The aggregated summary financial information in respect of the Group’s share of interests in joint ventures is as follows:
2007
£m2006
£m
Non-current assets 54 54Current assets 45 43Current liabilities (24) (26)Non-current liabilities (28) (25)Revenue 68 62Expense (68) (59)
9 Available for sale financial assets £m
At 1 January 2006 181Disposals (90)Revaluation to fair value (6)Reclassification as assets held for sale (48)At 31 December 2006 37Revaluation to fair value (1)Impairment (see note 2) (26)At 31 December 2007 10
10 Analysis of net debt
1 January 2007
£m
Net cash flow and
acquisitions £m
Currency and non-cash
movements£m
31 December2007
£m
Cash 824 (444) 1 381Cash equivalents 137 (20) – 117Cash and cash equivalents 961 (464) 1 498Held to maturity investments – 100 – 100Loans and loan notes due within one year (468) 441 – (27)Finance leases due within one year (3) 3 (6) (6)Loans and loan notes due after one year (1,152) – (32) (1,184)Finance leases due after one year (72) – (7) (79) (1,695) 444 (45) (1,296)Swap held against €500m bond – – 30 30Net debt (734) 80 (14) (668)
1 January 2006
£m
Net cash flow and
acquisitions £m
Currency and non-cash
movements£m
31 December2006
£m
Cash 522 303 (1) 824Cash equivalents 141 (3) (1) 137Cash and cash equivalents 663 300 (2) 961Loans and loan notes due within one year (285) 13 (196) (468)Finance leases due within one year (3) 3 (3) (3)Loans and loan notes due after one year (781) (581) 210 (1,152)Finance leases due after one year (75) – 3 (72) (1,144) (565) 14 (1,695)Net debt (481) (265) 12 (734)

10 Analysis of net debt continued Included within cash equivalents is £71 million (2006: £75 million) the use of which is restricted to meeting finance lease commitments under programme sale and leaseback commitments and gilts of £32 million (2006: £31 million) over which the unfunded pension promises have a charge. In August 2007 ITV purchased a £100 million senior note issued by UBS AG (‘UBS’) under UBS’ Euro Note Programme. The note matures in March 2009 and the investment return is a function of short term interest rates across six major currencies. For the period to 31 December 2007 the return earned was 8.6% on a per annum basis. The note is designated as a held to maturity investment and, although it is the Group’s intention to hold this note to maturity, it can be redeemed for cash before the maturity date, subject to agreement by UBS. At the time of issue of the €500 million bond the Group took out a cross-currency interest rate swap to economically hedge Euro interest rate and foreign exchange exposure. As at 31 December 2007 the currency element of the swap is a £30 million asset (2006: £1 million asset) and this offsets the exchange rate movement of the bond. The interest element of the swap is a £7 million liability (2006: £4 million liability) resulting in an overall net asset total at 31 December 2007 of £23 million (2006: £3 million net liability total).
The €356 million exchangeable bond and £200 million Eurobond matured in 2007. Included within non-cash movements in 2006 is the movement of the £200 million Eurobond into amounts payable in less than one year based on its payment due date.
11 Capital and reserves Attributable to equity shareholders of the parent company
Share capital
£m
Share premium
£m
Merger and other reserves
£m
Translation reserve
£m
Available for sale reserve
£m
Retained earnings
£m Total
£m
Minority interest
£m
Total equity
£m
At 1 January 2006 423 98 2,666 (1) 33 74 3,293 12 3,305Share buy-backs (24) – 24 – – (251) (251) – (251)Shares issued in the year 2 22 – – – – 24 – 24Cancellation of convertible shares (12) – – – – – (12) – (12)Issue of deferred shares 12 – – – – – 12 – 12Total recognised income and expense – – – (2) (16) 244 226 3 229Movements due to share- based compensation
– – – – –
(9) (9) – (9)
Dividends paid to minority interests – – – – – – – (8) (8)Equity dividends – – – – – (127) (127) – (127)At 31 December 2006 401 120 2,690 (3) 17 (69) 3,156 7 3,163Cancellation of deferred shares (12) – 12 – – – – – –Total recognised income and expense – – – 7 (13) 201 195 1 196Movements due to share- based compensation
– – – – – 4
4 – 4
Dividends paid to minority interests – – – – – – – (2) (2)Equity dividends – – – – – (122) (122) – (122)At 31 December 2007 389 120 2,702 4 4 14 3,233 6 3,239
Included within retained earnings is a £18 million (2006: £25 million) deduction for investments held in ITV plc shares by the Group-sponsored employee benefit trusts.
Merger and other reserves Merger and other reserves at 31 December 2007 include merger reserves arising on the Granada/Carlton merger of £2,548 million (2006: £2,548 million), capital reserves of £112 million (2006: £112 million), capital redemption reserves of £36 million (2006: £24 million), revaluation reserves of £6 million (2006: £6 million).
Translation reserve The translation reserve comprises all foreign exchange differences arising on the translation of the accounts of, and investments in, foreign operations. Included within the movement in the year is £5 million related to cash flow hedges (2006: £nil).
Available for sale reserve The available for sale reserve comprises all movements arising on the revaluation and disposal of assets accounted for as available for sale.

12 Basis of preparation The Group accounts consolidate those of ITV plc, (“the Company”), a company domiciled in the United Kingdom and its subsidiaries (together referred to as “the Group”) and the Group’s interests in associates and jointly controlled entities. As required by EU law (IAS Regulation EC 1606/2002) the Group’s accounts have been prepared and approved by the directors in accordance with International Financial Reporting Standards as adopted by the EU (“IFRS”). The accounts are principally prepared on the historical cost basis. Areas where other bases are applied are identified in the accounting policies below except where other bases are applied under the Group’s accounting policies. The Group has adopted IFRS 7 “Financial instruments: Disclosures”, and the complementary amendment to IAS 1 “Presentation of financial statements – Capital disclosures” which introduces new disclosures relating to financial instruments. The impact on the 2006 comparatives has been to reclassify interest rate swaps and forward foreign exchange contracts from accruals and deferred income to derivative financial instruments and to reclassify amounts between financing income and financing costs. IFRS 8 “Operating segments” has been adopted by the Group in 2007. IFRS 8 replaces IAS 14 “Segment reporting”. The new standard requires a “management approach”, under which the segment information is presented on the same basis as that used for internal reporting purposes. This has resulted in an increase in the number of reportable segments presented. In addition, the segments are reported in a manner that is consistent with information provided to the chief operating decision maker. Comparatives for 2006 have been restated. The financial information set out herein does not constitute the Company’s statutory report and accounts for the year ended 31 December 2007. Statutory accounts for 2007 will be delivered to the Registrar of Companies following the Company’s annual general meeting. The auditor has reported on those accounts; their report was unqualified and did not contain statements under 237(2) or (3) of the Companies Act 1985. Copies of the 2007 annual report and accounts will be made available on our website and mailed to shareholders if they have elected to receive hard copies. They will also be available from the registered office of the Company, 200 Gray’s Inn Road, London, WC1X 8HF.