preliminary assessment of the effect of plant...
TRANSCRIPT

PRELIMINARY ASSESSMENT OF THE EFFECT OF PLANT
PROTEASE INHIBITORS ON THE EXPRESSION OF
HETEROLOGOUS GENES IN PLANT CELLS
NASSIM KHALIGHI
FACULTY OF SCIENCE
UNIVERSITI OF MALAYA
KUALA LUMPUR
2011

i
PRELIMINARY ASSESSMENT OF THE EFFECT OF PLANT
PROTEASE INHIBITORS ON THE EXPRESSION OF
HETEROLOGOUS GENES IN PLANT CELLS
NASSIM KHALIGHI
DISSERTATION SUBMITTED IN FULFILMENT OF
THE REQUIREMENT FOR THE DEGREE OF
MASTER OF BIOTECHNOLOGY
INSTITUTE OF BIOLOGICAL SCIENCES
FACULTY OF SCIENCE
UNIVERSITI OF MALAYA
KUALA LUMPUR
2011

ii
UNIVERSITI MALAYA
ORIGINAL LITERARY WORK DECLARATION
Name of Candidate: NASSIM KHALIGHI (I.C/Passport No: E12567019)
Registration/Matric No: SGF080024
Name of Degree: Master of Biotechnology
Title of Project Paper/Research Report/Dissertation/Thesis (“this Work”):
Title
PRELIMINARY ASSESSMENT OF THE EFFECT OF PLANT PROTEASE INHIBITORS ON THE
EXPRESSION OF HETEROLOGOUS GENES IN PLANT CELLS
Field of Study: PLANT MOLECULAR BIOLOGY
I do solemnly and sincerely declare that:
(1) I am the sole author/writer of this Work;
(2) This Work is original;
(3) Any use of any work in which copyright exists was done by way of fair dealing and for
permitted purposes and any excerpt or extract from, or reference to or reproduction of any
copyright work has been disclosed expressly and sufficiently and the title of the Work and its
authorship have been acknowledged in this Work;
(4) I do not have any actual knowledge nor do I ought reasonably to know that the making of this
work constitutes an infringement of any copyright work;
(5) I hereby assign all and every rights in the copyright to this Work to the University of Malaya
(“UM”), who henceforth shall be owner of the copyright in this Work and that any reproduction
or use in any form or by any means whatsoever is prohibited without the written consent of UM
having been first had and obtained;
(6) I am fully aware that if in the course of making this Work I have infringed any copyright
whether intentionally or otherwise, I may be subject to legal action or any other action as may be
determined by UM.
Candidate’s Signature Date
Subscribed and solemnly declared before,
Witness’s Signature Date
Name:
Designation:

iii
ABSTRACT
Despite the successful development of pant-based expression systems for the production
of a wide range of recombinant proteins in recent years, there remain serious limitations
in the final yield accumulation of the foreign protein in the plant cells used. Plant
protease activity represents a significant barrier to efficient and hence economical
recombinant protein production. Inadequate information is available on specific plant
proteases and its role in foreign protein degradation. Some strategies have been reported
recently to overcome endogenous plant protease effects on foreign protein integrity and
activity in plants including the co-expression of recombinant proteases to reduce the
endogenous protease activity. The lack of information in this area suggests that more
studies should be carried out to assess different plant protease inhibitors for the
improvement of the stability of foreign protein production in particular host plants. The
aim of this research was to evaluate the effect of recombinant plant protease inhibitors
on the expression of a cloned heterologous ScFv antibody gene in plant cells. The
recombinant tomato Cathepsin D Inhibitor (CDI) gene fused to a KDEL sequence was
ligated to a previously construcuted recombinant antibody (scFv) gene developed
against toxoplasmosis epitopes (pCTOXO-CDI-KDEL) and then transferred
successfully into Nicotiana tabacum cv. BY-2 cell suspension using Agrobacterium-
mediated transformation method. In addition, the scFv gene was also ligated to a
construct containing only the endoplasmic reticulum retention signal, KDEL,
(pCTOXO-KDEL) and this was also transferred into tobacco cells as a comparison
against CDI-KDEL containing cells. Both constructs contained GUS marker gene. To
assess the effect of the CDI gene in putative transformed tobacco cells GUS
fluorometric assay was performed. Total soluble protein of the tobacco cells was also
analyzed by Bradford protein assay. The tobacco cells carrying the CDI protease
inhibitor gene showed higher TSP levels in comparison with plant cells lacking this

iv
gene. This finding suggests the positive effect of co-expression of the CDI gene on the
expression of scFv anti-toxoplasmosis in tobacco cells. However, quantitative GUS
enzymatic activity expressed in pmol 4-MU/mg protein/min did not show any
significant differences between two constructs in paired t-test (p>0.05). Overall results
suggest that this strategy could be viable for increasing the production of ScFv
antibodies in plant cells.

v
ABSTRAK
Walaupun perkembangan sistem ekspresi berasaskan tumbuhan dalam penghasilan
protin rekombinan beberapa tahun kebelakangan ini telah berjaya,tetapi masih terdapat
halangan untuk memastikan pengumpulan produk akhir yang maksima di dalam sel
tumbuhan yang digunakan. Di antara faktor penghalang yang utama dalam penghasilan
protein rekombinan yang cekap dan produktif adalah aktiviti enzim protease. Walaupun
fungsi sesetengah protein protease dalam degradasi protein asing telah diketahui, namun
maklumat yang ada tidak mencukupi. Beberapa strategi dilaporkan telah digunakan
untuk mengatasi masalah ini termasuklah ekspresi bersama(co-expression) protease
rekombinan untuk mengurangkan aktiviti protease dalaman (endogenous) tumbuhan.
Kurangnya maklumat dalam bidang ini menunjukkan lebih banyak kajian perlu
dijalankan untuk menilai potensi perencat protease tumbuhan (plant protease inhibitor)
yang berbeza bagi meningkatkan pengeluaran/penghasilan protein asing dalam
tumbuhan. Kajian ini bertujuan untuk menilai kesan perencat (inhibitor) rekombinan
protease tumbuhan ke atas pengekspresan klon gen ‘heterologous ScFV’ antibodi dalam
sel tumbuhan. Gabungan antara gen ‘Cathepsin D Inhibitor’ (CDI) daripada tomato
rekombinan dan jujukan KDEL telah dicantumkan ke dalam gen rekombinan antibodi
yang dapat mengecam ‘toxoplasmosis epitope’ (pCTOXO-CDI-KDEL). Fragmen DNA
ini (pCTOXO-CDI-KDEL) seterusnya dipindahkan ke dalam cell suspension Nicotiana
tabacum cv. BY-2 melalui kaedah transformasi berasaskan Agrobacterium. Di samping
itu, gen scFv turut digabungkan ke dalam konstruk (fragmen DNA) yang hanya
mengandungi isyarat pengekalan reticulum endoplasmik, KDEL, (pCTOXO-KDEL)
dan seterusnya dipindahkan ke dalam sel tembakau untuk dijadikan perbandingan
dengan sel yang mengandungi CDI-KDEL. Kedua-dua fragmen DNA ini mempunyai
gen penanda GUS. Ujian fluorometrik GUS dilakukan untuk menganalisa/menilai kesan
gen CDI dalam sel tembakau tersebut. Jumlah protein larut dalam sel tembakau turut

vi
dianalisa menerusi ujian protin Bradford. Sel tembakau yang mengandungi gen ‘CDI
protese inhibitor’ menunjukkan jumlah protein larut yang lebih tinggi berbanding sel
tumbuhan yang tidak mempunyai gen ini. Penemuan ini menunjukkan kemungkinan
wujudnya kesan positif ekspresi bersama gen CDI ke atas pengekspresan scFv anti-
toxoplasmosis dalam sel tembakau. Namun begitu, aktiviti kuantitatif pmol enzim GUS
yang dikira berdasarkan t-berpasangan (p>0.05) dalam unit pmol 4-MU/mg protein/min
di antara kedua-dua DNA tidak menunjukkan perbezaan yang ketara. Secara
keseluruhannya, data daripada eksperimen yang dijalankan menunjukkan petanda
positif keberkesanan kaedah ini dalam meningkatkan pengeluaran antibodi scFv dalam
sel tumbuhan.

vii
ACKNOWLEDGMENT
I would like to take this opportunity to express my sincere appreciation and gratitude to
my supervisor, Prof. Rofina Yasmin Othman for her guidance and support throughout
the course of my research. Particularly, her suggestions, constructive criticisms and
encouragements have been of great value to me not only toward the writing of this
research but also during the course of the study.
Very special thanks to Dr. Yusmin Yusuf for giving invaluable advice and information
which has been of great help in the completion of my project.
This research would not have been completed without the encouragement, patience and
support of my husband, Soleyman Paydar, and not forgetting my parents.
Lastly, I would like to extend my grateful thanks to everyone who has helped me
directly and indirectly in the completion of this study.
viii
TABLE OF CONTENTS
TITLE PAGE……………………………………………………….………...…………i
ORIGINAL LITERARY WORK DECLARATION …………………....…………..ii
ABSTRACT……………………………………………………………...…………….iii
ACKNOWLEDGMENT……………………………………………..……….……....vii
TABLE OF CONTENTS……………………………………………….…..…..……viii
LIST OF FIGURES…………………………………………………….….…...……xiii
LIST OF TABLES………………………………………….….….…………………..xv
ABBREVIATION…………………………………………………………..……...…xvi
CHAPTER 1: INTRODUCTION ................................................................ 1
CHAPTER 2: LITERATURE REVIEW ..................................................... 4
2.1 PRODUCTION OF ANTIBODIES IN VITRO ............................................... 4
2.2 COMPARING DIFFERENT EXPRESSION SYSTEMS ............................... 4
2.2.1 Using plants as an expression system for protein production .................... 6
2.3 FOREIGN PROTEIN ACCUMULATION LEVEL IN PLANTS ................... 9
2.4 PROTEOLYTIC ENZYME ............................................................................. 10
2.5 MINIMIZING PROTEOLYSIS OF HETEROLOGOUS PROTEINS IN
PLANT CELLS AND TISSUES ................................................................................ 12
2.5.1 Targeting of recombinant gene expression in specific plant tissue .......... 12
2.5.2 Targeting of recombinant protein to specific organelle in plant cells ...... 14
2.5.3 Co-expression of protease inhibitors ........................................................ 17
ix
2.6 INTRODUCTION TO TOXOPLASMOSIS AND SCFV GENE .................. 19
2.7 AGROBACTERIUM MEDIATED TRANSFORMATION ........................... 20
2.8 BINARY VECTORS FOR AGROBACTERIUM MEDIATED
TRANSFORMATION ................................................................................................ 21
2.8.1 pCAMBIA Vector ...................................................................................... 21
CHAPTER 3: MATERIALS AND METHODS ....................................... 23
3.1 MATERIALS ................................................................................................... 23
3.1.1 Preparation of plasmid pCANTAB5E and pCAMBIA 1301 ..................... 25
3.1.2 Preparation of plasmid pUC-PI ................................................................ 27
3.1.3 Preparation of plasmid construct pCTOXO-KDEL .................................. 29
3.2 POLYMERASE CHAIN REACTION ............................................................ 29
3.2.1 Colony PCR for pUC-PIs .......................................................................... 29
3.2.2 PCR Confirmation for extracted pUC-PI ................................................. 30
3.2.3 PCR Confirmation for extracted pCTOXO-KDEL ................................... 31
3.2.4 PCR for anti-toxoplasmosis scFv gene ..................................................... 31
3.2.5 PCR for Protease Inhibitor genes (PIs) .................................................... 32
3.3 RESTRICTION ENDONUCLEASE DIGESTION ....................................... 33
3.3.1 Double RE digestion for anti-toxoplasmosis scFv gene ........................... 33
3.3.2 Double RE digestion for Protease Inhibitor genes ................................... 33
3.3.3 Double RE digestion for cloning vector pCAMBIA 1301 ......................... 33
3.3.4 GEL Extraction ......................................................................................... 34
3.4 CONSTRUCTION OF PCAMBIA EXPRESSION VECTORS .................... 34
x
3.4.1 pCTOXO-BBTI construct ......................................................................... 34
3.4.2 pCTOXO-CDI construct ........................................................................... 36
3.4.3 pCTOXO-OCPI construct ......................................................................... 37
3.5 COLONY PCR FOR PCTOXO-PIS CONSTRUCTS .................................... 38
3.6 CONSTRUCTION OF A SECOND PCTOXO-CDI-KDEL CONSTRUCT . 39
3.7 TRANSFORMATION OF CONSTRUCTS INTO A. TUMEFACIENS ...... 41
3.7.1 Preparation of Agrobacterium competent cell .......................................... 41
3.7.2 Agrobacterium heat shock transformation ............................................... 42
3.7.3 Colony PCR for transformed Agrobacterium with plasmid DNA constructs
42
3.8 PLANTS CELL SUSPENSION ...................................................................... 44
3.8.1 Tobacco cell suspension media preparation ............................................. 44
3.8.2 Subculturing of Tobacco cell suspension .................................................. 45
3.9 PREPARATION OF PLANT CELL SUSPENSIONS .................................. 45
3.10 PREPARATION OF AGROBACTERIUM CULTURE ................................ 46
3.11 AGROBACTERIUM-MEDIATED TRANSFORMATION OF PLANT
CELLS ......................................................................................................................... 47
3.11.1 Co-cultivation procedure .......................................................................... 47
3.11.2 Killing Agrobacterium .............................................................................. 48
3.12 ASSAY OF ß-GLUCURONIDASE (GUS) QUANTITATIVE ACTIVITY BY
FLUOROMETRY ....................................................................................................... 48
3.12.1 Preparation of sample, extraction and fluorescence 4-MU quantification
49

xi
3.12.2 Bradford protein determination ................................................................ 51
CHAPTER 4: RESULTS ........................................................................... 55
4.1 PLASMID PREPARATION ........................................................................... 55
4.1.1 Preparation of plasmid pCANTAB5E and pCAMBIA 1301 ..................... 55
4.1.2 Preparation of plasmid pUC-PI ................................................................ 56
4.1.3 Preparation of plasmid construct pCTOXO-KDEL .................................. 60
4.2 PCR FOR ANTI-TOXOPLASMOSIS SCFV AND PROTEASE INHIBITOR
GENES ........................................................................................................................ 62
4.3 DOUBLE RE DIGESTED GENES ................................................................ 63
4.4 CONSTRUCT ANALYSIS .............................................................................. 65
4.4.1 Analysis of pCTOXO-PIs .......................................................................... 65
4.4.2 pCTOXO-CDI-KDEL ................................................................................ 71
4.5 PCR ANALYSIS OF TRANSFORMED AGROBACTERIUM LBA4404
WITH PLASMID CONSTRUCTS ............................................................................. 72
4.6 TARGET SYSTEM .......................................................................................... 74
4.6.1 Tobacco cell suspension culture ............................................................... 74
4.7 QUANTITATIVE GUS FLUOROMETRIC ASSAY ..................................... 76
4.7.1 Bradford assay .......................................................................................... 79
4.8 COMPARISON OF ENZYME ACTIVITY .................................................... 81
CHAPTER 5: DISCUSSION ..................................................................... 84
5.1 PLASMID CONSTRUCT DEVELOPMENT ................................................ 85
5.1.1 Verification of Ligation ............................................................................. 85

xii
5.2 COMPARISON OF TOTAL SOLUBLE PROTEIN ..................................... 87
5.3 COMPARISON OF ENZYME ACTIVITY .................................................... 88
CHAPTER 6: CONCLUSION ................................................................... 90
6.1 FUTURE STUDIES ........................................................................................ 91
REFERENCE: ........................................................................................... 92
APPENDICES .......................................................................................... 101
APPENDIX - A ......................................................................................................... 102
APPENDIX - B ......................................................................................................... 114
APPENDIX - C ......................................................................................................... 115
APPENDIX - D ......................................................................................................... 116
APPENDIX - E ......................................................................................................... 117
APPENDIX - F ......................................................................................................... 119
APPENDIX - G ......................................................................................................... 120
APPENDIX - H ........................................................................................................ 121
APPENDIX - I .......................................................................................................... 122
APPENDIX - J ......................................................................................................... 123
APPENDIX - K ......................................................................................................... 124
APPENDIX - L ......................................................................................................... 125
APPENDIX - M ........................................................................................................ 126

xiii
LIST OF FIGURES
Figure 3.1: pCTOXO-PI construct
Figure 3.2: General Overview of experiments conducted in this research
Figure 3.3: pCTOXO-BBTI construct
Figure 3.4: pCTOXO-CDI construct
Figure 3.5: pCTOXO-OCPI construct
Figure 3.6: Ligation product of pCTOXO-CDI-KDEL
Figure 3.7: pCTOXO-CDI-KDEL construct
Figure 4.1: Plasmid preparations for pCANTAB5E carrying scFv genes
Figure 4.2: Plasmid preparations for pCAMBIA 1301
Figure 4.3: Colony PCR for pUC-PIs carrying PI genes transformed into JM109
Escherichia coli competent cells.
Figure 4.4: Plasmid preparation for pUC57 vector carrying PI genes (pUC-PI) from
transformed Escherichia coli.
Figure 4.5: PCR verification for plasmid pUC57 carrying PI genes after plasmid
preparation.
Figure 4.6: Plasmid preparation for pCTOXO-KDEL plasmid construct.
Figure 4.7: PCR product for pCTOXO-KDEL using scFv-KDEL primers.
Figure 4.8: Purified PCR product of anti-toxoplasmosis scFv genes using scFv primers.
Figure 4.9: Purified PCR product of PI genes using PI primers.
xiv
Figure 4.10: Purified RE digested scFv genes and pCAMBIA 1301
Figure 4.11: Purified RE digested Protease Inhibitor genes
Figure 4.12: Colony PCR for pCTOXO-PIs using scFv primers.
scFv15+PIs+pCAMBIA1301
Figure 4.13: Colony PCR for pCTOXO-PIs using scFv primers.
scFv9+BBTI+pCAMBIA1301
Figure 4.14: Colony PCR for pCTOXO-BBTI using scFv-PI flanking primers.
Figure 4.15: Colony PCR for pCTOXO-CDI using scFv-PI flanking primers.
Figure 4.16: Colony PCR for pCTOXO-OCPI using scFv-PI flanking primers.
Figure 4.17: PCR for ligated plasmid construct pCTOXO- CDI-KDEL using new scFv-
PI primers.
Figure 4.18: Colony PCR for Agrobacterium transformed with pCTOXO- CDI-KDEL
plasmid construct.
Figure 4.19: Colony PCR for Agrobacterium transformed with pCTOXO-KDEL
plasmid construct.
Figure 4.20: Nicotiana tabacum cv. BY-2 cell suspension
Figure 4.21: Comparison of TSP of tobacco cells transformed with pCTOXO- CDI-
KDEL (A1 & A2 colonies) and pCTOXO-KDEL (B1 & B2 colonies).
Figure 4.22: Comparison of the level of GUS Activity of the transformed tobacco cells
with two different plasmid constructs
Figure 5.1: Matching of compatible sticky ends

xv
LIST OF TABLES
Table 3.1: 4-MU Standard Dilutions
Table 3.2: Bradford Standard Measurements
Table 4.1: Number and percentage of surviving and dead tobacco cell suspension
cultures after 14 days of co-cultivation with Agrobacterium carrying plasmid construct
pCTOXO-CDI-KDEL and pCTOXO-KDEL.
Table 4.2: The relative fluorescent intensity of test samples for three replicates of each
colony transformation A1, A2, B1, B2
Table 4.3: Relative Fluorescent Intensity of test samples (pmol)
Table 4.4: The OD values for test samples and protein conc. of samples
Table 4.5: Comparison of 4-MU enzyme activity between A1 vs. B1 and A2 vs. B2
samples. 4-MU enzyme activity expressed in pmol/mg. protein/min for tobacco cells
transformed with pCTOXO- CDI-KDEL (A1 and A2 Agrob colonies) and pCTOXO-
KDEL (B1 and B2 Agrobacterium colonies).

xvi
ABBREVIATION
A: Absorbance
Agrob: Agrobacterium
anti-toxo: anti-toxoplasmosis
BBTI: Bowman–Birk trypsin inhibitor
bp: base pair
BSA: Bovine serum albumin
BY-2: Bright Yellow–2
CaCl2: Calcium chloride
CDI: Cathepsin D Inhibitor
cDNA: Complementary deoxyribonucleic acid
conc: Concentration
cv: Caltivar
DNA: deoxyribonucleic acid
E.coli: Escherichia coli
EDTA: Ethylenediaminetetracetic acid
ER: Endoplasmic reticulum
ETOH: Ethanol
Fab: Fragment antigen binding
xvii
g: Gram
GAB: GUS assay buffer
GEB: GUS extraction buffer
HDEL: His-Asp-Glu-Leu
HIV: human immunodeficiency virus
Kb: Kilobase
KCl: Potassium chloride
KDEL: Lys-ASP-Glu-Leu
l: Liter
LB: Luria-Bertani
M: Molar
M2: Media 2
mAB: Monoclonal antibody
mg: milligram
min: minute
ml: milliliter
mM: Millimolar
MnCl2: Manganese chloride
MOPS: 3-(N-morpholino)propanesulfonic acid
MS: Murashige and Skoog media

xviii
MSO: Murashige and Skooge basal medium
MUG: 4-methylumbelliferyl-ß-D-glucuronide
MW: Molecular weight
Na2CO3: Sodium carbonate
NaOH: Sodium hydroxide
nM: Nanomolar
OCPI: Oryzacystatin protease inhibitor I
OD: Optical density
PCR: polymerase chain reaction
pCTOXO-BBTI: pCAMBIA 1301-scFv anti –Toxo-BBTI
pCTOXO-CDI-KDEL: pCAMBIA 1304-scFv anti –Toxo-CDI-KDEL
pCTOXO-CDI: pCAMBIA 1301-scFv anti –Toxo-CDI
pCTOXO-KDEL: pCAMBIA 1304-scFv anti –Toxo-KDEL
pCTOXO-OCPI: pCAMBIA 1301-scFv anti –Toxo-OCPI
pCTOXO-PI: pCAMBIA 1301-scFv anti –Toxo-Protease inhibitor
pH: Potential hydrogen
PI: Protease inhibitor
pmol: picomole
pUC-PI: pUC57-Protease inhibitor
xix
RE: Restriction endonuclease
RNA: ribonucleic acid
RNAse A: Ribonuclease A
rpm: Revolutions per minute
scFv: Single chain variable fragment
sdH2O: Sterile distilled water
SDS: Sodium dodecyl sulphate
sec: Second
TBE: Tris borate
Ti: Tumor inducing
TOXO: Toxoplasmosis
Tris-Cl: Trisbase-Hydrochloric acid
TSP: Total soluble protein
u: Unit
UV: Ultraviolet
v: Volume
Vir: Virulence
vs: Versus
w: Weight

xx
w/v: Weight over volume
X: Times
2,4-D: 2,4-Dichlorophenoxyacetic acid
4-MU: 4-methylumbelliferone
µ µl: Micro liter
g: Micro gram
µM: Micro molar
˚C: Degree Celsius
%: Percentage

1
CHAPTER 1: INTRODUCTION
The demand of producing different recombinant proteins is increasing in recent years.
For instance production of useful therapeutic recombinant proteins is highly needed in
order to improve the health level of human society. To date, several heterologous
expression systems have been designed for the production of useful therapeutic
recombinant proteins. In most cases, eukaryotic hosts competent in performing complex
posttranslational modifications have been involved. But, plant-based systems compared
favorably with alternative expression platforms, both in terms of quality and cost of
complex therapeutic proteins. Higher plants are used as versatile expression systems for
producing therapeutic foreign proteins. This technology offers unique advantages,
including cost reduction, possibility of bulk production of useful foreign proteins as
well as the range of plant hosts available and the stability of transgenic lines in seeds
that might allow export of transgenic crops (containing, for example, medicinal
compounds) to deprived areas of the world .
One major problem of producing recombinant proteins in higher plants is instability of
produced recombinant proteins. This system presents serious challenges to protein
integrity. That means foreign protein degradation directly impacts on the final yield,
homogeneity and overall quality of the resulting protein product. The instability of
recombinant proteins is due to activity of plant proteases. The proteolytic enzymes in
plant cells, in particular, are often a major hurdle to recombinant protein integrity, both
in planta at the expression stage and in vitro during protein recovery from plant tissues.
Therefore, in plant expression systems proteolytic processing, notably, may
dramatically alter the structural integrity and overall accumulation of recombinant
proteins in plant expression systems.
2
Although several strategies have been considered to minimize proteolysis in plant
protein factories involving the targeting of transgene expression or protein accumulation
to specific tissues or cellular organelles, this problem still needs a lot of researches to
overcome this negative effect on foreign protein final yield.
A recent solution proposed is the co-expression of companion protease inhibitors
interfering with endogenous proteases which are active against specific endogenous
proteases. Recombinant protease inhibitors could prove functional to modulate
proteolytic activities in situ but very few researchers conducted in this area so there is a
need to conduct more investigations to improve this area of research to help improving
the yield and functionality of foreign proteins.
The lack of sufficient information on different plant proteases existence in plants makes
conducting more researches in this area necessary. The Nicotiana tabacum plant as a
very important target system in producing foreign proteins has shown the proteolytic
degradation problem. However many of the proteases responsible for the recombinant
protein degradation in this plant remained unknown.
For obtaining the information on type of proteases which exist in tobacco plant cells one
way is to assess the co-expression of protease inhibitor genes with recombinant protein
gene. The improved level of desired foreign protein translation in plant cells carrying
the suitable companion protease inhibitor can make the production of foreign proteins
more efficient in tobacco cells as a very useful target system.The Cathepsin D inhibitor
gene, Bowman Birk Trypsin I inhibitor and Orysacystatin protease Inhibitor genes were
designed to assess the presence of proteases that can become inactive by the help of co-
expression of these inhibitors in tobacoo cells.
3
In this research, the tomato Cathepsin D Inhibitor gene was ligated to a recombinant
single chain fragment anti-toxiplasmosis antibody (-scFv). The construct was then
transferred and expressed in Nicotiana tabacum cultivar BY-2 cells. In addition, the ER
retention signal, KDEL, ligated to scFv (obtained from previous studies) was transferred
and expressed in tobacco cell suspension in separate experiments to produce putatively
transformed tobacco plant cells carrying scFv gene but lacking CDI protease inhibitor.
The expression of scFv in the presence of the CDI protease inhibitor in plant cells was
investigated and compared to heterologous scFv gene expression in plant cells without
CDI protease inhibitor.
The objective of this research was to assess the effect of plant protease inhibitors on the
expression of heterologous monoclonal antibody scFv gene of anti-toxoplasmosis in
plant cell suspension.
The specific objectives are to develop constructs of scFv-PIs, carry out transformation
experiments and then analyze the resulting putative transformed plant cells in terms of
total soluble protein (TSP) and GUS Enzymatic activity using Bradford protein assay
and GUS Fluorometric Assay.
4
CHAPTER 2: LITERATURE REVIEW
2.1 PRODUCTION OF ANTIBODIES IN VITRO
Today antibodies are applied in the diagnosis of diseases and therapeutic uses, by-
research institutions and pharmaceutical companies (Joosten et al., 2003). The
production of antibodies have increased in quality and quantity in recent years by the
help of recombinant DNA technology, so the expression of a whole antibody gene or a
fragment of it has become achievable in different living organisms’ cells such as
bacteria (Nouaille et al., 2003), mammalian cells (Yazaki et al., 2004) and plant cells.
2.2 COMPARING DIFFERENT EXPRESSION SYSTEMS
The production of heterologous proteins is mostly carried out in prokaryotic systems
such as cultures of bacterial cells (Lu Yinghua et al., 2004). In many cases the
prokaryotic system is preferred because the bacterial cells can be grown rapidly and
high cell densities can be achieved easily, besides the media in this system is cheap (Lu
Yinghua et al., 2004). However, there are some limitations to use of the prokaryotic
systems. Firstly, the lack of post-transcriptional modifications such as phosphorylation,
acylation, and N-and O-linked glycosylation which can affect the recombinant protein
activity (Lu Yinghua et al., 2004), since the ability to perform post translational
modifications does not exist in bacterial expression systems (Jung and Williams, 1997).
Secondly, the heterologous proteins may accumulate into insoluble structures because
the prokaryotic expression system does not have the ability to secrete the protein
product into the extracellular medium, and proteins may remain in structures known as

5
inclusion bodies. Therefore, the downstream processing of heterologous proteins
become very expensive and complicated (Lu Yinghua et al., 2004).
The eukaryotic system was then established to overcome the problem of the prokaryotic
system. One of the popular eukaryotic systems is yeast. The proteins produced in yeast
system can be secreted to the media. The viruses that can affect humans do not exist in
yeasts (Lu Yinghua et al., 2004). Yeast are able to glycosylate the proteins that are
produced in their system and they can multiply rapidly. However, the folding of
manufactured protein is different from the type seen in mammalian cell cultures. The
difference is glycosylation process. Hyper mannosylation is another disadvantage of
yeast system. It means that proteins produced in yeast normally contain extra mannose
added to the basic oligosaccaharide and thus such manufactured proteins are not usually
appropriate for the production of human medicines (Jung and Williams, 1997).
A higher eukaryotic system in protein production process in comparison with yeast cells
are insect cells. This system also has been used for the production of useful proteins. An
example of such expression system is the baculovirus (Rai and Padh, 2001) but, with
some limitations. In baculovirus expression system the proteolytic cleavages in lysine or
arginine rich sequences is ineffective. This deficiency causes imperfect protein folding.
Other disadvantages of this system are expensive media for the production of insect
cells and slow growth of the cells (Lu Yinghua et al., 2004).
The other eukaryotic system in protein production process is mammalian cells. The
mammalian cells are generally used for high value end products. Performing the most
suitable type of post-translational modifications to the protein product is one of the
advantages using this expression system. This benefit of the mammalian cellular
6
expression system makes them appropriate for use in human medication (Rai and Padh,
2001). However, there are some problems associated with the use of this mammalian
cell system. This expression system is very hard to maintain and it is a time consuming
system. The production and maintenance of this system is a very complex task in
comparison with the other biological expression systems and the yield of the protein
product is normally low, so only when other systems are incompatible mammalian cells
are used as the expression system (Rai and Padh, 2001).
2.2.1 Using plants as an expression system for protein production
An attractive host system for production of recombinant proteins such as
biopharmaceuticals is plant-based expression system. Plants offer several important
advantages over other heterologous expression systems. As a eukaryote system, plants
are able to fold and assemble complex proteins correctly and post-translational
modifications like glycosylation can be achieved in plants. The requirement for animal
cells, animal derived culture materials or potentially infectious animals is also
eliminated with applying the plant host system in the production of foreign proteins. An
alternative technique for the production of recombinant proteins is plant cell culture in
bioreactors. The control of production environment is easier in plant cultures in
comparison with whole plants. Besides, the process cycle is shorter and purification
process is simpler and cheaper due to secretion of proteins from plant cells (Doran,
2006).
The first successful animal antibody production was achieved in transgenic tobacco
plants in the late 1980’s (Hiatt et al., 1989). That successful experiment showed
recombinant monoclonal antibodies can be produced in plants as an intact antibody

7
molecule. In that work cDNAs encoding either the heavy chain or light chain of a
catalytic mouse antibody molecule were expressed in the engineered plants. Then, the
plants were cross pollinated. As a result both cDNAs were found to be expressed in the
progeny, and the fully assembled recombinant antibody expressed in plants. Almost 1%
of total soluble protein (TSP) in the plant was found to be comprised of the recombinant
antibody. The antibody molecules produced in plant tissue had the same antigen-
binding activity like the progenitor antibody. Since then, expression of antibody
molecules in plants has been done by several groups for either modification or
improvement of plant characteristics and performance or for large-scale production of
antibodies using plants as bioreactors (Ma et al., 1995). The techniques for the
production of human recombinant proteins in plants have improved a lot and the
techniques have become more efficient. In recent years, the production of monoclonal
antibodies both in the form of full length or antibody fragments preferably has been
done on plant system by the scientific community (Hendy et al,. 1999) instead of using
traditional microbial systems. The large scale production of commercially important
biomolecules can be achieved in plants (Whitelam and Cockburn, 1997).
In general, plant expression systems produce recombinant biomolecules more
efficiently, both in terms of quality and cost of complex therapeutic proteins in
comparison with other expression platforms (Komarnytsky et al., 2006). The range of
plant hosts available and the possibility of bulk production of recombinant therapeutic
proteins and reducing costs are some of the advantages of using plant-based technology.
The export of transgenic plants to deprived areas of the world is also another advantage
of this system. Using stable transgenic lines in seeds containing medicinal compounds is
an example for this benefit (Ma et al., 1995). The heterologous production of clinically
8
useful proteins as therapeutic agents can be achieved in higher plants which represent
versatile expression platforms.
2.2.1.1 Plant cell cultures expression systems
Culturing the specific organs or cells that produce the antibody and either isolate the
antibody from these cells or tissues, or collect it from the culture medium is an
alternative system to whole plants expression systems. A number of different culture
systems have been developed, although most research has focused on cell suspension
cultures. Suspension cells are individual plant cells and small aggregates thereof
growing in liquid medium in a fermenter (Hellwig et al. 2004; Doran 2006). Suspension
cell cultures are usually derived from callus tissue by the disaggregation of friable callus
pieces in shake bottles, and are later scaled up for fermenter-based production.
Recombinant antibody production is achieved by using transgenic explants such as
Nicotiana tabacum to derive the plant cell cultures, or transforming the cells after
disaggregation, usually by co-cultivation with Agrobacterium tumefaciens (Twyman et
al., 2007).
Many foreign proteins have been expressed successfully in suspension cells, including
antibodies, enzymes, cytokines and hormones (Hellwig et al. 2004, Fischer et al. 1999).
Tobacco cultivar Bright Yellow 2 (BY-2) is the most popular source of suspension cells
for molecular farming, since these proliferate rapidly and are easy to transform (Nagata
et al., 1992). Other than tobacco, rice suspension cells have also been used to produce
several antibodies (Torres et al., 1999). Recombinant antibodies expressed in plant cell
suspension cultures may be secreted into the culture supernatant or retained within the
cells. Localization depends on expression construct design and the permeability of the
plant cell wall to the antibody.

9
The inclusion of a C-terminal KDEL sequence results in higher levels of antibody
accumulation in cultured cells because the biochemical environment of the endoplasmic
reticulum favors stable protein folding and assembly while reducing the level of
proteolytic degradation. However, this also makes it necessary to disrupt the cells in
order to isolate the protein, which requires additional processing time and causes the
release of phenolic molecules that interfere with purification and reduce production
yield. Thus, the preferred approach is to secrete the target proteins and capture them
from the culture supernatant or release them from the cells by mild enzymatic digestion.
(Twyman et al., 2007).
2.3 FOREIGN PROTEIN ACCUMULATION LEVEL IN PLANTS
The accumulation level of foreign protein product in plant system is a very challenging
and crucial parameter which affects the economics of protein production. A significant
problem that limits the commercial exploitation of recombinant plant as host system is
low protein yield (Doran, 2006). The accumulation level of most foreign proteins is
much lower than 1% of total soluble protein (TSP) in plant biomass; Commonly, about
0.01–0.1% TSP or less are reported as maximum product concentrations ( Daniell et al.,
2001). The low yield of recombinant protein is usually considered inadequate for
competition with other heterologous protein production systems and it remains as a
major difficulty in this technology (Kusnadi et al., 1997). Therefore, the future
development of this technique is directly affected with improving foreign protein
accumulation in plant systems.
In recent years, there is an increasing recognition that shows overall yield of foreign
proteins in plant cells are crucially determined by protein degradation. At any given
time, the amount of recombinant protein found in plant cells expresses a balance
10
between protein production and protein degradation or loss. As evidence, several
recombinant plant systems have been reported in which there is a lack of correlation
between foreign mRNA transcript levels and foreign protein product concentration
(Richteret al., 2000; Outchkourov et al., 2003). It suggests that foreign protein may be
expressed successfully but subsequently degraded. Therefore, high mRNA levels do not
guarantee high accumulation levels of foreign protein (Doran, 2006).
2.4 PROTEOLYTIC ENZYME
Higher plants are used as versatile expression systems for producing therapeutic foreign
proteins. However, this system presents serious challenges to protein integrity. The
instability of recombinant proteins is due to activity of plant proteases. The well-
documented importance of proteolytic enzymes in plant cells, in particular, is often a
major hurdle to recombinant protein integrity, both in planta at the expression stage and
in vitro during protein recovery from plant tissues (Faye et al., 2005). Foreign protein
degradation in plant expression systems directly affects the final yield, homogeneity and
overall quality of the resulting protein product. Proteolytic processing may dramatically
change the overall accumulation and structural integrity of foreign proteins in plant-
based expression systems (Benchabane et al., 2008).
Proteolytic enzymes, or proteases, contribute to the overall control of metabolic and
transduction pathways by directing the activation or hydrolysis of proteins implicated in
key regulatory processes, or by contributing to the elimination of misfolded proteins and
the selective recycling of amino acids from short-lived proteins (Vierstra, 2003;
Schaller, 2004). For the efficient processing and quality control of proteins, proteolytic

11
enzymes are essential and are a fundamental element in the reaction of cells to changing
environmental conditions (Doran , 2006).
A significant challenge for producing foreign proteins economically in all heterologous
systems, including plants, is countering the effects of protease activity. Loss of
recombinant protein after synthesizing, assembly and, in some cases, glycosylation and
post-translational modification processes represents a considerable waste of
biosynthetic resources in transgenic plant cells. Increasing protein product heterogeneity
and lower consistency are other detrimental consequences of proteolysis that can cause
regulatory problems. Therefore, more difficult and expensive downstream processing is
needed due to the presence of incomplete protein or protein fragments (Stein et al.,
2001).
Degrading abnormal or incorrectly processed proteins is an important role of proteases.
Therefore, the susceptibility of recombinant proteins to protease attack in plant cells
could reflect their improper synthesis or assembly. Folding and quaternary structure of
foreign proteins are affected by differences between plant and animal glycans. This
issue can make plant-derived proteins more susceptible to protease activity than their
animal-derived counterparts (Doran, 2006). Misfolding and lack of proper disulphide
crosslinking in plant-derived proteins can also increase the likelihood of protease attack
(Smith et al., 2002).

12
2.5 MINIMIZING PROTEOLYSIS OF HETEROLOGOUS PROTEINS IN
PLANT CELLS AND TISSUES
Specific organelles or sub-cellular locations within plant cells and tissues may be
associated with proteolytic degradation of recombinant proteins. Plant vacuoles were
identified as a possible site of foreign protein degradation in Arabidopsis thaliana
(Yang et al., 2005) and potato leaves (Outchkourov et al., 2003). Vacuoles contain a
variety of proteases that are active under mildly acidic conditions. Particular cleavage of
glycosylated antibody in tobacco cells were identified to occur in the secretory pathway
between the ER and golgi. The proteases were considered most likely to be responsible
for the cleavage (Sharp et al., 2001). Besides, the production of proteolytic fragments in
several transgenic plant systems has been reported in apoplast or plant cell wall
(Outchkourov et al., 2003; Sharp et al., 2001; Stevens et al., 2000).
2.5.1 Targeting of recombinant gene expression in specific plant tissue
The final yield of foreign protein product and its quality are strongly influenced by
specific tissue in which foreign protein is produced. Because the quantity and quality
(or overall substrate specificity) of plant proteases, notably, differ from one tissue to
another (Schaller, 2004), with a possible differential impact on the integrity of proteins.
An accumulation site with low levels of overall proteolytic activity or with endogenous
protease enzymes with no or little specific activity against accessible peptide bonds in
the protein of interest is desirable in effective foreign protein production.
To date, green leaves have been the destination of choice for several foreign proteins,
given their rapid growth rate, the possibility in some platforms to harvest leaf material

13
more than once over the growing season, and the availability of numerous regulatory
sequences well adapted to transgene expression in the leaf cell environment (Daniell et
al ., 2001). However, high protein synthesis and turnover rates which are due to the
highly active metabolism of leaf tissues may represent a significant hurdle to protein
accumulation in vivo. In particular, increased protease levels in senescing leaves (Kato
et al ., 2004, 2005; Lin and Wu, 2004; Otegui et al ., 2005; Parrott et al ., 2005)
represent a potential drawback in leaf-based production systems (Stevens et al .,2000;
Birch-Machin et al ., 2004).
By contrast with leaf tissues, efficient deposition and post-harvest storage of foreign
proteins have been reported in the seeds and storage organs of several crops. In general,
seeds appear to be a suitable tissue for recombinant protein production (Stoger et al.,
2005). The low abundance of active proteases in seed tissues during dormancy, together
with the, desiccated nature of mature seeds prevent extensive proteolysis and promote
long-term stability of proteins in planta (Fiedler and Conrad, 1995; Stoger et al., 2000).
Seeds have the appropriate molecular environment to promote protein accumulation,
and achieve this through the creation of specialized storage compartments such as
protein bodies and storage vacuoles that are derived from the secretory pathway.
Antibodies expressed in seeds remain stable for at least three years at ambient
temperatures with no detectable loss of activity (Stoger et al., 2005)). Similarly, the
storage roots and tubers of some plants show reduced metabolic activity, and may
represent an interesting solution for foreign protein storage (Artsaenko et al., 1998).

14
2.5.2 Targeting of recombinant protein to specific organelle in plant cells
Organelles have specific, complementary functions in the cell and therefore harbour
their own metabolic machinery, including a protease complement well adapted to their
specific enzymatic and physicochemical environment (Callis, 1995). Not surprisingly,
the recombinant proteins accumulation rate is strongly influenced by targeting of
foreign protein to different organelles using appropriate peptide signals. In practice, the
choice of a suitable cellular destination will also depend on the structural characteristics
of the foreign protein, which will often dictate specific co- or post-translational
modifications essential for adequate activity, stability and/or homogeneity (Faye et al.,
2005).
2.5.2.1 Targeting and retention of recombinant protein in the endoplasmic
reticulum
Proteins carrying a signal peptide for cellular secretion first enter the endoplasmic
reticulum via the ER protein translocation channel (Galili et al., 1998), and then migrate
through this compartment and the golgi apparatus until reaching the extracellular
medium (default pathway) or the vacuole, if a vacuolar sorting signal is found in the
primary sequence. Retention of foreign proteins in this compartment is also achievable
for proteins entering the ER by simple apposition of the tetrapeptide ER retention signal
(K /H)DEL (Michaud et al., 1998) at the C-terminus. The (K/H)DEL motif is a common
ER retrieval signal in eukaryotes, believed to redirect tagged proteins to the ER after
their recognition by a (K/H)DEL receptor complex in the golgi apparatus (Pagny et al.,
2000). Numerous studies have been published illustrating the positive impact of
retaining clinically or industrially useful proteins in the ER compartment of plant cells,
using, in most cases, a (K/H)DEL retention signal (Ma et al., 2003). The inclusion of a
15
C-terminal KDEL sequence results in higher levels of antibody accumulation in
cultured cells because the biochemical environment of the endoplasmic reticulum favors
stable protein folding and assembly while reducing the level of proteolytic degradation
(Twyman et al., 2007). Biologically active mAbs require a number of assembly steps
and posttranslational modifications that are carried out in the endoplasmic reticulum
(ER) (Deneke, J., 1990).
At the biochemical level, the low abundance of proteolytic enzymes and the presence of
molecular chaperones in the ER, together with an oxidizing status favouring disulphide
bond formation, make this organelle a suitable destination for several proteins
susceptible to rapid turnover or showing a complex folding pathway (Nuttall et al.,
2002; Faye et al., 2005).The ER, which constitutes a natural reservoir for some storage
proteins in seed cells (Shewry and Halford, 2002), can physically accommodate high
levels of foreign protein product in planta (Wandelt et al., 1992).
2.5.2.2 Targeting of recombinant protein to the vacuole
There are two different types of vacuole in plant cells: lytic vacuoles, which are rich in
hydrolytic enzymes, so they have an acidic environment; and protein storage vacuoles.
The second type shows a slightly acidic or neutral pH which is in favor of protein
storage (Robinson et al., 2005). Targeting to the vacuole, although not yet fully
understood, is determined by small stretches of amino acids within the protein primary
sequence acting as sorting signals to direct the maturing protein towards the vacuole
(Mackenzie, 2005; Vitale and Hinz, 2005). In general, lytic vacuoles are not considered
as a suitable destination for recombinant proteins in planta, owing to their high
proteolytic content (Goulet and Michaud, 2006). By contrast, protein storage vacuoles

16
present a milder environment compatible with protein accumulation (Stoger et al.,
2005), especially in seeds, where they are most abundant (Park et al., 2004).
2.5.2.3 Targeting of recombinant protein to the chloroplast
The chloroplast, peroxisome and nucleus have been proposed as other cellular
destinations for protein production in plant platforms (Daniell et al., 2002; Hyunjong et
al., 2006). In practice, recombinant proteins may be sent to these organelles by the
inclusion of an appropriate targeting peptide (or localization signal) in the transgene
sequence. Chloroplast transformation offers several advantages over nuclear
transformation, including uniform transgene expression rates, multiple copies of the
transgene in each cell, co-expression of multiple genes from the same construct,
minimal gene silencing and minimal transgene escape in the environment owing to the
maternal inheritance of chloroplast DNA in several species (Daniell et al., 2002). The
chloroplast stroma supports protein post translational modifications, such as
multimerization and disulphide bridge formation (Daniell, 2006), making it a suitable
environment for the expression of proteins not relying on complex modifications, such
as glycosylation, typical of the cell secretory pathway.
Recombinant protein degradation by chloroplast proteases might appear, however, to be
a non-relevant issue in terms of net production yields for some proteins expressed at
very high levels (Daniell, 2006). The proteolysis-labile protein human serum albumin,
for instance, was found at levels reaching 11% of TSP in transplastomic tobacco lines
developed using chloroplast untranslated regions in gene constructs, in sharp contrast
with levels below 0.02% of TSP in lines developed using the commonly employed
Shine–Delgarno regulatory sequence (Fernandez-San Millan et al., 2003).

17
However, there are two disadvantages to the chloroplast system – first, chloroplast
transformation is not a standard procedure and is thus far limited to a relatively small
number of crops (tobacco, tomato, potato, cotton, soybean and most recently lettuce and
cauliflower (Daniell et al. 2005b; Lelivelt et al. 2005; Nugent et al. 2006). Secondly,
they lack much of the eukaryote machinery for posttranslational modification, i.e. they
are unable to synthesize glycan chains. For this reason, they would be suitable for the
production of scFvs but not full-size immunoglobulins.
2.5.3 Co-expression of protease inhibitors
Several strategies have been considered recently to minimize proteolysis in plant protein
factories. Common strategies to overcome unwanted proteolysis in planta involve the
targeting of transgene expression or protein accumulation to specific tissues or cellular
organelles. Approaches involving the grafting of protein-stabilizing fusion domains to
recombinant proteins or the co-expression of companion protease inhibitors interfering
with endogenous proteases have also been proposed recently (Benchabane et al., 2008).
The strategy proposed recently to increase recombinant protein production in planta
involving the use of transgenic hosts with reduced proteolytic capacities is studied in
plant made pharmaceuticals. In theory, protease processes affecting recombinant protein
accumulation could be contained using antisense or RNA silencing strategies
implemented in transgenic host plants (Watson et al., 2005). Alternatively, recombinant
protease inhibitors active against specific endogenous proteases could prove functional
to modulate proteolytic activities in situ (Faye et al., 2005). Recent evidence in the
literature has suggested that the ectopic expression of protease inhibitors may have a
18
positive impact on protein levels in leaves, with negligible effects on growth and
development (Benchabane et al., 2008).
2.5.3.1 Introduction of plant protease inhibitors
Monocot plants such as tobacco, potato, tomato, banana, rice and etc, are used as
alternative systems for production of pharmaceutical proteins however there are several
proteases in these plant cells resulting in low yields of the transgenes. Some of these
proteases are known and have shown negative effects on expression of heterologous
proteins in these plants. Some are known as Trypsin, Chymotrypsin and Cystatine
proteases. The importance of trypsin and Chymotrypsin-like activities in crude protein
extracts of potato (Solanum tuberosum L.) leaves have been confirmed (Rivard et al.,
2006).
The broad-spectrum inhibitor tomato cathepsin D inhibitor (CDI), for instance, has been
shown to yield increased TSP levels (by 20%–35%) in leaves of transgenic potato lines
accumulating this inhibitor in the cytosolic compartment (Michaud et al., 2005).
Likewise, the rice cysteine protease inhibitor oryzacystatin I (OCPI) led to total protein
levels higher than expected in tobacco leaf tissues expressing this inhibitor in the
cytosol (Van der Vyver et al., 2003).Stabilized recombinant antibodies secreted by the
roots of transgenic tobacco plants also expressing (and co-secreting) a Bowman–Birk
trypsin inhibitor (BBTI) from soybean was successfully studied (Komarnytsky et al.,
2006).

19
2.6 INTRODUCTION TO TOXOPLASMOSIS AND SCFV GENE
Toxoplasmosis is a parasitic disease caused by the protozoan Toxoplasma gondii. (Ryan
KJ; Ray CG. 2004). The primary host of Toxoplasma gondii is the cat family. However,
it is able to infect most animals, including humans. Eating infected meat, ingestion of
feces of an infected cat and transmission from mother to fetus are the important ways of
infection to toxoplasmosis in animals. Although cats are often blamed for spreading
toxoplasmosis, contact with raw meat is a more significant source of human infections
in many countries, and faecal contamination of hands is a greater risk factor (Torda A
2001). The parasite can cause encephalitis (inflammation of the brain) and neurologic
diseases and can affect the heart, liver, inner ears and eyes (chorioretinitis). However,
people with a weakened immune system, such as those infected with advanced HIV
disease or those who are pregnant, may become seriously ill, and it can occasionally be
fatal.
The recombinant single chain fragment anti toxiplasmosis scFv antibody is a
recombinant antibody designed to be produced in recombinant host systems. It is
important to understand the mechanisms of action of the antibody in designing clinical
antibodies for production in heterologous expression systems. Binding to antigen is the
primary function of antibodies. Therefore, it can be sufficient to produce the antigen-
binding domain of the antibody molecule alone for the recombinant protein to be active.
The single-chain Fv molecules, which consist of the variable domains of the light and
heavy chains joined by a peptide linker and Fab fragments (fragment antigen- binding)
is an example of this approach (Ma et al., 1995).

20
2.7 AGROBACTERIUM MEDIATED TRANSFORMATION
Agrobacterium tumefaciens is a soil-borne, gram-negative bacterium. This bacteria is
the causative agent of crown gall disease, an economically important disease of a wide
range of plants. Crown-gall formation depends on the presence of a plasmid in
A.tumefaciens known as the Ti (tumour-inducing) plasmid. Part of this plasmid (the T-
DNA region) is actually transferred from the bacterium and into the plant cell, where it
becomes integrated into the genome of the host plant. The T-DNA region of any Ti
plasmid is defined by the presence of the right and left-border sequences. These border
sequences are 24-bp imperfect repeats. Any DNA between the borders will be
transferred into the genome of the host plant (Slater et al., 2003).
The T-DNA contains two types of genes: the oncogenic genes, encoding for enzymes
involved in the synthesis of auxins and cytokinins and responsible for tumour
formation; and the genes encoding for the synthesis of opines, a product resulted from
condensation between amino acids and sugars, which are produced and excreted by the
crown gall cells and consumed by A. tumefaciens as carbon and nitrogen sources.
Outside the T-DNA, are located the genes for the opine catabolism, the genes involved
in the process of T-DNA transfer from the bacterium to the plant cell (Zupan et al.,
1995). Virulent strains of A. tumefaciens contain a large megaplasmid (more than 200
kb) that plays a key role in tumour induction and for this reason it was named Ti
plasmid. The transfer is mediated by the co-operative action of proteins encoded by
genes determined in the Ti plasmid virulence region (vir genes) and in the bacterial
chromosome, chvA, chvB, psvA and att which are involved in the binding of bacteria to
the injured plant cell wall (Slater et al., 2003).The 30 kb virulence (vir) region is a
region organised in six operons that are essential for the T-DNA transfer (virA, virB,
virD, and virG) or for the increasing of transfer efficiency (virC and virE) (Zupan et al.,

21
1995; Jeon et al., 1998). The initial results of the studies on T-DNA transfer process to
plant cells demonstrate three important facts for the practical use of this process in
plants transformation. Firstly, the tumour formation is a transformation process of plant
cells resulted from transfer and integration of T-DNA and the subsequent expression of
T-DNA genes. Secondly, the T-DNA genes are transcribed only in plant cells and do
not play any role during the transfer process. Thirdly, any foreign DNA placed between
the T-DNA borders can be transferred to plant cell, no matter where it comes from.
These well etablished facts, allowed the construction of the first vector and bacterial
strain systems for plant transformations (Opabode 2002). Agrobacterium-mediated gene
transfer into monocotyledonous plants became possible when reproducible and efficient
methodologies were established on rice, banana, corn, wheat, and sugarcane (Opabode,
2006).
2.8 BINARY VECTORS FOR AGROBACTERIUM MEDIATED
TRANSFORMATION
In binary vectors, the transfer apparatus (i.e. the vir genes) and the T-DNA are located
on separate plasmids. As only the border sequences are needed to define the T-DNA
region and the vir region is absent, binary vectors are relatively small (and therefore
easily manipulated) (Slater et al., 2003).
2.8.1 pCAMBIA Vector
The pCAMBIA vector backbone is derived from the pPZP vectors (Hajdukiewicz et al.,
1994). pCAMBIA vectors offer several important and beneficial characteristics.

22
They can be rapidly multiplied in Escherichia coli, therefore their high copy number
produce high DNA yields. For high stability of vector in Agrobacterium pVS1 replicon
was designed in pCAMBIA. They are small in size. Depending on the type of plasmid
pCAMBIA they are usually 7-12kb. In these vectors restriction sites have been designed
for modular plasmid modifications and there are small but adequate poly-linkers for
introducing the DNA of interest. For easy bacterial selection, kanamycin or
choloramphenicol resistant genes have been designed in the backbone of these vectors.
The selection of transformed plants with the pCAMBIA vectors can be carried out with
hygromycin B or kanamycin antibiotics as their resistant genes have been inserted in the
pCAMBIA vector backbone. The presence of gusA reporte genes in the pCAMBIA
vector makes the preliminary assessment of construct translation simple as the inserted
genes in pCAMBIA vector can be fused to the gusA reporter genes. (pCambia vectors,
2010).

23
CHAPTER 3: MATERIALS AND METHODS
3.1 MATERIALS
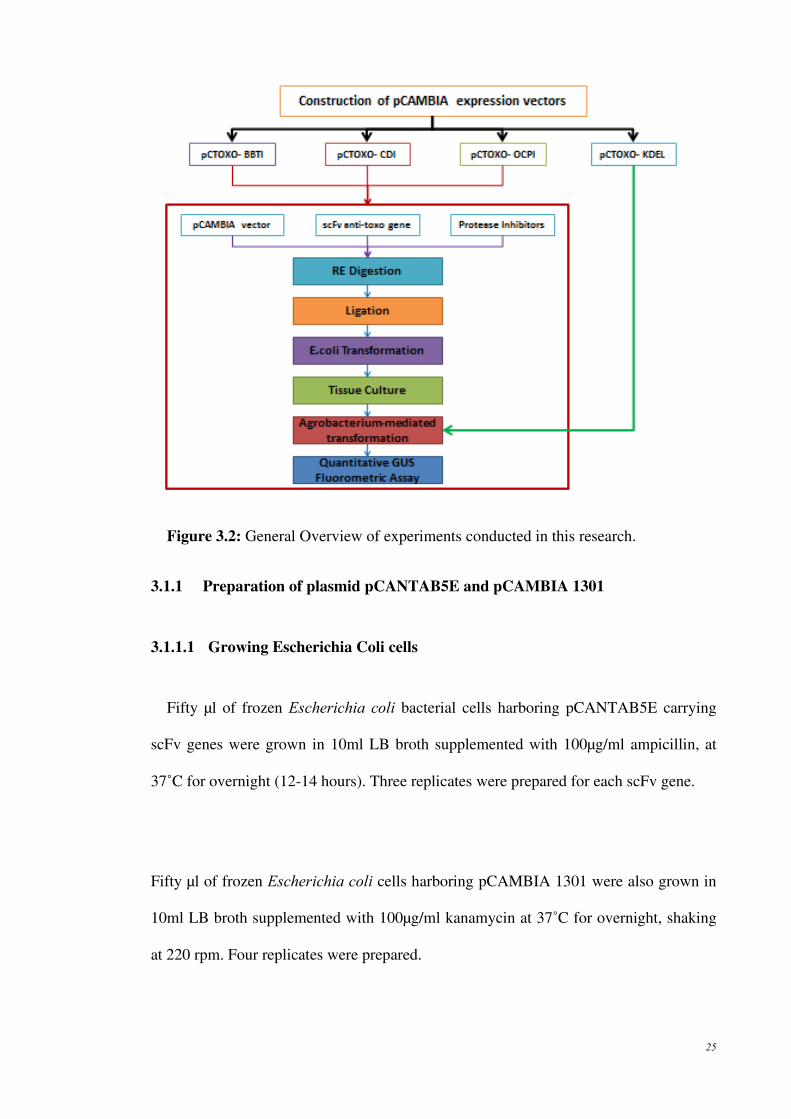
In this research, a plasmid construct that contained an anti-toxoplasmosis scFv gene
(courtesy of YasminLab) (TOXO), a Protease Inhibitor gene (PI) and a gusA gene was
designed and developed as the plasmid pCTOXO-PI. The diagram of the plasmid DNA
construct is shown in Figure 3.1.
.
Figure 3.1: pCTOXO-PI construct
Three scFv genes (scFv3, scFv9 and scFv15) were used in the development of the new
plasmids. The scFv gene was introduced into the phage display vector pCANTAB5E.
The phage display vector pCANTAB5E carrying the scFv gene and the DNA construct
pCTOXO-KDEL were developed in an earlier study conducted by Prof.Dr. Rofina
Yasmin Othman’s laboratory (YasminLab) in University Malaya.

24
Three protease inhibitor genes (PIs) commercially synthesized, including Bowman-
Birk Trypsin Inhibitor (BBTI), Cathepcin D Inhibitor (CDI) and Oryzacystatin Protease
Inhibitor (OCPI). The Three PI genes were synthesized and cloned into pUC57 vector
by the Biosyntech Company. A BamHI sequence was added at the 5’ end of all three PI
genes. Additionally a KDEL gene and Bgl II sequence was added at the 3’ end of the PI
genes.
The plasmid pCAMBIA 1301 was used as the cloning vector for the development of
three desired DNA constructs of pCTOXO-PI. The desired plasmid constructs to be
produced in this research were designated as pCTOXO-BBTI, pCTOXO-CDI and
pCTOXO-OCPI.
The Escherichia coli strain JM109 was obtained from the laboratory to conduct the
bacteria transformation of desired constructs in this research.
The Agrobacterium tumefacien strain LBA4404 was used for the Agrobacterium
mediated transformation of the constructs into plant cells.
The general overview of experiments conducted in this research is shown in Figure 3.2.
25
Figure 3.2: General Overview of experiments conducted in this research.
3.1.1 Preparation of plasmid pCANTAB5E and pCAMBIA 1301
3.1.1.1 Growing Escherichia Coli cells
Fifty µl of frozen Escherichia coli bacterial cells harboring pCANTAB5E carrying
scFv genes were grown in 10ml LB broth supplemented with 100µg/ml ampicillin, at
37˚C for overnight (12-14 hours). Three replicates were prepared for each scFv gene.
Fifty µl of frozen Escherichia coli cells harboring pCAMBIA 1301 were also grown in
10ml LB broth supplemented with 100µg/ml kanamycin at 37˚C for overnight, shaking
at 220 rpm. Four replicates were prepared.
26
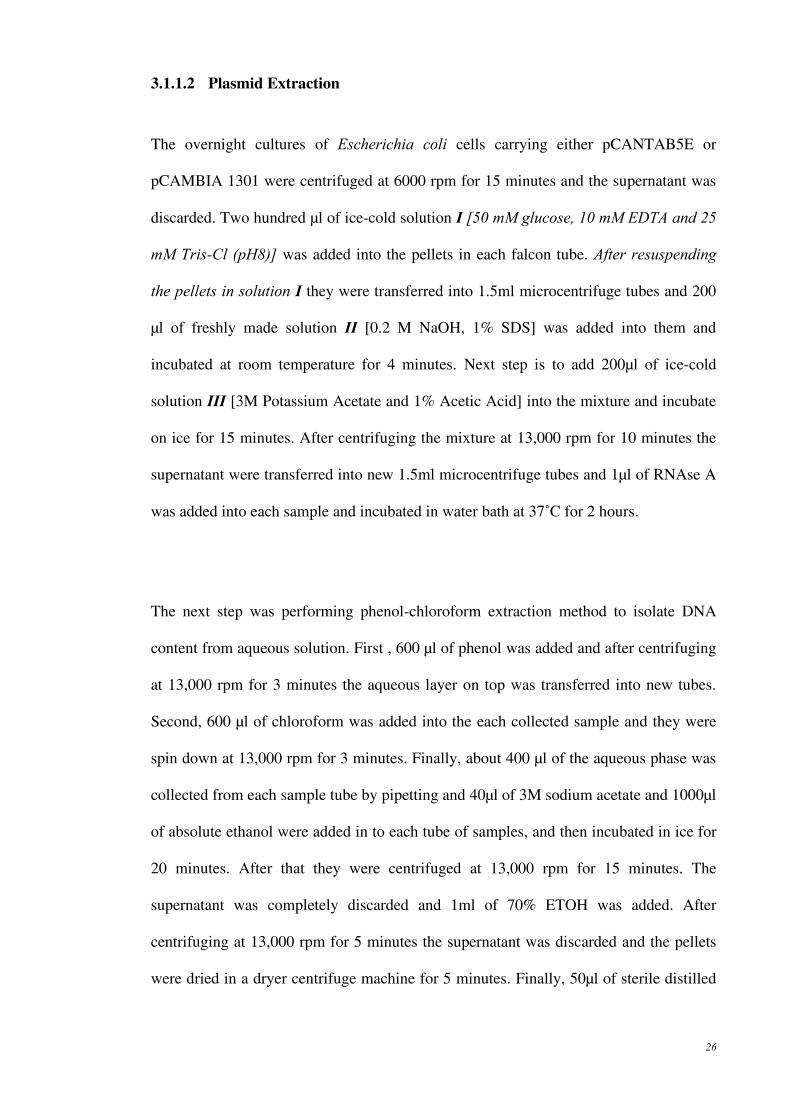
3.1.1.2 Plasmid Extraction
The overnight cultures of Escherichia coli cells carrying either pCANTAB5E or
pCAMBIA 1301 were centrifuged at 6000 rpm for 15 minutes and the supernatant was
discarded. Two hundred µl of ice-cold solution I [50 mM glucose, 10 mM EDTA and 25
mM Tris-Cl (pH8)] was added into the pellets in each falcon tube. After resuspending
the pellets in solution I they were transferred into 1.5ml microcentrifuge tubes and 200
µl of freshly made solution II [0.2 M NaOH, 1% SDS] was added into them and
incubated at room temperature for 4 minutes. Next step is to add 200µl of ice-cold
solution III [3M Potassium Acetate and 1% Acetic Acid] into the mixture and incubate
on ice for 15 minutes. After centrifuging the mixture at 13,000 rpm for 10 minutes the
supernatant were transferred into new 1.5ml microcentrifuge tubes and 1µl of RNAse A
was added into each sample and incubated in water bath at 37˚C for 2 hours.
The next step was performing phenol-chloroform extraction method to isolate DNA
content from aqueous solution. First , 600 µl of phenol was added and after centrifuging
at 13,000 rpm for 3 minutes the aqueous layer on top was transferred into new tubes.
Second, 600 µl of chloroform was added into the each collected sample and they were
spin down at 13,000 rpm for 3 minutes. Finally, about 400 µl of the aqueous phase was
collected from each sample tube by pipetting and 40µl of 3M sodium acetate and 1000µl
of absolute ethanol were added in to each tube of samples, and then incubated in ice for
20 minutes. After that they were centrifuged at 13,000 rpm for 15 minutes. The
supernatant was completely discarded and 1ml of 70% ETOH was added. After
centrifuging at 13,000 rpm for 5 minutes the supernatant was discarded and the pellets
were dried in a dryer centrifuge machine for 5 minutes. Finally, 50µl of sterile distilled

27
water (sdH2O) was added into each microcentrifuge tubes to resuspend the pellet of
plasmids pCANTAB5E and pCAMBIA 1301.
3.1.2 Preparation of plasmid pUC-PI
3.1.2.1 Preparation of competent cells
One hundred µl of JM109 culture was grown in 10ml fresh LB broth at 37˚C for
overnight in water bath shaker, shaking at 220rpm to prepare Escherichia coli
competent cells for the transformation of synthesized plasmid construct of pUC57
carrying PI genes (three pUC-PIs: pUC-BBTI, pUC-CDI, pUC-OCPI). After 12-14
hours of incubation ,500µl of fresh cells from overnight culture was transferred into
10ml fresh LB broth and was shaken for another 1-2 hours at 37˚C to achieve the
optical density 0.5 at the wavelength of 600 nm.
After reaching the desired optical density (0.5) the culture was transferred into 15ml
Falcon tube in sterile condition and then incubated on ice for 30 minutes. The
refrigerated centrifuge machine was adjusted to 4˚C and the cultures were centrifuged at
3000rpm for 5 minutes at 4˚C. The supernatant was removed and 5ml of RF1 solution
[100mM KCl, 50Mm MnCl2,30mM Potassium acetate, 10mM CaCl2 and 15%
Glycerol (pH5.8)] was added into the pellets and incubated on ice for 20 minutes before
centrifuging at 3000 rpm for 5 minutes, 4˚C. After centrifugation the supernatant was
removed and appropriate volume of RF2 solution [10mM MOPS, 10mM KCl, 75mM
CaCl2, and 15% Glycerol (pH6.8)] (depending on the pellet) was added into the cells.
The pellets were dissolved in RF2 solution within 20 minutes by tapping the Falcon
tube while keeping on ice until the pellets were totally dissolved. Finally, 100µl of

28
competent cells were aliquot to 1.5ml microcentrifuge tubes and frozen in liquid
nitrogen prior to storing at -20˚C.
3.1.2.2 Transformation, analysis and extraction of three plasmid DNA, pUC-PI,
in E.coli cells
Three tubes of 100µl frozen JM109 bacteria culture which were prepared as described
in Section 3.1.2.1 were thawed in ice for 30 minutes and 3µl of each plasmid DNA,
pUC-PI, carrying BBTI, CDI and OCPI was added into them separately to insert the
plasmid DNA. The tubes were then heat shocked in a water bath at 42˚C for 45 seconds.
The tubes were then rapidly transferred to an ice bath for 5 minutes. Then, 900µl of LB
broth was added to them and incubated for 2 hours at 37˚C in a spin shaker.
Subsequently, 100µl culture from each tube was spread on LB agar plates supplemented
with 100µg/ml ampicillin and incubated at 37˚C for overnight.
Colony selection for the transformed bacteria with pUC-PI plasmid constructs was
carried out after 12 to 16 hours incubation. This procedure was carried out under sterile
conditions. The single bacteria colonies formed in the plates of the transformed cultures
were selected using a sterile toothpick. The single colonies were cultured onto a gridded
DNA library master plate containing LB agar supplemented with 100µg/ml ampicillin.
The same colonies were also re-suspended in 50µl of sterile distilled water in individual
0.5ml PCR tubes. The DNA library master plate was then incubated at 37˚C for
overnight. The colony suspensions in the tubes of distilled water were boiled at 99˚C for
10 minutes before performing colony confirmation PCR.
29
After performing colony PCR as will be described in Section 3.2.1 the positive
transformed colonies that showed the desired band in gel electrophoresis of colony PCR
products were chosen from library plate prepared as described in Section 3.1.2.2 and
grown in 10ml LB broth supplemented with 100µg/ml ampicillin. After 12 to 14 hours
incubation at 37˚C in a water bath shaker the culture of positive colonies were harvested
by centrifuging at 6000 rpm for 15 minutes. Then, the plasmids were extracted using the
same phenol-chloroform method as described earlier in Section 3.1.1.2.
3.1.3 Preparation of plasmid construct pCTOXO-KDEL
The Escherichia coli culture harboring pCTOXO-KDEL plasmid DNA construct
obtained from previous studies was grown in 10ml fresh LB broth supplemented with
50µg/ml kanamycin at 37˚C for overnight. After 14 hours of incubation the plasmid
DNA pCTOXO-KDEL was extracted using the same technique for plasmid preparation
as described in Section 3.1.1.2.
3.2 POLYMERASE CHAIN REACTION
3.2.1 Colony PCR for pUC-PIs
The transformation of plasmid DNA pUC-PI constructs into grown bacteria cells was
verified by performing the colony PCR method. The colony PCR was carried out by
amplifying a segment of the desired PI genes using the Polymerase Chain Reaction
(PCR) under these conditions:
Initial denaturation 1 min 94˚C

30
Denaturation 1 min 94˚C
Annealing 30 sec 59.3˚C
Elongation 1 min 72˚C
Repeat step 2 additional 34 cycles
Final elongation 5 mins 72˚C
Cooling 10 mins 25˚C
The primers that were used for colonies transformed with pUC-BBTI, pUC-CDI and
pUC-OCPI are listed in below:
BBTI-Forward primer 5’-TGC ATC TAG AGG ATC CTA CAG CGT G-3’
BBTI-Reverse primer 5’-GGA TCC AGA TCT CTA GAG CTC ATC T-3’
CDI-Forward primer 5’-TAT CGG ATC CGG ATC CTA CAA TAT A-3’
CDI-Reverse primer 5’-GGC CCA GAT CTC TAG AGC TCA TCT T-3’.
OCPI-Forward primer 5’-TAT CGG ATC CGG ATC CTA CGC ATT C-3’
OCPI-Reverse primer 5’-GAC GGG CCC AGA TCT CTA GAG CTC A-3’
3.2.2 PCR Confirmation for extracted pUC-PI
The extracted pUC57 plasmids carrying BBTI, CDI and OCPI were subjected to PCR
to confirm back the presence of desired PI genes after plasmid preparation. The primers
used and the PCR condition was the same as colony PCR for pUC-PI plasmid DNA
constructs as described in Section 3.2.1.

31
3.2.3 PCR Confirmation for extracted pCTOXO-KDEL
The extracted pCAMBIA 1304 plasmid carrying scFv116-KDEL gene was subjected
to PCR to confirm back the presence of desired gene after plasmid preparation. The
annealing temperature for scFv116-KDEL gene Polymerase Chain Reaction was 61.2˚C
and the primers used were as follows:
scFv-KDEL Forward
primer
5’-GCA TTA AGC TTC GCA ATT CCT TTA GTT
GTT CC-3’
scFv-KDEL Reverse primer 5’-CGC CAT GGT CTG AGA AAG ATG AGC TCT
AGT CCA GAC GTT-3’
3.2.4 PCR for anti-toxoplasmosis scFv gene
The extracted pCANTAB5E plasmid carrying scFv anti-toxoplasmosis gene as
described in Section 3.1.1.2 was subjected to PCR in order to insert the desired NcoI
and BamHI Restriction Endonuclease sites (RE sites) at 5’ and 3’ end respectively,
before performing RE digestion. The annealing temperature was 57.8˚C.
The primers used to amplify three scFv genes are listed in below:
NcoI- scFv Forward primer 5’-CCA TGG TTG GCT GCA GAG ACA GTG-3’
BamHI-scFv Reverse primer 5’-GGA TCC GTT CCT TTC TAT GC-3’

32
After running PCR, the purification of three anti-toxoplasmosis scFv gene PCR
products was carried out using Megaquick- spin kit from iNtRON Company. The
manufacturer instruction was performed. The PCR products of scFv3, scFv9 and scFv15
genes were purified.
3.2.5 PCR for Protease Inhibitor genes (PIs)
Polymerase Chain Reaction was carried out for three PI genes using one set of
primer. All PI genes contained BamHI Restriction Endonuclease site (RE site) at 5’ end
and KDEL-BglII fragment at 3’ end so the purpose of performing PCR was not
inserting the RE sites. The PCR for PI genes was done to get thicker and brighter band
of amplified PI genes that can be easily observed in electrophoresis GEL. The PCR
products then can be excised from the GEL by performing the gel extraction method
which will be described in Section 3.3.4.
The annealing temperature was 55˚C and the primers used were as follows:
PIs-Forward primer 5’-TAA AAC GAC GGC CAG TGA AT-3’
PIs-Reverse primer 5’-ATG ACC ATG ATT ACG CCA AG-3’
Purification of PIs PCR products was carried out using Megaquick- spin kit from
iNtRON Company. The manufacturer instruction was performed and BBTI, CDI and
OCPI PCR products were purified.

33
3.3 RESTRICTION ENDONUCLEASE DIGESTION
3.3.1 Double RE digestion for anti-toxoplasmosis scFv gene
Double RE digestion for scFv genes was carried out with NcoI and BamHI restriction
endonuclease enzymes (Conc. 5u/µl) from Fermentas Company. Two µl of each enzyme
was added to 5µl of pure PCR product of scFv gene prepared earlier as described in
Section 3.2.4 in the presence of 5µl of 10X Tango Buffer. The recommended buffer for
double RE digestion with these two enzymes was 1X Tango Buffer according to
Fermentas website. Then, 36µl of sterile distilled water was added into each tube to
provide total volume of 50µl RE digestion solution. The tubes were incubated at 37˚C in
a water bath for overnight.
3.3.2 Double RE digestion for Protease Inhibitor genes
For double RE digestion of PI genes 2µl of each BamHI and BglII enzyme (Conc.
5u/µl) from Fermentas company was added to 5µl of pure PCR products of PI genes
prepared earlier as described in Section 3.2.5 in the presence of 10µl of 10X Tango
Buffer. The recommended buffer for double RE digestion with BamHI and BglII
enzymes was 2X Tango Buffer according to Fermentas website. Then, 31µl of sterile
distilled water was added into each tube to provide total volume of 50µl RE digestion
solution. The tubes were incubated at 37˚C in a water bath for overnight.
3.3.3 Double RE digestion for cloning vector pCAMBIA 1301
In order to provide the desired cloning site for the insertion of scFv-PI fragment to
pCAMBIA 1301 backbone, 2µl of each NcoI and BglII RE enzymes (Conc. 5u/µl) from
Fermentas company was added to 5µl of prepared pCAMBIA 1301 plasmid as

34
described in Section 3.1.1 in the presence of 10µl of 10X Tango Buffer. The
recommended buffer was 2X Tango Buffer according to Fermentas website. Then, 31µl
of sterile distilled water was added into each tube to provide 50µl of total solution.
Finally, the tubes were incubated at 37˚C in a water bath for overnight.
3.3.4 GEL Extraction
The digested products of scFv genes, Protease Inhibitor genes and pCAMBIA 1301
vector were loaded in a 1% w/v agarose gel with 1X TBE buffer and run at 90 volts for
1 hour. After achieving the complete separation of digested bands, they were visualized
under long wavelength UV lamp in dark room and the desired fragments of DNA were
excised using a clean scalpel.
The desired DNA fragment was purified from the excised gel using an Agarose Gel
DNA Purification Megaquick spin kit from iNtRON Company. The manufacturer
instruction was performed and RE digested scFv genes, PI genes and pCAMBIA 1301
were purified.
3.4 CONSTRUCTION OF PCAMBIA EXPRESSION VECTORS
3.4.1 pCTOXO-BBTI construct
T4 DNA ligase enzyme was applied for the ligation of purified RE digested scFv
gene, BBTI gene and pCAMBIA 1301 plasmid as the cloning vector. Total solution of
10µl ligation mixture was prepared by mixing 4µl of digested pCAMBIA 1301, 2µl of
digested scFv gene and 2µl of digested BBTI gene as described in Section 3.3,
supplemented with 1µl of 10X ligation buffer and 1 µl T4 DNA ligase enzyme.

35
Then, the ligation mixture of plasmid construct pCTOXO-BBTI was transferred into
Escherichia coli JM109 cells. For this procedure one tube of frozen JM109 competent
cell was thawed in ice for 30 minutes and 3µl of pCTOXO-BBTI ligation mixture was
added into Escherichia coli JM109 cells to insert the plasmid DNA carrying the desired
scFv-BBTI genes. The tube was then heat shocked in a water bath at 42˚C for 45
seconds. It was then rapidly transferred to an ice bath for 5 minutes. Then, 900µl of
fresh LB broth was added to it and incubated for 2 hours at 37˚C in a spin shaker. After
incubation, the mixture was centrifuged at 1000 rpm for 10 minutes and 800µl of
supernatant was removed. The pellet was then resuspended in the remaining culture.
Subsequently, 100µl of the culture was spread on LB agar plate supplemented with
100µg/ml kanamycin and incubated at 37˚C for overnight. Figure 3.3 shows the
expected pCTOXO-BBTI construct.

36
Figure 3.3: pCTOXO-BBTI construct
3.4.2 pCTOXO-CDI construct
The procedure for the construction of the pCTOXO-CDI construct was the same as
construction of the pCTOXO-BBTI as described in Section 3.4.1 except for one
component which was the protease inhibitor gene. Therefore, the RE digested BBTI
was replaced with RE digested CDI in the ligation mixture. The expected pCTOXO-
CDI construct is shown in Figure 3.4.

37
Figure 3.4: pCTOXO-CDI construct
3.4.3 pCTOXO-OCPI construct
The procedure for the construction of the pCTOXO-OCPI construct was the same as
construction of two previous constructs as described in Sections 3.4.1 and 3.4.2 except
for the protease inhibitor gene. So the RE digested BBTI /CDI was replaced with RE
digested OCPI in the ligation mixture. The expected pCTOXO-OCPI construct is shown
in Figure 3.5.

38
Figure 3.5: pCTOXO-OCPI construct
3.5 COLONY PCR FOR PCTOXO-PIS CONSTRUCTS
Colony selection for the transformed JM109 bacteria with three pCTOXO-PIs as
described in section 3.4 was carried out after 12 to 16 hours incubation. This procedure
was carried out under sterile condition. The single colonies were cultured onto a gridded
DNA library master plate containing LB agar supplemented with 100µg/ml kanamycin.
The same colonies were also resuspended in 50µl of sterile distilled water in individual
0.5ml PCR tubes. The DNA library master plate was then incubated at 37˚C for
overnight. The colony suspensions in the tubes of distilled water were boiled at 99˚C for
10 minutes before performing colony PCR verification.

39
First, colony PCR was done with scFv primers to select the positive colonies which at
least contained the scFv gene showing correct band size on the electrophoresed gel. The
primers used were scFv-Forward and scFv-Reverse primers; the sequence of the primers
described in Section 3.2.4. After colony PCR with scFv primers, the positive colonies
suspensions which showed the scFv band on electrophoresed gel were chosen to
perform colony PCR using scFv-PI flanking primers to verify the presence of the
desired DNA fragments of scFv-BBTI, scFv-CDI and scFv-OCPI in pCTOXO-PI
constructs of interest in this research. The annealing temperature was 54.9˚C and the
primers used were as follows:
scFv-PI Forward primer 5’-CAT TTG GAG AGA ACA CGG GGG ACT -3’
scFv-PI Reverse primer 5’-GGG TCC TAA CCA AGA AAA TGA A-3’
The procedure of ligation, transformation and colony PCR with scFv-PI primers were
repeated for several times using different purified RE digested scFv3, scFv9, scFv15,
BBTI, CDI, OCPI and pCAMBIA 1301.
3.6 CONSTRUCTION OF A SECOND PCTOXO-CDI-KDEL CONSTRUCT
A second plasmid construct for pCTOXO-CDI was developed in collaboration with a
parallel study (Go Pei See pers. comm.). The cloning vector, scFv gene and restriction
endonuclease RE sites were all changed to obtain the new pCTOXO-CDI-KDEL
construct containing CDI gene fused to KDEL. Besides, new primers were designed to
amplify scFv116 and CDI genes. A new vector pCAMBIA 1304 was used instead of
pCAMBIA 1301 as the cloning vector and it was digested using NcoI and SpeI RE
enzymes. For the construction of this new construct scFv116 was amplified using new

40
primers to insert NcoI RE site at 5’ end and HindIII RE site at 3’ end. Also new PI
flanking primers were designed to insert HindII and SpeI RE sites at 5’ and 3’ end of
CDI protease gene respectively. The pure RE digested scFv116 gene was then ligated to
pure RE digested CDI protease inhibitor gene and cloned into the pCAMBIA 1304
vector by applying T4 DNA Ligase (Figure 3.6). The plasmid for the new construct of
pCTOXO-CDI-KDEL was prepared using the same method as described in Section
3.3.1. The pCTOXO-CDI-KDEL construct is shown in Figure 3.7.
pCAMBIA 1304 NcoI scFv116 HindIII CDI (with KDEL) SpeI pCAMBIA 1304
Figure 3.6: Ligation product of pCTOXO- CDI-KDEL
Figure 3.7: pCTOXO-CDI-KDEL construct

41
3.7 TRANSFORMATION OF CONSTRUCTS INTO A. TUMEFACIENS
Agrobacterium- mediated transformation method was used to transform the desired
gene into the plant cells.
3.7.1 Preparation of Agrobacterium competent cell
The Agrobacterum tumefaciens strain LBA4404 was streaked onto a fresh solid LB
agar plate supplemented with 50µg/ml rifampicin and was incubated at 28ºC for 2 to 3
days in dark. The rifampicin antibiotic was filter sterilized prior to addition. After 3
days, a single colony of the Agrobacterium was picked from solid LB agar plate with a
sterile toothpick for the inoculation and transferred into 3 ml liquid LB broth medium
supplemented with 50µg/ml rifampicin and incubated in water bath shaker at 28˚C, 200
rpm for overnight (16 to 18 hours). One ml of the overnight Agrobacterium culture was
then subcultured into 25ml of LB broth in 50ml Falcon tube. The culture was incubated
at 28ºC in a water bath shaker (200rpm). Every hour, 100µl of the culture was taken for
optical density (O.D.) reading at absorption λ=600nm. The optical density reading was
taken until it reached OD600~ 0.45 to 0.5.
After achieving the OD600nm~0.5, the Agrobacterium culture was incubated on ice for
20 minutes. The refrigerated centrifuge machine was set at 4˚C. Then, the
Agrobacterium culture was centrifuged at 5,000 rpm for 10 minutes at 4˚C. The
supernatant was discarded then the tube was put back on ice . Appropriate volume of
LB broth was added to the tube to resuspend the pellets of Agrobacterium. Then, 100µl
of the prepared Agrobacterium competent cells was aliquot to sterile 1.5ml

42
microcentrifuge tubes. The liquid nitrogen was applied on the tubes prior to storing the
LBA4404 competent cells in -20˚C. All steps were done in sterile condition.
3.7.2 Agrobacterium heat shock transformation
Two tubes of 100µl frozen Agrobacterium strain LBA4404 cells were thawed on ice
and 5µg of each plasmid construct, pCTOXO-CDI and pCTOXO-KDEL carrying the
scFv116-CDI and scFv116-KDEL genes respectively (described in Sections 3.1.3 and
3.6) was added into each tube of LBA4404 competent cells to transform the extracted
plasmid constructs into Agrobacterium. After add in the plasmids the tubes were
directly chilled on ice for 30 minutes. Then, they were frozen in liquid nitrogen for 30
seconds to 1 minute. Heat shock transformation was carried out by transferring tubes
into 37˚C water bath and incubated for 4 minutes. After that the tubes were transferred
into ice for 1 minute. Then, 900µl of fresh LB broth was added into each tube to grow
the Agrobacterium containing the plasmids, and incubated at 28˚C (room temperature)
on a rotary shaker (200rpm) and placed in the dark for 2 to 4 hours. Finally, 100µl of
each Agrobacterium culture carrying pCTOXO-CDI construct and pCTOXO-KDEL
construct was spread on 2 LB Agar plates supplemented with 100µg/ml kanamycin and
50µg/ml rifampicin. The Agar plates were incubated in dark at 28˚C for 2 to 3 days until
colonies appeared.
3.7.3 Colony PCR for transformed Agrobacterium with plasmid DNA constructs
Colony selection for the transformed Agrobacterium with plasmid constructs was
carried out after 3 days of incubation. This procedure was carried out under sterile
conditions. The single colonies were cultured onto a gridded DNA library master plate

43
containing LB agar supplemented with 100µg/ml kanamycin and 50µg/ml rifampicin.
The same colonies were also resuspended in 50µl of sterile distilled water in individual
0.5ml PCR tubes. The DNA library master plate was then incubated at 28˚C in dark for
overnight. The colony suspensions in the tubes of distilled water were boiled at 99˚C for
10 minutes.
Two µl of each boiled colony suspension was used as the DNA template to perform the
colony PCR for transformed Agrobacterium LBA4404 with two constructs to verify the
existence of desired scFv116-CDI and scFv116-KDEL genes in Agrobacterium.
3.7.3.1 Colony PCR verification for transformed Agrobacterium with pCTOXO-
CDI
Colony PCR was carried out for Agrobacterium containing pCTOXO-CDI construct
.The annealing temperature for the PCR was 58.3˚C. The PCR products were
electrophoresed in a 1% w/v agarose gel with 1X TBE buffer and run at 120 volts for 25
minutes (Figure 4.18).
3.7.3.2 Colony PCR verification for transformed Agrobacterium with pCTOXO-
KDEL
The primers which were used for the verification of Agrobacterium transformation
with pCTOXO-KDEL construct were as follows:
Flanking scFv anti-TOXO Forward 5’-TTG GAG AGA ACA CGG GGG ACT C-3’
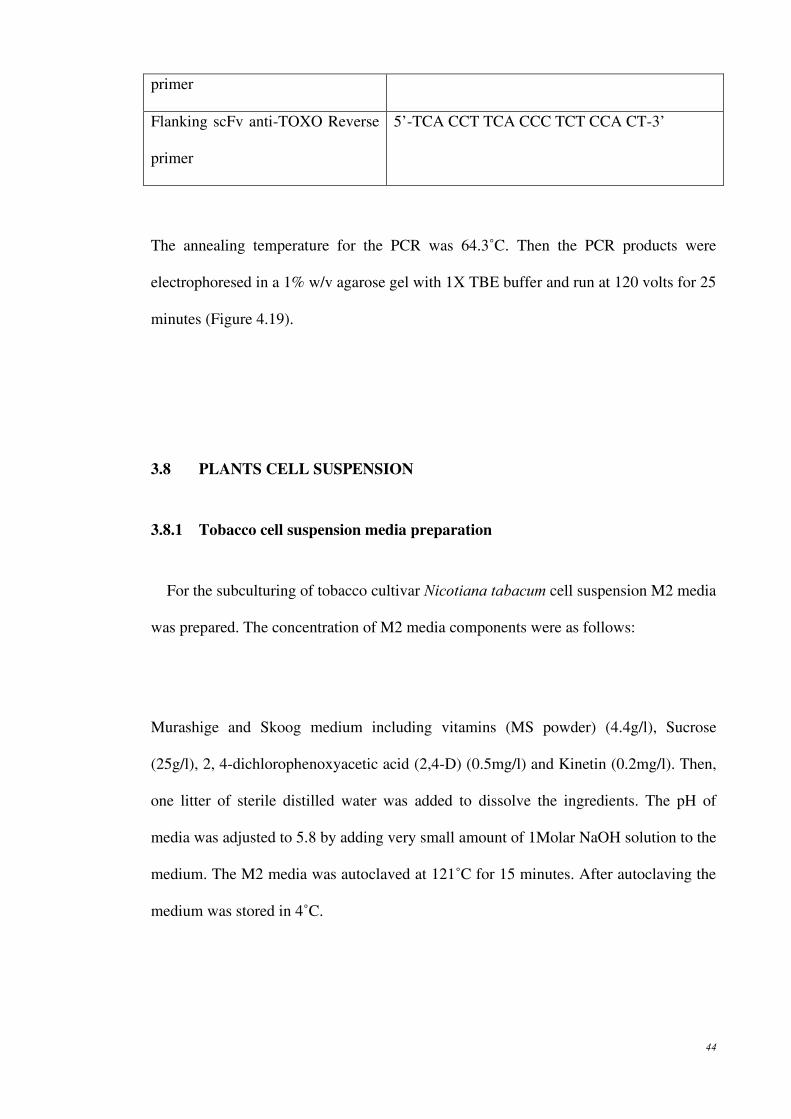
44
primer
Flanking scFv anti-TOXO Reverse
primer
5’-TCA CCT TCA CCC TCT CCA CT-3’
The annealing temperature for the PCR was 64.3˚C. Then the PCR products were
electrophoresed in a 1% w/v agarose gel with 1X TBE buffer and run at 120 volts for 25
minutes (Figure 4.19).
3.8 PLANTS CELL SUSPENSION
3.8.1 Tobacco cell suspension media preparation
For the subculturing of tobacco cultivar Nicotiana tabacum cell suspension M2 media
was prepared. The concentration of M2 media components were as follows:
Murashige and Skoog medium including vitamins (MS powder) (4.4g/l), Sucrose
(25g/l), 2, 4-dichlorophenoxyacetic acid (2,4-D) (0.5mg/l) and Kinetin (0.2mg/l). Then,
one litter of sterile distilled water was added to dissolve the ingredients. The pH of
media was adjusted to 5.8 by adding very small amount of 1Molar NaOH solution to the
medium. The M2 media was autoclaved at 121˚C for 15 minutes. After autoclaving the
medium was stored in 4˚C.

45
3.8.2 Subculturing of Tobacco cell suspension
The subculture work of tobacco cell suspension was carried out every 7-14 days
depending on the growth of tobacco cells. The procedure of sub-culturing was done in
sterile condition. The cells present in each conical flask were divided into two flasks to
produce enough tobacco cell suspension for the research. First, 40ml of the used media
was removed by pipetting and then 5 to 10ml of the tobacco cell suspension was
transferred into two autoclaved 250ml conical flasks. Then, 50ml of the prepared
sterilized M2 media was added in each flask. The flasks of plant cells were incubated in
a shaker at 80 rpm, 25˚C. All procedures were carried out in sterile conditions.
The subculture work was routinely repeated for a period of 30 days. After this period of
time enough tobacco cell suspension were established that were needed to perform the
next step of the experiment which was Agrobacterium transformation of plant cells.
This amount of cells was needed for the performance of Quantitative GUS fluorometric
assay.
3.9 PREPARATION OF PLANT CELL SUSPENSIONS
For Agrobacterium-mediated transformation of pCTOXO-CDI and pCTOXO-KDEL
into tobacco cells the plants cell suspension were prepared. For each transformation the
cells of 3 conical flasks were mixed by removing the excessive M2 media first and
transferring into a Petri dish on laminar flow. Then, 5ml of plant cell suspension was
transferred into a 50ml Falcon tube by pipetting. Twenty five ml of sterilized M2 media
was subsequently added into them. The ratio volume of cell suspension to M2 media
was adjusted to 1:5. Then, 5ml plant cell suspension was resuspended into 25ml M2
media by the use of pipetting. Then, 1000µl of the mixture was aliquot into 4
46
disposable, polystyrene bottles. Finally, 8000µl of M2 media was added into the cells.
This step was done one day earlier of infection .So each bottle contained 9ml of plant
cell suspension.
For each colony transformation this step was repeated. So to transform each colony (A1,
A2) of Agrobacterium carrying the pCTOXO-CDI construct and (B1, B2) carrying the
pCTOXO-KDEL construct, 4 replicates of tobacco cell suspension were prepared in
disposable, polystyrene bottles. Besides, 4 replicates of tobacco cell suspension were
also prepared to perform the control experiment.
3.10 PREPARATION OF AGROBACTERIUM CULTURE
Two positive Agrobacterium colonies of each construct were grown from the library
plate into 5ml LB broth supplemented with 100µg/ml kanamycin and 50µg/ml
rifampicin to transform the construct of desired genes into plant cells. The pCTOXO-
CDI containing colonies were named as A1 and A2 and the pCTOXO-KDEL
containing colonies were named as B1 and B2.Then they were incubated at 28˚C in a
water bath shaker at 200 rpm for 16 to 18 hours. After 18 hours of incubation, 3ml of
each overnight culture was subcultured into 30ml LB broth in a 50ml Falcon tube. The
tubes were then incubated at 28˚C in a shaker at 200 rpm. Every hour, 100µl of the
culture was taken for optical density (OD) reading at absorption λ=600nm. The optical
density reading was taken until the OD600~ 0.45 to 0.5. After achieving the
OD600nm~0.5 the refrigerated centrifuge machine was set at 4˚C. Then, the
Agrobacterium culture was centrifuged at 5,000 rpm for 10 minutes at 4˚C. The
supernatant was discarded. Then the pellet of Agrobacterium was resuspended in 3ml
fresh M2 media. All the procedures were carried out in sterile conditions.
47
3.11 AGROBACTERIUM-MEDIATED TRANSFORMATION OF PLANT
CELLS
One ml of the prepared Agrobacterium culture in fresh M2 media as described in
Section 3.10 was added into the 9ml of plant cell suspension which was prepared earlier
as described in section 3.9. Four replicates were prepared for each colony. High
efficiency transformation of Agrobacterium into plant cells was promoted using
acetosyringone with the concentration of 100µM. Then, the infected plant cells were
incubated in dark by covering the bottles with aluminum foil to prevent the exposure of
light. The bottles were incubated at 25˚C for 30 minutes on a shaker shaking at 250
rpm. After 30 minutes all the liquid was removed and only cell suspension was
remained in the bottles. The plant cells were washed by sdH2O to remove the excessive
Agrobacterium in the bottles. Finally, the sdH2O was removed by pipetting.
3.11.1 Co-cultivation procedure
The co-cultivation of Agrobcterium and plant cells was carried out by adding 10ml of
MSO media in the bottles. The cell suspension was then incubated in dark at 80 rpm for
4 days. The MSO media (MS basal media) components for co-cultivation work were as
follows:
Murashige and Skoog medium, including vitamins (MS powder) (4.4g/l) and Sucrose
(20g/l). Then, one litter of sterile distilled water was added to dissolve the ingredients.
The pH of media was adjusted to 5.8 for tobacco cells by adding very small amount of
1Molar NaOH solution to the medium. The MSO media was autoclaved at 121˚C for 15
minutes. After autoclaving the medium was stored in 4˚C.

48
3.11.2 Killing Agrobacterium
After 4 days of co-cultivation, the used MSO media was replaced with 10ml fresh
sterilized MSO media supplemented with 50µg/ml cefotaxime on laminar flow. The
plant cell suspension was incubated in dark, shaking at 80 rpm for another 2 days to kill
the Agrobacterium. After killing the Agrobacterium using cefotaxime antibiotic, the
MSO media was removed and 10ml of fresh MSO media was added into each sample.
The plant cells were incubated in dark at 80rpm for another 7 days to give time to the
plant cells for growth.
3.12 ASSAY OF ß-GLUCURONIDASE (GUS) QUANTITATIVE ACTIVITY
BY FLUOROMETRY
The gusA gene was isolated from Escherichia coli (Jefferson et al., 1987) and a
number of gene cassettes are available (e.g. from Clontech) which allow the insertion of
promoter regions adjacent to the gusA gene generating either transcriptional or
translational gene fusions. ß-glucuronidase can be both assayed fluorometrically (using
4-methylumbelliferone glucuronide, MUG, as substrate) and localized in situ
histochemically (using 5-bromo-4-chloro-3-indolyl glucuronide, X-gluc, as substrate).
This research involved quantifying enzyme activity units that normally expressed in
pmol 4-MU released per mg of protein per minute.
GUS
MUG (non-fluorescent) → glucuronic acid+ 4-MU (fluorescent)
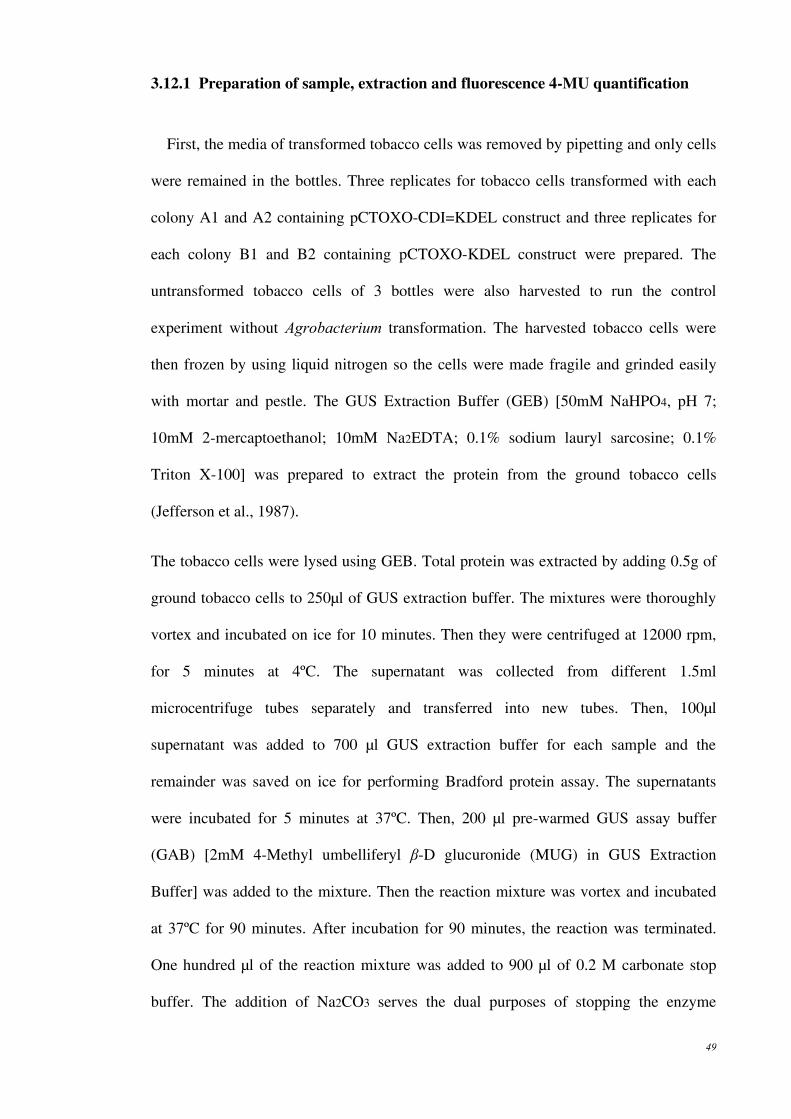
49
3.12.1 Preparation of sample, extraction and fluorescence 4-MU quantification
First, the media of transformed tobacco cells was removed by pipetting and only cells
were remained in the bottles. Three replicates for tobacco cells transformed with each
colony A1 and A2 containing pCTOXO-CDI=KDEL construct and three replicates for
each colony B1 and B2 containing pCTOXO-KDEL construct were prepared. The
untransformed tobacco cells of 3 bottles were also harvested to run the control
experiment without Agrobacterium transformation. The harvested tobacco cells were
then frozen by using liquid nitrogen so the cells were made fragile and grinded easily
with mortar and pestle. The GUS Extraction Buffer (GEB) [50mM NaHPO4, pH 7;
10mM 2-mercaptoethanol; 10mM Na2EDTA; 0.1% sodium lauryl sarcosine; 0.1%
Triton X-100] was prepared to extract the protein from the ground tobacco cells
(Jefferson et al., 1987).
The tobacco cells were lysed using GEB. Total protein was extracted by adding 0.5g of
ground tobacco cells to 250µl of GUS extraction buffer. The mixtures were thoroughly
vortex and incubated on ice for 10 minutes. Then they were centrifuged at 12000 rpm,
for 5 minutes at 4ºC. The supernatant was collected from different 1.5ml
microcentrifuge tubes separately and transferred into new tubes. Then, 100µl
supernatant was added to 700 µl GUS extraction buffer for each sample and the
remainder was saved on ice for performing Bradford protein assay. The supernatants
were incubated for 5 minutes at 37ºC. Then, 200 µl pre-warmed GUS assay buffer
(GAB) [2mM 4-Methyl umbelliferyl β-D glucuronide (MUG) in GUS Extraction
Buffer] was added to the mixture. Then the reaction mixture was vortex and incubated
at 37ºC for 90 minutes. After incubation for 90 minutes, the reaction was terminated.
One hundred µl of the reaction mixture was added to 900 µl of 0.2 M carbonate stop
buffer. The addition of Na2CO3 serves the dual purposes of stopping the enzyme

50
reaction and developing the fluorescence of 4-MU, which is about seven times as
intense at alkaline pH. Finally, the unknown sample fluorescence was measured by
using a spectrofluorometer with the emission at 455 nm and excitation at 365 nm and
calculated into GUS specific activity by using 4-methyl-umbelliferone (4-MU) as
standard. Three replicate assays were carried out for each Agrobacterium colony
transformed into tobacco cells.
3.12.1.1 Standard dilution of 4-Methylumbelliferone and relative Fluorescent
Intensity
Standard Dilution of 4-Methylumbelliferone (4-MU) was prepared and Relative
Fluorescent Intensity of different 4-MU dilutions was measured to obtain the equation
of the curve (4-MU vs. Fluorescent Intensity) (Figure 4.22). The equation was needed to
calculate the amount of 4-MU (pmol) in unknown samples.
One mM 4-MU stock solution was prepared by dissolving 19.8mg of 4-
methylumbelliferone (sodium salt), MW=198.20 in 100ml deionised distilled water.
Then 1µM 4-MU stock solution was prepared from the 1mM 4-MU stock solution and
stored at 4˚ C away from light. Subsequently, 4-MU standard measurements for series
of concentrations as shown in table 3.1 were prepared. The Fluorescent Intensity of each
sample was recorded (Table 4.4) using a fluorometer and the standard dilution curve for
4-MU was plotted (Figure 4.22). From the obtained equation of 4-MU standard curve
the enzyme activity of unknown samples was calculated which expressed in pmol 4-MU
released per mg protein per minute (Table 4.8).

51
0.2M Carbonate buffer (ml) 1µM 4-MU stock (µl) Sample conc.(X) (nM)
2.0 0 0
1.9 100 50
1.8 200 100
1.7 300 150
1.6 400 200
Table 3.1: 4-MU Standard Dilutions
3.12.2 Bradford protein determination
Quick Start Bradford Protein Assay Kit from BIORAD was used to perform the
Bradford assay. The Quick Start Bradford protein assay is a simple and accurate
procedure for determining the concentration of protein in solution. The Bradford assay
is a protein determination method that involves the binding of Coomassie Brilliant Blue
G-250 dye to proteins (Bradford, 1976). The dye exists in three forms: cationic (red),
neutral (green), and anionic (blue) (Compton et al., 1985). Under acidic conditions, the
dye is predominantly in the doubly protonated red cationic form (Amax=470nm).
However, when the dye binds to protein, it is converted to a stable unprotonated blue
form (Amax=595nm). It is this blue protein-dye form that is detected at 595nm in the
assay using a spectrophotometer or microplate reader.
In this research, 20µl of the supernatant of unknown samples which was saved on ice as
described in Section 3.12.1 to perform the Bradford protein assay was transferred into
separate clean 1ml disposable cuvettes and then 1ml pre-warmed 1X Bradford Dye
Reagent (included in the kit )was added to each sample. Then, it was mixed gently by
inversion and incubated at room temperature for 5 to 10 minutes before OD reading.
52
The absorbance was read at 595nm for each sample separately using a
spectrophotometer. The protein concentration (mg/ml) of samples was determined by
using the Bradford protein standard curve (Figure 4.23) as will be described in Section
3.12.2.1.
3.12.2.1 Protein standard curve
In any protein assay, the ideal protein to use as standard is a purified preparation of
the protein being assayed. In the absence of such an absolute reference protein, another
protein must be selected as a relative standard. The best relative standard to use is one
that gives a colour yield similar to that of the protein being assayed. The two most
common protein standards used for protein assays are Bovine Serum Albumin (BSA)
and gamma-globulin. With the Quick Start Bradford protein assay, dye colour
development is significantly greater with BSA than with most other proteins, including
gamma-globulin. Therefore, the BSA standard would be an appropriate standard.
The 1X dye reagent was removed from 4˚C storage and let it warm to ambient
temperature to perform the standard assay. The 1X dye reagent was inverted a few times
before use. The 1mg/ml BSA stock solution included in the Quick Start Bradford
Protein Assay Kit was used to prepare the standard dilutions. For the diluents the same
buffer as in the samples was used. So GEB was applied as the diluents. Nine tubes of
diluted protein standard were prepared to perform the 1ml standard assay in disposable
cuvettes. The kit instruction was performed to prepare the dilutions. The BSA volume in
µl was then converted to BSA concentration in mg as shown in table 3.2.

53
Then, each standard solution was transferred into separate 1m disposable cuvettes
supplemented with 900µl of 1X dye reagent and they were inverted. The standard
solutions were incubated at room temperature for 5 to 10 minutes. The absorbance of
standard samples was measured using a spectrophotometer which was set at 595nm.
The instrument was zeroed using blank sample prior to OD reading. The blank sample
was prepared using water and dye reagent. Triplicate standard measurements were
carried out (Table 4.6).
Table 3.2: Bradford Standard Measurements
To determine the protein concentration of unknown samples, standard curve was drawn
by plotting the OD595nm values (y-axis) versus the BSA protein concentration (x-axis)
Tube BSA volume
(µl)
Diluent(GEB)
Volume (µl)
Bradford dye reagent
(µl)
BSA Protein
conc. (mg)
1 0 100 900 0
2 2.5 97.5 900 0.0025
3 5.0 95 900 0.005
4 7.5 92.5 900 0.0075
5 10.0 90.0 900 0.01
6 15.0 85.0 900 0.015
7 20.0 80.0 900 0.02
8 25.0 75.0 900 0.025
9 30.0 70.0 900 0.03

54
(Figure 4.23). From the obtained equation of the standard curve the protein
concentration of unknown samples was calculated (Table 4.7).
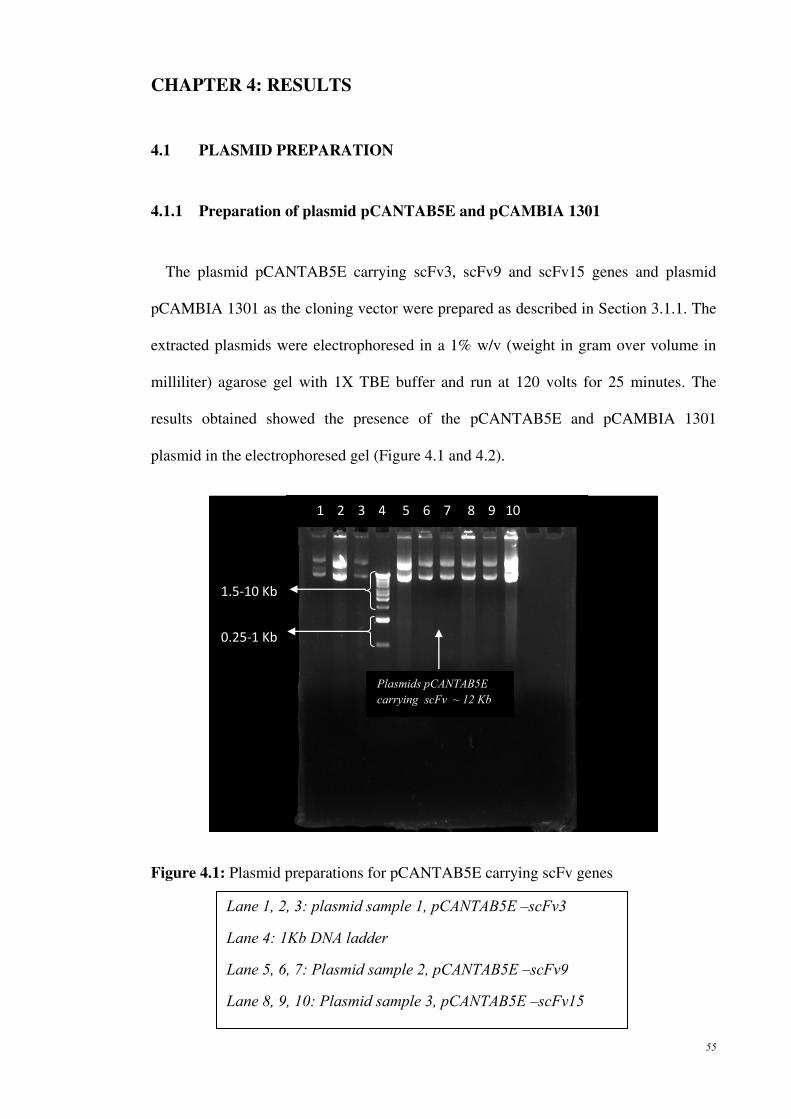
55
CHAPTER 4: RESULTS
4.1 PLASMID PREPARATION
4.1.1 Preparation of plasmid pCANTAB5E and pCAMBIA 1301
The plasmid pCANTAB5E carrying scFv3, scFv9 and scFv15 genes and plasmid
pCAMBIA 1301 as the cloning vector were prepared as described in Section 3.1.1. The
extracted plasmids were electrophoresed in a 1% w/v (weight in gram over volume in
milliliter) agarose gel with 1X TBE buffer and run at 120 volts for 25 minutes. The
results obtained showed the presence of the pCANTAB5E and pCAMBIA 1301
plasmid in the electrophoresed gel (Figure 4.1 and 4.2).
Figure 4.1: Plasmid preparations for pCANTAB5E carrying scFv genes
Lane 1, 2, 3: plasmid sample 1, pCANTAB5E –scFv3
Lane 4: 1Kb DNA ladder
Lane 5, 6, 7: Plasmid sample 2, pCANTAB5E –scFv9
Lane 8, 9, 10: Plasmid sample 3, pCANTAB5E –scFv15
1 2 3 4 5 6 7 8 9 10
0.25-1 Kb
1.5-10 Kb
Plasmids pCANTAB5E
carrying scFv ~ 12 Kb
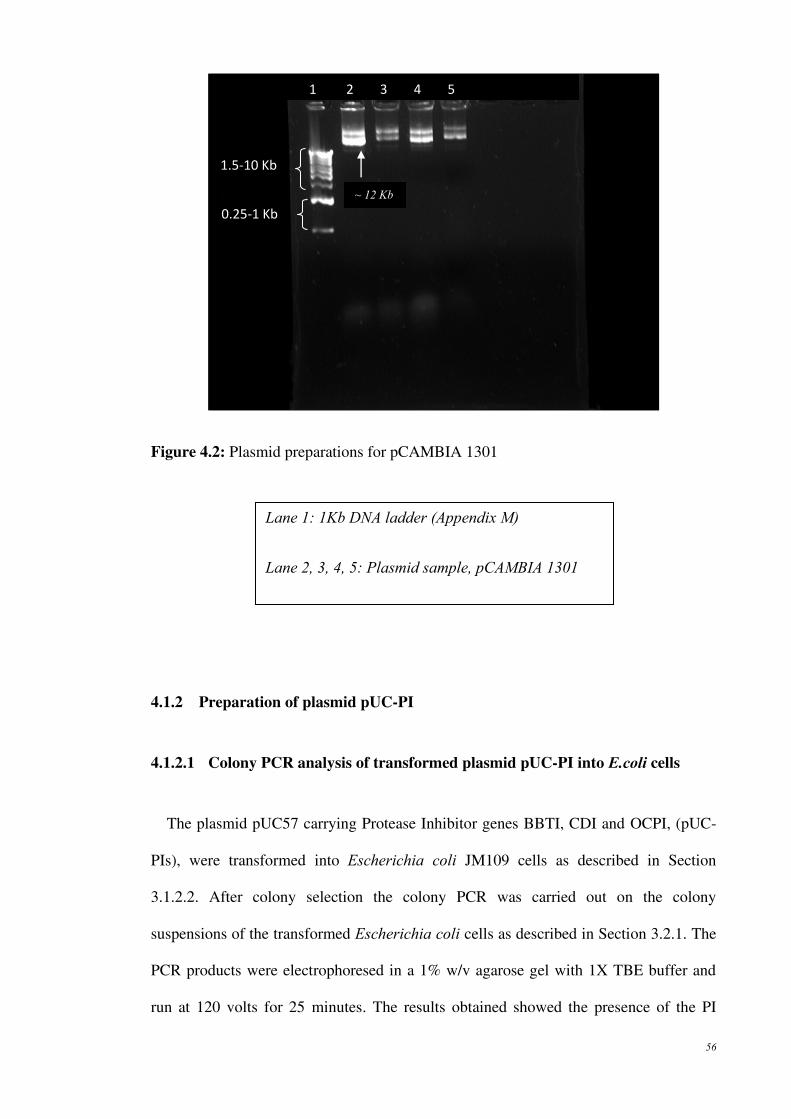
56
Figure 4.2: Plasmid preparations for pCAMBIA 1301
4.1.2 Preparation of plasmid pUC-PI
4.1.2.1 Colony PCR analysis of transformed plasmid pUC-PI into E.coli cells
The plasmid pUC57 carrying Protease Inhibitor genes BBTI, CDI and OCPI, (pUC-
PIs), were transformed into Escherichia coli JM109 cells as described in Section
3.1.2.2. After colony selection the colony PCR was carried out on the colony
suspensions of the transformed Escherichia coli cells as described in Section 3.2.1. The
PCR products were electrophoresed in a 1% w/v agarose gel with 1X TBE buffer and
run at 120 volts for 25 minutes. The results obtained showed the presence of the PI
Lane 1: 1Kb DNA ladder (Appendix M)
Lane 2, 3, 4, 5: Plasmid sample, pCAMBIA 1301
1 2 3 4 5
0.25-1 Kb
1.5-10 Kb
~ 12 Kb
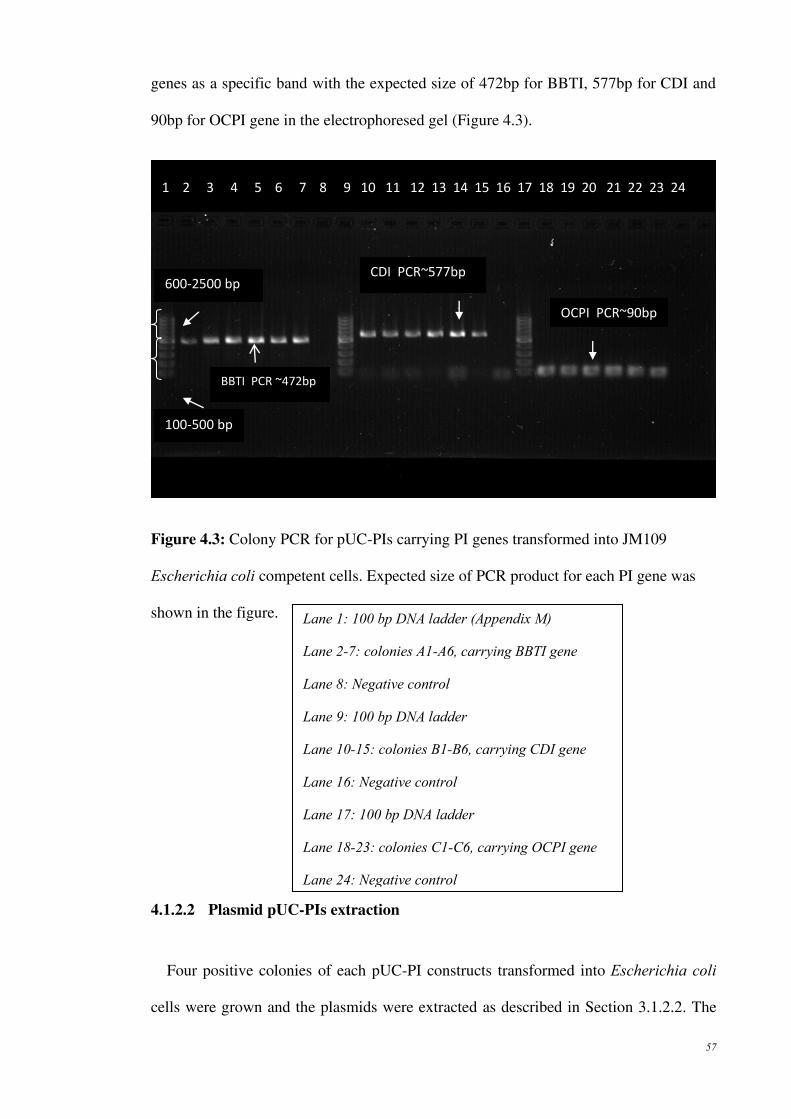
57
genes as a specific band with the expected size of 472bp for BBTI, 577bp for CDI and
90bp for OCPI gene in the electrophoresed gel (Figure 4.3).
Figure 4.3: Colony PCR for pUC-PIs carrying PI genes transformed into JM109
Escherichia coli competent cells. Expected size of PCR product for each PI gene was
shown in the figure.
4.1.2.2 Plasmid pUC-PIs extraction
Four positive colonies of each pUC-PI constructs transformed into Escherichia coli
cells were grown and the plasmids were extracted as described in Section 3.1.2.2. The
Lane 1: 100 bp DNA ladder (Appendix M)
Lane 2-7: colonies A1-A6, carrying BBTI gene
Lane 8: Negative control
Lane 9: 100 bp DNA ladder
Lane 10-15: colonies B1-B6, carrying CDI gene
Lane 16: Negative control
Lane 17: 100 bp DNA ladder
Lane 18-23: colonies C1-C6, carrying OCPI gene
Lane 24: Negative control
1 2 3 4 5 6 7 8 9 10 11 12 13 14 15 16 17 18 19 20 21 22 23 24
600-2500 bp
100-500 bp
BBTI PCR ~472bp
OCPI PCR~90bp
CDI PCR~577bp

58
extracted plasmids were electrophoresed in a 1% w/v agarose gel with 1X TBE buffer
and run at 120 volts for 25 minutes. The results obtained showed the presence of the
plasmid pUC57 in the electrophoresed gel (Figure 4.4). The plasmid pUC57 was used
as the cloning vector for PI genes by the Biosyntech company for after synthesysing the
PI genes as described in Section 3.1.
Figure 4.4: Plasmid preparation for pUC57 vector carrying PI genes (pUC-PI) from
transformed Escherichia coli.
1 2 3 4 5 6 7 8 9 10 11 12 13 14 15
1.5-10 Kb
0.25-1 Kb
Lane 1: 1 Kb DNA ladder
Lane 2-5: plasmid prep for pUC-BBTI
Lane 6: 100 bp DNA ladder
Lane 7-10: plasmid prep for pUC-CDI
Lane 11: 100 bp DNA ladder
Lane 12-15: plasmid prep for pUC-OCPI
1 Kb
pUC carrying BBTI ~ 3 Kb pUC carrying CDI ~ 3 Kb pUC carrying OCPI ~ 3 Kb
3 Kb

59
4.1.2.3 PCR Confirmation for extracted pUC-PI
The extracted pUC57 plasmids carrying BBTI, CDI and OCPI were subjected to PCR
to confirm the presence of desired PI genes after plasmid preparation. The primers used
and the PCR condition was the same as colony PCR for pUC57 plasmid as described in
Section 3.2.1. The PCR products were electrophoresed in a 1% w/v agarose gel with 1X
TBE buffer and run at 120 volts for 25 minutes. The results obtained showed the
presence of the PI genes as a specific band with the expected size of 472bp for BBTI,
577bp for CDI and 90bp for OCPI gene in the electrophoresed gel (Figure 4.5).
Figure 4.5: PCR verification for plasmid pUC57 carrying PI genes after plasmid
preparation. Expected size of PCR products: BBTI= 472bp, CDI= 577bp, OCPI=90bp
Lane 1: 100 bp DNA ladder Lane7-10: PCR for plasmid prep pUC-CDI
Lane 2-5: PCR for plasmid prep pUC-BBTI Lane 11: 100 bp DNA ladder
Lane 6: 100 bp DNA ladder Lane 12-15: PCR for plasmid prep pUC-OCPI
1 2 3 4 5 6 7 8 9 10 11 12 13 14 15
~472bp
~90bp
~577bp
600-2500 bp
100-500 bp 500 bp
500 bp
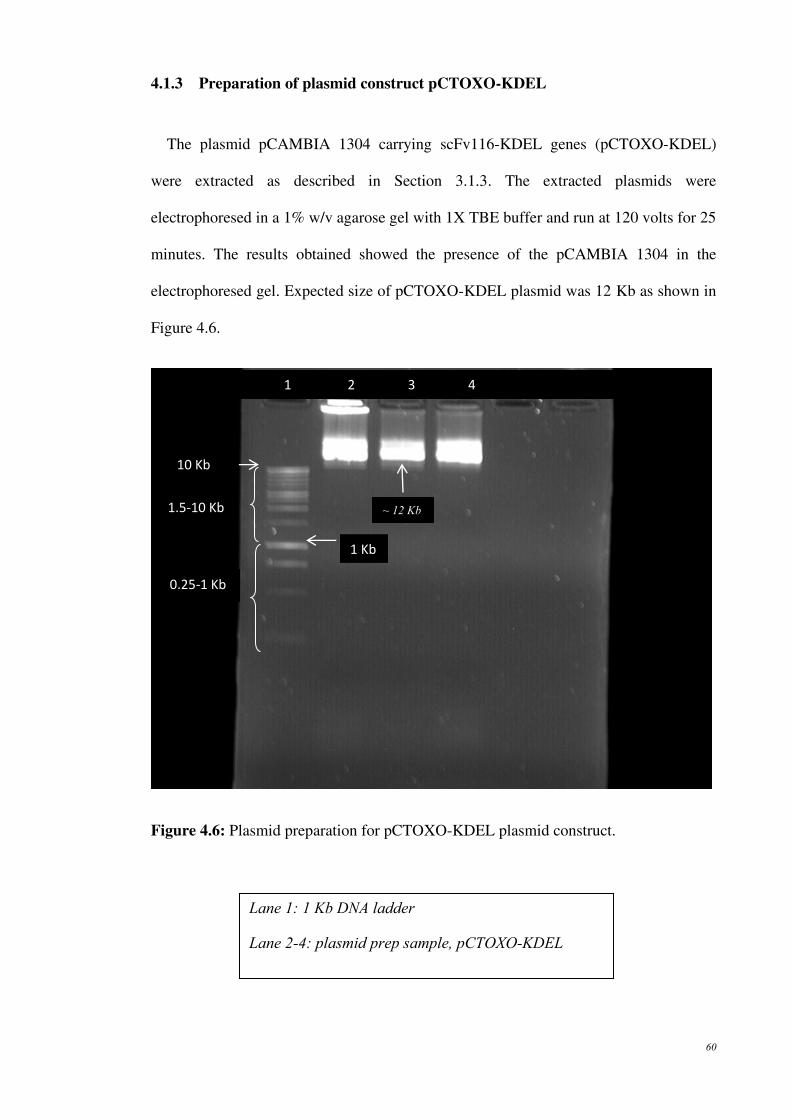
60
4.1.3 Preparation of plasmid construct pCTOXO-KDEL
The plasmid pCAMBIA 1304 carrying scFv116-KDEL genes (pCTOXO-KDEL)
were extracted as described in Section 3.1.3. The extracted plasmids were
electrophoresed in a 1% w/v agarose gel with 1X TBE buffer and run at 120 volts for 25
minutes. The results obtained showed the presence of the pCAMBIA 1304 in the
electrophoresed gel. Expected size of pCTOXO-KDEL plasmid was 12 Kb as shown in
Figure 4.6.
Figure 4.6: Plasmid preparation for pCTOXO-KDEL plasmid construct.
1 2 3 4
0.25-1 Kb
1.5-10 Kb
Lane 1: 1 Kb DNA ladder
Lane 2-4: plasmid prep sample, pCTOXO-KDEL
~ 12 Kb
10 Kb
1 Kb
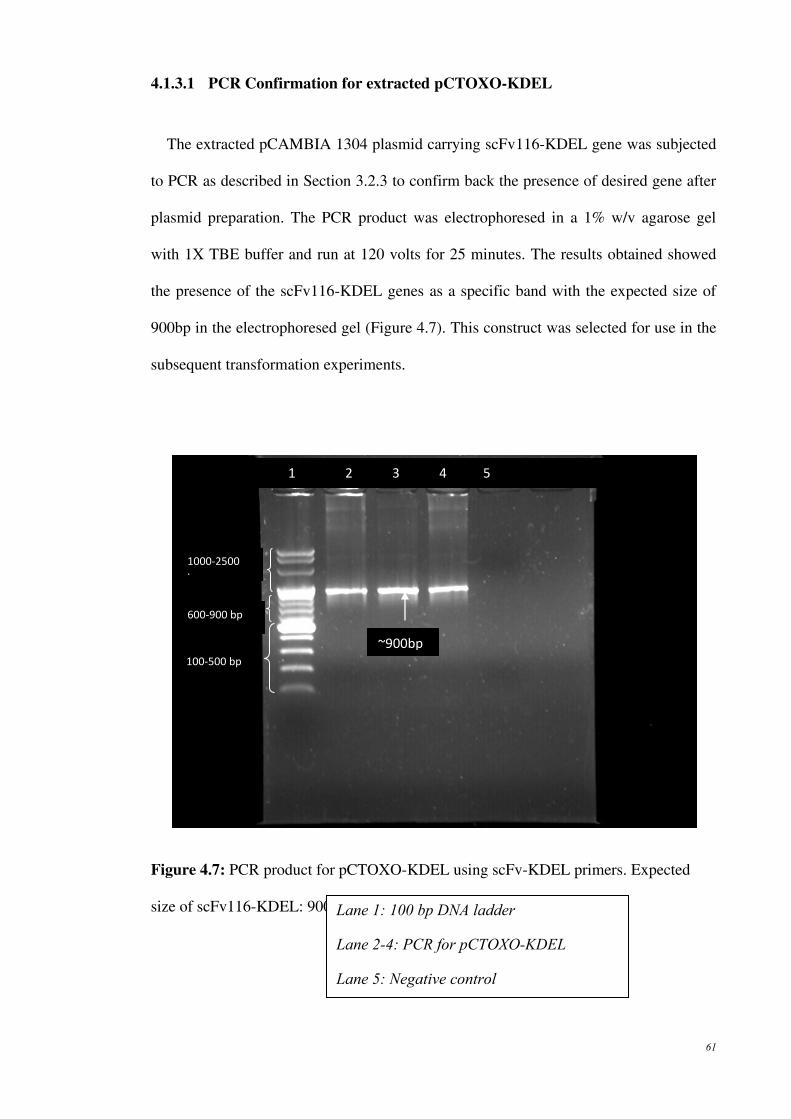
61
4.1.3.1 PCR Confirmation for extracted pCTOXO-KDEL
The extracted pCAMBIA 1304 plasmid carrying scFv116-KDEL gene was subjected
to PCR as described in Section 3.2.3 to confirm back the presence of desired gene after
plasmid preparation. The PCR product was electrophoresed in a 1% w/v agarose gel
with 1X TBE buffer and run at 120 volts for 25 minutes. The results obtained showed
the presence of the scFv116-KDEL genes as a specific band with the expected size of
900bp in the electrophoresed gel (Figure 4.7). This construct was selected for use in the
subsequent transformation experiments.
Figure 4.7: PCR product for pCTOXO-KDEL using scFv-KDEL primers. Expected
size of scFv116-KDEL: 900bp
1 2 3 4 5
Lane 1: 100 bp DNA ladder
Lane 2-4: PCR for pCTOXO-KDEL
Lane 5: Negative control
~900bp
1000-2500
bp
600-900 bp
100-500 bp

62
4.2 PCR FOR ANTI-TOXOPLASMOSIS SCFV AND PROTEASE
INHIBITOR GENES
The PCR was carried out for scFv3, scFv9 and scFv 15 as described in Section 3.2.4
to insert the desired RE sites. The PI genes were also amplified as described in Section
3.2.5. The PCR products were purified using Megaquick-spin kit. The purified PCR
product of scFv3, scFv9 and scFv15 genes and PI genes, BBTI, CDI and OCPI were
electrophoresed in a 1% w/v agarose gel with 1X TBE buffer and run at 120 volts for 25
minutes. The results obtained showed the presence of the scFv genes as a specific band
with the expected size of 800bp in the electrophoresed gel (Figure 4.8). The BBTI, CDI
and OCPI protease inhibitors were also shown very distinct and clear band of 700bp,
950bp and 800bp respectively (Figure 4.9).
Figure 4.8: Purified PCR product of anti-toxoplasmosis scFv genes using scFv primers.
Expected size: scFv=800bp
Lane 1: 100bp DNA ladder
Lane 2: PCR product for scFv3 gene
Lane 3: PCR product for scFv9 gene
Lane 4: PCR product for scFv15 gene
1 2 3 4
~ 800bp
100-500 bp
600-2500 bp
500bp

63
Figure 4.9: Purified PCR product of PI genes using PI primers.
Expected size of PCR products: BBTI= 700bp, CDI= 950bp, OCPI= 800bp.
4.3 DOUBLE RE DIGESTED GENES
Three scFv genes, PI genes and pCAMBIA 1301 cloning vector were digested using
restriction endonuclease enzymes to produce desired fragmented DNA as described in
Section 3.3. The digested genes were gel extracted and purified as described in Section
3.3.4. After purification process was done each purified DNA fragment was
electrophoresed in a 1% w/v agarose gel with 1X TBE buffer and run at 120 volts for 25
Lane 1: 100 bp DNA ladder
Lane 2: PCR product for BBTI gene
Lane 3: PCR product for CDI gene
Lane 4: PCR product for OCPI gene
1 2 3 4
~700bp ~800bp
~950bp
100-500 bp
600-900 bp
1000-2500bp

64
minutes. The results obtained showed the presence of the pure digested scFv genes, PI
genes and pCAMBIA 1301 plasmid as a specific band in the electrophoresed gel
(Figure 4.10 and 4.11).
Figure 4.10: Purified RE digested scFv genes and pCAMBIA 1301
Expected size of RE digested genes: scFv: 760bp, pCAMBIA 1301:12Kb
1 2 3 4 5 6 7
~ 760bp
~ 12Kb
100-500 bp
600- 2500bp
1Kb
10Kb
Lane 1: 100 bp DNA ladder
Lane 2: RE digested scFv3 gene
Lane 3: RE digested scFv9 gene
Lane 4: RE digested scFv15 gene
Lane 5: 1 Kb DNA ladder
Lane 6-7: RE digested pCAMBIA 1301
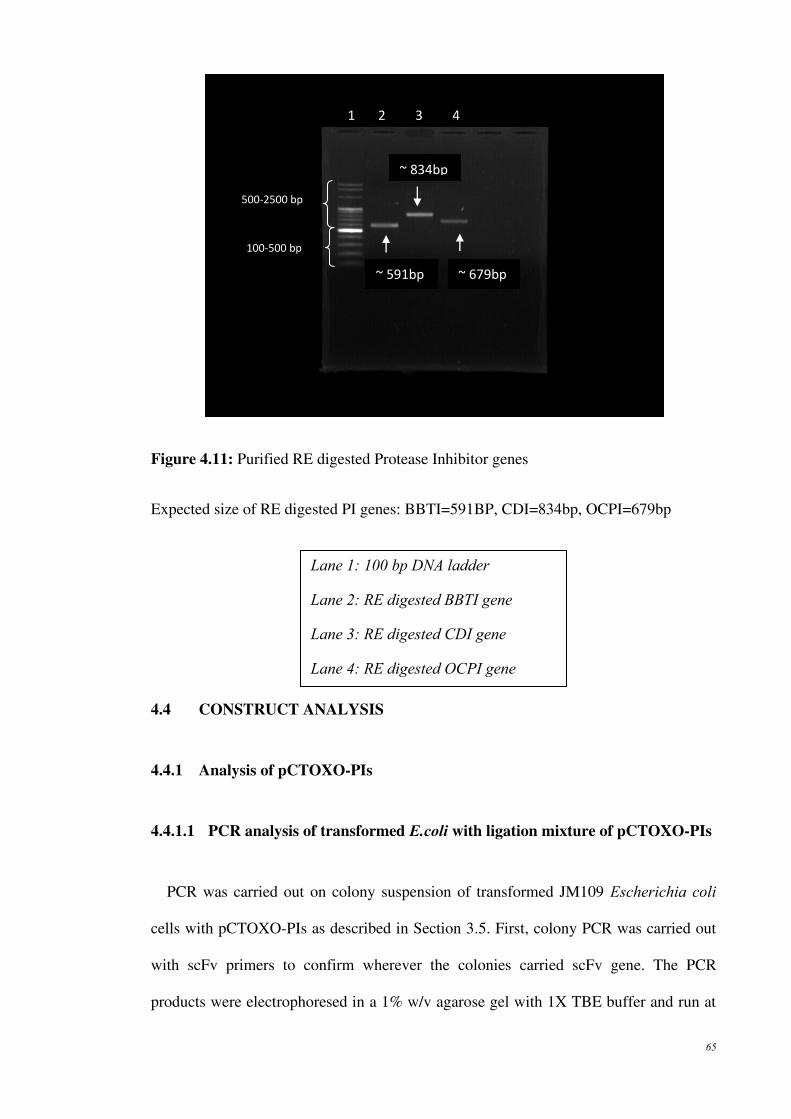
65
Figure 4.11: Purified RE digested Protease Inhibitor genes
Expected size of RE digested PI genes: BBTI=591BP, CDI=834bp, OCPI=679bp
4.4 CONSTRUCT ANALYSIS
4.4.1 Analysis of pCTOXO-PIs
4.4.1.1 PCR analysis of transformed E.coli with ligation mixture of pCTOXO-PIs
PCR was carried out on colony suspension of transformed JM109 Escherichia coli
cells with pCTOXO-PIs as described in Section 3.5. First, colony PCR was carried out
with scFv primers to confirm wherever the colonies carried scFv gene. The PCR
products were electrophoresed in a 1% w/v agarose gel with 1X TBE buffer and run at
Lane 1: 100 bp DNA ladder
Lane 2: RE digested BBTI gene
Lane 3: RE digested CDI gene
Lane 4: RE digested OCPI gene
1 2 3 4
100-500 bp
500-2500 bp
~ 591bp ~ 679bp
~ 834bp

66
120 volts for 25 minutes. The results obtained showed the presence of the scFv genes as
a specific band with the expected size of 750bp in the electrophoresed gel (Figure 4.12
and 4.13). The unexpected bands showed as PCR product in GEL electrophoresis result
(Figure 4.12) might be due to primer dimer problem. The scFv primers using in this step
might have strings of complimentary bases that can attach to each other and lead to a
potential by-product in PCR.
Figure 4.12: Colony PCR for pCTOXO-PIs using scFv primers.
scFv15+PIs+pCAMBIA1301
1 2 3 4 5 6 7 8 9 10 11 12 13
A
~750bp
100-500 bp
500-2500 bp
Lane1: 100 bp DNA ladder
Lane 2-4: PCR for pCTOXO-BBTI
Lane 5-9: PCR for pCTOXO-CDI
Lane 10-13: PCR for pCTOXO-OCPI
Unexpected bands
500bp

67
Figure 4.13: Colony PCR for pCTOXO-PIs using scFv primers.
scFv9+BBTI+pCAMBIA1301
The positive colony suspensions that showed the scFv band on electrophoresis gel were
then chosen to perform the colony PCR using scFv-PI flanking primers to confirm the
success of ligation process. Then the PCR products were electrophoresed in a 1% w/v
agarose gel with 1X TBE buffer and run at 120 volts for 25 minutes. The results
obtained did not show the presence of the correct band size for amplified scFv-PI genes.
The expected size of PCR product for ligated scFv-BBTI gene was 1400bp but the gel
picture showed a band with the size of about 850bp (Figure 4.14). For scFv-CDI the
expected size was 1600bp but the obtained result showed a band with the size of 850bp
(Figure 4.15). Also for the scFv-OCPI the expected size of the PCR product was
B
1 2 3 4 5 6
~750bp
100-500 bp
500-2500 bp
Figure 4.13:
Lane1: 100 bp DNA ladder
Lane 2-6: PCR for pCTOXO-BBTI
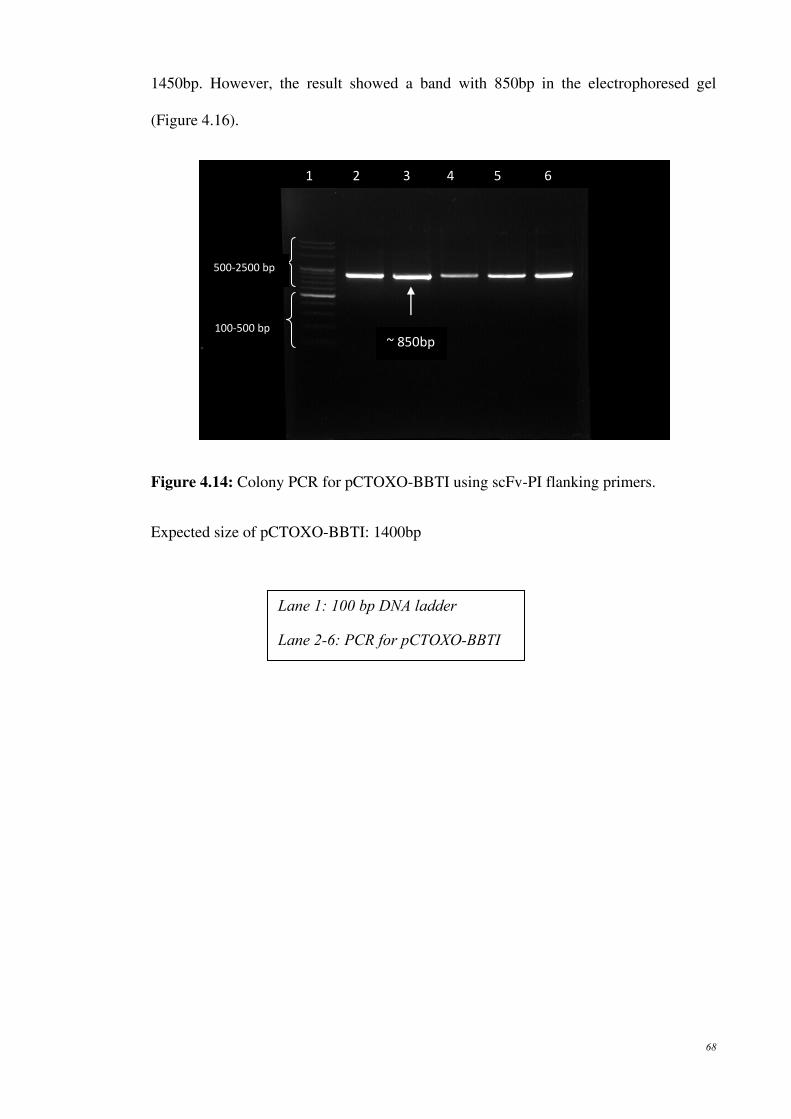
68
1450bp. However, the result showed a band with 850bp in the electrophoresed gel
(Figure 4.16).
Figure 4.14: Colony PCR for pCTOXO-BBTI using scFv-PI flanking primers.
Expected size of pCTOXO-BBTI: 1400bp
Lane 1: 100 bp DNA ladder
Lane 2-6: PCR for pCTOXO-BBTI
1 2 3 4 5 6
100-500 bp
500-2500 bp
~ 850bp
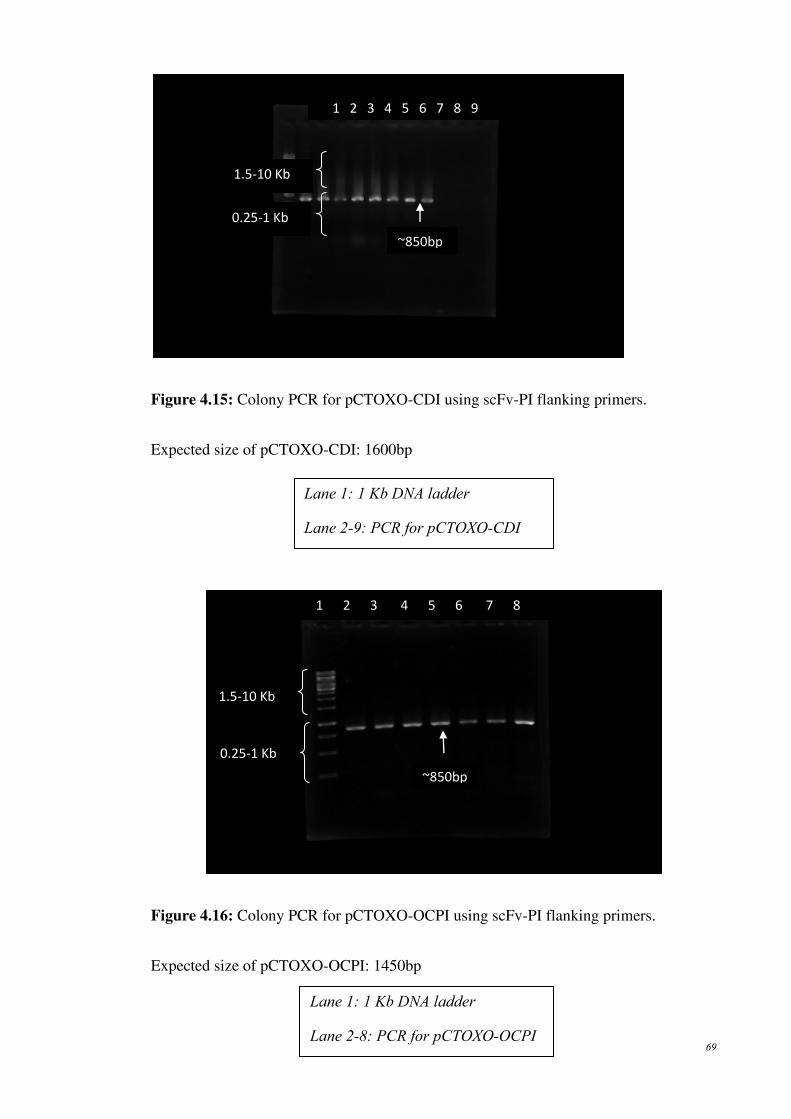
69
Figure 4.15: Colony PCR for pCTOXO-CDI using scFv-PI flanking primers.
Expected size of pCTOXO-CDI: 1600bp
Figure 4.16: Colony PCR for pCTOXO-OCPI using scFv-PI flanking primers.
Expected size of pCTOXO-OCPI: 1450bp
Lane 1: 1 Kb DNA ladder
Lane 2-9: PCR for pCTOXO-CDI
1 2 3 4 5 6 7 8 9
0.25-1 Kb
1.5-10 Kb
~850bp
Lane 1: 1 Kb DNA ladder
Lane 2-8: PCR for pCTOXO-OCPI
1 2 3 4 5 6 7 8
0.25-1 Kb
1.5-10 Kb
~850bp

70
The procedure of ligation, transformation and colony PCR with scFv-PI primers were
repeated for several times using different purified RE digested scFv3, scFv9, scFv15,
BBTI, CDI, OCPI and pCAMBIA 1301. But the result obtained still did not show the
desired correct band size of PCR product for ligated scFv-PI genes.
4.4.1.2 Gene Sequencing Analysis
The PCR was carried out on two pCTOXO-PIs colony suspensions prepared after
transforming the ligation mixture of pCTOXO-BBTI into JM109 cells. The PCR was
carried out in large scale, 50µl, for scFv-PI genes using scFv-PI flanking primers. The
sequence of primers was described in Section 3.5. The PCR products were purified with
the use of Megaquick-spin kit from iNtRON Company. The purified PCR products were
then sent for sequencing.
The gene sequencing results were analyzed using scFv-PI flanking primer sequences to
search for the desired sequence of scFv-PI gene ligated to the pCAMBIA 1301, but the
obtained result showed only scFv anti-toxoplasmosis gene ligated to the pCAMBIA
1301vector without ligating to Protease Inhibitor gene. (Gene Sequencing results in
Appendix A).
The analysis of forward DNA sequencing results was carried out (Appendix B) by
searching the sequence with the reverse complement sequence of scFv-PI reverse
primer. The reverse complement sequence of scFv-PI reverse primer was as follows:
5’-TTCATTTTCTGTTTTAGGAACCCA - 3’

71
Then, the reverse DNA sequencing result was first reverse complemented to search for
the desired scFv-PI gene sequence using forward scFv-PI primer (Appendix C). The
two obtained forward DNA sequence and reverse DNA sequence was then combined
for searching for the desired scFv-PI sequence ligating to the pCAMBIA 1301vector.
The Appendix B shows the forward DNA sequencing result and Appendix C shows the
reverse DNA sequencing result. The combination of these two sequences was shown in
Appendix D and the scFv sequence and pCAMBIA 1301 sequence were highlighted but
the PI gene sequence was not identified as it was not ligated to the vector.
4.4.2 pCTOXO-CDI-KDEL
As the previous attempts to obtain the recombinant PI constructs did not yield any
suitable clone a new pCTOXO-CDI construct containing the scFv116-CDI gene
developed with a parallel project in YasminLab (Go Pei See pers.comm. as described in
Section 3.6) was used for the transformation experiments. The construct also contained
a KDEL element and hence was labeled pCTOXO-CDI-KDEL.
4.4.2.1 PCR analysis of extracted pCTOXO-CDI from E.coli cells
The extracted pCTOXO-CDI-KDEL plasmid was used to perform the
Agrobacterium-mediated transformation of plant cells in this study. The PCR was
carried out on the new pCTOXO-CDI-KDEL plasmid construct using scFv-PI flanking
primers to confirm the presence of scFv116-CDI gene after plasmid preparation. The
PCR products were electrophoresed in a 1% w/v agarose gel with 1X TBE buffer and
run at 120 volts for 25 minutes (Figure 4.17)
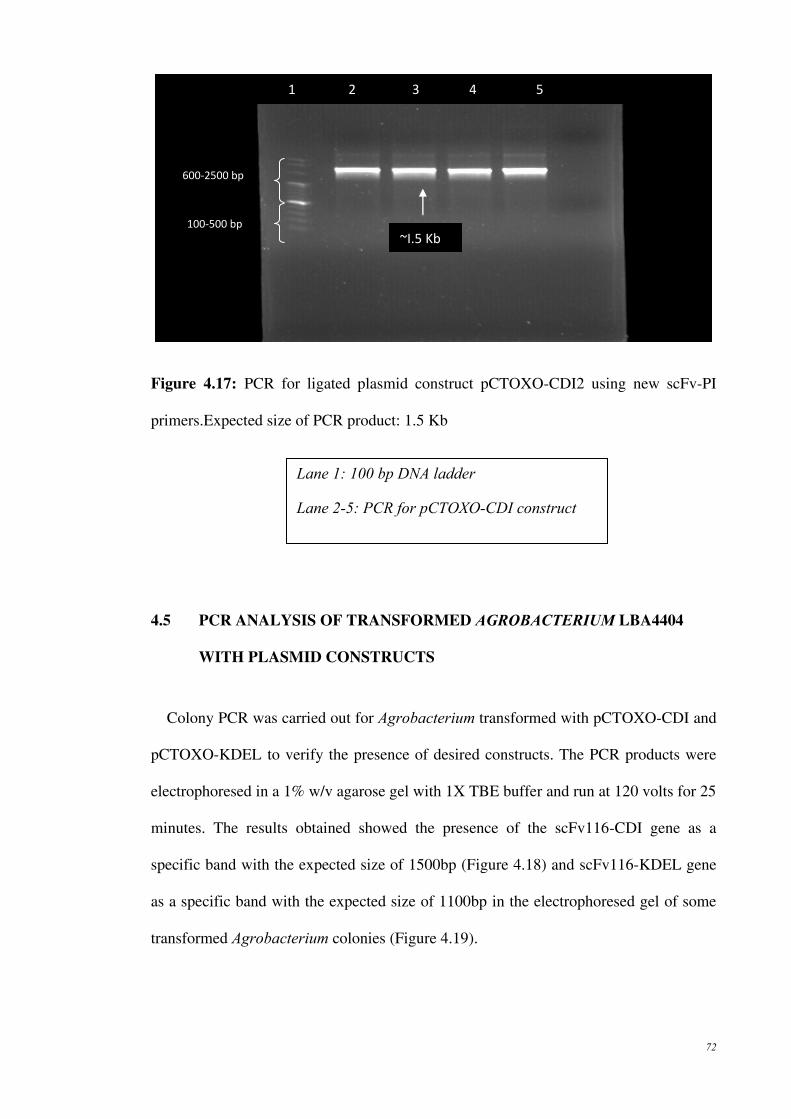
72
Figure 4.17: PCR for ligated plasmid construct pCTOXO-CDI2 using new scFv-PI
primers.Expected size of PCR product: 1.5 Kb
4.5 PCR ANALYSIS OF TRANSFORMED AGROBACTERIUM LBA4404
WITH PLASMID CONSTRUCTS
Colony PCR was carried out for Agrobacterium transformed with pCTOXO-CDI and
pCTOXO-KDEL to verify the presence of desired constructs. The PCR products were
electrophoresed in a 1% w/v agarose gel with 1X TBE buffer and run at 120 volts for 25
minutes. The results obtained showed the presence of the scFv116-CDI gene as a
specific band with the expected size of 1500bp (Figure 4.18) and scFv116-KDEL gene
as a specific band with the expected size of 1100bp in the electrophoresed gel of some
transformed Agrobacterium colonies (Figure 4.19).
1 2 3 4 5
~I.5 Kb
Lane 1: 100 bp DNA ladder
Lane 2-5: PCR for pCTOXO-CDI construct
100-500 bp
600-2500 bp
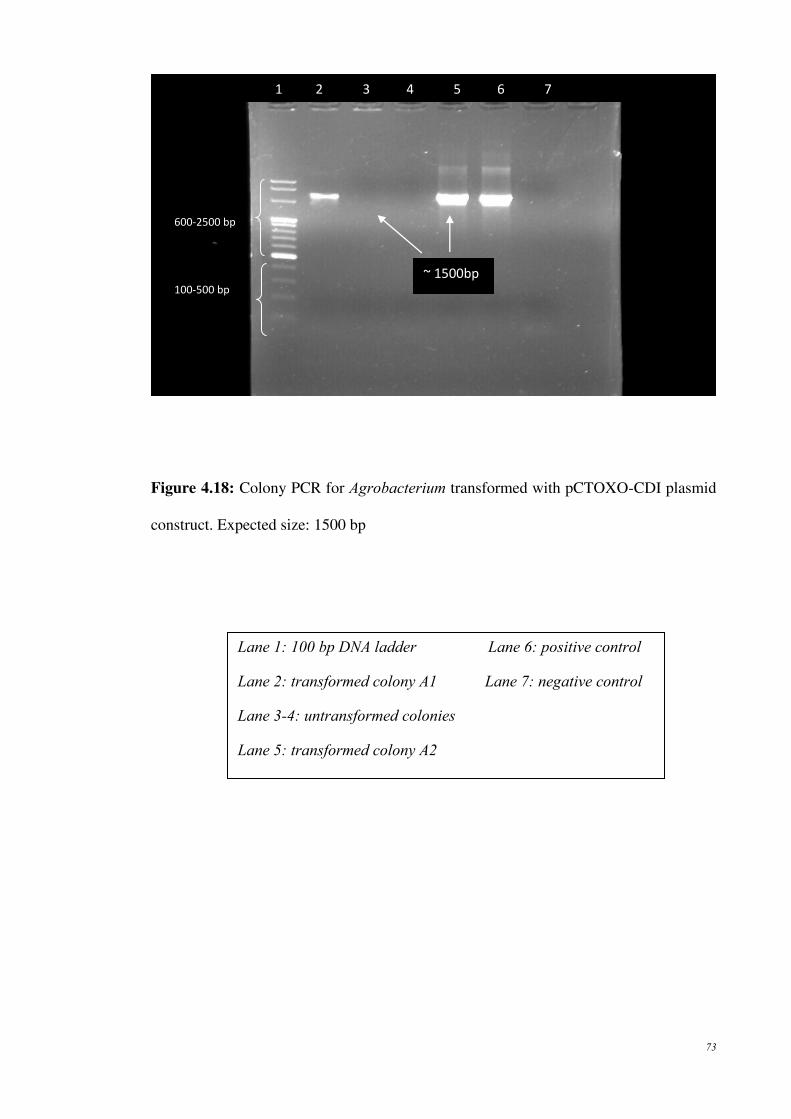
73
Figure 4.18: Colony PCR for Agrobacterium transformed with pCTOXO-CDI plasmid
construct. Expected size: 1500 bp
Lane 1: 100 bp DNA ladder Lane 6: positive control
Lane 2: transformed colony A1 Lane 7: negative control
Lane 3-4: untransformed colonies
Lane 5: transformed colony A2
1 2 3 4 5 6 7
100-500 bp
600-2500 bp
~ 1500bp
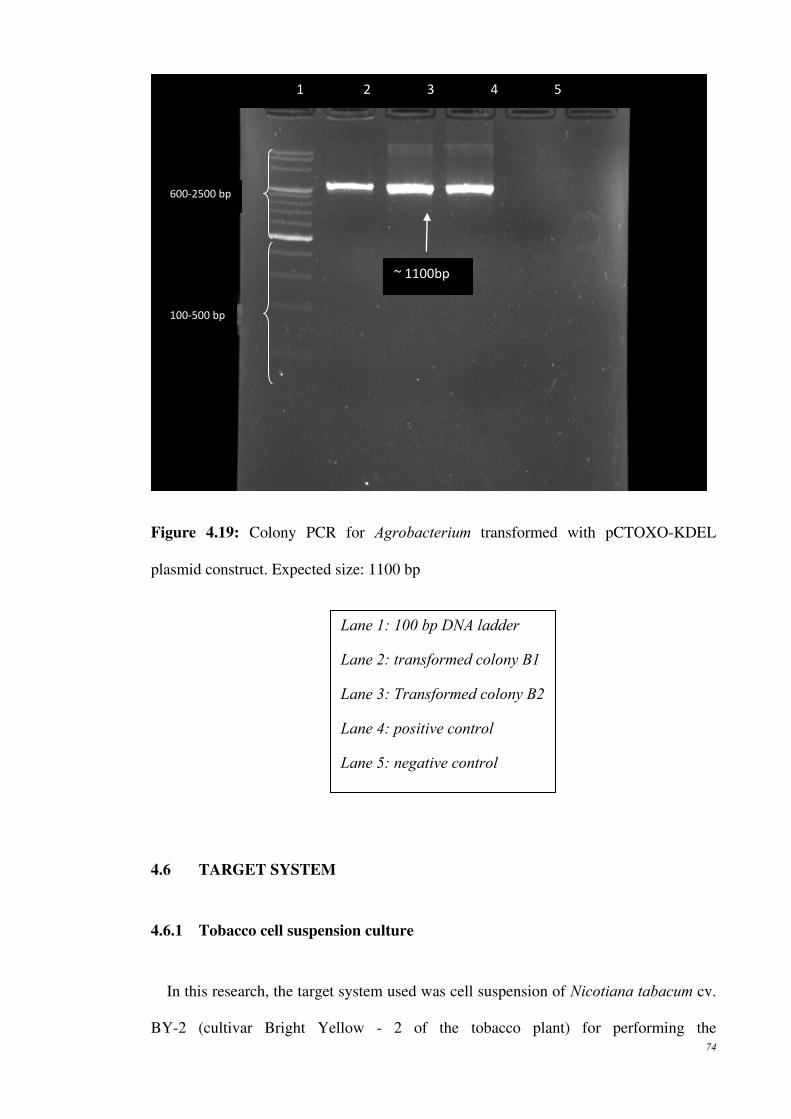
74
Figure 4.19: Colony PCR for Agrobacterium transformed with pCTOXO-KDEL
plasmid construct. Expected size: 1100 bp
4.6 TARGET SYSTEM
4.6.1 Tobacco cell suspension culture
In this research, the target system used was cell suspension of Nicotiana tabacum cv.
BY-2 (cultivar Bright Yellow - 2 of the tobacco plant) for performing the
Lane 1: 100 bp DNA ladder
Lane 2: transformed colony B1
Lane 3: Transformed colony B2
Lane 4: positive control
Lane 5: negative control
1 2 3 4 5
~ 1100bp
100-500 bp
600-2500 bp

75
Agrobacterium-mediated transformation of the two constructs pCTOXO-CDI-KDEL
and pCTOXO-KDEL. The cell suspension was propagated by subculturing as described
in Section 3.8.4. Several flasks of tobacco BY-2 cell suspension were prepared. The
typical tobacco cell suspension is shown in Figure 4.20.
Figure 4.20: Nicotiana tabacum cv. BY-2 cell suspension. Scale bar represents 1 cm.
For each transformed Agrobacterium colony carrying the desired plasmid construct 4
replicates of tobacco cell suspension were prepared. Two colonies for each plasmid
construct were chosen to be transformed into tobacco cells as described in Section 3.9.
The cells were transformed with two plasmid construct pCTOXO-CDI-KDEL and
pCTOXO-KDEL using Agrobacterium-mediated transformation method as described in
Section 3.11. The survival rate of tobacco cell suspension transformed with
Agrobacterium carrying plasmid construct pCTOXO-CDI-KDEL and pCTOXO-KDEL
is summarized in table 4.1.

76
Condition of
cultures
tobacco cell suspension co-
cultivated with pCTOXO-CDI-
KDEL (number of plates used)
tobacco cell suspension co-cultivated
with pCTOXO-KDEL
(number of plates used)
Agrob colony
name
A1 A2 B1 B2
Living plates 4 3 3 4
Contaminated
plates
0 1 1 0
Total plates 4 4 4 4
% survival 100 75 75 100
Table 4.1: Number and percentage of surviving and dead tobacco cell suspension
cultures after 14 days of co-cultivation with Agrobacterium carrying plasmid construct
pCTOXO-CDI-KDEL and pCTOXO-KDEL.
To compare the GUS enzyme activity results obtained by performing the Quantitative
GUS Fluorometric Assay of transformed tobacco cells (A1 vs. B1 and A2 vs. B2), three
living replicate of tobacco cells transformed with each colony were chosen to continue
the experiment to the next step, because the number of samples was required to be equal
for the analysis of data in paired t-test method. Therefore, 1 plate of tobacco cells
transformed with A1 and 1 plate of tobacco cells transformed with B2 were set aside to
have 3 replicates in total from each transformation event.
4.7 QUANTITATIVE GUS FLUOROMETRIC ASSAY
ß-glucuronidase (GUS) is the reporter enzyme of choice for most plant
transformation research. Typically GUS activity in solution is determined with
the fluorogenic substrate 4-methylumbelliferyl ß-D glucuronide (MUG):
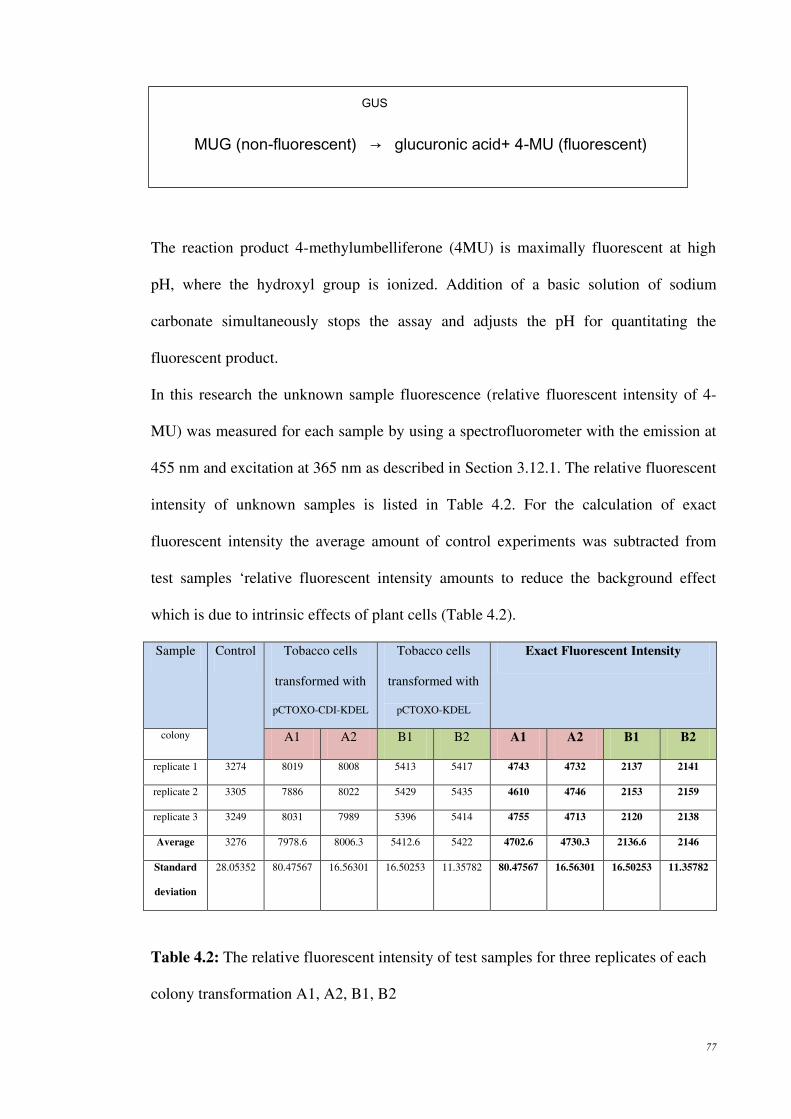
77
The reaction product 4-methylumbelliferone (4MU) is maximally fluorescent at high
pH, where the hydroxyl group is ionized. Addition of a basic solution of sodium
carbonate simultaneously stops the assay and adjusts the pH for quantitating the
fluorescent product.
In this research the unknown sample fluorescence (relative fluorescent intensity of 4-
MU) was measured for each sample by using a spectrofluorometer with the emission at
455 nm and excitation at 365 nm as described in Section 3.12.1. The relative fluorescent
intensity of unknown samples is listed in Table 4.2. For the calculation of exact
fluorescent intensity the average amount of control experiments was subtracted from
test samples ‘relative fluorescent intensity amounts to reduce the background effect
which is due to intrinsic effects of plant cells (Table 4.2).
Sample Control Tobacco cells
transformed with
pCTOXO-CDI-KDEL
Tobacco cells
transformed with
pCTOXO-KDEL
Exact Fluorescent Intensity
colony A1 A2 B1 B2 A1 A2 B1 B2
replicate 1 3274 8019 8008 5413 5417 4743 4732 2137 2141
replicate 2 3305 7886 8022 5429 5435 4610 4746 2153 2159
replicate 3 3249 8031 7989 5396 5414 4755 4713 2120 2138
Average 3276 7978.6 8006.3 5412.6 5422 4702.6 4730.3 2136.6 2146
Standard
deviation
28.05352
80.47567
16.56301
16.50253
11.35782
80.47567
16.56301
16.50253
11.35782
Table 4.2: The relative fluorescent intensity of test samples for three replicates of each
colony transformation A1, A2, B1, B2
GUS
MUG (non-fluorescent) → glucuronic acid+ 4-MU (fluorescent)

78
For calculation of 4-MU amount of the test samples in pmol the Standard Dilution of 4-
Methylumbelliferone was carried out as described in Section 3.12.1.1 and the
fluorescent intensity of different dilutions of 4-MU was obtained as listed in Appendix
I.
The measured fluorescent intensity amounts of 4-MU dilutions were plotted versus
different 4-MU concentrations as shown in Appendix J. From the obtained equation of
the curve the Relative Fluorescent Intensity of the test samples was calculated in pmol
as shown in Table 4.3.
Sample Exact Fluorecsent Intensity 4-MU (pmol)
A1 A2 B1 B2 A1 A2 B1 B2
replicate
1
4743 4732 2137 2141 778.79 775.85 352.45 353.11
replicate
2
4610 4746 2153 2159 755.94 778.13 355.06 356.04
replicate
3
4755 4713 2120 2138 779.60 772.75 349.68 352.62
Average 4702.66 4730.33 2136.66 2146 771.44 775.57 352.39 353.92
Standard Deviation (STDEV) 13.43 2.70 2.69 1.84
Table 4.3: Relative Fluorescent Intensity of test samples (pmol)
Comparison of the standard deviation of A1 vs. A2 shows higher STDEV for A1
samples (13.43 > 2.70). However the mean values (average) of A1 and A2 are very
close (Table 4.3). This indicates the 4-MU measurements of A2 samples in three

79
replicates have closer values in comparison with three A1 replicates. Thus the 4-MU
measurements were more accurate in A2 sample replicates.
Comparison of the standard deviation of B1 vs. B2 shows higher STDEV for B1
samples (2.69 > 1.84). However the mean values (average) of B1 and B2 are very close
(Table 4.3). This indicates the 4-MU measurements of B2 samples in three replicates
have closer values in comparison with three B1 replicates. Thus the 4-MU
measurements were more accurate in B2 sample replicates.
4.7.1 Bradford assay
The protein standard assay was carried out as described in Section 3.12.2.1 to obtain
the protein content of the unknown samples. The obtained OD values for different BSA
protein concentrations listed in Appendix K. Then, the protein standard curve was
plotted to obtain the equation needed to determine the protein content of unknown
samples (Appendix L).
The Bradford protein assay was carried out to obtain the amount of soluble protein in
the unknown samples. The absorbance was read at 595nm for each unknown sample
separately using a spectrophotometer as described in Section 3.12.2. Then, the protein
concentration of unknown samples was determined by using the Bradford protein
standard curve (Appendix L). The OD reading values and protein concentration of
samples are listed in table 4.4. Statistical analysis of total soluble protein concentration
in transformed tobacco cells with two plasmid constructs showed significant difference
(Table 4.4). The testing of paired differences between TSP of transformed tobacco cells
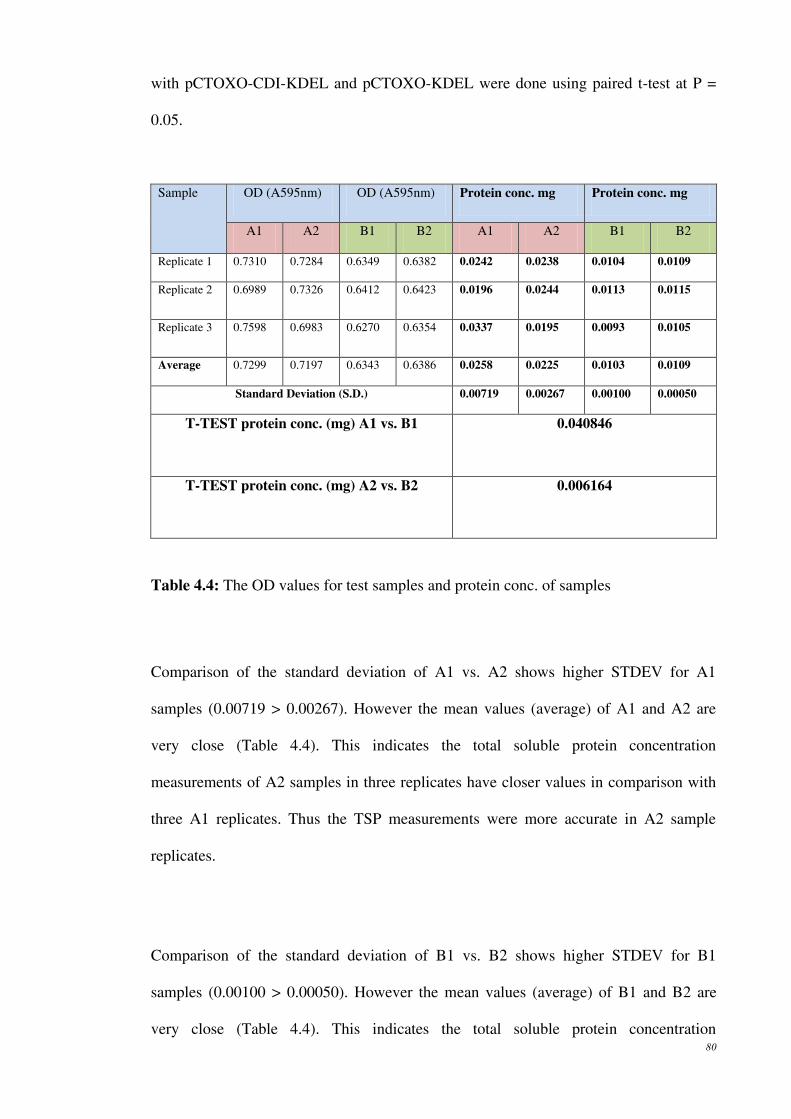
80
with pCTOXO-CDI-KDEL and pCTOXO-KDEL were done using paired t-test at P =
0.05.
Sample OD (A595nm) OD (A595nm) Protein conc. mg Protein conc. mg
A1 A2 B1 B2 A1 A2 B1 B2
Replicate 1 0.7310 0.7284 0.6349 0.6382 0.0242 0.0238 0.0104 0.0109
Replicate 2 0.6989 0.7326 0.6412 0.6423 0.0196 0.0244 0.0113 0.0115
Replicate 3 0.7598 0.6983 0.6270 0.6354 0.0337 0.0195 0.0093 0.0105
Average 0.7299 0.7197 0.6343 0.6386 0.0258 0.0225 0.0103 0.0109
Standard Deviation (S.D.) 0.00719 0.00267 0.00100 0.00050
T-TEST protein conc. (mg) A1 vs. B1 0.040846
T-TEST protein conc. (mg) A2 vs. B2 0.006164
Table 4.4: The OD values for test samples and protein conc. of samples
Comparison of the standard deviation of A1 vs. A2 shows higher STDEV for A1
samples (0.00719 > 0.00267). However the mean values (average) of A1 and A2 are
very close (Table 4.4). This indicates the total soluble protein concentration
measurements of A2 samples in three replicates have closer values in comparison with
three A1 replicates. Thus the TSP measurements were more accurate in A2 sample
replicates.
Comparison of the standard deviation of B1 vs. B2 shows higher STDEV for B1
samples (0.00100 > 0.00050). However the mean values (average) of B1 and B2 are
very close (Table 4.4). This indicates the total soluble protein concentration

81
measurements of B2 samples in three replicates have closer values in comparison with
three B1 replicates. Thus the TSP measurements were more accurate in B2 sample
replicates.
The soluble protein concentration mean values (average) of three sample replicates was
plotted in Figure 4-21 and error bars were indicated on the chart.
Figure 4-21: Comparison of TSP of tobacco cells transformed with pCTOXO-CDI (A1
& A2 colonies) and pCTOXO-KDEL (B1 & B2 colonies).
4.8 COMPARISON OF ENZYME ACTIVITY
The gusA gene enzyme activity was quantified and expressed in pmol 4-MU released
per mg of protein per minute according to 4-MU (pmol) and protein conc. (mg) that
were obtained and listed in Tables 4.3 and 4.4 respectively. The 4-MU enzyme activity
was calculated for samples after 90 minutes reaction as described in Section 3.12.1 and
listed in Table 4.5.
0
0.005
0.01
0.015
0.02
0.025
0.03
0.035
mean value of Prot Conc. (mg)
Tobacco cells transformed with
pCTOXO-CDI(A1) pCTOXO-CDI(A2) pCTOXO-KDEL(B1) pCTOXOKDEL(B2)
A1 A2 B1 B2

82
Statistical analysis of GUS activity in transformed tobacco cells with two plasmid
constructs did not show any significant difference (Table 4.5). The testing of paired
differences between GUS activity of transformed tobacco cells with pCTOXO-CDI-
KDEL and pCTOXO-KDEL were done using paired t-test at P = 0.05.
Table 4.5: Comparison of 4-MU enzyme activity between A1 vs. B1 and A2 vs. B2
samples.. 4-MU enzyme activity expressed in pmol/mg. protein/min for tobacco cells
transformed with pCTOXO-CDI-KDEL (A1 and A2 Agrob colonies) and pCTOXO-
KDEL (B1 and B2 Agrobacterium colonies).
Sam
ple
4-MU (pmol) 4-MU
(pmol)
Protein conc.
mg
Protein conc.
mg
4-MU
(pmol)/mg
prot/min
4-MU
(pmol)/mg
prot/min
A1 A2 B1 B2 A1 A2 B1 B2 A1 A2 B1 B2
1 778.79 775.85 352.45 353.11 0.0242 0.0238 0.0104 0.0109 357.571 362.208 376.549 359.949
2 755.94 778.13 355.06 356.04 0.0196 0.0244 0.0113 0.0115 428.537 354.339 349.124 344.000
3 779.60 772.75 349.68 352.62 0.0337 0.0195 0.0093 0.0105 257.039 440.313 417.777 373.143
Av
erag
e
771.44 775.57 352.39 353.92 0.0258 0.0225 0.0103 0.0109 347.71 385.62 381.15 359.03
Standard Deviation 86.172
47.528
34.556
14.593
T-TEST enzyme activity (4-MU: pmol/mg/min) A1 vs. B1 0.339395
T-TEST enzyme activity (4-MU: pmol/mg/min) A2 vs. B2 0.16136

83
The GUS activity mean values (average) expressed in 4-MU/mg protein/min of three
sample replicates was plotted in Figure 4-22 and error bars were indicated on the chart.
Figure 4.22: Comparison of the level of GUS Activity of the transformed tobacco cells
with two different plasmid constructs.
310
320
330
340
350
360
370
380
390
400
A1 A2 B1 B2 Tobacco cells transformed with
pCTOXO-CDI(A1) pCTOXO-CDI(A2) pCTOXO-KDEL(B1) pCTOXO-KDEL(B2)
Mean value of GUS Activity
pmol MU/mg protein/min
84
CHAPTER 5: DISCUSSION
In this research tobacco cell suspension were selected as host systems for testing of
scFv constructs enhanced using protease inhibitor elements. Although no positive
results were obtained using the banana cell suspensions, the scFv anti-toxoplasmosis
gene ligated to Cathepsin D Inhibitor in pCTOXO-CDI-KDEL and also ligated to
KDEL fragment in pCTOXO-KDEL was shown to be putatively transformed and
expressed in tobacco cells as demonstrated by GUS fluorometric Assay.
The gene transfer and expression technology in tobacco cells is well-established. The
high biomass yield is one of the major advantages of tobacco plant as a host system. So
it can be a major source of plant-derived recombinant antibodies. (Twyman et al.,
2007).
The effect of Plant Protease Inhibitor (CDI) on the expression of the heterologous scFv
anti-toxoplasmosis gene was then investigated by comparing the total soluble protein
(TSP) and GUS activity in tobacco cells transformed with two different constructs with
protease inhibitor (pCTOXO-CDI-KDEL) or with the ER-targetting element KDEL(
pCTOXO-KDEL). The measurement of total soluble protein content in the transformed
cells and GUS assay analysis can only assess the preliminary positive effects of CDI
protease inhibitor in recombinant protein production in plant cells, but as these methods
are preliminary assessments for measuring positive transformation events, presence of
higher total soluble protein content (Table 4.4 and Figure 4.21) in cells transformed
with TOXO gene may not necessarily resulted from the effect of the CDI protease
inhibitor.

85
5.1 PLASMID CONSTRUCT DEVELOPMENT
In this research the development of three pCTOXO-PI plasmid constructs expressed
as pCTOXO-BBTI, pCTOXO-CDI and pCTOXO-OCPI was attempted by ligating RE
digested scFv anti-toxoplasmosis and PI genes DNA fragments and cloning into
pCAMBIA 1301vector.
5.1.1 Verification of Ligation
PCR was carried out on ligation mixture using scFv primers and scFv-PI flanking
primers as described in Section 3.5. The PCR products amplified using scFv primers
confirmed the presence of scFv gene ligated to pCAMBIA 1301 vector on gel
electrophoresis (Figure 4.12 and 4.13). However, the results obtained from PCR work
with scFv-PI flanking primers unexpectedly did not show the presence of correct band
size of ligated scFv-PI product in PCR gel electrophoresis (Figure 4.14, 4.15 and 4.16).
The failure of desired plasmid constructs pCTOXO-PI development was also verified
by sequencing analysis as was described in Section 4.4.1.2. The sequencing results
showed the presence of scFv gene ligated to pCAMBIA 1301 vector but the PI gene
sequence was missing in the sequencing result (Appendix D).
5.1.1.1 Failure of plasmid constructs pCTOXO-PI development
The ligation of scFv gene to pCAMBIA 1301 vector was verified by sequencing as
described in Section 4.4.1.2. But no ligation of the PI genes was detected. This failure
could be due to mismatching of compatible sticky ends (Clark, 2005). BamHI and BglII
generate the same overhanging or sticky ends. It means BamHI and BglII generate

86
different-but-compatible ends. BamHI recognizes the sequence 5’-GGATCC-3’ and
cuts after the first 5’ G, which generates the 3’-CTAG-5’ overhang on the bottom
strand. BglII recognizes the sequence 5’-AGATCT-3’ and cuts after the first 5’ A,
which generates a 5’-GATC-3’ overhang on the top strand. If these two pieces are
allowed to anneal, the complementary sequences will hydrogen bond together, allowing
the nicks to be sealed more easily by DNA ligase as shown in Figure 5.1. In this
research the scFv gene had BamHI sticky ends at 5’ end and the vector pCAMBIA 1301
was digested using NcoI and BglII as described in Section 3.3.3. Therefore, the two
BamHI and BglII sticky ends might ligate together despite the fact that BamHI and
BglII generate different ends. Missing (deletion or point mutations) of some parts of
nucleotide sequences in PI genes or pCAMBIA 1301 backbone could be the other
probability that the desired constructs of pCTOXO-PI failed to develop. Because of this
another construct was developed in a parallel study (pCTOXO-CDI-KDEL) and was
used for comparative analysis with the constructed pCTOXO-KDEL.
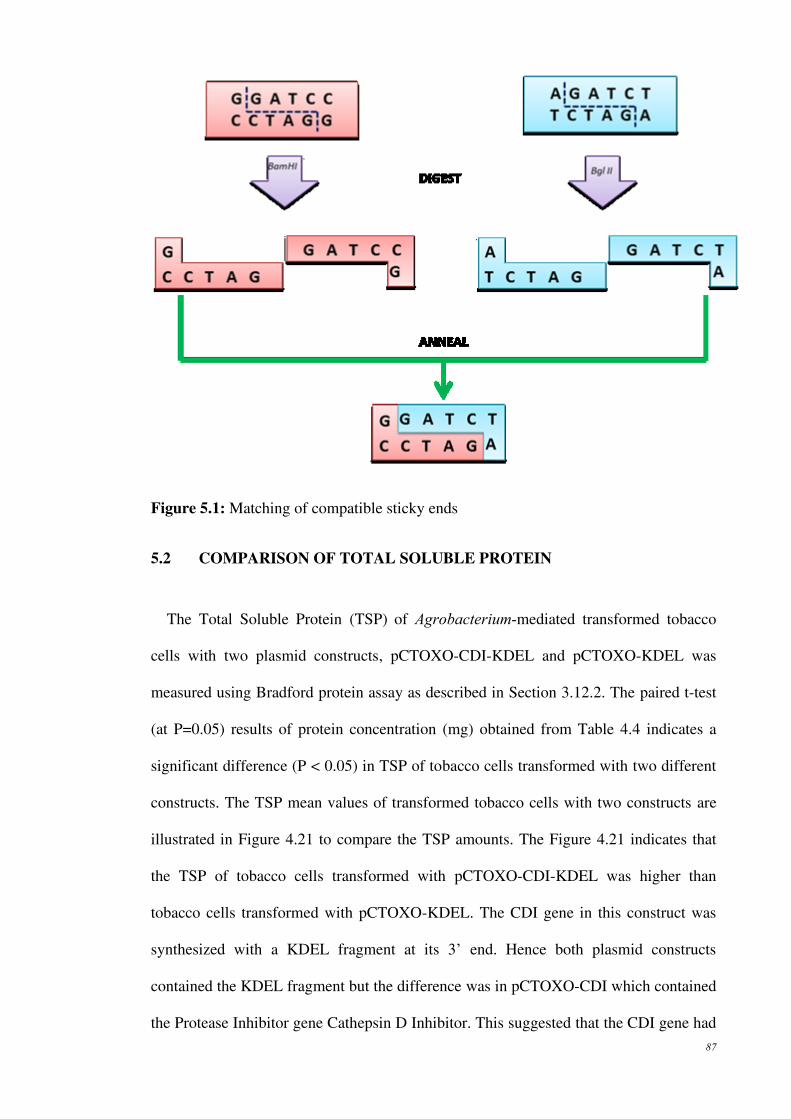
87
Figure 5.1: Matching of compatible sticky ends
5.2 COMPARISON OF TOTAL SOLUBLE PROTEIN
The Total Soluble Protein (TSP) of Agrobacterium-mediated transformed tobacco
cells with two plasmid constructs, pCTOXO-CDI-KDEL and pCTOXO-KDEL was
measured using Bradford protein assay as described in Section 3.12.2. The paired t-test
(at P=0.05) results of protein concentration (mg) obtained from Table 4.4 indicates a
significant difference (P < 0.05) in TSP of tobacco cells transformed with two different
constructs. The TSP mean values of transformed tobacco cells with two constructs are
illustrated in Figure 4.21 to compare the TSP amounts. The Figure 4.21 indicates that
the TSP of tobacco cells transformed with pCTOXO-CDI-KDEL was higher than
tobacco cells transformed with pCTOXO-KDEL. The CDI gene in this construct was
synthesized with a KDEL fragment at its 3’ end. Hence both plasmid constructs
contained the KDEL fragment but the difference was in pCTOXO-CDI which contained
the Protease Inhibitor gene Cathepsin D Inhibitor. This suggested that the CDI gene had

88
an effect on the TSP in tobacco cells transformed with pCTOXO-CDI. The CDI gene
was suggested to inhibit the endogenous proteases of tobacco cells that degrade the
heterologous protein in plant cells leading to higher TSP measurements in cells carrying
it. These results concurred with a report by Michaud et al., (2005) and Rivard et al.,
(2006). Hence suggesting this strategy would be suitable for enhancing the production
of anti-toxoplasmosis antibodies in plant cells.
5.3 COMPARISON OF ENZYME ACTIVITY
The GUS reporter gene transformation efficiencies were monitored by plasmid
pCAMBIA1304 transformation into cell suspension of tobacco cultivar BY-2 via
Agrobacterium-mediated transformation. The evaluation of the effect of plant protease
inhibitor gene (CDI) on the expression of heterologous gene (scFv anti-toxoplasmosis)
in tobacco cells was based on quantitative fluorometric assay analysis of GUS
expression.
The ß-glucuronidase was visualized as fluorescence blue color in tobacco cell extracts
indicating positive transformation event as described in Section 3.12.1. Since the ß-
glucuronidase was designed as a fusion construct with the gene of interest in the
plasmid construct therefore, observation the presence of ß-glucuronidase could imply
the possible successful expression of scFv-CDI-KDEL and scFv-KDEL genes in the
transformed tobacco cells. Reporter genes like ß-glucuronidase encode for messages
which would clearly indicate the transient or stable expression of the transferred genes
in the transgenic cells (Slater et al., 2003).
In this research, the quantitative fluorometric assays of GUS activity demonstrated the
transcript level of GUS gene in the putative transformed tobacco cells with plasmid

89
pCTOXO-CDI-KDEL and pCTOXO-KDEL. The presence of ß-glucuronidase enzyme
will cleave the fluorogenic substrate 4-methylumbelliferyl β- D glucuronide (MUG) to
produce fluorescent 4- methylumbelliferone (4-MU) (Jefferson et al., 1987). The
Agrobacterium transformed tobacco cells were incubated for two weeks to allow cell
growth and stable gusA gene integration before fluorometric assay was performed.
Figure 4.22 indicates that the transient gene expression level was detected
fluorometrically in tobacco plant cell extracts prepared two weeks after Agrobacterium-
mediated transformation experiment, regardless of the plasmid construct used. In
comparison to the transformed tobacco cells, higher total protein (mg) production level
(TSP) was achieved for pCTOXO-CDI-KDEL transformed cells base on Bradford assay
(Table 4.4 and Figure 4.21). However the statistical analysis (paired t-test) of the GUS
activity (pmol 4-MU/mg protein/min) for the putative transformed tobacco cells
revealed no significant (P > 0.05) differences between pCTOXO-CDI-KDEL and
pCTOXO-KDEL (Table 4.5). This finding was probably due to inadequate sample
replicates for performing paired t-test. Future work should include more replicates to
obtain more statistically accurate results.
These preliminary results suggested that protease inhibitor genes may present a viable
strategy for enhancing levels of production of scFv proteins in plant cells. Further
studies are needed to establish the functionality of scFv protein and the integration of
scFv-CDI gene into the plant genome and also improve transformation protocol in
banana cells.
90
CHAPTER 6: CONCLUSION
The anti-toxoplasmosis scFv gene (TOXO) ligated to CDI plant protease inhibitor gene
was putatively transformed into Nicotiana tabacum cv. BY-2 cell suspension using
pCTOXO-CDI-KDEL. In addition, the scFv anti-toxoplasmosis gene ligated to KDEL
fragment was also putatively transformed into tobacco cells using pCTOXO-KDEL by
Agrobacterium-mediated transformation method.
The effect of co-expression of plant protease inhibitor (CDI) on the expression of scFv
heterologous gene in plant cells was investigated by GUS fluorometric assay and
Bradford protein assay. The transient gene expression level was detected
fluorometrically in tissue extracts of tobacco cells and the TSP of transformed tobacco
cells was measured by Bradford assay.
The TSP of tobacco cells transformed with pCTOXO-CDI appeared to be higher than
tobacco cells transformed with pCTOXO-KDEL in Bradford protein assay. Therefore,
suggesting the positive effect of co-expression of Plant Protease Inhibitor (CDI) on the
expression of heterologous gene scFv anti-toxoplasmosis in tobacco cells.

91
6.1 FUTURE STUDIES
The results obtained from assessment of the GUS asaay analysis and total soluble
protein contents measurement are considered as preliminary findings for the real effects
of protease inhibitor in the transformed plant cells. Therefore, further research has to be
conducted to strength the results obtained.
The expression level of scFv anti-toxoplasmosis gene ligated to CDI and KDEL genes
was not verified in this research therefore, further studies need to be carried out to
determine the expression level of the recombinant protein using two different
constructs. The functionality of scFv anti-toxoplasmosis protein was also not studied
thus indicating the need for further research in this area.
92
REFERENCE:
1. Artsaenko, O., Kettig, B., Fiedler, U., Conrad, U. and During, K. (1998). Potato
tubers as a biofactory for recombinant antibodies. Molecular Breeding. 4: 313–319.
2. Benchabane, M., Goulet, C., Rivard, D., Faye, L., Gomord, V. and Michaud, D.
(2008). Preventing unintended proteolysis in plant protein biofactories. Plant
Biotechnology, 6: 633-648.
3. Birch-Machin, I., Newell, C.A., Hibberd, J.M. and Gray, J.C. (2004). Accumulation
of rotavirus VP6 protein in chloroplasts of transplastomic tobacco is limited by
protein stability. Plant Biotechnology Journal. 2: 261–270.
4. Bradford, M. (1976). A rapid and sensitive method for the quantitation of
microgram quantities of protein utilizing the principle of protein-dye binding.
Analytical Biochemistry. 72:248-254.
5. Callis, J. (1995). Regulation of protein degradation. Plant Cell, 7: 845–857.
6. Clark, D.P. (2005). Molecular Biology. Academic Press.600-607.
7. Compton, S.J. and Jones, C.G. (1985). Mechanism of dye response and interference
in the Bradford protein assay. Analytical Biochemistry. 151: 369-374.
8. Daniell, H., Streatfield, S.J. and Wyocoff, K. (2001). Medical molecular farming:
production of antibodies, biopharmaceuticals and edible vaccines in plants. Trends
in Plant science. 6: 219-226.
9. Daniell, H., Khan, M.S. and Allison, L. (2002). Milestones in chloroplast genetic
engineering: an environmentally friendly era in biotechnology. Trends Plant Sci. 7:
84–91.
10. Daniell H., Kumar S. and Dufourmantel N. (2005). Breakthrough in chloroplast
genetic engineering of agronomically important crops. Trends in Biotechnology, 23:
238-245.

93
11. Daniell, H. (2006). Production of biopharmaceuticals and vaccines in plants via the
chloroplast genome. Biotechnology. 1: 1071–1079.
12. Deneke, J., Botterman, J. and Deblaere, R. (1990). Protein secretion in plant cells
can occur via a default pathway. Plant Cell. 2: 51-59.
13. Doran, PM. (2006). Foreign protein degradation and instability in plants and plant
tissue cultures. Elsevier Trends in Biotechnology. vol.24 No.9.
14. Faye, L., Boulaflous, A., Benchabane, M., Gomord, V. and Michaud, D. (2005).
Protein modifications in the plant secretory pathway: current status and practical
implications in molecular pharming. Vaccine, 23: 1770-1778.
15. Fernandez-San Millan, A., Mingo-Castel, A., Miller, M. and Daniell, H. (2003). A
chloroplast transgenic approach to hyper-express and purify human serum albumin,
a protein highly susceptible to proteolytic degradation. Plant Biotechnology. 1: 71–
79.
16. Fiedler, U. and Conrad, U. (1995). High-level production and longterm storage of
engineered antibodies in transgenic tobacco seeds. Bio/Technology, 13: 1090–1093.
17. Fischer, R., Emans, N., Schuster, F., Hellwig, S. and Drossard, J. (1999). Towards
molecular farming in the future: using plant cell suspension cultures as bioreactors.
Biotechnol App Biochem. 30: 109-112.
18. Galili, G., Sengupta-Gopalan, C. and Ceriotti, A. (1998). The endoplasmic
reticulum of plant cells and its role in protein maturation and biogenesis of oil
bodies. Plant Molecular Biology. 38: 1–29.
19. Goulet, C. and Michaud, D. (2006). Degradation and stabilization of recombinant
proteins in plants. In: Floriculture, Ornamental and Plant Biotechnology, Vol. IV
(Taxeira da Silva, J., ed.), pp. 35–40. London: Global Science Books.
20. Gupta, S. Codon Optimization. (2003). Retrieved December 20, 2010, from
http://www.guptalab.org/shubhg/pdf/shubhra_codon.pdf.

94
21. Hajdukiewicz, P., Svab, Z., Maliga, P., (1994). The small versatile pPZP family of
Agrobacterium binary vectors for plant transformation. Plant Mol Biol 25:989-994
22. Hellwig, S., Drossard, J., Twyman, RM. and Fischer, R. (2004). Plant cell cultures
for the production of recombinant proteins. Nature Biotechnol, 22: 1415-1422.
23. Hendy, S., Chen, ZC., Barker, H., Santa Cruz, S., Chapman, S., Torrance, L.,
Cockburn, W., Whitelam, GC. (1999). Rapid production of single-chain Fv
fragments in plants using a potato virus X episomal vector. Journal Immunol
Methods. 231: 137-146
24. Hiatt, A., Cafferkey, R. and Bowdish, K. (1989). Production of antibodies in
transgenic plants. Nature, 342: 76-8.
25. Hyunjong, B., Lee, D.S. and Hwang, I. (2006) Dual targeting of xylanase to
chloroplasts and peroxisomes as a means to increase protein accumulation in plant
cells. Journal of Experimental Botany. 57: 161–169.
26. Jefferson, R.A., Kavanagh, T.A. and Bevan, M.W. (1987). GUS fusions: B-
glucuronidase as a sensitive and versatile gene fusion marker in higher plants.
EMBO Journal. 6: 3901-3907.
27. Jeon, G.A., Eum, J.S. and Sim, W.S. (1998). The role of inverted repeat (IR)
sequence of the virE gene _expression in Agrobacterium tumefaciens pTiA6.
Molecules and Cells, 8: 49-53.
28. Joosten, V., Lokman, C., Cees A.M.J.J Van Den Hondel and Punt, PJ. (2003). The
production of antibody fragments and antibody fusion proteins by yeasts and
filamentous fungi. Microbial cell factories, 2: 1-7.
29. Jung, E. and Williams, KL. (1997). The production of recombinant glycoproteins
with special reference to simple eukaryotes including Dictyostelium dicoideum.
Biotechnol. Appl. Biochem. 25: 3-10.
95
30. Kato, Y., Murakami, S., Yamamoto, Y., Chatani, H., Kondo, Y., Nakano, T.,
Yokota, A. and Sato, F. (2004). The DNA-binding protease, CND41, and the
degradation of ribulose-1,5-biphosphate carboxylase/oxygenase in senescent leaves
of tobacco. Planta, 220: 97–104.
31. Kato, Y., Yamamoto, Y., Murakami, S. and Sato, F. (2005) Posttranslational
regulation of CND41 protease activity in senescent tobacco leaves. Planta, 222:
643–651.
32. Komarnytsky, S., Borisjuk, N., Yakoby, N., Garvey, A. and Raskin, I. (2006).
Cosecretion of protease inhibitor stabilizes antibodies produced by plant roots. Plant
Phisiology, 141: 1185-1193.
33. Kusnadi, A.R., Nikolov, Z.L. and Howard, J.A. (1997). Production of recombinant
proteins in transgenic plants: Practical considerations. Biotechnology and
Bioengineering. 56: 473-484.
34. Lelivelt C.L., McCabe M.S., Newell C.A., Desnoo C.B., van Dun K.M., Birch-
Machin I., Gray J.C., Mills K.H. and Nugent J.M. (2005). Stable plastid
transformation in lettuce (Lactuca sativa L.) Plant Molecular Biology, 58: 763-774.
35. Lin, J.F. and Wu, S.H. (2004). Molecular events in senescing Arabidopsis leaves.
Plant Journal. 39: 612–628
36. Lu, Y., Wu, X., Xu, Z., Li, Q. and Deng, X. (2004). Advances in Dictyostelium
discoideum as an expression system. Chemistry Journal, 6: 58-68.
37. Ma, J., Hiatt, A., Hain, M., Vine, N.D., Wang, F., Stabila, P., van Dolleweerd, C.,
Mostov, K. and Lherner, T. (1995). Generation and assembly of secretory antibodies
in plants. Nat. Rev. Genet. 268: 716-719.
38. Ma, J.K., Drake, P.M. and Christou, P. (2003). The production of recombinant
pharmaceutical proteins in plants. Nature Reviews Genetics. 4: 794–805.
96
39. Mackenzie, S.A. (2005). Plant organellar protein targeting: a traffic plan still under
construction. Trends Cell Biology. 15: 548–554.
40. Michaud, D., Anguenot, R. and Brunelle, F. (2005). Method for increasing protein
content in plant cells. US Patent application, 2005/0055746.
41. Nagata, T., Nemoto, Y., Hasezawa, S. (1992). Tobacco BY-2 cell line as the "HeLa"
cell in the cell biology of higher plants. International Review of Cytology. 132: 1-
30.
42. Nouaille., Luciana. AR., Anderson, M., Pontes, D., Le Loir, Y., Sergio, CO.,
Phillippe, L. and Vasco, A. (2003). Heterologous protein production and delivery
systems for Lactococcus lactis. Genet. Mol. Res., 2: 102-111.
43. Nugent G.D., Coyne S., Nguyen T.T. and Kavanagh T.A., Dix P.J .(2006). Nuclear
and plastid transformation of Brassica oleracea var. botrytis (cauliflower) using
PEG-mediated uptake of DNA into protoplasts. Plant Science. 170: 135-142.
44. Nuttall, J., Vine, N., Hadlington, J.L., Drake, P., Frigerio, L. and Ma, J.K. (2002).
ER-resident chaperone interactions with recombinant antibodies in transgenic
plants. Eur. J. Biochemistry. 269: 6042–6051.
45. Opabode, J.T. (2002). Factors influencing transformation of crops by
Agrobacterium tumefaciens. A review seminar presented at Department of Plant
Science, Obafemi Awolowo University, Nigeria, 23 March 2002.
46. Opabode, J.T. (2006). Agrobacterium-mediated transformation of plants: emerging
factors that influence efficiency. Biotechnology and Molecular Biology Review. 1:
12-20.
47. Otegui, M.S., Noh, Y.S., Martinez, D.E., Vila Petroff, M.G., Staehlin, L.A.,
Amasino, R.M. and Guiamet, J.J. (2005). Senescence associated vacuoles with
intense proteolytic activity develop in leaves of Arabidopsis and soybean. Plant
Journal. 41: 831–844.

97
48. Outchkourov, N.S., Rojelj, B., StrukelJ, B. and Jongsma, M.A. (2003). Expression
of sea anemone equistatin in potato. Effects of plant proteases on heterologous
protein production. Plant physiology, 133: 379-390.
49. Parrott, D., Yang, L., Shama, L. and Fischer, A.M. (2005). Senescence is
accelerated and several proteases are induced by carbon ‘feast’ conditions on barley
(Hordeum vulgare L.) leaves. Planta, 222: 989–1000.
50. Pagny, S., Cabanes-Macheteau, M., Gillikin, J.W., Leborgne-Castel, N., Lerouge,
P., Boston, R.S., Faye, L. and Gomord, V. (2000). Protein recycling from the golgi
apparatus to the endoplasmic reticulum in plants and its minor contribution to
calreticulin retention. Plant Cell, 12: 739–756.
51. Park, M., Kim, S.J., Vitale, A. and Hwang, I. (2004). Identification of the protein
storage vacuole and protein targeting to the vacuole in leaf cells of three plant
species. Plant Physiology. 134: 625–639.
52. Rai, M. and Padh, H. (2001). Expression systems for production of heterologous
proteins. Current Science, 80: 1121-1128.
53. Richter, L.J., Thanavala, Y., Arntzen, C.J. and Mason, H.S. (2000). Production of
Hepatitis B surface antigen in transgenic plants for oral immunization. Nature
Biotechnology, 18: 1167-1171.
54. Rivard, D., Anguenot, R., Brunelle, F., Le, V.Q., Vezina, L.P., Trepanier, S. and
Michaud, D. (2006). An in-built proteinase inhibitor system for the protection of
recombinant proteins recovered from transgenic plants. Plant Biotechnology, 4: 359-
368.
55. Robinson, D.G., Oliviusson, P. and Hinz, G. (2005). Protein sorting to the storage
vacuoles of plants: a critical appraisal. Traffic, 6: 615–625.
56. Ryan, K.J. and Ray, C.G. (editors) (2004). Sherris Medical Microbiology (4th ed.).
McGraw Hill. pp. 723–7.

98
57. Schaller, A. (2004) A cut above the rest: the regulatory function of plant proteases.
Planta, 220: 183–197.
58. Sharp, J.M. Doran, P.M. (2001). Characterization of monoclonal antibody fragments
produced by plant cells. Biotechnology and Bioengineering. 73: 338-346.
59. Shewry, P.R. and Halford, N.G. (2002). Cereal seed storage proteins: structures,
properties and role in grain utilization. Journal of Experimental Botany. 53: 947–
958.
60. Slater, A., Scott, N. and Fowler, M. (2003). Plant biotechnology: The genetic
manipulation of plants. New York: Oxford University Press. pp. 55-58.
61. Smith, M.L., Keegan, M.E., Mason, H.S. and Shuler, M.L. (2002). Factors
Important in the Extraction, Stability and in vitro Assembly of the Hepatitis B
Surface Antigen Derived from Recombinant Plant Systems. Biotechnology
Progress, 18: 538-550.
62. Stein, K.E. Webber, K.O. (2001). The regulation of biologic products derived from
bioengineered plants. Current opinion in biotechnology. 12: 308-311.
63. Stevens, L.H., Stoopen, G.M., Elbers, I.J.W., Molthoff, J.W., Bakker, H.A.C.,
Lommen, A.,Bosch, D. and Jordi, W. (2000). Effect of climate conditions and plant
developmental stage on the stability of antibodies expressed in transgenic tobacco.
Plant Phisiology. 124: 173-182.
64. Stoger, E., Vaquero, C., Torres, E., Sack, M., Nicholson, L., Drossard, J., Williams,
S., Keen, D., Perrin, Y., Christou, P. and Fischer, R. (2000). Cereal crops as viable
production and storage systems for pharmaceutical scFv antibodies. Plant Molecular
Biology. 42: 583–590.
65. Stoger, E., Ma, J.K., Fischer, R. and Christou, P. (2005). Sowing the seeds of
success: pharmaceutical proteins from plants. Curr. Opin. Biotechnology. 16: 167–
173.
99
66. Torda, A. (2001). Toxoplasmosis. Are cats really the source?. Australian Family
Physician, 30 (8): 743–7.
67. Torres, E., Vaquero C., Nicholson, L., Sack, M., Stoger, E., Drossard, J., Christou,
P., Fischer, R. and Perrin, Y. (1999). Rice cell culture as an alternative production
system for functional diagnostic and therapeutic antibodies. Transgenic Res. 8: 441-
449.
68. Twyman, RM., Schillberg, S. and Fischer, R. (2007). P.Ranalli (editor).
Improvement of Crop Plants for Industrial End Uses: Molecular farming of
antibodies in plants. Springer, 435-469.
69. van der Vyver, C., Schneidereit, J., Driscoll, S., Turner, J., Kunert, K. and Foyer,
C.H. (2003). Oryzacystatin I expression in transformed tobacco produces a
conditional growth phenotype and enhances chilling tolerance. Plant Biotechnology.
1: 101–112.
70. Vierstra, R.D. (2003) The ubiquitin/26S proteasome pathway, the complex last
chapter in the life of many plant proteins. Trends Plant Sci. 8: 135–142.
71. Vitale, A. and Hinz, G. (2005). Sorting of proteins to storage vacuoles: How many
mechanisms? Trends Plant Science. 10: 316–323.
72. Wandelt, C.I., Khan, M.R., Craig, S., Schroeder, H.E., Spencer, D. and Higgins, T.J.
(1992). Vicilin with carboxy-terminal KDEL is retained in the endoplasmic
reticulum and accumulates to high levels in the leaves of transgenic plants. Plant
Journal. 2: 181–192.
73. Watson, J.M., Fusaro, A.F., Wang, M. and Waterhouse, P.M. (2005). RNA silencing
platforms in plants. FEBS Letters. 579: 5982–5987.
74. Whitelam, GC. and Cockburn, W. (1997). Plantibodies: antibodies produced in
transgenic plants. The Biochemist, 19: 7-9.

100
75. Yang, J., Barr, L.A., Fahnestock, S.R. and Liu, Z. (2005). High yield recombinant
silk-like protein production in transgenic plants through protein targeting.
Transgenic research, 14: 313-324.
76. Yazaki, PJ. and Wu AM. (2004). Expression of recombinant antibodies in
mammalian cell lines. Methods Mol Biol, 248: 255-68.
77. Zupan, J., Muth, T.R, Draper, O. and Zambryski, P. (2000). The transfer of DNA
from Agrobacterium tumefaciens into plants: A feast of fundamental insights. The
Plant Journal, 23: 11-28.
78. pCambia vectors. Retrieved September 7,2010, from
http://www.cambia.org/daisy/cambia/585.html

101
APPENDICES
102
APPENDIX - A

103

104

105
106

107

108

109

110

111

112

113
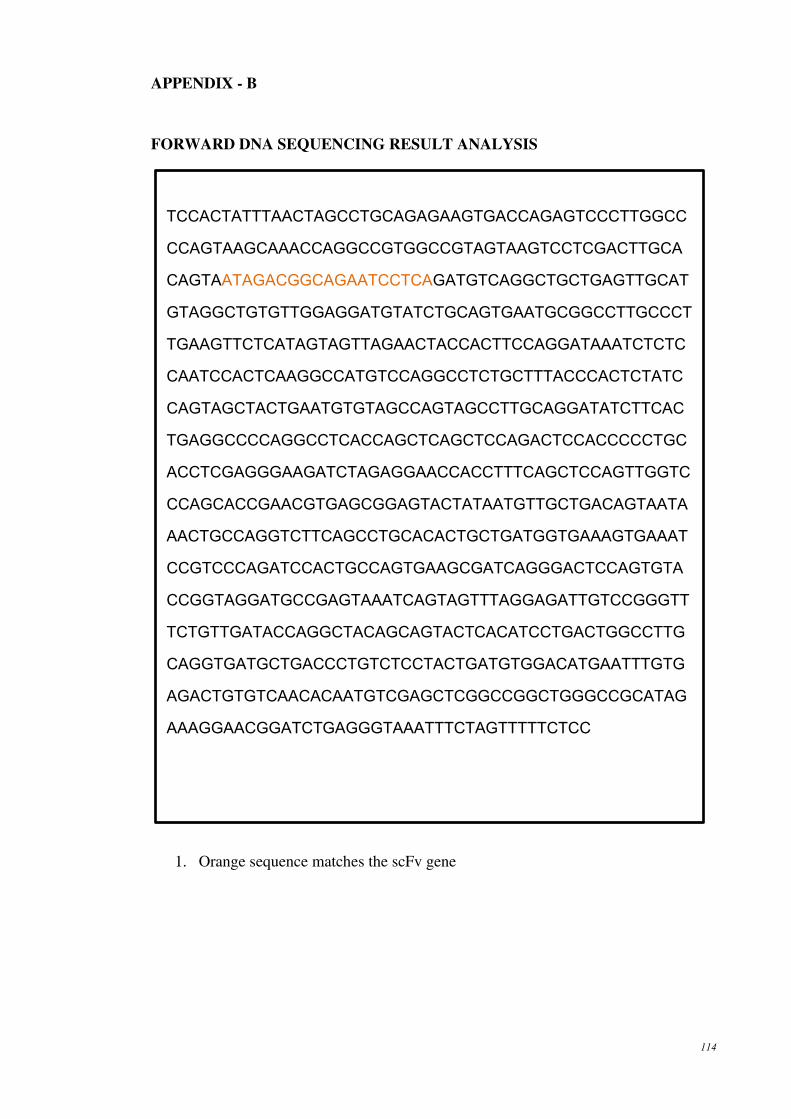
114
APPENDIX - B
FORWARD DNA SEQUENCING RESULT ANALYSIS
1. Orange sequence matches the scFv gene
TCCACTATTTAACTAGCCTGCAGAGAAGTGACCAGAGTCCCTTGGCC
CCAGTAAGCAAACCAGGCCGTGGCCGTAGTAAGTCCTCGACTTGCA
CAGTAATAGACGGCAGAATCCTCAGATGTCAGGCTGCTGAGTTGCAT
GTAGGCTGTGTTGGAGGATGTATCTGCAGTGAATGCGGCCTTGCCCT
TGAAGTTCTCATAGTAGTTAGAACTACCACTTCCAGGATAAATCTCTC
CAATCCACTCAAGGCCATGTCCAGGCCTCTGCTTTACCCACTCTATC
CAGTAGCTACTGAATGTGTAGCCAGTAGCCTTGCAGGATATCTTCAC
TGAGGCCCCAGGCCTCACCAGCTCAGCTCCAGACTCCACCCCCTGC
ACCTCGAGGGAAGATCTAGAGGAACCACCTTTCAGCTCCAGTTGGTC
CCAGCACCGAACGTGAGCGGAGTACTATAATGTTGCTGACAGTAATA
AACTGCCAGGTCTTCAGCCTGCACACTGCTGATGGTGAAAGTGAAAT
CCGTCCCAGATCCACTGCCAGTGAAGCGATCAGGGACTCCAGTGTA
CCGGTAGGATGCCGAGTAAATCAGTAGTTTAGGAGATTGTCCGGGTT
TCTGTTGATACCAGGCTACAGCAGTACTCACATCCTGACTGGCCTTG
CAGGTGATGCTGACCCTGTCTCCTACTGATGTGGACATGAATTTGTG
AGACTGTGTCAACACAATGTCGAGCTCGGCCGGCTGGGCCGCATAG
AAAGGAACGGATCTGAGGGTAAATTTCTAGTTTTTCTCC
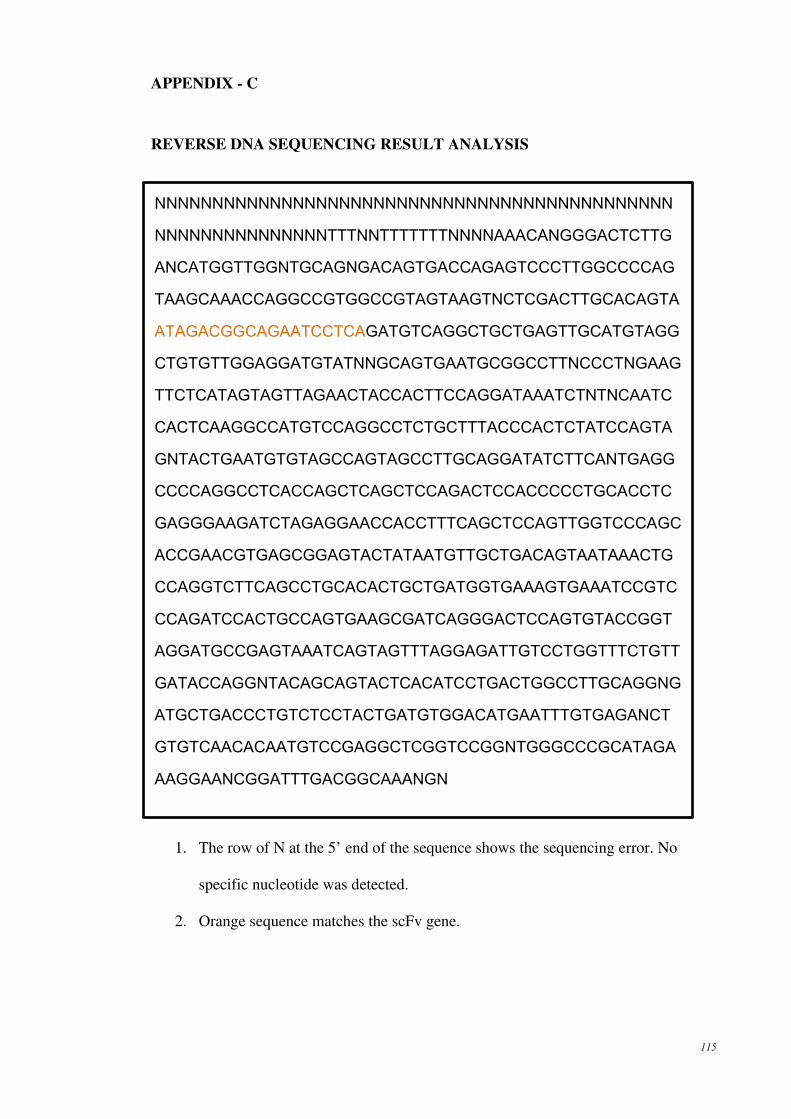
115
APPENDIX - C
REVERSE DNA SEQUENCING RESULT ANALYSIS
1. The row of N at the 5’ end of the sequence shows the sequencing error. No
specific nucleotide was detected.
2. Orange sequence matches the scFv gene.
NNNNNNNNNNNNNNNNNNNNNNNNNNNNNNNNNNNNNNNNNNNNN
NNNNNNNNNNNNNNNTTTNNTTTTTTTNNNNAAACANGGGACTCTTG
ANCATGGTTGGNTGCAGNGACAGTGACCAGAGTCCCTTGGCCCCAG
TAAGCAAACCAGGCCGTGGCCGTAGTAAGTNCTCGACTTGCACAGTA
ATAGACGGCAGAATCCTCAGATGTCAGGCTGCTGAGTTGCATGTAGG
CTGTGTTGGAGGATGTATNNGCAGTGAATGCGGCCTTNCCCTNGAAG
TTCTCATAGTAGTTAGAACTACCACTTCCAGGATAAATCTNTNCAATC
CACTCAAGGCCATGTCCAGGCCTCTGCTTTACCCACTCTATCCAGTA
GNTACTGAATGTGTAGCCAGTAGCCTTGCAGGATATCTTCANTGAGG
CCCCAGGCCTCACCAGCTCAGCTCCAGACTCCACCCCCTGCACCTC
GAGGGAAGATCTAGAGGAACCACCTTTCAGCTCCAGTTGGTCCCAGC
ACCGAACGTGAGCGGAGTACTATAATGTTGCTGACAGTAATAAACTG
CCAGGTCTTCAGCCTGCACACTGCTGATGGTGAAAGTGAAATCCGTC
CCAGATCCACTGCCAGTGAAGCGATCAGGGACTCCAGTGTACCGGT
AGGATGCCGAGTAAATCAGTAGTTTAGGAGATTGTCCTGGTTTCTGTT
GATACCAGGNTACAGCAGTACTCACATCCTGACTGGCCTTGCAGGNG
ATGCTGACCCTGTCTCCTACTGATGTGGACATGAATTTGTGAGANCT
GTGTCAACACAATGTCCGAGGCTCGGTCCGGNTGGGCCCGCATAGA
AAGGAANCGGATTTGACGGCAAANGN

116
APPENDIX - D
ANALYSIS OF COMBINED FORWARD AND REVERSE DNA SEQUENCING
RESULT
1. Red sequence matches the pCambia1301 sequence (GenBank: AF234297.1)
2. Blue sequence is BamHI (ggatcc) sequence which is located at 3’ end of scFv
gene sequence.
3. Green and orange sequence smatche the scFv gene.
4. PI gene (BBTI) sequence is missing in the sequencing result.
CTTGANCATGGTTGGNTGCAGNGACAGTGACCAGAGTCCCTTGGCCCCA
GTAAGCAAACCAGGCCGTGGCCGTAGTAAGTNCTCGACTTGCACAGTAA
TAGACGGCAGAATCCTCAGATGTCAGGCTGCTGAGTTGCATGTAGGCTG
TGTTGGAGGATGTATCTGCAGTGAATGCGGCCTTGCCCTTGAAGTTCTC
ATAGTAGTTAGAACTACCACTTCCAGGATAAATCTCTCCAATCCACTCAA
GGCCATGTCCAGGCCTCTGCTTTACCCACTCTATCCAGTAGCTACTGAAT
GTGTAGCCAGTAGCCTTGCAGGATATCTTCACTGAGGCCCCAGGCCTCA
CCAGCTCAGCTCCAGACTCCACCCCCTGCACCTCGAGGGAAGATCTAGA
GGAACCACCTTTCAGCTCCAGTTGGTCCCAGCACCGAACGTGAGCGGA
GTACTATAATGTTGCTGACAGTAATAAACTGCCAGGTCTTCAGCCTGCAC
ACTGCTGATGGTGAAAGTGAAATCCGTCCCAGATCCACTGCCAGTGAAG
CGATCAGGGACTCCAGTGTACCGGTAGGATGCCGAGTAAATCAGTAGTT
TAGGAGATTGTCCGGGTTTCTGTTGATACCAGGCTACAGCAGTACTCACA
TCCTGACTGGCCTTGCAGGTGATGCTGACCCTGTCTCCTACTGATGTGG
ACATGAATTTGTGAGACTGTGTCAACACAATGTCGAGCTCGGCCGGCTG
GGCCGCATAGAAAGGAACGGATCTGAGGGTAAATTTCTAGTTTTTCTCC

117
APPENDIX - E
SCFV GENE SEQUENCE
5’NNNNACACTTTCACAGTCTATGCGGCACGCGGTTCCAGCGGATCCGGATA
CGGCACCGGCGCACCTGCGGCCGCCCACTAGTGACAGATGGGGCTGTTGTT
TTGGCTGCAGAGACAGTGACCAGAGTCCCTTGGCCCCAGTAAGTCCGTCCC
AGTTGTGCACAGTAATAGACTGCAGAGTCCTCAGATGTCAGGCTGCTGAGC
TGCATGTAGGCTGTGTTGGAGGATTTGTCTACATTCAATGTGGCCTTGTCCT
TGAACTTCTGATTTAACCTAGTTTCACTATTGGAAGGATCAATCATGCCAAT
CCACTCAAGGCCTTGTCCAGGCCTCTGTTTCACCCAGTGCATCCAGTAGCTG
GTGAAGGTATAGCCTGAAGCCTTGCAGGACATCTTCACTGAAGCCCAGGCC
TCACCAGCTCAGGCCCAGACTCCACCAGCTGCACCTCGAGGGAAGATCTAG
AGGAACCACCTTTGATTTCCAGCTTGGTCCCCCCTCCGAACGTGTACGGAAT
CTCCCAACTGTGCTGACAGTAATATGTTGCAGTATCCTCCTCCTCCACAGGA
TGGATGTTGAGGGTGAAGTCTGTCCCAGACCCACTGCCACTGAACCTGGCA
GGGACCCCAGATTCTAGGTTGGATGCATACTTGATGAGGAGTTTGGGTGGC
TGTCCTGGTTTCTGTTGGTACCAGTGCATATAACTATAGCTAGATGTACTGA
CACTTTGGCTGGCCCTGCATGAGATGGTGGCCCTCTGCCCCAGAGATACAGC
TAAGGAAGCAGGAGACTGTGTCATCACAATGTCGAGCTCGGCCGGCTGGGC
CGCATAGAAAGGAACAACTAAAGGAATTGCGAATAATAATTTTTTCACGTT
GAAAATCTCCAAAAAAAAGGCTCCAAAGCTTGGCGTAATCATGGTCATAGC
TGTTTCCTGTGTGAAATTGTTATCCGCTCACAATTCCACACAACATACGAGC
CGGAAGCATAAAGTGTAAAGCCTGGGGTGCCTAATGAGTGAGCTAACTCAC
ATTAATTGCGTTGCGCTCACTGCCCGCTTTCCAGTCGGGAAACCTGTCGGGC
CACCTGCATTAATGAATCGGCCAACCCCGCGGGGAAAGGCGGTTTGCGTAT
TGGGCGCTCTTTCCGCTTCCTCGCCAATGAACCCGTGCCCTCGGTCGTTCGC

118
CTGCCGGCGAAAGCGGTTAATCCAGCCTCACCTCAGAGGCGGTTATNNNGG
TTATTCNACCAAGAANNNNNGGGGNNTAACCCGCGGAGAGNANGAANNAN
TTGTGTTGN-3’

119
APPENDIX - F
BBTI GENE SEQUENCE
5’ggatcctacagcgtgcaagcaccgcagaaacaaacaaaaaaacacccgggaaatccaagcagctgttgcaaccggttcc
ttcgaggagaacgtgagaaagaagcatgaggccccaggtgctgctcgtcgcactggccgtcttcgccgtcctcgtagctctg
ccactgggcaaagcgcacgaggaggaggaggaaggggttgaactcgaagccagcaggaggcggtggccgtgctgcgac
cagtgcggcatttgcaccaggtcgcagccgccgatatgcgagtgcagggacacgtcgacgaccggctgccacccggcttg
caaggcgtgcgccctgtccatctccgacggcctcttcgtgtgcaaggacaagatcgtcaacttctgcaagcgccgctgcaccc
gtcgtactgatgatgatgatgcgtgacttataatcacttaattaggcaaataaccttgccaataaataatttccgttcggagctccat
ttgcatctttctcaagatgcagacgacagggtttaaataatcaaggcgatgcttgcttgctaaaaaaaaaaaaatctgagaaaga
tgagctctagagatct-3’
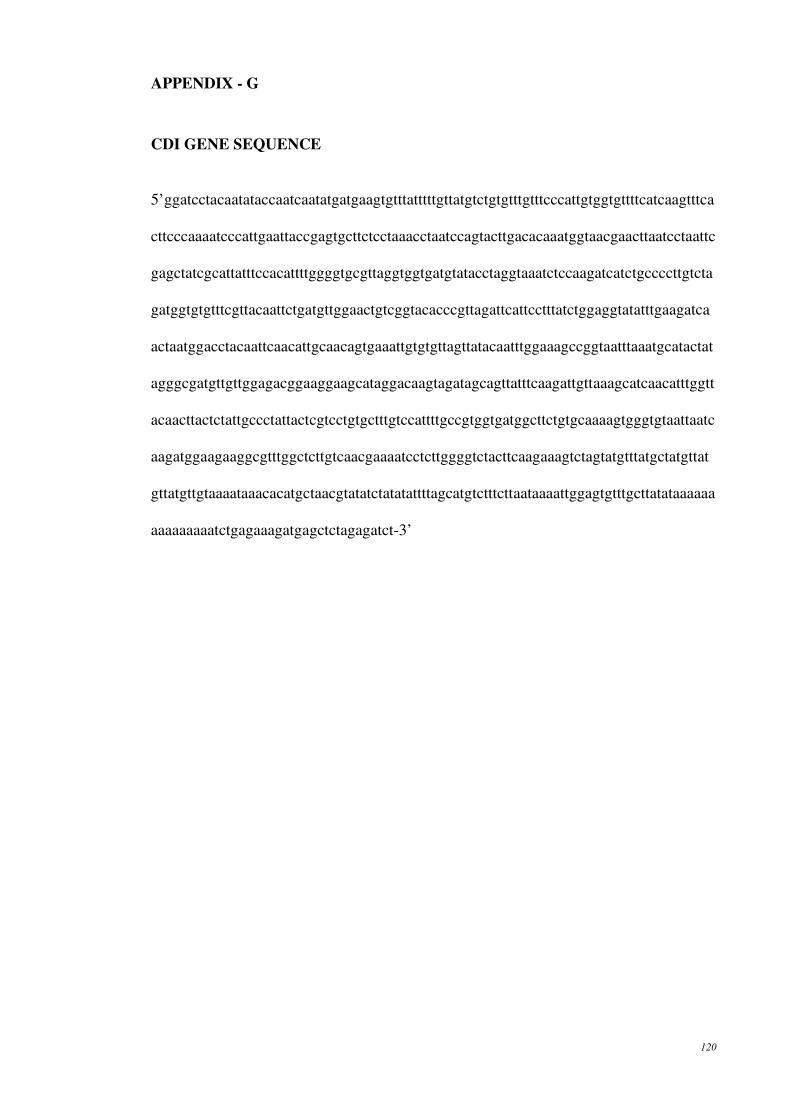
120
APPENDIX - G
CDI GENE SEQUENCE
5’ggatcctacaatataccaatcaatatgatgaagtgtttatttttgttatgtctgtgtttgtttcccattgtggtgttttcatcaagtttca
cttcccaaaatcccattgaattaccgagtgcttctcctaaacctaatccagtacttgacacaaatggtaacgaacttaatcctaattc
gagctatcgcattatttccacattttggggtgcgttaggtggtgatgtatacctaggtaaatctccaagatcatctgccccttgtcta
gatggtgtgtttcgttacaattctgatgttggaactgtcggtacacccgttagattcattcctttatctggaggtatatttgaagatca
actaatggacctacaattcaacattgcaacagtgaaattgtgtgttagttatacaatttggaaagccggtaatttaaatgcatactat
agggcgatgttgttggagacggaaggaagcataggacaagtagatagcagttatttcaagattgttaaagcatcaacatttggtt
acaacttactctattgccctattactcgtcctgtgctttgtccattttgccgtggtgatggcttctgtgcaaaagtgggtgtaattaatc
aagatggaagaaggcgtttggctcttgtcaacgaaaatcctcttggggtctacttcaagaaagtctagtatgtttatgctatgttat
gttatgttgtaaaataaacacatgctaacgtatatctatatattttagcatgtctttcttaataaaattggagtgtttgcttatataaaaaa
aaaaaaaaatctgagaaagatgagctctagagatct-3’
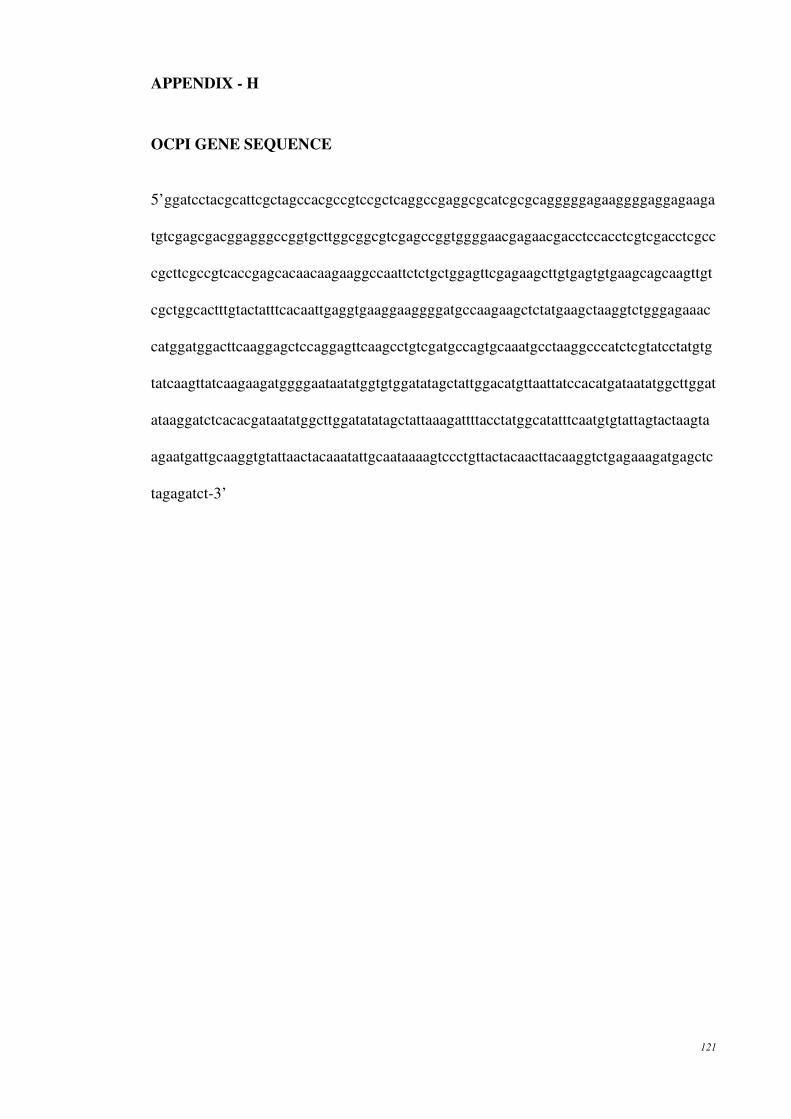
121
APPENDIX - H
OCPI GENE SEQUENCE
5’ggatcctacgcattcgctagccacgccgtccgctcaggccgaggcgcatcgcgcagggggagaaggggaggagaaga
tgtcgagcgacggagggccggtgcttggcggcgtcgagccggtggggaacgagaacgacctccacctcgtcgacctcgcc
cgcttcgccgtcaccgagcacaacaagaaggccaattctctgctggagttcgagaagcttgtgagtgtgaagcagcaagttgt
cgctggcactttgtactatttcacaattgaggtgaaggaaggggatgccaagaagctctatgaagctaaggtctgggagaaac
catggatggacttcaaggagctccaggagttcaagcctgtcgatgccagtgcaaatgcctaaggcccatctcgtatcctatgtg
tatcaagttatcaagaagatggggaataatatggtgtggatatagctattggacatgttaattatccacatgataatatggcttggat
ataaggatctcacacgataatatggcttggatatatagctattaaagattttacctatggcatatttcaatgtgtattagtactaagta
agaatgattgcaaggtgtattaactacaaatattgcaataaaagtccctgttactacaacttacaaggtctgagaaagatgagctc
tagagatct-3’

122
APPENDIX - I
4-MU STANDARD MEASUREMENTS
0.2M
Carbonate
buffer (ml)
1µM 4-
MU stock
(µl)
Sample
conc.(X)
(nM)
Fluorescence
Reading
replicate1
Fluorescence
Reading
replicate2
Average
2.0 0 0 0 0 0
1.9 100 50 250 240 245
1.8 200 100 600 598 599
1.7 300 150 905 894 899.5
1.6 400 200 1210 1200 1205
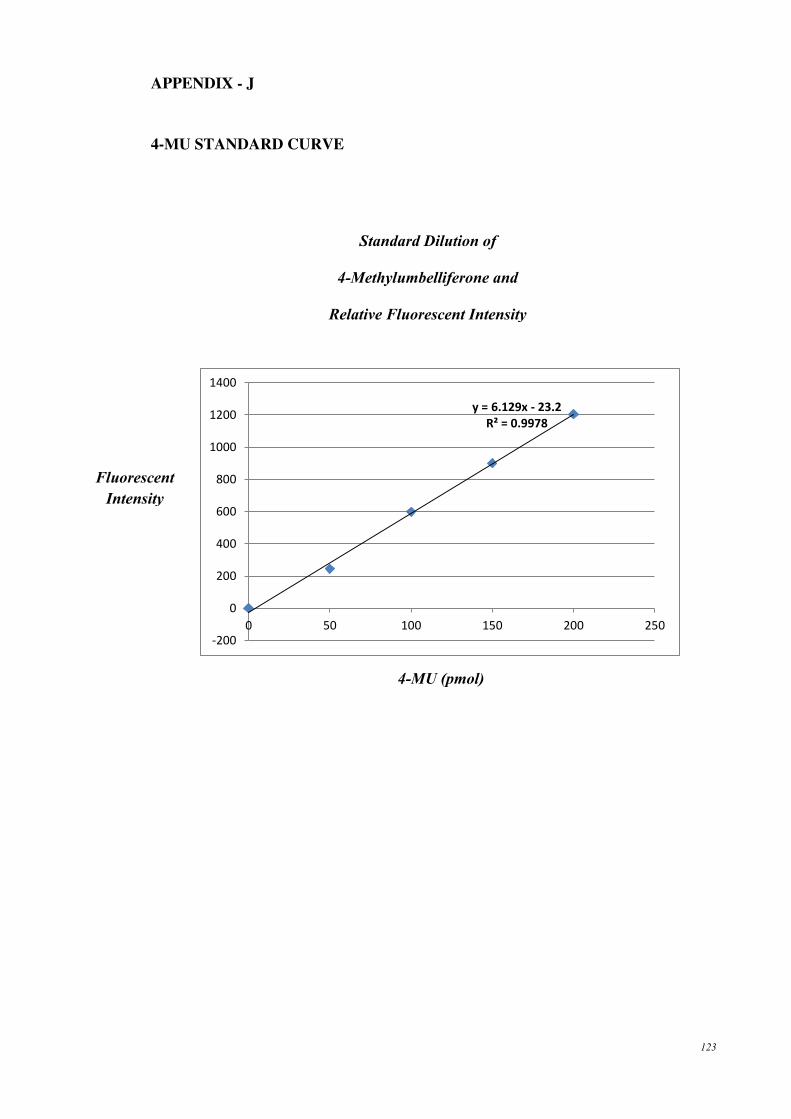
123
APPENDIX - J
4-MU STANDARD CURVE
y = 6.129x - 23.2 R² = 0.9978
-200
0
200
400
600
800
1000
1200
1400
0 50 100 150 200 250
Fluorescent
Intensity
4-MU (pmol)
Standard Dilution of
4-Methylumbelliferone and
Relative Fluorescent Intensity

124
APPENDIX - K
OD VALUES FOR DIFFERENT BSA CONCENTRATIONS IN PROTEIN
STANDARD CURVE ASSAY
BSA conc.
(mg)
OD replicate1 OD replicate3 OD replicate 3 Average
0 0.537 0.534 0.529 0.533
0.0025 0.577 0.581 0.585 0.581
0.005 0.617 0.619 0.615 0.617
0.0075 0.643 0.639 0.642 0.641
0.01 0.645 0.647 0.643 0.645
0.015 0.652 0.649 0.647 0.649
0.02 0.675 0.668 0.671 0.671
0.025 0.725 0.736 0.728 0.729
0.03 0.793 0.799 0.785 0.792

125
APPENDIX - L
BRADFORD STANDARD CURVE
y = 7.0074x + 0.5614 R² = 0.9169
0
0.1
0.2
0.3
0.4
0.5
0.6
0.7
0.8
0.9
0 0.01 0.02 0.03 0.04
Standard Protein curve
A595
BSA protein CONCENTRATION (mg)

126
APPENDIX - M
DNA LADDER 100BP

127
DNA LADDER 1 KB