preliminary evaluation of coastal...
TRANSCRIPT

Division of Geological & Geophysical Surveys
PRELIMINARY INTERPRETIVE REPORT 2013-3
PRELIMINARY EVALUATION OF COASTAL GEOMORPHOLOGY AND GEOHAZARDS ON ‘KIGIQTAM IGLUA’, AN ISLAND
NORTHEAST OF SHISHMAREF, ALASKA
byNicole E.M. Kinsman, Meagan R. DeRaps, and Jacquelyn R. Smith
March 2013
Released by
STATE OF ALASKADEPARTMENT OF NATURAL RESOURCESDivision of Geological & Geophysical Surveys
3354 College Rd.Fairbanks, Alaska 99709-3707
$2.00
Cover: Photograph taken approximately 3 km from Shishmaref along the base of the foredune on the open-ocean coast of Kigiqtam Iglua. The village of Shishmaref can be seen faintly in the distance at the center of the photograph, to the southwest across the inlet.

This publication is funded with qualified outer continental shelf oil and gas revenues by the Coastal Impact Assistance Program, U.S. Fish and Wildlife Service, U.S. Department of the Interior. The views and conclusions contained in this document are those of the authors and should not be interpreted as representing the opinions or policies of the U.S. Government. Mention of trade names or commercial products does not constitute their endorsement by the U.S. Government.

CONTENTS
Abstract ...................................................................................................................................................................1Background and prior work ....................................................................................................................................1Regional coastal setting ..........................................................................................................................................3Preliminary assessment of island geomorphology ..................................................................................................5 Methods ...........................................................................................................................................................5 Island landforms ..............................................................................................................................................5 Surrounding depths and channel migration .....................................................................................................5Preliminary assessment of exposure to coastal hazards ..........................................................................................6 Methods ...........................................................................................................................................................6 Shoreline change .............................................................................................................................................6 Flooding ..........................................................................................................................................................9Other hazards and considerations .........................................................................................................................12Additional work to be conducted ..........................................................................................................................13Acknowledgments .................................................................................................................................................13References .............................................................................................................................................................13
TABLE
Table 1. Published extreme water level determinations for Shishmaref, Alaska ..............................................11
FIGURES
Figure 1. Location of the study area in Alaska (inset map) and positions of Sarichef Island and Kigiqtam Iglua as seen in a compilation LANDSAT image (1999–2001) ...........................................2 2. Timelineofthelast40yearsshowingsignificantstormeventsthataffectedShishmarefabove the line and notable coastal engineering events below the line ............................................................2 3. TidestaffforShishmaref,Alaska,includingsignificantfloodwaterlevelsthataretypicalof published values ....................................................................................................................................3 4. Wind rose for periods without landfast ice (June–November) constructed from Shishmaref airport Automated Weather Observation System (AWOS) records (1984–2012) ................................4 5. ElevationprofilesacrossSarichefIsland(A–A')andKigiqtamIglua(B–B')thatareplottedwith an identical scale to allow for direct comparison (lidar elevations from National Oceanic and Atmospheric Administration [NOAA] and others, 2004) .....................................................................7 6. Granulometric curves for intertidal and foredune Kigiqtam Iglua sediment samples ..........................8 7. Photograph of an open-ocean backbeach location toward the northeast end of Kigiqtam Iglua ..........8 8. Map of shoreface characteristics (beach width and beach slope) along the open ocean side of Kigiqtam Iglua ......................................................................................................................................8 9. Photograph of erosion along the Kigiqtam Iglua side of Sinfak Inlet ..................................................9 10. PreliminarycoastalerosionandfloodingvulnerabilitymapsforKigiqtamIgluabasedonthe best available data at time of publication ............................................................................................10 11. A side-by-side comparison of a region at the northeast end of Kigiqtam Iglua where wave action during elevated ocean surface conditions was able to breach the 3 m foredune ridge .......................12


AbstractThe Alaska Division of Geological & Geophysical Surveys (DGGS) conducted one week of coastal field investigations along 40 km of the Shishmaref coastline in northwestern Alaska during August 2012 as part of a preliminary assessment of coastal processes and geohazard vulnerability. A team of four scientists collected measurements of nearshore and backshore elevations, described beach sediment characteristics, and made process-based observations of coastal landforms. This report contains initial interpretations for a subset of the data that encompasses ‘Kigiqtam Iglua’, the island northeast of Shishmaref. We present an overview of the island geomorphology including a preliminary coastal flood inundation map using: (1) 2004 lidar elevations, (2) regional estimates of surge heights, and (3) theoretical wave run-up values for extreme events. We also describe the geomorphic stability of this island based on empirical estimates of erosion/accretion derived from historic orthoimagery and measured coastal profiles. We find that the island is undergoing typical barrier island migration processes through erosion and accretion and, due to low relief, much of the area is vulnerable to episodic coastal flooding. This publication has been compiled to provide a short, timely resource for in-progress community relocation discussions. A detailed coastal geohazard map that incorporates the full findings of 2012 DGGS investigations in the Shishmaref region is currently under development.
BAckground And Prior WorkThe community of Shishmaref, Alaska (population 563, U.S. Census 2010) is located on Sarichef Island along
the northern coast of Seward Peninsula on the Chukchi Sea (fig. 1; for additional demographic information see Kawerak, 2009). Sarichef Island is roughly 7 km long (4 km excluding tidal flats) and less than 1 km wide. The island lies along a >150 km barrier island chain traditionally known as the Tapqaq Coast (‘sandy strand’; Fair, 1997), which extends from the western tip of Seward Peninsula in the Bering Strait to inner Kotzebue Sound.
Sarichef Island is exposed to recurrent coastal storms (see fig. 2). State flood disaster declarations have been issued for Shishmaref in 1988, 1997, 2001, 2002, 2005, and 2011 (Alaska Department of Military and Veterans Af-fairs [ADMVA], 2008; Parnell, 2011). Wave-induced episodic erosion, particularly during the fall storm season, has led to bluff retreat (measured and anecdotal rates vary from 0.8 to 6.9 m/yr; Mason and others, 2012; Eningowuk, 2004) along the open-ocean coastline adjacent to the community. This erosion has necessitated the emplacement of numerous engineered structures to curtail bluff retreat (Mason and others, 1997a; Shishmaref Alaska Erosion & Relocation Coalition [SERC], 2013) and discussion of additional engineering measures is ongoing (United States Army Corps of Engineers [USACE], 2006a). Although there are currently no engineered flood protection measures, Shishmaref has participated in the Federal Emergency Management Agency (FEMA) National Flood Insurance Program since 2010 (FEMA, 2009).
In response to ongoing erosion and space constraints on new development, residents of the island have taken part in formal discussions since 1974 about relocating the community to a viable location (Mason, 1996; Marino, 2012). In 2001, the Shishmaref Erosion and Relocation Coalition (SERC) formed to facilitate necessary action (SERC, 2013). Scientific and engineering investigations stemming from these discussions have considered numer-ous relocation sites on the mainland (for example, Azelton and others, 2009; Alaska DOTPF, 2009; Becker and others, 2002; Natural Resource Conservation Service, 2004; Tetra Tech, 2004; Mason, 1996; Mason and others, 1997a; see Bristol Environmental & Engineering Services Corp. [2010] for a comprehensive review of previously evaluated sites). Many of the proposed sites introduce new obstacles, such as the presence of extensive permafrost that requires large amounts of fill for gravel pads, increased distance from ocean-based subsistence activities, and
PrELiMinArY EVALuATion oF coASTAL gEoMorPHoLogY And gEoHAZArdS on ‘kigiQTAM igLuA’, An iSLAnd
norTHEAST oF SHiSHMArEF, ALASkA
byNicole E.M. Kinsman1, Meagan R. DeRaps2, and Jacquelyn R. Smith2
1Division of Geological & Geophysical Surveys, 3354 College Rd., Fairbanks, Alaska 99709-3707; [email protected]; 907-451-5026
2Division of Geological & Geophysical Surveys, 3354 College Rd., Fairbanks, Alaska 99709-3707

2 Preliminary Interpretive Report 2013-3
Figure 1. Location of the study area in Alaska (inset map) and positions of Sarichef Island and Kigiqtam Iglua as seen in a compilation LANDSAT image (1999–2001). The city of Shishmaref is at the northeast end of Sarichef Island.
Figure 2. Timeline of the last 40 years showing significant storm events that affected Shishmaref above the line and notable coastal engineering events below the line.
Preliminary evaluation of coastal geomorphology and geohazards on ‘Kigiqtam Iglua’, NE of Shishmaref 3
shallow-water limitations on barge delivery. Shishmaref has completed a strategic relocation plan and on July 19, 2002, the city voted on a long-range plan to initiate relocation. In recent discussions Kigiqtam Iglua3, on the adja-cent barrier island 2–3 km northeast of the current site, has been identified as one of the few remaining candidates for community expansion (URS, 2012).
In 2009, DGGS received federal funding from the U.S. Minerals Management Service (now Bureau of Ocean Energy Management), through the Coastal Impact Assistance Program (CIAP), to establish a coastal community geohazards evaluation and geologic mapping program in support of local and regional planning. The DGGS CIAP program will document the geologic context and dominant coastal processes in at-risk Alaskan communities. A coastal geohazard map series tailored to the specialized needs of Alaska will identify local natural hazards that must be con-sidered in the siting, design, construction, and operations of development projects to ensure protection of human life, property, and the coastal environment. In August 2012, this program was implemented in Shishmaref, Alaska. The initial findings from a subset of this work are presented in this report; the full data set will be used for quantita-tive documentation of coastal change and will be incorporated into a final coastal vulnerability map for the area.
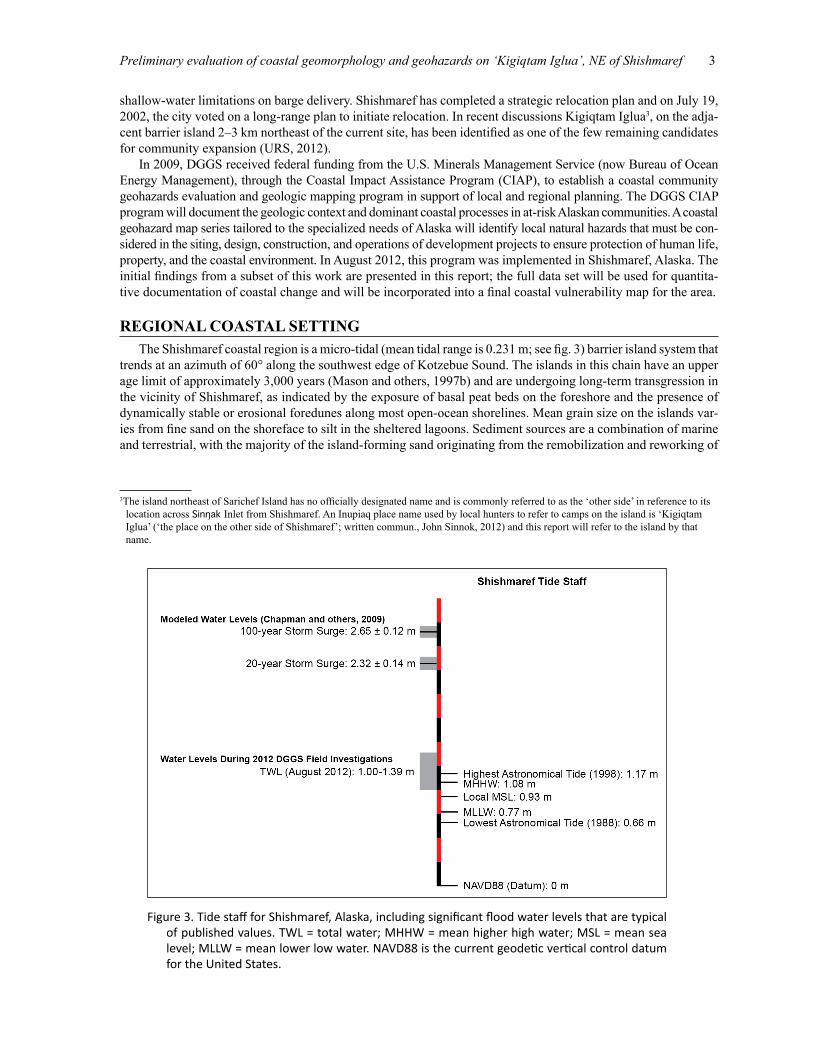
rEgionAL coASTAL SETTingThe Shishmaref coastal region is a micro-tidal (mean tidal range is 0.231 m; see fig. 3) barrier island system that
trends at an azimuth of 60° along the southwest edge of Kotzebue Sound. The islands in this chain have an upper age limit of approximately 3,000 years (Mason and others, 1997b) and are undergoing long-term transgression in the vicinity of Shishmaref, as indicated by the exposure of basal peat beds on the foreshore and the presence of dynamically stable or erosional foredunes along most open-ocean shorelines. Mean grain size on the islands var-ies from fine sand on the shoreface to silt in the sheltered lagoons. Sediment sources are a combination of marine and terrestrial, with the majority of the island-forming sand originating from the remobilization and reworking of
3The island northeast of Sarichef Island has no officially designated name and is commonly referred to as the ‘other side’ in reference to its location across Sinfak Inlet from Shishmaref. An Inupiaq place name used by local hunters to refer to camps on the island is ‘Kigiqtam Iglua’ (‘the place on the other side of Shishmaref’; written commun., John Sinnok, 2012) and this report will refer to the island by that name.
Figure 3. Tide staff for Shishmaref, Alaska, including significant flood water levels that are typical of published values. TWL = total water; MHHW = mean higher high water; MSL = mean sea level; MLLW = mean lower low water. NAVD88 is the current geodetic vertical control datum for the United States.

4 Preliminary Interpretive Report 2013-3
offshore sand lenses since the last glacial maximum (Mason, 1996). Discontinuous permafrost is present along the island chain at a depth of approximately 1 m (Hufford and Partain, 2004), and vegetated portions of the islands are dominantly composed of salt-tolerant grasses that can withstand poor drainage.
Although micro-tidal, the shallow waters off the coast of the northern Seward Peninsula, coupled with the westward orientation of Kotzebue Sound, allow for the capture and amplification of extra-tropical cyclones that track easterly from both the Chukchi and Bering seas. Even during periods of storm system quiescence, atmospheric conditions have a strong influence on coastal water levels and often overwhelm trends in the astronomic tidal cycle. For example, the total water level during DGGS August 2012 field work was notably higher than the astronomical tidal range due to the presence of a mild low-pressure system. Wave setup also contributes to extreme water levels. Fetches of more than 1,000 km to the north–northwest are present during minimum sea ice extents, while fetches to the west across the Bering Strait are as little as 150 km. The highest documented winds on record in Shishmaref were 50 mph sustained, gusting to 61 mph from the northwest (295° azimuth), in September 1985 (FEMA, 2009).
Net sediment transport, as indicated by the geomorphic offset of barrier island features, is toward the northeast and is primarily driven by geostrophic and tidal currents (Naidu and Gardner, 1988). During strong storm events, littoral transport typically reverses towards the southwest, driven by the prevailing high energy wind and wave directions (see fig. 4). The vast majority of sediment transport is limited to a 4–5 month annual open-ocean period from roughly June through October (Pilkey, 2003).
The islands and inlets around Shishmaref exhibit a mixed-energy signature manifested by a combination of well-developed or emergent ebb/flood-tidal deltas, broad tidal flats, and some recurved spit deposition. The oc-currence of tide-dominated characteristics, despite the micro-tidal setting, along this portion of the barrier island system can be attributed to the large tidal prisms associated with the extensive and open lagoon system (Davis and Hayes, 1984). The average tidal prism is approximately 9.4 × 10⁷ m3, split across just three inlets (two major and one minor).
Figure 4. Wind rose for periods without landfast ice (June–November) constructed from Shishmaref airport Automated Weather Observation System (AWOS) records (1984–2012). Wave rose diagrams for offshore swell direction, as modeled by U.S. Army Corps of Engineers (USACE) hindcasting, display a similar directional pattern.

Preliminary evaluation of coastal geomorphology and geohazards on ‘Kigiqtam Iglua’, NE of Shishmaref 5
PrELiMinArY ASSESSMEnT oF iSLAnd gEoMorPHoLogYMethods
A pre-existing suite of orthorectified aerial and satellite imagery was used to assess island features visible in map view. This imagery consisted of 1949, 1985, and 2003 aerials (Manley and others, 2007b). Additionally, we used 2009 GeoEye and 2011 SPOT-5 satellite imagery to characterize more recent island conditions. Reported beach widths reflect current conditions and were calculated using both the 2009 and 2011 satellite imagery in conjunction with field measurements to minimize the effects of water level and seasonal variation. We measured all beach widths from the wet–dry line (a proxy for high-water line [HWL]; see Pajak and Leatherman, 2002) to the vegetation line on the backshore.
Measurements of elevation were obtained in the field with the use of a survey-grade GPS system consisting of two dual-frequency Topcon HiPer II GNSS receivers and an FC-250 field controller running TopSURV soft-ware. With post processing, this configuration typically yields total vertical errors of less than 5 cm (Kinsman and DeRaps, 2012). We derived additional elevation information from a 2004 unclassified lidar point cloud (NOAA and others, 2004; vertical RMSE ≤30 cm) that we transformed into a 5 m digital surface model (DSM) in ArcGIS using the natural neighbor interpolation algorithm.
Island LandformsKigiqtam Iglua is 16 km2, 13 km in length, and less than 2.5 km across at the widest point. The island is com-
posed of concentric and curvilinear beach ridge complexes separated by relict flood-tidal deltas or abandoned inlets in various stages of channel fill. The ridges are most prevalent on the wider, southwestern end of Kigiqtam Iglua, and bear a strong resemblance to ridge patterns on other islands in this part of the barrier chain. On the narrower, northeastern half of the island, ridges are replaced by a series of washover deposits and tidal flats, forming a low-relief overwash apron. The open-ocean side of the island is capped by a discontinuous foredune ridge that is most prominent toward this northeastern end.
While the island is both wider and longer than its populated neighbor to the southwest, it has much lower ver-tical relief, as illustrated in figure 5. On Sarichef Island, a recurved dune ridge complex with elevations of up to 8 m NAVD88 extends across much of the seaward half of the island and underlies the community of Shishmaref. These dunes are highest and youngest at the northeast end of the island where accretion occurred on the prograd-ing end of the barrier island from about A.D. 1200 to A.D. 1600 (Mason, 1996). In contrast, the low ridges on Kigiqtam Iglua have not undergone a geologically-recent build-up through the capture of longshore sediment, and elevations on the island are typically less than 4 m NAVD88; elevations that exceed this are restricted to the crest of the single, discontinuous foredune ridge.
The active sediment in the Kigiqtam Iglua shore zone is composed of very-well-sorted fine sand with a median grain size of less than 0.25 mm (see fig. 6). Samples were sieved in the lab and results yielded a similar size distri-bution from the intertidal zone to the crest of the foredune. Sediment composition of the island is predominantly fine sand, with silt and organics comprising a component of the deposit on the inland side. Discontinuous layers of peat that underlie the dunes have been exposed by wave action at some locations on the beachface (see fig. 7).
The beach on the open-ocean coast decreases in width from roughly 100 m in the southwest to less than 50 m in the northeast. Above the intertidal zone, beach slopes range from 1:50 to 1:16 (2-6% grade), with the steepest beaches correlating to areas of narrowest beach width. A summary of these alongshore shoreface characteristics is presented in figure 8.
Surrounding Depths and Channel MigrationIn August 2012, water depths around the island were measured with a Hydrolite-TM single-beam echo sounder
that collected at 1-second intervals in conjunction with a Topcon PG-A1 antenna and GRS-1 receiver. The GPS data were post-processed using onshore control to achieve precise boat positions.
The island is bounded by Sinfak Inlet (cross sectional area of approximately 1.0 × 10³ m2) on the southwest end and the larger Atibiituak Inlet (approximately 1.7 × 10³ m2) on the northeast end (see fig. 8 for inlet locations). The nearshore slope, from the intertidal zone to the closure depth, has an average slope of 1:200 (0.5% grade) along the entire open-ocean coast. Depths throughout the extensive lagoon have a mean value of less than 2 m. Well developed (and in some cases emergent) flood-tidal deltas are present in the inlets.
In agreement with regional net transport directions, the inlets at either end of Kigiqtam Iglua exhibit varying degrees of migration toward the northeast. The deep channel in Atibiituak Inlet has not undergone significant

6 Preliminary Interpretive Report 2013-3
migration during the last 50 years for which imagery is available. The sand spit adjacent to this inlet has increased in length approximately 175 m over that same period (see gray lines in fig. 8); however, observed change in the extent of this tidal flat may be negligible when considered with the seasonal variability of the imagery. Channel migration is undisputedly occurring in Sinfak Inlet at the southeastern tip of the island where the channel is actively cutting into the edge of Kigiqtam Iglua (fig. 9) at an approximate rate of 50 m per decade (see blue lines in fig. 8).
PrELiMinArY ASSESSMEnT oF ExPoSurE To coASTAL HAZArdSMethods
To conduct a preliminary estimate of shoreline change, we assessed long-term rates of change as determined by the position of the vegetation line on shore-normal transects spaced at 50 m intervals around the entire island. We used the U.S. Geological Survey (USGS) Digital Shoreline Analysis System (DSAS), version 4.3, in ArcGIS (Thieler and others, 2009) to calculate shoreline change rates from five vegetation line positions. The vegetation lines used to define the shoreline position were digitized from available historic orthoimagery at a scale of 1:1,000 or collected in the field with a hand-held GPS (2012; horizontal accuracy <10 m). At this time, no earlier shoreline position information is known to be available for this area. The vegetation line was selected as the only shoreline position indicator for this preliminary assessment because it is the most consistently defined in the imagery avail-able, is least dependent on water levels or image collection date (unlike beach width), and is widely accepted as an indicator of the stable shoreline position (for example, Paine and Morton, 1989).
For simplicity, linear regression rates (after Dolan and others, 1991) that encompass the entire 63-year imagery record are the only quantitative assessment of shoreline change presented in this report. To create an overview of trends in the shoreline position change, we averaged the results of the DSAS analysis by grouping the 50 m-spaced rates into 200 m alongshore segments; these shoreline change rates are illustrated in figure 10a. Similar to the catastrophic erosion events that occur on Sarichef Island (see USACE, 2006b; Mason and others, 1997a), changes in shoreline position are highly episodic on Kigiqtam Iglua. Therefore, while erosion rates are presented in meters per year, a region with a 1.5 m/year retreat rate may have incurred multiple meters of erosion in a single large storm followed by a long quiescent period.
Shoreline ChangeThe trends in shoreline change illustrate how the northeastern channel migration that was described in the previ-
ous section is translating the entire position of Sinfak Inlet toward Kigiqtam Iglua. As the channel migrates, it is cutting into the end of the island and causing the vegetation line to retreat at rates of more than 2 m/year. Additional regions of accelerated retreat can be observed along some portions of the open-ocean side of the island, where rates are typically less than 1 m/year. Field observations of the condition of the base of the foredune suggest that wave runup regularly exceeds the elevation at the base of the dune along most of the open-ocean coast, leading to scarped and unvegetated dune bases (Sallenger, 2000). One notable exception in shoreline rate trends is the roughly 1.5 km stretch of coastline that has exhibited a net migration toward the ocean with vegetation advancing behind a wide protective beach (green areas, fig. 10a). Despite an advancing vegetation line, accretion of additional sedi-ment at this location is minimal. The majority of the lagoon shoreline is stable over the available imagery record.
A U.S. Army Corps of Engineers erosion report (USACE, 2006a) used similar techniques to quantify erosion rates on the ocean side of Shishmaref by using 1972, 1980, 1984, and 2003 imagery as well as measured rates in 2001–2003. The USACE report suggested annual retreat rates on the ocean side of the community of 0.8 to 2.7 m/year. A direct comparison of these values to the rates presented for Kigiqtam Iglua suggests that the uninhabited island is undergoing less net retreat. The cause of this difference is not within the scope of this report—it may be due to human modification to the developed coast on Sarichef Island, differing wave energy, onshore geometry, or it may be an artifact of the high frequency of storms during the short time period over which the USACE erosion analysis was conducted. The latter explanation is supported by lower annual retreat rates that appear in longer records of shoreline change for Sarichef Island (see Mason and others, 2012); these lower rates are more consistent with the rates reported by this study for Kigiqtam Iglua.
Regional investigations of shoreline change in Kotzebue Sound (Manley and others 2007a; Gorokhovich and Leiserowiz, 2012) corroborate the estimated magnitudes of net coastal change presented here. Manley and others (2007a) used the DSAS technique to derive an average vegetation line retreat rate of 1 m/year along the developed coast of Shishmaref, and they reported rates of approximately 0.5 m/year of retreat as being typical on the adja-cent islands. A pre- and post-1980 comparison of erosion rates in Kotzebue Sound suggests a decline in erosion

Figure 5. Elevation profiles across Sarichef Island (A–A’) and Kigiqtam Iglua (B–B’) that are plotted with an identical scale to allow for direct comparison (lidar elevations from National Oceanic and Atmospheric Administration [NOAA] and others, 2004). Profile locations are shown at the top of the page on a 2003 aerial image (Manley and others, 2007) and in 2012 ShoreZone oblique aerial images looking towards the south (Coastal and Ocean Resources, Inc. [CORI], 2012).
Preliminary evaluation of coastal geomorphology and geohazards on ‘Kigiqtam Iglua’, NE of Shishmaref 7
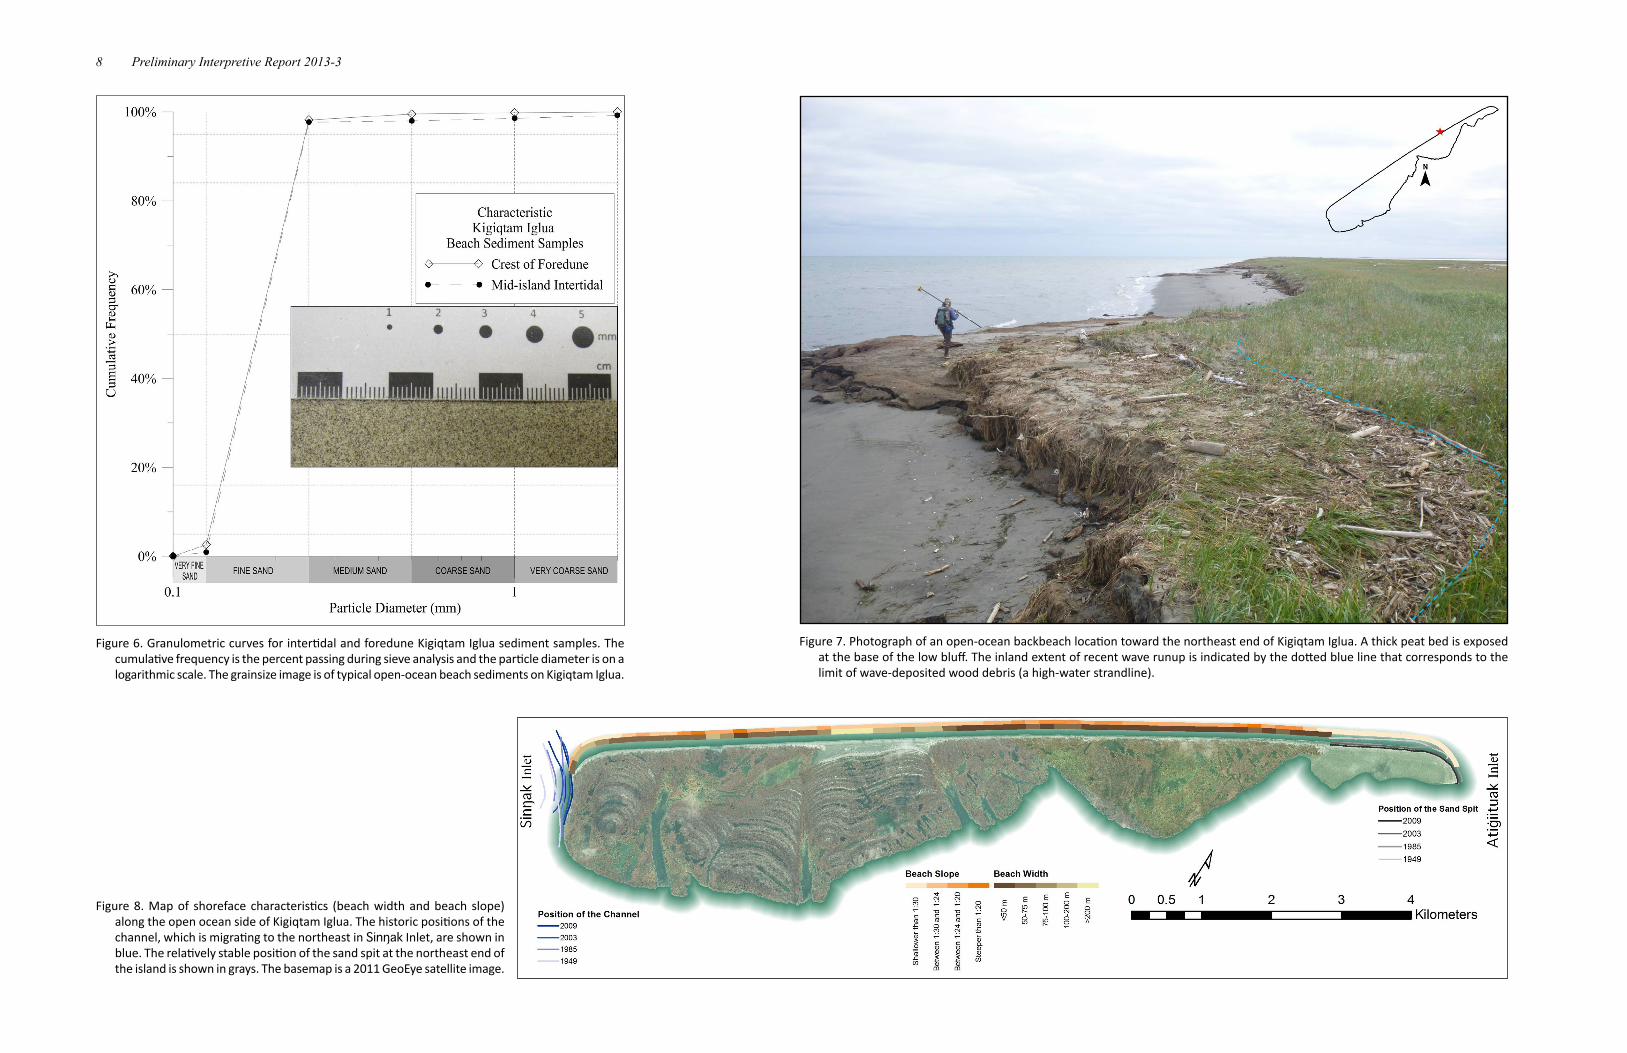
Figure 6. Granulometric curves for intertidal and foredune Kigiqtam Iglua sediment samples. The cumulative frequency is the percent passing during sieve analysis and the particle diameter is on a logarithmic scale. The grainsize image is of typical open-ocean beach sediments on Kigiqtam Iglua.
Figure 7. Photograph of an open-ocean backbeach location toward the northeast end of Kigiqtam Iglua. A thick peat bed is exposed at the base of the low bluff. The inland extent of recent wave runup is indicated by the dotted blue line that corresponds to the limit of wave-deposited wood debris (a high-water strandline).
Figure 8. Map of shoreface characteristics (beach width and beach slope) along the open ocean side of Kigiqtam Iglua. The historic positions of the channel, which is migrating to the northeast in Sinfak Inlet, are shown in blue. The relatively stable position of the sand spit at the northeast end of the island is shown in grays. The basemap is a 2011 GeoEye satellite image.
8 Preliminary Interpretive Report 2013-3

Preliminary evaluation of coastal geomorphology and geohazards on ‘Kigiqtam Iglua’, NE of Shishmaref 9
rates along the southern coast, including at Shishmaref, which corresponds to a shift in the direction of fall storm tracks (Manley and others, 2007a). The same trend was observed by Gorokhovich and Leiserowiz (2012), who applied DSAS techniques to assess change in the position of the instantaneous water line (similar to high water line) throughout Kotzebue Sound.
FloodingThis report presents a simplified assessment of coastal inundation risk on Kigiqtam Iglua by identifying areas
vulnerable to flooding based on a static ‘bathtub-style’ assessment, which utilizes single-value water surfaces for each mapped recurrence interval (after NOAA, 2009). This simplistic assessment has five primary limitations: (1) surge levels are based on empirical estimates, (2) setup and runup factors along the open-ocean coast are not fully included in total water levels, (3) dynamic changes in the foreshore, such as dune blowouts, are not ac-counted for, (4) the elevation data for the region is from unclassified lidar that includes vegetation and data gaps, particularly on the lagoon side of the island, and (5) unrealistic inland ‘ponds’ of low elevation have not been manually removed. Despite these limitations, the presented assessment will provide a first step in understanding the flood-prone regions on Kigiqtam Iglua.
Coastal flooding in this region results primarily from storm surges caused by low-pressure systems and as-sociated strong onshore winds (FEMA, 2009). The flood of record in Shishmaref occurred November 9–10, 1973, with an estimated flood level of 2.1 m above MSL (USACE, 2011). Storm systems that track from the western Bering Sea and through the Bering Strait pose the highest risk for coastal inundation and the inland translation of wave-induced erosion along the southern coast of Kotzebue Sound (Cross, 2010).
Pre-existing storm water level calculations for Shishmaref are summarized in table 1. A 2009 study conducted by Chapman and others at the U.S. Army Corps of Engineers Coastal and Hydraulics Laboratory used storm
Figure 9. Photograph of erosion along the Kigiqtam Iglua side of Sinfak Inlet.

Figu
re 1
0. P
relim
inar
y co
asta
l ero
sion
and
floo
ding
vul
nera
bilit
y m
aps
for
Kigi
qtam
Iglu
a ba
sed
on t
he b
est
avai
labl
e da
ta a
t tim
e of
pub
licati
on. M
ap A
illu
stra
tes
shor
elin
e ch
ange
rat
es
arou
nd th
e en
tire
isla
nd b
ased
on
chan
ges
in th
e po
sitio
n of
the
vege
tatio
n lin
e si
nce
1949
. Map
B is
a c
olor
ed e
leva
tion
map
in w
hich
the
colo
rs c
orre
spon
d to
pub
lishe
d su
rge
heig
hts
for t
he S
hish
mar
ef re
gion
at v
aryi
ng re
curr
ence
inte
rval
s. R
ed a
reas
are
mos
t sus
cepti
ble
to in
unda
tion
and
blue
are
as a
re le
ast s
usce
ptibl
e. T
he c
olor
ed li
ne a
long
the
open
-oce
an c
oast
de
pict
s th
e lik
elih
ood
of t
he fo
redu
ne r
idge
bei
ng o
vert
oppe
d by
wav
e ru
nup.
A fu
ll de
scri
ption
of t
he li
mita
tions
of t
hese
ear
ly m
ap p
rodu
cts
is d
escr
ibed
in t
he te
xt. T
he b
asem
ap is
a
2011
Geo
Eye
sate
llite
imag
e.

Preliminary evaluation of coastal geomorphology and geohazards on ‘Kigiqtam Iglua’, NE of Shishmaref 11
hindcasting in conjunction with a hydrodynamic circulation model and a detailed bathymetric grid of Norton Sound to develop frequency-of-occurrence relationships for storm-surge water levels. The 100-year surge eleva-tion in that study agrees with the 100-year surge elevation that FEMA used in the creation of flood insurance rate maps for Shishmaref. The 2009 USACE hindcast-derived values have been used in this preliminary Kigiqtam Iglua inundation mapping. The close proximity of Kigiqtam Iglua to Sarichef Island suggests similar surge condi-tions, although the wave runup elevations may differ slightly based on variation in the slope of the fronting beach (Stockdon and others, 2006).
Table 1. Published extreme water level determinations for Shishmaref, Alaska. All elevations in table are relative to NAVD88
Source recurrence interval
Storm Surge including Tide
includingWave runup
Storm-Induced Water Level Prediction Studya
(Chapman and others, 2009)
5 years 1.8 m —10 years 2.1 m —20 years 2.3 m —
100 years 2.6 m —Shishmaref Beach Stabilization Plansb
(USACE, 2009) — — 4.7 m (extreme)
Flood Insurance Studyc
(FEMA, 2009)50 years 2.4 m —
100 years 2.6 m 3.4 mSpecial Flood Hazard Reportc
(USACE, 1976) 100 years 2.4 m 3.4 – 4.1 m2.8 m (lagoon side)
Storm Surge Climatology(Wise and others, 1981)
Falls in sector of the state with insufficient historic surge records to satisfy methodology of Wise and others, 1981.
aElevations originally presented relative to MTLbElevations originally presented in feet relative to MLLWcElevations originally presented in feet relative to MSL; runup value calculated for transects on Sarichef Island only
Figure 10b provides an overview of areas on Kigiqtam Iglua that are vulnerable to coastal flooding at recurrence intervals ranging from 5 to 100 years. The largest portion of the map with insufficient elevation data (shown in black) is predominantly low-lying with a greater than 1 in 10 annual chance of inundation. There are five higher elevation regions on the island (shown in blue); the one near the northeast end of the island is a tall and broad foredune and the rest are raised ridge complexes. Many of the troughs in the ridge complexes may be vulnerable to inundation at an annual probability of 1 in 100. The flood vulnerability map presented here also illustrates that roughly one-third of the island is subject to inundation during large storms with recurrence intervals of 20 years or less and that many of the revegetated channels across the island can be temporarily reactivated during these events.
The first line of defense against coastal flooding on a barrier island is the foredune ridge. Ultimately, the impacts of any particular storm are highly dependent on the nature and geometry of this feature and how it is modified dur-ing the course of the storm (Sallenger, 2000). To account for the fact that the vulnerability map (fig. 10b) is limited to single-value water surfaces, in which the impacts of wave runup are not included, a foredune vulnerability band has been added to the map. This band, based on the FEMA (2009) runup estimate, identifies the open-ocean por-tions of Kigiqtam Iglua that are susceptible to overtopping or inundation of the foredune during large storm events. This highlights areas where breaches are most likely to be initiated that could lead to more extensive flooding on the island. One factor that could contribute to enhanced stability of the foredune in this particular setting is the underlying peat that may serve as ‘natural armoring’ by limiting undercutting and reducing wave-induced erosion over the course of a storm event. Additional investigations are required to determine if a significant relationship exists between the presence or absence of peat and associated rates of coastal retreat.
The overtopping and inundation band suggests that roughly 50 percent of the island may be subject to inunda-tion or overtopping of raised backbeach features on a 20-year frequency. This is supported by observations in the field of recent strandlines atop backbeach vegetation (see fig. 7) and log-sized driftwood >100 m inland from the beach. Recent aerial images demonstrate the ability of storms to breach the foredune ridge within the past 10 years (see fig. 11). This barrier island has numerous geomorphic signatures of washover events and frequent inundation of low-lying areas that result in inland transport of sediment by flood waters. It would be reasonable to assume that these flooding processes that have shaped the island thus far will continue to occur into the future.

12 Preliminary Interpretive Report 2013-3
oTHEr HAZArdS And conSidErATionSAs investigations continue into how a changing environment is affecting northwest Alaska, a declining trend in
sea ice extent has strong implications for shifts in both flooding recurrence intervals and net erosion rates. Projec-tions of sea ice in the Chukchi Sea indicate a lengthening ice-free season and longer periods of partial ice cover during the melt and freeze-up seasons over the next 100 years (Douglas, 2010). The maximum extent of Arctic sea ice is also decreasing (Forbes, 2011; Perovich and Richter-Menge, 2009), and this has produced an increase in fetch distances over which Chukchi Sea wind waves are generated. Recent declines in sea ice extents over the last two decades have been shown to correlate with an approximately 2 cm/year increase in average significant wave heights in the southeastern Chukchi Sea (Francis and others, 2011).
The coast around Shishmaref is increasingly exposed to open-ocean conditions and larger waves, particularly during the fall storm season, with freeze-up occurring an average of three weeks later since the early 1990s (Hufford and Partain, 2004). Under these conditions, high-energy littoral transport is expected to occur more often. Since longshore transport in Shishmaref during high-energy conditions typically moves in an opposite direction to low-energy transport, there is a possibility of local reversals in the direction of net sediment transport that could alter trends in the geomorphic dynamics of the barrier island. A net increase in the number of wave-impact hours (the annual frequency and duration of wave-attack at the toe of the foredune) is also expected under prolonged open-ocean conditions. The efficacy of these waves at producing episodes of significant coastal retreat is increased in the absence of nearshore slush or shore-fast ice, which can dampen breaking wave energy. Likewise, storm surges and coastal flooding occur more readily in areas that are unprotected by ice.
As mentioned in the discussion of shoreline change, shifts in the direction of fall storm tracks (Manley and others, 2007a) that occur due to typical Arctic atmospheric oscillations (e.g. Aleutian low anomaly) or as a result of human-induced climate change are likely to have an effect on net erosion and deposition rates that are more complex than a simple correlation to declining sea ice. As atmospheric and oceanographic conditions change in the vicinity of Shishmaref, continued monitoring of shoreline change will provide additional insight into how the evolution of the barrier island system is being affected by these changes.
Other coastal geohazards to which Kigiqtam Iglua may be vulnerable, but which have not been evaluated in the scope of this report, include erosion from permafrost degradation, ice override (or ivu), tsunami, and inunda-tion due to relative sea level rise. Shishmaref has been characterized as having no local tsunami potential and is at negligible risk from a distant tsunami due to its position along the shallow Chukchi Sea continental shelf, which dissipates energy from tsunami waves traveling across the ocean (Alaska Earthquake Information Center [AEIC],
Figure 11. A side-by-side comparison of a region at the northeast end of Kigiqtam Iglua where wave action during elevated ocean surface conditions was able to breach the 3 m foredune ridge. The blue oval is at the same position in both images. The washover deposit visible in the 2009 image is delineated by a black dotted line.

Preliminary evaluation of coastal geomorphology and geohazards on ‘Kigiqtam Iglua’, NE of Shishmaref 13
2013). Likewise, sea-level curves obtained from paleo-marsh peats along Alaska’s Chukchi coast suggest a sea-level rise rate for the duration of Kigiqtam Iglua’s late-Holocene history of approximately 0.27 mm/year. This is lower than global averages of 1 mm/year (Mason and Jordan, 2002), and much lower than the modern global mean sea level rise rate of approximately 2.8 mm/year (NOAA, 2013a). This rate of sea-level rise is consistent with an expectation for moderate sea-level rise in arctic regions (Forbes, 2011). The role that permafrost plays in the stability of Kigiqtam Iglua and the potential for ice override on this portion of the coast have not been fully investigated at this time.
AddiTionAL Work To BE conducTEdDuring the next two years, the DGGS coastal hazards team is scheduled to complete a final assessment of
coastal geohazards in the vicinity of Shishmaref. This work will extend to more than 100 km of coastline, including Kigiqtam Iglua, Sarichef Island, adjacent parts of the barrier system, and the Shishmaref Lagoon.
Final multi-hazard maps will incorporate new elevation data from the Statewide Digital Mapping Initiative (SDMI). These maps will include additional information about non-uniform flood levels, enhanced calculation and validation of wave runup and surge values, more clearly delineated vulnerability zones that exclude non-inundated low areas, and robust error estimates. The team will map, categorize, and describe coastal geomorphology in terms of relative vulnerability to coastal hazards.
Additional field data will also be processed for publication. These data include (1) radiocarbon ages from peat deposits in the beach ridges, which provide additional insight into the depositional history of the island, (2) bathymetric measurements along ship tracks that cover the nearshore, the three inlets, and portions of the lagoon, and (3) detailed coastal profile elevation measurements that can be used to quantify volumes of sediment erosion and deposition in the subaerial coastal zone.
AcknoWLEdgMEnTSThis preliminary investigation was funded with qualified outer continental shelf oil and gas revenues through
the Coastal Impact Assistance Program, Fish & Wildlife Service, and U.S. Department of the Interior. The views and conclusions contained in this document are those of the authors and should not be interpreted as represent-ing the opinions or policies of the U.S. Government. Mention of trade names or commercial products does not constitute their endorsement by the U.S. Government. Additional funding to conduct bathymetric measurements was provided through a Western Alaska Conservation Cooperative agreement with the Fish & Wildlife Service, U.S. Department of the Interior.
The authors are grateful to Jimmy Seetimona and Dennis Sinnok for logistical assistance and for providing boat access to Kigiqtam Iglua. Owen Mason (GeoArch Alaska) aided in the collection of field data and provided useful feedback on the content of this report. Special thanks also to John Sinnok for guidance on Iñupiaq place names and to John Harper (Coastal and Ocean Resources, Inc.) and the ShoreZone program for supplying some of the oblique aerial images used in this report. Technical review was generously provided by Rod Combellick (DGGS) and Yuri Gorokhovich (Lehman College, NY).
rEFErEncESAlaska Department of Military & Veterans Affairs (ADMVA), Division of Homeland Security & Emergency Man-
agement, 2008, Summary of Alaskan flood disasters, 1978–2008, sorted by region, community, and year: Alaska Department of Military & Veterans Affairs, Division of Homeland Security & Emergency Management.
Alaska Department of Transportation and Public Facilities (DOTPF), 2009, Shishmaref relocation road: Alaska De-partment of Transportation & Public Facilities Geotechnical Data Report, Northern Region, AKSAS 76776, 114 p.
Alaska Earthquake Information Center (AEIC), 2013, Tsunami inundation mapping for Alaska communities [website], last accessed January 2013: http://www.aeic.alaska.edu/tsunami/.
Azelton, M.T., Epps, L.N., Astley, B.N., Zufelt, J.E., and Bjella, Kevin, 2009, Geophysical Investigations at Shish-maref, Alaska: U.S. Army Corps of Engineers, Engineering Research and Development Center 2009, 8 p.
Becker, Steven, Richter, Lori W., Sampson, Robert W., and White, Joe D., for Shishmaref Erosion Control and Reloca-tion Coalition, October 2002, Preliminary natural resources assessment of relocation and emergency evacuation sites discussion paper: U.S. Department of Agriculture, Natural Resource Conservation Service, 10 p.
Bristol Environmental & Engineering Services Corporation for Shishmaref Erosion and Relocation Coalition and Kawerak, Inc., June 2010, Shishmaref relocation plan update final, Shishmaref, Alaska: Anchorage, Alaska, Bristol Environmental & Engineering Services Corporation, 43 p.
14 Preliminary Interpretive Report 2013-3
Chapman, R.S., Kim, Sung-Chan, and Mark, D.J., for U.S. Army Corps of Engineers, Alaska District, 2009, Storm damage and flooding evaluation, storm-induced water level prediction study for the western coast of Alaska: Vicksburg, Mississippi, U.S. Army Engineer Research and Development Center, Coastal and Hydraulics Labo-ratory, 92 p.
Cross, A.E., 2010, Synoptic drivers of storm surge in Kotzebue Sound: Fairbanks, AK, University of Alaska Fair-banks, M.S. Thesis, 94 p.
Coastal and Ocean Resources, Inc. (CORI), 2012, Kotzebue 2012 aerial video imaging survey, 18 July–22 July 2012: Victoria, BC, Canada, Coastal and Ocean Resources, Inc., 1 data DVD, data available online though NOAA at http://mapping.fakr.noaa.gov/szflex/.
Davis, R.A., and Hayes, M.O., 1984, What is a wave-dominated coast?: Marine Geology, v. 60, p. 313–329.Dolan, R., Fenster, M.S., and Holme, S.J., 1991, Temporal analysis of shoreline recession and accretion: Journal of
Coastal Research, v. 7, no. 3, p. 723–744. Douglas, D.C., 2010, Arctic sea ice decline—Projected changes in timing and extent of sea ice in the Bering and
Chukchi seas: U.S. Geological Survey Open-File Report 2010-1176, 32 p., http://pubs.usgs.gov/of/2010/1176/.Eningowuk, Luci, of Shishmaref Erosion and Relocation Coalition, 2004, Testimony of the Shishmaref Erosion and
Relocation Coalition before the Committee on Appropriations of the United States Senate [testimony], June 30, 2004: Washington, D.C., Hearing on Alaska Native villages affected by flooding and erosion, 12 p.
Fair, S.W., 1997, Inupiat naming and community history: The Tapqaq and Saniniq coasts near Shishmaref, Alaska: The Professional Geographer, v. 49, no. 4, p. 466–480.
Federal Emergency Management Agency (FEMA), 2009, Digital flood insurance rate map database, City of Shish-maref, AK, USA [electronic resource]: Washington, D.C., U.S. Federal Emergency Management Agency.
Forbes, D.L., ed., 2011, State of the arctic coast 2010—Scientific review and outlook: Geesthacht, Germany, In-ternational Arctic Science Committee, Land–Ocean Interactions in the Coastal Zone, Arctic Monitoring and Assessment Programme, International Permafrost Association, Helmholtz–Zentrum, 178 p., available online at http://arcticcoasts.org.
Francis, O.P., Panteleev, G.G., and Atkinson, D.E., 2011, Ocean wave conditions in the Chukchi Sea from satellite and in situ observations: Geophysical Research Letters, v. 38, 5 p. doi:10.1029/ 2011 GL049839
Gorokhovich, Yuri, and Leiserowiz, Anthony, 2012, Historical and future coastal changes in northwest Alaska: Journal of Coastal Research, v. 28, n. 1A, p. 174–186. doi: 10.2112/JCOASTRES-D-11-00031.1
Hufford, Gary, and Partain, James, 2004, Climate change and short-term forecasting for Alaskan northern coasts: Anchorage, Alaska, National Weather Service, 5 p., https://ams.confex.com/ams/pdfpapers/83001.pdf
Kawerak Inc., 2009, Shishmaref local economic development plan 2004–2009, State of Alaska Department of Commerce, Community & Economic Development Department, Community Services Division, Kawerak, In-corporated, Nome, Alaska, 55 p.
Kinsman, N.E.M. and DeRaps, M.R., 2012, Coastal hazard field investigations in response to the November 2011 Bering Sea storm, Norton Sound, Alaska: Alaska Division of Geological & Geophysical Surveys Report of In-vestigation 2012-2 v. 1.1, 51 p., 1 sheet.
Manley, W.F., Mason, O.K., Jordan, J.W., Lestak, L.R., Sanzone, D.M., and Parrish, E.G., 2007a, Coastal change since 1950 in the southeast Chukchi Sea, Alaska, based on GIS and field measurements: Arctic Coastal Zones at Risk poster, available online. http://instaar.colorado.edu/QGISL/ARCN/downloads/Manley%20et%20al%20Arctic%20Coastal%20Zones%202007%20poster.pdf.
Manley, W.F., Sanzone, D.M., Lestak, L.R., and Parrish, E.G., 2007b, High-resolution orthorectified imagery from 2003 for the coastal areas of Bering Land Bridge NP (BELA) and Cape Krusenstern National Monument (CAKR), Northwest Alaska: Fairbanks, AK, National Park Service, Arctic Network I&M Program, digital media. http://instaar.colorado.edu/QGISL/ARCN/.
Marino, Elizabeth, 2012, The long history of environmental migration—Assessing vulnerability construction and obstacles to successful relocation in Shishmaref, Alaska: Global Environmental Change, v. 22, no. 2, p. 374–381.
Mason, O.K., 1996, Geological and anthropological considerations in relocating Shishmaref, Alaska: Alaska Division of Geological & Geophysical Surveys Report of Investigation 96-7, 18 p., 1 sheet, scale 1:63,360.
Mason, O.K., Hopkins, D.M., and Plug, Lawrence, 1997b, Chronology and paleoclimate of storm-induced erosion and episodic dune growth across Cape Espenberg Spit, Alaska, USA: Journal of Coastal Research, v. 13, no. 3, p. 770–797.
Mason, O.K., and Jordan, J.W., 2002, Minimal late Holocene sea level rise in the Chukchi Sea: Arctic insensitivity to global change?: Global and Planetary Changes, v. 32, no.1, p. 13–23.

Preliminary evaluation of coastal geomorphology and geohazards on ‘Kigiqtam Iglua’, NE of Shishmaref 15
Mason, O.K., Jordan, J.W., Lestak, L.R., and Manley, W.F., 2012, Narratives of shoreline erosion and protection at Shishmaref, Alaska—The anecdotal and the analytical, in Cooper, J.A.G., and Pilkey, O.H., eds., Pitfalls of shoreline stabilization—Selected case studies: Coastal Research Library 3, DOI 10.1007/978-94-007-4123-2_5, p. 71–92.
Mason, O.K., Neal, W.J., Pilkey, O.H., and Bullock, Jane, 1997a, Living with the coast of Alaska: Durham, NC, Duke University Press, 348 p.
Naidu, A.S., and Gardner, G., 1988, Marine geology, in Hameedi, M.J., and Naidu, A.S., eds., The Environment and Resources of the Southeastern Chukchi Sea, Outer Continental Shelf Study: U.S. Minerals Management Services, Mineral Management Study 87-0113, p. 11–28.
National Oceanic and Atmospheric Administration (NOAA), 2013a, Global sea level time series—Laboratory for satellite altimetry [website], last accessed January 2013: http://ibis.grdl.noaa.gov/SAT/SeaLevelRise/LSA_SLR_timeseries_global.php.
———2013b, Tides & Currents, Center for Operational Oceanographic Products and Services (CO-OPS) [website], last accessed January 2013: http://tidesandcurrents.noaa.gov/.
———2009, Coastal Inundation Mapping Guidebook: Charleston, SC, Coastal Services Center, 26 p.National Oceanic and Atmospheric Administration (NOAA), Department of Commerce (DOC), National Ocean
Service (NOS), and Coastal Services Center (CSC), 2004, 2004 Alaska lidar mapping: Charleston, SC, NOAA Ocean Service, Coastal Services Center, digital data available online at http://www.csc.noaa.gov/lidar
Natural Resource Conservation Service (NRCS), 2004, Site comparison of Tin Creek and West Tin Creek Hills for potential emergency evacuation and permanent relocation sites: The Shishmaref Erosion and Relocation Coali-tion, 16 p.
Paine, J.G., and Morton, R.A., 1989, Shoreline and vegetation line movement, Texas Gulf Coast, 1974–1982: Austin, TX, The University of Texas at Austin, Bureau of Economic Geology, Geological Circular 89-1, 50 p.
Pajak, M.J., and Leatherman, S.P., 2002, The high water line as a shoreline indicator: Journal of Coastal Research, v. 18, no. 2, p. 329–337.
Parnell, Sean, 2011, State of Alaska declaration of disaster emergency: Juneau, Alaska, Office of the Governor of the State of Alaska, December 5, 2011, 4 p., http://gov.alaska.gov/parnell_media/resources_files/declaration120511.pdf
Perovich, D.K., and Richter-Menge, J.A., 2009, Loss of sea ice in the arctic: Annual Review of Marine Science, v. 1, p. 417–441, http://imb.crrel.usace.army.mil/pdfs/annurev.marine.010908.pdf
Pilkey, O.H., 2003, Arctic Islands, in A Celebration of the World’s Barrier Islands: New York, NY, Columbia Uni-versity Press, p. 221–241.
Sallenger, A.H., Jr., 2000, Storm impact scale for barrier islands: Journal of Coastal Research, v. 16, no. 3, p. 890–895.Shishmaref Alaska Erosion & Relocation Coalition (SERC), 2013, Shishmaref Erosion & Relocation Coalition
[website], last accessed January 2013: http://www.shishmarefrelocation.com/.Stockdon, H.F., Holman, R.A., Howd, P.A., and Sallenger, A.H., Jr., 2006, Empirical parameterization of setup, swash
and runup: Coastal Engineering, v. 53, p. 573–588.Tetra Tech, 2004, Shishmaref partnership: Shishmaref relocation and collocation study, Shishmaref, Alaska: Anchor-
age, Alaska, Preliminary Cost of Alternatives report to U.S. Army Corps of Engineers, Alaska District, 133 p.Thieler, E.R., Himmelstoss, E.A., Zichichi, J.L., and Ergul, Ayhan, 2009, Digital Shoreline Analysis System (DSAS)
version 4.0—An ArcGIS extension for calculating shoreline change: U.S. Geological Survey Open-File Report 2008-1278, available online at http://pubs.usgs.gov/of/2008/1278/.
United States Army Corps of Engineers (USACE), 1976, Special flood hazard report—Wave runup study, Shishmaref: Alaska District, 21 p.
———2006a, Shishmaref, Alaska, Section 117 project fact sheet. Available online. http://nome.colorado.edu/HARC/members/Scanned_docs/ArmyCorps_2006_ShishText.pdf.
———2006b, Alaska baseline erosion assessment, AVETA Summary Report—Shishmaref, Alaska: Alaska Village Erosion Technical Assistance (AVETA) Program, Alaska District, 6 p.
———2009, Alaska coastal erosion, Shishmaref, Alaska: Alaska District, Contract No. W911KB-07-C-0022, 11 p.———2011, Flood hazard data for Alaska communities: Alaska District, Civil Works Floodplain Management,
available online. http://www.poa.usace.army.mil/en/cw/fld_haz/floodplain_index.htm.United States Census Bureau, 2010, Profile of general population and housing characteristics, 2010 demographic
profile data, available online, http://factfinder2.census.gov/main.html.URS Corporation, 2012, Shishmaref Relocation Study, unpublished early project documents: Anchorage, Alaska, 2 p.Wise, James L., Comiskey, Albert L., and Becker, Richard, 1981, Storm surge climatology and forecasting in Alaska:
Anchorage, Alaska, Alaska Council on Science and Technology, Arctic Environmental Information and Data Center, University of Alaska, 32 p.