preliminary evaluation of ohio’s drug court efforts · pdf file ·...
TRANSCRIPT

1
Preliminary Evaluation of Ohio’s Drug
Court Efforts
Draft report September 2001
Final report issued November 2001
By:
Edward J. Latessa, Ph.D.
Principal Investigator
Shelley Johnson Listwan, Ph.D. Project Director
Deborah Koetzle Shaffer, M.A. Christopher Lowenkamp, M.S.
Shamir Ratansi, M.S. Research Associates
Center for Criminal Justice Research Division of Criminal Justice
PO 210389 University of Cincinnati
Cincinnati, OH 45221-0389 __________________ This research was made possible with a grant from the Ohio Office of Criminal Justice Services. Grants number 00DGPEI7375 and 98DGPEI7375. Views expressed are those of the authors and do not necessarily reflect the views of OCJS.

2
Introduction
In 1995, researchers in the Center for Criminal Justice Research at the University
of Cincinnati began an evaluation of Ohio’s first drug court (Hamilton, County). Since
that time numerous other drug courts have been implemented throughout the State. As
part of an on-going evaluation of these efforts, the Center for Criminal Justice Research
has been studying and gathering data from across the drug court in Ohio. This report
provides a preliminary picture of who is being served, and the effectiveness of Ohio’s
drug court programs. The current report presents the results from combining data from
three of the older drug courts in the State and is part of a larger effort to examine existing
data from all of the operating drug courts in the State of Ohio.1
Ohio’s Drug Court Movement: Development & Evaluation Activities
According to the National Association of Drug Court Professionals (2001), there
are approximately 700 drug courts in operation and another 400 in the planning process.
A similar movement in Ohio has paralleled the rapid development of drug courts around
the country. Since 1995 and the inception of the first drug court in Hamilton County,
Ohio, the implementation of this community based initiative has grown exponentially.
What started as two drug courts in 1994 has now grown into 35 fully operating courts and
several more in the planning process. From these numbers it is clear that the Supreme
Court of Ohio and the legislature have made drug courts a priority.
In the early stages of drug court development in Ohio, the Supreme Court of Ohio
decided to engage in a statewide evaluation initiative. In 1997, the University of
Cincinnati’s Center for Criminal Justice Research was asked to provide this important
1 We are currently gathering data from twelve of the Ohio drug courts that have been in operation for several years. In addition, we will be drawing a random sample of drug court participants from other Ohio

3
component. The Supreme Court of Ohio asked the University of Cincinnati develop
evaluation tools that could be used by drug courts statewide.
In our effort to develop a standardized data collection model that could be
maintained at each drug court site, a review of previous outcome and process evaluations
of drug courts was conducted. We found that despite the rapid expansion of drug courts,
very little was known about the effectiveness of the drug court model. After reviewing
the limited assessments of drug court programs, relying on our own experiences with
outcome evaluations, and consulting the literature released from American University’s
Justice Program Office, we began to develop a data collection process to support future
drug court outcome evaluations.
Evaluating Drug Courts
As with any evaluation, assessing the operations and impacts of a drug court
program is a complex process. Each drug court was planned to achieve specific
outcomes for identified types of cases or offenders. While some program impacts are
common to all courts (reduced criminality, reduced substance abuse, etc.), the
characteristics of participants, treatment options, monitoring activities, and sanctions
were expected to vary across sites. The statewide evaluation model needed to be
sensitive to differences between the courts while also producing summary information
about drug courts in general.
A drug court program can be viewed as a process designed to produce specific
impacts, much like a manufacturing operation. The program has inputs (offenders and
offenses, staff, resources), throughput (procedures, treatments, sanctions) and outputs
(changes in recidivism and substance abuse). The drug court evaluation required that we
drug courts sites. The report from this effort should be available in January 2002.

4
develop measures of each component. The impact or effect of drug court programming
can be understood against a benchmark of what would be expected had there been no
court program. Thus, the outcome evaluation required an ability to compare drug court
product (recidivism rates, relapse, levels of substance abuse) with similar measures for
cases that did not participate in the drug court program. Ideally, the evaluation would
enable us to attribute any observed differences only to the drug court.
To do this, the effect of drug court programming on participant levels of
recidivism and substance use would need to be isolated through the development of a
comparison for each court, where the only difference between groups was participation in
the drug court program. Thus, uniform measures of input and output for drug court cases
and a sample of offenders who did not participate are essential. Further, to understand
how the drug court produces differences in output, we need to compare how treatments
differed.
The research team from the University of Cincinnati, had two tasks at hand: (1)
include essential standardized data elements to conduct a future outcome evaluation and,
(2) include all the drug court sites’ recommendations and system requirements in the
development of the data collection forms. Drawing on previous experience, the literature
reviews, and discussions with representatives from the various drug courts, we identified
a set of required data elements to be included in the data collection process. The
evaluation protocol and database was subsequently installed at almost every drug court in
operation2.
2 A few courts chose to develop their own systems and include the necessary data elements for future evaluation purposes.

5
Current Research Focus: Evaluating What We Know
Over the last several years, the drug court project has produced several
evaluations of drug courts across Ohio. Specifically, the Hamilton County (Cincinnati)
drug court has been evaluated twice; once in 1997 capturing their first 18 months in
operation and again in 1999 once the court had a period of time to become better
established. In addition, we recently completed evaluations of both the Erie County
Common Pleas Drug Court, and the Akron (Summit County) Municipal Drug Court.
This outcome study is designed to examine the relative and combined effects of
frequent court contacts and community-based drug treatment on recidivism rates. The
current study builds upon the previous evaluations and research by examining the
following research questions:
(1) What are the characteristics of the offenders served by the drug court? What if any differences exist between the drug court and comparison groups with regard to demographics, current offense, and disposition?
(2) Do drug court participants differ from comparable groups of offenders on various
indicators of criminality? (3) How do drug court participants look on various indicators of drug use? (4) What are the treatment needs and retention rates among drug court participants? (5) What are the court reported violation rates for the drug court participants? And,
in the event of a violation, how does the court handle such matters? (6) Does participation in the drug court affect the likelihood that an individual will
recidivate? (7) What factors predict the likelihood of success/failure?

6
Methods
Research Design & Sample
This project used a quasi-experimental matched comparison group design in order
to estimate the impact of the drug court involvement on future criminal behavior. This
study reports combined data from three different drug courts across Ohio. The three drug
courts serve adult drug offenders. Random assignment to groups was not feasible;
however, groups were matched with regard to selected demographic characteristics as
well as the presence of a substance abuse problem. The criteria for inclusion in the
comparison group were that each participant must have (1) a reported substance abuse
problem, and (2) be eligible for the drug court program. The sample includes 856 drug
court participants and 415 comparison group members. Of the three courts, one court is
in a small jurisdiction (e.g. a population less than 100,000 persons) and two are in large
jurisdictions (e.g. population above 350,000 persons). A description of the three drug
courts follows.
Akron Co Municipal Drug Court Group
The Akron Municipal Drug Court, located in Akron Ohio, began in June 1995.
The target population includes felony level four and five offenders who have been
charged with drug abuse, possession, or complicity. Such charges are amended to a level
one misdemeanor attempted drug abuse charge. Referrals to the program come from
pretrial services in the common pleas court. Eligibility screening is conducted through
several agencies including the narcotics unit, the prosecutor, police, judges, and the
Oriana House caseworker. Once deemed eligible, the treatment provider assesses
potential participants on alcohol and drug dependency.

7
Individuals who are eligible and willing to participate in court mandated drug
treatment were required to attend status review hearings, submit to random drug screens,
and attend four phases of chemical dependency treatment. The first phase of the drug
court is considered the pre-treatment/treatment phase and lasts for two to three months.
Treatment services during this phase are dependent on the results of a substance abuse
screening. Participants who receive “no diagnosis” enter a 10-week outpatient marijuana
education group. Clients in this group meet once a week for sessions lasting one and a
half hours. Participants diagnosed as chemically dependent or as chemical abusers are
placed into either outpatient programming or intensive outpatient services dependent
upon the severity of their drug and alcohol use. The outpatient group meets once a week
for 12 weeks with each session lasting one and a half hours. The intensive outpatient
group, lasting four weeks, meets four times per week for four hours each time. Also
included in the first phase of the treatment program is a relapse prevention component.
Individuals who experience relapse during subsequent phases of the drug court are placed
back into phase one for relapse prevention. This group meets four times a week for four
weeks. Similar to the intensive outpatient group, sessions are four hours each.
Upon completion of the assigned treatment, participants advance to the Aftercare
Phase, which lasts for 12 weeks. During this phase, participants receive treatment
services for one and a half hours once each week. The third phase of the program, the
Maintenance or Step-Down Phase, lasts for 26 to 36 weeks. Throughout this phase,
clients participate in substance abuse treatment twice a month. The final phase of the
program is the Maintained Sobriety Phase, which generally lasts three months. Aside
from 12-step programming, participants are not required to attend any specific substance
abuse treatment. Throughout all four phases, participants are required to attend 12-step

8
groups. Individuals receiving no diagnosis are required to attend a minimum of one
meeting per week, while participants receiving a diagnosis must attend a minimum of two
meetings per week. This requirement is constant throughout the program. Successful
completion of the drug court program requires completion of treatment requirements,
maintained sobriety, 70 percent compliance with all reporting requirements, drug screens,
and curfew requirements, and continued attendance at 12-step meetings.
Erie County Drug Court Group
The Erie County Drug Court, located in Sandusky Ohio, began in April 1996.
The target population included drug dependent adults charged with a non-violent drug or
alcohol related misdemeanor or felony offense. To qualify for the drug court the client
had to apply through the Public Defender’s Office. Background checks were then
conducted and provided to the Public Defenders office, the Prosecutor’s office, and the
Drug Task and provided to the Public Defenders office, the Prosecutor’s office, and the
Drug Task Force. If the parties approved the applicant, the treatment agency provided an
assessment of drug and alcohol dependency. The results were then given to all involved
parties and a hearing with the judge was scheduled to determine whether the client should
enter the program.
Individuals who are eligible and willing to participate in court mandated drug
treatment are required to attend status review hearings in front of the judge and attend
four phases of chemical dependency treatment. In the first phase of treatment,
participants engage in a six to eight week intensive outpatient (IOP) program.
Programming is provided four days per week for three hours per day. The services
offered include individual and group counseling, crisis intervention services, offered
include individual and group counseling, crisis intervention services, occupational

9
therapy, activities therapy, expression therapy (art, drama, poetry, music, movement), and
drug screening. The agency also provides alcohol and drug education, relapse prevention
education, and individual counseling once a week. Family counseling sessions are also
provided to willing family members. Phase II, called continuing care, offers group and
individual counseling for five hours a week for approximately twelve weeks. Phase III,
also considered continuing care, offers group and individual counseling for three hours a
week for eight weeks. Phase IV offers services once a week for the remainder of the
program. The total amount of time between phases one to four spans an average of 17
months. Successful completion of the treatment program requires that the client comply
with all conditions set out by the court, attend court hearings, comply with treatment
goals, provide clean drug and alcohol screens, attend AA/NA meetings, develop a sober
support system, and not be charged with any new violations. Placement into additional
services such as residential and inpatient hospitalization is determined on a case-by-case
basis.
Hamilton County Drug Court Group
The Hamilton County Drug Court began in March 1995. The target population
includes those arrestees who are drug dependent or in danger or becoming drug
dependent. To qualify for the drug court, the following criteria must be met: (1) the
defendant must be charged with a fourth or fifth degree felony (2) there must be no
history of violent behavior (3) the current and/or past criminal behavior is drug-driven (4)
the Hamilton County Prosecutor must approve of all incarcerated offenders’ applications,
(5) the defendant must have no active mental illness, and (6) the offender must
demonstrate a sincere willingness to participate in a 15-month treatment process and have
no acute health conditions.
10
Individuals who are eligible and willing to participate in court mandated drug
treatment are transported to the ADAPT treatment facility for an assessment. This
treatment program was established for all male and female drug court participants.
Individuals must remain at the treatment facility until their court hearing at which time
the treatment recommendation is submitted to the drug court Judge. The treatment
program is community-based and includes three phases: inpatient, outpatient, and
aftercare. Placement in each level of treatment is determined by level of substance
addiction. The residential phase serves fifty-two males and sixteen females. Offenders
sent to the residential phase were required to stay a minimum of two weeks up to a
maximum of ninety days. The intensive outpatient phase lasts approximately four weeks
and groups meet three hours a day four times a week. The continuing care or aftercare
phase initially offers services twice a week for one hour but is eventually scaled down to
one meeting every two weeks. Services offered during all three phases include: group
and individual counseling, sobriety meetings, educational services, and family
involvement. The total amount of time between commencing the residential phase to
completion of aftercare spans an average of 15 months. The purpose of the treatment
facility is to provide community-based substance abuse treatment coupled with close
supervision and frequent urinalysis.
Control Group
All of the control group members selected for each county include men and
women who were eligible for drug court, however did not receive drug court services.
This group of clients did in fact have a drug abuse problem, however either refused drug treatment or were refused by the treatment facility. A total of 415 offenders were
included in the comparison group.

11
Comparability of the Courts
The courts used in the analysis are similar to one another as well as those across
the United States. The drug courts all provide community based treatment services,
judicial monitoring, and frequent urinalysis. The eligibility criteria used by each court is
based on the current and past behavior of the defendant and a willingness to participate in
the services provided. Typically, the courts accept participants who are arrested for a
drug or drug related crime or those who exhibit a drug problem. The judge, prosecutor,
and treatment agency typically screen the potential participants. Offenders are often
given a suspended sentence of jail or prison time in the event that they fail the program,
the court may invoke the terms. The courts normally exclude traffickers, those with a
history of violence, sex offenses, mental illness, and those with acute health conditions.
Offenders who refuse to participate in the drug court program have their case adjudicated
through traditional courts and typically receive probation or, in some cases, jail or prison.
Although random assignment to the treatment and control groups was not
possible, we may be cautiously optimistic that members of the two groups do not differ
significantly on factors associated with relapse and criminality. Specifically, the
treatment group does not differ significantly from the control groups with regard to race,
gender, age, marital status, or education level (see Table 1). The majority in both groups
was African American (58%), male, approximately 31 years of age, and not married. In
fact, the only significant differences between the two groups are with regard to education
level and employment status. Specifically, Table 1 indicates that significantly more
individuals in the treatment group graduated from high school (66%) and were employed
full time (30%) in contrast to the comparison group with 58 percent and 16 percent
respectively.

12
Table 1. Background Characteristics of the Drug Court and Comparison Groups Drug Court Comparison N % N % Characteristics (n=856) (n=415) Race White 354 41.4 170 41.0 Black 497 58.1 241 58.1 Hispanic 2 .2 1 .2 Other 2 .2 3 .7 Gender Male 659 77.0 307 74.0 Female 197 23.0 108 26.0 Age 18-22 176 22.2 82 29.9 23-28 131 16.5 40 14.6 29-34 147 18.5 44 16.1
35-40 190 23.9 54 19.7 41 & above 150 18.9 54 19.7 Mean 31.2 32.1 Marital Status Married 101 17.2 81 20.8 Not Married 485 82.8 308 79.2 Highest Grade Completed Less than High School 197 33.7 134 42.1 High School Graduate 388 66.3 184 57.9 χ2 = 6.355; p = .012 Hours Per Week Worked Full Time 143 29.6 48 16.2
Part Time 163 33.7 139 46.8 Unemployed 177 36.6 110 37.0
χ2 = 1.679; p = .000 Ns may not total 856 or 415 due to missing data. This pertains to all tables and figures.

13
Data Collection
As part of the Supreme Court project, the University of Cincinnati created an
automated database to assist courts with data collection and provide a mechanism for
reporting results. The data collected include: basic offender demographics, offense and
disposition, prior criminal history, drug use and treatment history, current treatment
needs, treatment placement and outcome, court reported violations, satisfaction with the
drug court and its process, and termination status of drug court participants. Each site
collected recidivism data.
Measures
Independent Variables: To explore the determinates of recidivism, we examine
the effects of a number of independent variables. Of primary interest was whether
participation in the drug court influenced the probability that an individual would
recidivate. To assess this issue, we explored whether being assigned to the treatment
group versus being assigned to a control group affected various outcomes (1 = drug court,
0 = control group). Also of interest was whether any of the social demographic variables
influenced the probability of future offending or predicted the likelihood of success. As
such, gender, race, age, employment status, education level, etc. were included in the
analysis as control variables in both analyses. Similarly, given different follow-up
periods, we have included a measure of time at risk as a control variable.
Dependent Variables: There were two major dependent variables included in this
study; program completion and recidivism, define as a new arrest. We also explored
arrest charge and whether an individual was arrested on multiple occasions. Using these
data, the multivariate analyses distinguished the various predictors associated with
program completion and a new arrest.
14
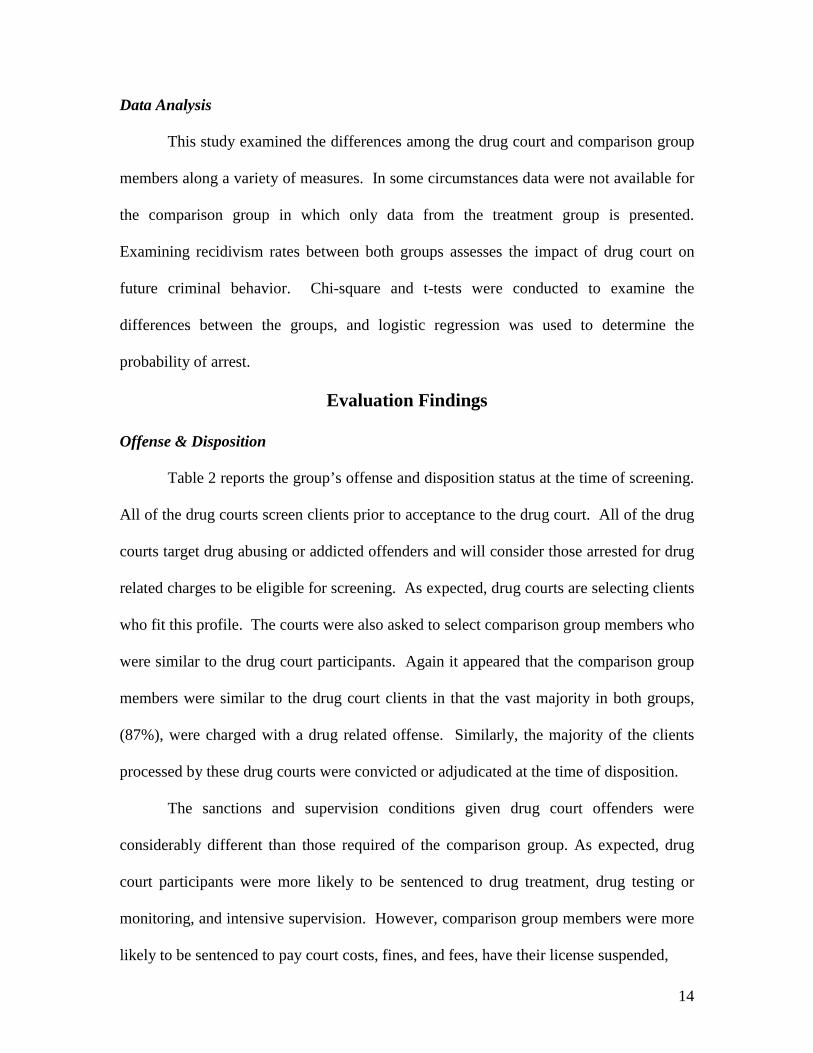
Data Analysis
This study examined the differences among the drug court and comparison group
members along a variety of measures. In some circumstances data were not available for
the comparison group in which only data from the treatment group is presented.
Examining recidivism rates between both groups assesses the impact of drug court on
future criminal behavior. Chi-square and t-tests were conducted to examine the
differences between the groups, and logistic regression was used to determine the
probability of arrest.
Evaluation Findings Offense & Disposition
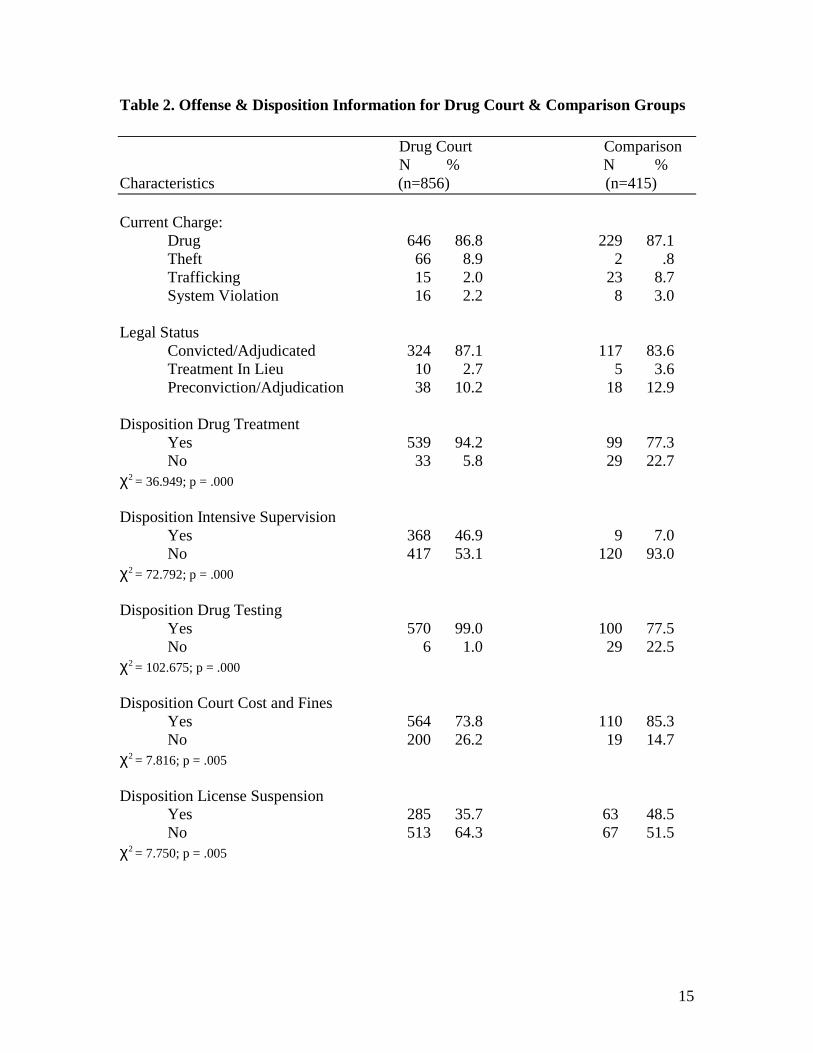
Table 2 reports the group’s offense and disposition status at the time of screening.
All of the drug courts screen clients prior to acceptance to the drug court. All of the drug
courts target drug abusing or addicted offenders and will consider those arrested for drug
related charges to be eligible for screening. As expected, drug courts are selecting clients
who fit this profile. The courts were also asked to select comparison group members who
were similar to the drug court participants. Again it appeared that the comparison group
members were similar to the drug court clients in that the vast majority in both groups,
(87%), were charged with a drug related offense. Similarly, the majority of the clients
processed by these drug courts were convicted or adjudicated at the time of disposition.
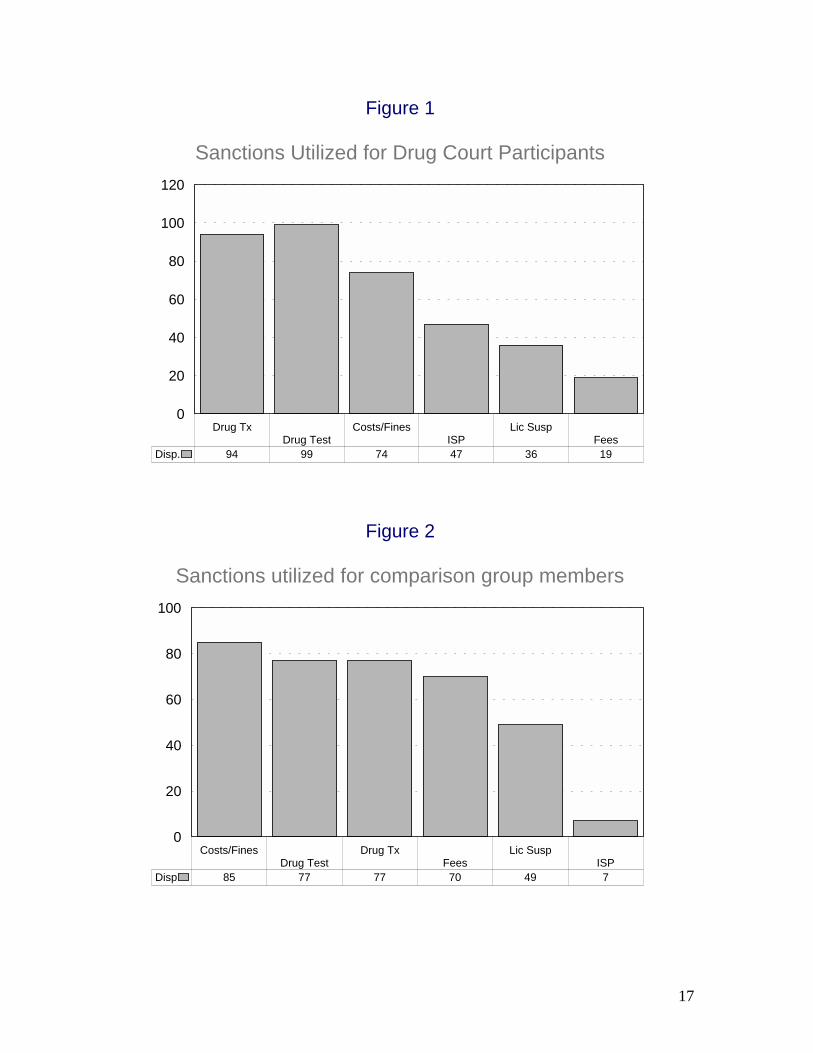
The sanctions and supervision conditions given drug court offenders were
considerably different than those required of the comparison group. As expected, drug
court participants were more likely to be sentenced to drug treatment, drug testing or
monitoring, and intensive supervision. However, comparison group members were more
likely to be sentenced to pay court costs, fines, and fees, have their license suspended,
15
Table 2. Offense & Disposition Information for Drug Court & Comparison Groups Drug Court Comparison N % N % Characteristics (n=856) (n=415) Current Charge:
Drug 646 86.8 229 87.1 Theft 66 8.9 2 .8
Trafficking 15 2.0 23 8.7 System Violation 16 2.2 8 3.0 Legal Status Convicted/Adjudicated 324 87.1 117 83.6 Treatment In Lieu 10 2.7 5 3.6 Preconviction/Adjudication 38 10.2 18 12.9 Disposition Drug Treatment Yes 539 94.2 99 77.3 No 33 5.8 29 22.7 χ2 = 36.949; p = .000 Disposition Intensive Supervision Yes 368 46.9 9 7.0 No 417 53.1 120 93.0 χ2 = 72.792; p = .000 Disposition Drug Testing Yes 570 99.0 100 77.5 No 6 1.0 29 22.5 χ2 = 102.675; p = .000 Disposition Court Cost and Fines Yes 564 73.8 110 85.3 No 200 26.2 19 14.7 χ2 = 7.816; p = .005 Disposition License Suspension Yes 285 35.7 63 48.5 No 513 64.3 67 51.5 χ2 = 7.750; p = .005

16
Table 2. Offense & Disposition Information for Drug Court & Comparison Groups, Continued Drug Court Comparison N % N % Characteristics (n=856) (n=415) Disposition Fees Yes 101 19.3 90 70.3 No 421 80.7 38 29.7 χ2 = 128.668; p = .000 Disposition Work Detail Yes 2 .4 24 18.6
No 521 99.6 105 81.4 χ2 = 89.742; p = .000 Disposition Electronic Monitoring Yes 6 1.1 3 2.3 No 516 98.9 126 97.7 Disposition Community Service Yes 15 2.0 11 8.5 No 734 98.0 118 91.5 χ2 = 16.302; p = .000 Disposition Restitution Yes 11 2.1 2 1.6 No 511 97.9 127 98.4
17
Figure 1
Sanctions Utilized for Drug Court Participants
Drug TxDrug Test
Costs/FinesISP
Lic SuspFees
0
20
40
60
80
100
120
Disp. 94 99 74 47 36 19
Figure 2
Sanctions utilized for comparison group members
Costs/FinesDrug Test
Drug TxFees
Lic SuspISP
0
20
40
60
80
100
Disp 85 77 77 70 49 7

18
participate in work detail and community service. Figures 1 and 2 list the various
sanctions used for each group in the order of importance.
Prior Criminal Involvement
As indicated by the results of the 1997 Drug Court Survey Report, compiled by
American University, although many drug courts began as pretrial diversion programs,
we now see that these program have now moved towards accepting more serious
offenders. The drug courts in Ohio are no exception.
Table 3 illustrates the prior criminal involvement of the drug court and
comparison groups. Specifically, 88 percent of the drug court participants had a prior
adult or juvenile record, in contrast to 80 percent of the comparison group members.
With regard to felony arrests, drug court clients were slightly less likely than comparison
group members to have a record, however, better than 50 percent had at least one prior
arrest in their history. While this is again lower than the close to 70 percent of the
comparison group that had a prior felony record, it still illustrates that the drug courts are
considering a wide array of clients. With regard to misdemeanor arrests, the two groups
are similar with better than 80 percent in both group having a prior misdemeanor record.
Finally, the vast majority in both groups did not have a prior delinquent record.
Another important predictor of behavior is whether the client has previously been
under supervision and their participation therein. The courts indicated that to their
knowledge the majority in both groups did not have prior sentences to community
supervision. However, when comparing those who were under supervision at one time,
we find that the comparison group members were significantly more likely to be
terminated unsuccessfully.

19
Table 3. Criminal History for the Drug Court & Comparison Group ________________________________________________________________________ Drug Court Comparison N % N % Characteristics (n=856) (n=415) Prior Record (Adult or Juvenile) Yes 756 88.3 330 79.5 No 100 11.7 85 20.5 χ2 = 17.402; p = .000 Number of Prior Felony Arrests None 281 47.5 120 30.5 1 141 23.8 114 29.0 2 or more 170 28.7 159 40.5 Number of Prior Misdemeanor Arrests None 111 18.8 65 16.8 1-5 378 63.9 245 63.3 6-10 57 9.7 26 6.7 11-15 30 5.1 12 3.2 16 or more 16 2.9 39 10.0 Number of Prior Delinquent Arrests None 322 86.3 144 91.7 1 24 6.4 3 1.9 2 or more 27 7.3 10 6.4 Number of Prior Sentences to Community Supervision None 273 73.6 94 67.6 1 73 19.7 35 25.2 2 or more 25 6.7 10 7.2 Unsuccessful Terminations None 312 84.1 129 94.9 1 40 10.8 5 3.7 2 or more 19 5.1 2 1.5 χ2 = 10.186; p = .006
20
Drug Use Patterns
In a survey of drug courts across the nation, American University found that most
programs report that participants are presenting moderate to severe substance abuse
histories (Cooper, 1997). As seen in Table 4, we find that drug court clients in Ohio are
no exception. The clients were asked drug of choice and severity of their use. These data
illustrate that the primary drug of choice was crack/cocaine (38%), followed by
marijuana (35%) and alcohol (22%). The drugs reported as a second choice, however,
differ among participants. Specifically, the drug listed in order of importance was alcohol
(44%), marijuana (31%), and crack/cocaine (25%). The third drug of choice clearly
illustrated that these three drugs were the most commonly used and preferred by drug
court clients.
In addition to drug of choice, history of drug abusing behavior is also an
important concern for drug courts. The data in Table 4 further indicated that 45 percent
of the participants began using alcohol and/or drugs between the ages of 14 and 17;
which illustrates the chronic nature of their addiction. With regard to their current use,
only 20 percent use alcohol daily, however, the group was evenly split between those
who used once a week (40%) or less than once a week (40%). Drug using behavior
appeared to occur with more frequency, with 35 percent reporting daily drug use
followed by 36 percent who used on a weekly basis, and 29 percent less than once a
week.
Finally, participants were also asked to report whether their family used drugs or
alcohol, whether they had participated in previous drug treatment, or whether they have
previously received a dual diagnosis. As indicated, while the majority reported no to the
above mentioned questions, it is still worth noting that 38 percent did have families with

21
Table 4. Substance Use Severity for the Drug Court Group ________________________________________________________________________
Drug Court N %
Characteristics (n=856) Did Offender Receive Drug Assessment Yes 342 96.1 No 14 3.9 Primary Drug of Choice Alcohol 79 22.4 Marijuana 124 35.2 Crack/Cocaine 135 38.4 Narcotics 9 2.6 Depressants 1 .3 Stimulants 4 1.1 Second Drug Choice Alcohol 134 43.6 Marijuana 94 30.6 Crack/Cocaine 76 24.8 Narcotics 2 .7 Hallucinogens 1 .3 Third Drug of Choice Alcohol 79 36.6 Marijuana 71 32.9 Crack/Cocaine 51 23.6 Narcotics 4 1.9
Stimulants 6 2.8 Hallucinogens 4 1.9 Other 1 .5

22
Table 4. Substance Use Severity for the Drug Court Group, continued Drug Court N % Characteristics (n=856) Age of First Alcohol Use Under 10 76 12.4 10-13 125 20.5
14-17 274 44.8 18-22 123 20.2 23-27 10 1.6 Over28 3 0.5 Mean 13.3
Age of First Drug Use Under 10 52 8.5 10-13 95 15.6
14-17 272 44.5 18-22 141 23.1 23-27 22 3.6
Over28 29 4.7 Mean 14.9 Frequency of Alcohol Use Daily 114 21.0 Once a week 212 39.0 Less than once a week 218 40.1 Frequency of Drug Use Daily 185 35.4 Once a week 186 35.6 Less than once a week 151 28.9 Family Have Chemical Dependency Problem Yes 132 38.3 No 213 61.7 Has Offender Had Previous Drug Treatment Yes 145 41.3 No 206 58.7 Is Offender Dual Diagnosed with Drug/Mental Yes 29 8.3 No 322 91.7

23
chemical dependency problem and 41 percent have previously engaged in treatment. This
gives us a perspective about both the type of client and the problems they are confronted
within their social settings, and although only 8 percent of the clients have received a
dual diagnosis of drug dependency and mental illness, this group poses significant
challenges to the drug court team. Specifically, it raises the question as to whether the
court is equipped to serve a population with these specific needs.
Treatment & Performance
The drug court participants were asked to discuss their various treatment needs
and rate those needs as chronic, frequent, situational, or not a problem at all. Table 5 lists
the areas of need discussed with the clients. Over 80 percent of the participants felt their
drug addiction was either chronic or frequent in nature. Of those who cited alcohol as a
problem, nearly half (47%) also felt their addiction was chronic or frequent. With regard
to other needs, 47 percent also cited employment as a major need that presented frequent
or chronic problems with their functioning. Other needs cited included: housing concerns,
educational deficits, and mental and physical health concerns.
While it is recognized that all of the drug court follow the typical model of
providing clients with community based treatment services, less is known about the
specific type of services utilized. Table 6 lists the various referrals made by the drug
court on behalf of the client. The referrals included substance abuse treatment, services
such as employment, education, family, medical, housing, and mental health. While it is
difficult to ascertain whether the service referrals are appropriately targeting the
offender’s specific needs, there is evidence that the courts are making efforts to provide
other services besides drug abuse treatment.

24
Table 5. Treatment Needs for the Drug Court Group Drug Court N % Characteristics (n=856) Treatment Needs: Drug Abuse Chronic, Severe disruption 332 63.4 Frequent disruption 106 20.2 Situational/Occasional problems 67 12.8 No disruption of functioning 19 3.6 Alcohol Abuse Chronic, Severe disruption 137 27.5 Frequent disruption 97 19.5 Situational/Occasional problems 161 32.3 No disruption of functioning 103 20.7 Employment Chronic, Severe disruption 111 22.0 Frequent disruption 125 24.8 Situational/Occasional problems 127 25.2 No disruption of functioning 141 28.0 Family Chronic, Severe disruption 57 11.4 Frequent disruption 123 24.6 Situational/Occasional problems 171 34.3 No disruption of functioning 148 29.7 Housing Chronic, Severe disruption 61 12.9 Frequent disruption 58 12.2 Situational/Occasional problems 106 22.4 No disruption of functioning 249 52.5 Education Chronic, Severe disruption 46 9.2 Frequent disruption 69 13.8 Situational/Occasional problems 89 17.8 No disruption of functioning 297 59.3

25
Table 5. Treatment Needs for the Drug Court Group, continued Drug Court N % Characteristics (n=856) Mental Health Chronic, Severe disruption 23 4.8 Frequent disruption 37 7.8 Situational/Occasional problems 69 14.5 No disruption of functioning 347 72.9 Physical Health Chronic, Severe disruption 28 5.8 Frequent disruption 37 7.7 Situational/Occasional problems 67 13.9 No disruption of functioning 350 72.6

26
Table 6. Service Referrals for the Drug Court Participants
Drug Court N %
Characteristics (n=856) Referred to Substance Abuse Treatment Yes 474 97.1 No 14 2.9 Referred to Employment Services Yes 206 44.1 No 261 55.9 Referred to Educational Services Yes 185 39.6 No 282 60.4 Referred to Housing Assistance Yes 94 22.4 No 326 77.6 Referred to Family Services Yes 168 35.7 No 303 64.3 Referred to Medical Services Yes 126 27.9 No 325 72.1 Referred to Mental Health Services Yes 55 14.0 No 337 86.0
27
Drug courts typically enjoy fairly high retention rates. Specifically, the retention
rate among drug courts across the nation averages 70 percent for drug court participants
(Drug Court Programs Office, 1999). As part of the current study, the drug courts were
asked to track clients through the various phases of treatment. As indicated by Table 7,
the courts typically use either long term residential (31%), intensive outpatient (31%) or
outpatient (36%) treatment services. Similar to the national average, of those who began
treatment, 69 percent completed the first phase. Of those who did not complete, 25
percent were referred to another level of care, 32 percent were deemed non-compliant,
and 29 percent absconded. The remaining percentage were either revoked or failed for
other reasons. With regard to the second phase of treatment, the majority was placed in
either intensive outpatient (33%) or outpatient (48%) services. Similarly, 70 percent
completed this second phase of treatment. Finally, Table 7 indicates that 64 percent of
the drug court clients completed their third phase of treatment. In conclusion, it appears
that the drug courts are referring clients to a variety of services and are able to retain a
majority of their clients.
Program Violations
In-program behavior as measured by technical violation rates, can aid in our
understanding of the participants’ progress through the drug court program. It is
recognized (see Goldkamp, 1994) that drug courts may suffer from high technical
violation rates, given the visibility of the participants. As indicated in Table 8, this is also
the case for the drug courts included in this study. It was found that 64 percent of the
drug court participants received at least one violation while engaged in the drug court.
Table 8 also lists the sanctions utilized by the court. The most frequently used were: jail,
bench warrants, and increased court observation.

28
Table 7. Treatment Activity for the Drug Court Participants
Drug Court N %
Characteristics (n=856) First Treatment Setting Long Term Residential 154 31.1 Short Term Residential 9 1.8 Intensive Outpatient 151 30.5 Outpatient 177 35.8 Aftercare 4 .8 Outcome of 1st Placement Completed phase 311 69.3 Did not complete phase 138 30.7 Reason for Not Completing Placement Referred to another level of care 34 24.5 Non-compliance 44 31.7
Absconded 40 28.8 Revoked 5 3.6 Other 16 11.5
Second Treatment Setting Long Term Residential 19 5.3 Short Term Residential 18 5.0 Intensive Outpatient 119 33.2 Outpatient 170 47.5 Aftercare 32 8.9 Outcome of 2nd Placement Completed phase 227 70.3 Did not complete phase 96 29.7
Reason for Not Completing Placement Referred to another level of care 15 15.8 Non-compliance 40 42.1
Absconded 30 31.6 Revoked 1 1.1 Other 9 9.5

29
Table 7. Treatment Activity for the Drug Court Participants, continued
Drug Court N %
Characteristics (n=856) Third Treatment Setting Long Term Residential 5 2.0 Short Term Residential 16 6.5 Intensive Outpatient 36 14.7 Outpatient 144 58.8 Aftercare 44 18.0 Outcome of 3rd Placement Completed phase 131 63.6 Did not complete phase 75 36.4
Reason for Not Completing Placement Referred to another level of care 17 24.3 Non-compliance 19 27.1
Absconded 27 38.6 Revoked 0 00.0 Other 7 10.0

30
Table 8. Drug Court Participants’ Supervision Activity ______________________________________________________________________________
Treatment N % Characteristics (n= 598)3 Court Reported Violation: Yes 384 64.2 Type of Violations Reported: New Arrest 50 4.4 Failure to Appear 22 1.9 Positive Urine Screen 611 54.4 Absconded 97 8.6 Non-compliant with Treatment 165 14.6 Other 179 15.9 Total 1124 100.0 Sanctions Rendered for Violations: Bench Warrant 224 21.5 Work Detail 8 0.8 Jail 251 24.0 Fines 2 0.2 Community Service 108 10.3 House Arrest 92 8.8 Intensive Supervision 14 1.3 Electronic Monitoring 17 1.6 Increased Drug Testing 14 1.3 Change in Treatment Intensity 45 4.3 Increased Court Observation 156 14.9 Other 113 10.8 Total 1044 100.0
3 Data on technical violations was not collected for this first Hamilton County sample (1997 evaluation), thus the participants are excluded from this analysis.

31
Termination Status
Many drug courts around the country use an approach whereby they dismiss
charges or expunge the record of successful drug court participants. Table 9 lists the
termination status of drug court participants. Nearly 56 percent of the participants had
their original charges dismissed and 12 percent had their record expunged. As far as
graduation rates, 145 (36%) individuals in the study graduated, 125 (31%) were
terminated unsuccessfully, 8 (2%) had their term expire, 116 (28%) absconded, and 14
(3%) were terminated for other reasons.
Outcome
The main purpose of an outcome evaluation is to determine the impact of the
intervention, in this case the drug court, on behavior. The commonly used measure of
behavior is recidivism. As shown in Table 10, there is a statistically significant
difference between the arrest rates of the drug court participants and the control group
members. In fact, nearly half (46%) of the comparison group was rearrested during the
follow-up period compared to 34 percent of the drug court group. These results are also
illustrated in Figure 3. The new arrest could have been incurred while the participant was
engaged in drug court services or during the follow-up period. With regard to arrest
charge, Figure 4 illustrates that the comparison group members (56%) were significantly
more likely to be arrested for a drug related charge than drug court participants (41%).
Although not significant, comparison group members (42%) were slightly more likely to
be arrested multiple times.
We also looked at the relationship between termination from drug court and
rearrest. Table 11 shows that there was a significant difference between those offenders
who completed drug court successfully and those who did not with regard to rearrest. Of

32
Table 9. Supervision and Outcome for the Drug Court Participants Drug Court N % Characteristics (n=856) Were Original Charges Dismissed Yes 178 55.8 No 141 44.2 Was Defendant’s Record Expunged Yes 39 12.2 No 281 87.8 Termination Status Graduated from Drug Court 145 35.5 Terminated Unsuccessful 125 30.6 Expiration of Term 8 2.0 Absconded 116 28.4
Other 14 3.4

33
Table 10. Drug Court and Comparison Group Rearrest Information
Drug Court Comparison
N % N % Characteristics (N = 856) (N = 415) Rearrested for a New Offense: Yes 279 34.0 187 45.9 No 541 66.0 220 54.1 χ2 = 16.41; p=.000
Rearrest Charge (of those rearrested): Drug Related 95 40.8 81 55.5 Theft 50 21.5 26 17.8 Disorderly conduct 18 7.7 6 4.1 DUI 8 3.4 2 1.4 Violence 12 5.2 8 5.5 System Violation 35 15.0 14 9.6 Other 15 6.4 9 6.2 χ2 = 7.805; p=.005 Arrested Multiple Times: Yes 97 34.8 79 42.2 No 182 65.2 108 57.8

34
Figure 3
Rearrest Rate by Group
Drug Court Comparison0
20
40
60
80
100
Percent 34 45.9
Figure 4
Arrest Charge: Drug offenses vs all others
Drug Court Comparison0
20
40
60
80
100
Percent 40.8 55.5

35
Table 11. Percent Rearrested by Termination Status
N % Unsuccessful 124 39.9 Successful 45 28.8 X2 = 5.5; p ≤ .05 ________________________________________________________________________

36
those offenders who successfully completed drug court, 29 percent were rearrested,
compared to 40 percent of those who were terminated unsuccessfully.
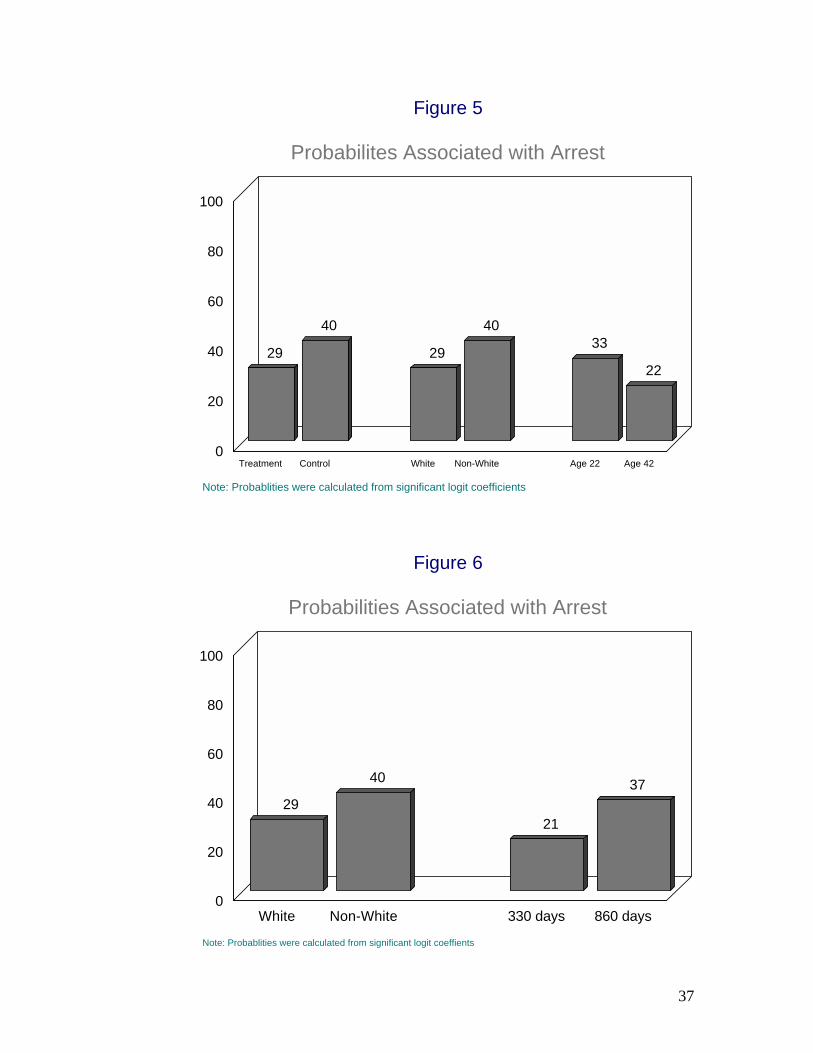
Predictors
In an effort to identify the factors associated with recidivism, a logistic regression
analysis was conducted. The characteristics in the model were group, race, time at risk,
age, prior record, educational status, and employment (see Appendix). Time at risk was
included as a control for the differing lengths of time each client was followed. The
results indicated that five variables predicted the likelihood of arrest: group, race, time at
risk, employment status, and education level. Figures 5-7 list the probabilities of failure
associated with each significant predictor.
The key finding here is that those individuals who received drug court treatment
services were less likely to be rearrested. Furthermore, the characteristics of the
individual were also significant in predicting who would be rearrested. The finding that
education and employment status are related to the probability of failure can be directly
addressed by the drug court staff. In addition, factors such as race and age should be
considered when developing alternative program options to specifically meet the needs of
these groups. Targeting treatment services to the appropriate populations to meet their
needs will increase both program effectiveness and retention rates.
We also examined the factors related to successful completion of a drug court
program. Three factors were significant; education level, employment status, and prior
record. Similar to above, those offenders who had graduated from high school, were
employed, and did not have a prior record were more likely to successfully complete drug
court. These results are shown in Figure 8.
37
Figure 5
Probabilites Associated with Arrest
Note: Probablities were calculated from significant logit coefficients
29
40
29
4033
22
Treatment Control White Non-White Age 22 Age 420
20
40
60
80
100
Figure 6
Probabilities Associated with Arrest
Note: Probablities were calculated from significant logit coeffients
29
40
21
37
White Non-White 330 days 860 days0
20
40
60
80
100

38
Figure 7
Probabilities Associated with Arrest
Note: Probablities were calculated from significant logit coefficients
2128
36
2128
Full Time Part Time Unemployed H.S. or greater Less H.S.0
20
40
60
80
100
Figure 8 Impact of Significant Factors Predicting Successful Completion
Note: Probabilities were calculated from significant logit coefficients
17
31
26
3135
31
42
Less H.S. H.S. or greater Unemployed Part-Time Full-Time Prior Record No Prior Record0
10
20
30
40
50

39
Summary & Conclusions
The following research questions can be summarized from this report: What are the characteristics of the offenders served by the drug court? What if any differences exist between the drug court and comparison groups with regard to demographics, current offense, and disposition?
• The majority in both groups was African American (58%), male, approximately 31 years of age, and not married.
• The only significant differences between the two groups are with regard to
education level and employment status. Specifically, significantly more individuals in the treatment group graduated from high school and were employed full time.
• The comparison group members are similar to the drug court clients in that the
vast majority in both groups, (87%), were charged with a drug related offense. Similarly, the majority of the clients processed by these drug courts were convicted or adjudicated at the time of disposition.
• What drug court judges decided to do with drug court clients versus comparison
group clients, differs significantly. As we would expect, drug court participants are more likely to be sentenced to drug treatment, drug testing or monitoring, and intensive supervision. However, comparison group members are more likely to be sentenced to pay court costs, fines, and fees, have their license suspended, participate in work detail and community service
Do drug court participants differ from comparable groups of offenders on various indicators of criminality?
• With regard to prior record, 88 percent of the drug court participants had a prior adult or juvenile record in contrast to 80 percent of the comparison group members. With regard to felony arrests, drug court clients were slightly less likely than comparison group members to have a record, however, better than 50 percent had at least one prior arrest in their history. With regard to misdemeanor arrests, the two groups are similar with better than 80 percent in both group having a prior misdemeanor record. Finally, the vast majority in both groups did not have a prior delinquent record.
• The courts indicated that to their knowledge the majority in both groups did not
have prior sentences to community supervision. However, when comparing those who were under supervision at one time, we find that the comparison group members were significantly more likely to be terminated unsuccessfully.
40
How do drug court participants look on various indicators of drug use?
• With regard to the participant’s primary drug of choice, the majority (38%) prefers crack/cocaine, followed by marijuana (35%) and alcohol (22%). The drugs reported as a second choice, however, differ among participants. Specifically, the drugs listed in order of importance are alcohol (44%), marijuana (31%), and crack/cocaine (25%).
• Data on age of first use indicates that 45 percent of the participants began using
alcohol and/or drugs between the ages of 14 and 17.
• With regard to their current use, only 20 percent use alcohol daily, however, the group is evenly split between those who use once a week (40%) or less than once a week (40%). Drug using behavior appears to occur with more frequency as we see 35 percent report daily drug use followed by 36 percent who use on a weekly basis and 29 percent less than once a week.
• Thirty-eight percent do have families with a chemical dependency problem and
41 percent have previously engaged in treatment. Finally 8 percent have received a dual diagnosis of mental illness and substance addiction.
What are the treatment needs and retention rates among drug court participants?
• Over 80 percent of the participants felt their drug addiction was either chronic or frequent in nature. Of those who cited alcohol as a problem, nearly half (47%) also felt their addiction was chronic or frequent. With regard to other needs, 47 percent also cited housing as a major need that presented frequent or chronic problems with their functioning. Other needs cited included: housing concerns, educational deficits, and mental and physical health concerns.
• There is evidence that the courts are making efforts to provide other services
besides drug abuse treatment. The referrals included substance abuse treatment, services such as employment, education, family, medical, housing, and mental health.
• The courts typically use long term residential (31%), intensive outpatient (31%)
or outpatient (36%) treatment services. Similar to the national average, of those who began treatment, 69 percent completed the first phase. Similarly, 70 percent completed this second phase of treatment and 64 percent of the drug court clients completed their third phase of treatment.
What are the court reported violation rates for the drug court participants? And, in the event of a violation, how does the court handle such matters?
• It was found that 64 percent of the drug court participants received at least one violation.

41
• The majority of violations (54%) were for positive urine test. • There were a variety of sanctions utilized by the court. The most frequently used
being: jail, bench warrants, and increased court observation.
Does participation in the drug court affect the likelihood that an individual will recidivate?
• According to the courts, 145 (36%) individuals in the study graduated, 125 (31%) were terminated unsuccessfully, 8 (2%) had their term expire, 116 (28%) absconded, and 14 (3%) were terminated for other reasons.
• With regard to arrest, there is a statistically significant difference between the
drug court group and the comparison group. In fact, nearly half (46%) of the comparison group were rearrested during the follow-up period in comparison to 34 percent of the drug court group.
• With regard to arrest charge, comparison group members (56%) were
significantly more likely to be arrested for a drug related charge than drug court participants (41%). Although not significant, comparison group members (42%) were slightly more likely to be arrested multiple times.
What factors predict the likelihood of success/failure?
• In an effort to identify the factors associated with recidivism, a logistic regression analysis was conducted. The results indicated that five variables predicted the likelihood of arrest: group, race, time at risk, employment status, and education level.
• Three factors were significantly related to successful completion of a drug court
program; education level, employment status, and prior record.
As depicted, the research on drug courts is fairly limited. More importantly,
comparatively fewer studies have isolated the factors associated with recidivism. The
current study builds upon the previous research conducted in Ohio to develop an
understanding of whether adult drug courts are an effective community based initiative.
Drug courts are serving a population of adults that have been using drugs and
alcohol for a fairly long period of time and tend to prefer addictive drugs such as
crack/cocaine. These findings illustrate that drug courts must not only recognize they are
dealing with a chronic and relapsing condition among many of these people, but also

42
determine the appropriate individualized plan of treatment to target their areas of need.
In addition, drug court offenders often present a variety of needs in addition to their
addiction. Findings from this study indicate that drug courts are considering other areas
of need in addition to the obvious substance abuse addiction and are making appropriate
referrals.
The outcome results of this evaluation are promising. The data with regard to
outcome showed a moderate and significant relationship between drug court treatment
and rearrest. The findings indicate that offenders who participated in drug court services
(e.g., judicial supervision, community-based treatment, etc.) were less likely to be
arrested in comparison to a similar group of offenders who did not receive these services.
Moreover, the findings also highlight important factors that drug court can use to design
treatment strategies; namely marital and employment status. Among other treatment
strategies, courts should target the education level of its clients and develop their
employment skills. The drug courts should also recognize that age and race are important
factors to consider when developing their programs. These characteristics may be related
to outcome in that they affect one’s response or amenability to treatment.
Given the popularity of the drug court model across the country as well as in
Ohio, their ability to reduce drug abuse and recidivism remains a key issue. The drug
court model embraces the perspective that get tough polices towards drug abuse have
fallen short. By endorsing the view that treatment can be an effective tool in reducing
recidivism, drug courts hold more promise than traditional policies that rely on
incarceration and stricter sentences.

43
REFERENCES Cooper, C. S. (1997). “1997 Drug Court Survey Report.” American University: Washington, D.C. Goldkamp, J. S. (1994). Miami’s treatment drug court for felony defendants: some implications of assessment findings. Prison Journal, 74, 110-144. _____ (2001). National Association of Drug Court Professionals. Alexandria, VA.

44
RECOMMENDATIONS
In order to further increase the effectiveness of the drug courts across Ohio, the
following recommendations can be offered:
In addition to varying degrees of substance abuse problems, offenders will have
varying degrees of other risk factors (e.g., antisocial values, antisocial peer associations,
and so forth). Few courts used a standardized risk/need assessment instruments to guide
treatment placement or duration. One example of an appropriate assessment tool is the
Level of Service Inventory- Revised. This instrument includes risk and need factors that
are known correlates of criminal behavior. Furthermore, it provides a summary score
that predicts the offender’s likelihood of recidivism. The findings should be used in
selection and treatment planning by both the court and the providers. The program staff
should be using the results of the assessment to match offenders to group based on their
individual needs. Moreover, these results should be used when considering the intensity
and duration of the program.
While the outcome results are promising, drug courts increase the probability of
success if they can facilitate participation in treatment programs that are appropriate.
Reducing criminality and addictions begins with the recognition that drug addiction is a
chronic relapsing condition that will not be effectively reduced by applying short term,
education-based treatment services. The success of a treatment program rests with the
selection of an empirically validated and theoretically driven treatment model
(Prendergast, et al., 1995). Although drug abuse is considered the primary need of many
drug court participants, the majority have multiple needs that may include, among other
factors, attitudes supportive of criminal behavior, interpersonal relationships with
criminal associates or a lack of educational and vocational skills. Treatment services

45
must first take into consideration the offenders’ specific needs and then apply the most
effective model to remedy the needs.
Research is now indicating that the most effective programs aimed at changing
offender behavior are those based on cognitive, social learning, multisystemic family, and
radical behavioral (e.g. operant conditioning) strategies (see, e.g., Andrews, Zinger,
Hoge, Bonta, Gendreau, Cullen 1990; Antonowicz & Ross 1994; Gendreau 1996;
Gendreau & Andrews 1990; Henggeler & Borduin 1990; Izzo & Ross 1990; Lipsey
1992; Van Voorhis, Braswell, & Morrow 1997). These strategies attempt to change
behavior by addressing thinking errors or values and attitudes supportive of crime,
providing a means for the offender to observe and imitate prosocial behavior, including
the family and community in the rehabilitation of the offender, and decreasing
inappropriate behavior through reinforcement for appropriate behavior. The court could
further increase their effectiveness by including these treatment models into drug court
programming.
Finally, in order to conduct a more comprehensive evaluation of the drug courts
across Ohio, more detailed information on the comparison cases should be collected.
This would include risk assessment results, supervision activities, substance use and
severity, drug testing results, and services received. These data would allow for a more
detailed comparison between the groups and would allow the researcher to further
explore the factors related to success or failure.

46
APPENDIX

47
Logistical Regression Predicting Arrest: Treatment versus Control
Variable B S.E. Wald df Significance Gender .214 .209 1.040 1 .308 Race .506 .156 10.545 1 .001** Education -.389 .192 4.094 1 .043* Employment .363 .122 8.906 1 .003* Group -.638 .202 9.961 1 .001** Prior Record -.086 .238 .131 1 .718 Time to arrest .002 .000 15.016 1 .000** *p < .01 **p < .001

48
Logistic Regression Model Predicting Successful Program Completion Variable B S.E. Sig
Sex .0033 .2564 .988 Race .2216 .2245 .323 Educational Attainment .7447 .2426 .002 Employment Status -.2285 .1405 .054 Marital Status .2641 .3007 .379 Any Prior Record -.5156 .2662 .052 Constant -.8551 .7531 -2ll = 506.031; χ2(6) = 21.28, p < .01; Pseudo-R2 = 0.07