preliminary groundwater modelling i of the oolloo...
TRANSCRIPT
I I I I I I
I I I I I I I I I
l•I ? . .-
3.:>01o•01 5. 325e •01
'·,.~ w.--1.--• 1.-• 1 . 12h""2 -7, .1 1"2/dl
W''"''l'N#"G''' - ,,.,, ...,. ll_.... (Mi)I ....
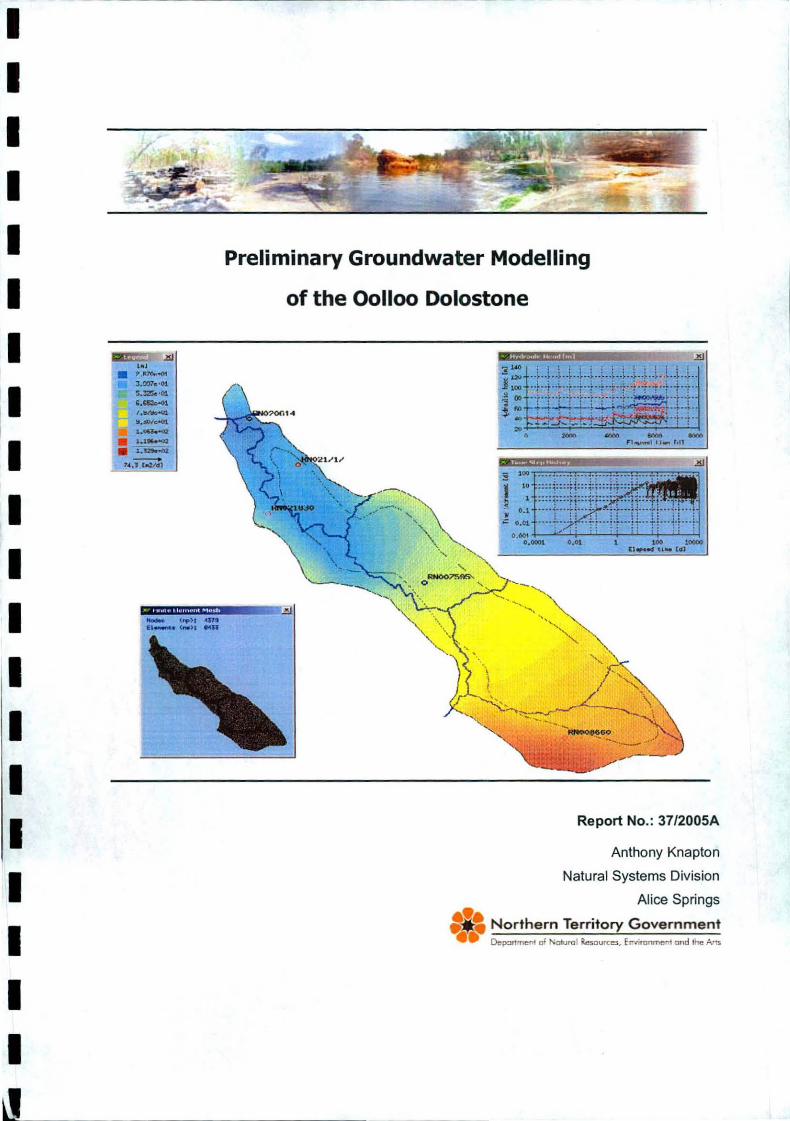
Preliminary Groundwater Modelling
of the Oolloo Dolostone
.l .. l.l.l.l .. ~ .. l .. l.l .. l .. ~ ... l.l.l .. ~ .. ·+·+-~·+·+·+·+·+ ·+· +·+·1·1·+·+· -·r·-: · ·: · ·~ · -r --r ··~ - -r ··r· ·~'"··r··r · .;4..;-.;. ....;.._.;~nt-~--t-.;. ~...;~-~ .· .. ~++· - - .......... '1....-.1 11- r.11
Report No.: 37/2005A
Anthony Knapton
Natural Systems Division
Alice Springs
._1• N o rthern Territory G overnment 0.,p::utonenl cf l'v.Jtura !lc•curcc:s, E r-nrun,.,,,..I and lhc A•i.
Groundwater Modelling of the Oolloo Dolostone
Department of Natural Resources, Environment & The Arts Natural Systems
Technical Report No. 37/2005A
Preliminary Groundwater Modelling
of the Oolloo Dolostone
A report prepared by NRETA
Author:
Anthony Knapton
Department of Natural Resources, Environment & The Arts, Alice Springs
Date printed 22/33/2005 Date Last Modified: 22 November 2005
Status: FTNAL Page i
Department of Natural Resources, Enviromnent and The Arts
I I I I I I I I I
I I I I I
I

I I I I I I I I I I I I I I I I I I I I II
Groundwater Modelling of the Oolloo Dolostone
Department of Natural Resources, Environment & The Arts
Natural Resources
Technical Report No. 37/2005A
Copyright and Disclaimer
© 2004 Northern Territory Government
To the extent permitted by law, all rights are reserved and no part of this publication covered by copyright may be reproduced or copied in any form or by any means except with the written permission of Northern Territory Government.
PO Box 496, Palmerston, NT, 0831, Australia
Important Disclaimer
The Northern Territory Government advises that the information contained in this publication comprises general statements based on scientific research. The reader is advised and needs to be aware that such information may be incomplete or unable to be used in any specific situation. No reliance or actions must therefore be made on that information without seeking prior expert professional , scientific and technical advice. To the extent permitted by law, the Northern Territory Government (including its employees and consultants) excludes all liability to any person for any consequences, including but not limited to all losses, damages, costs, expenses and any other compensation, arising directly or indirectly from using this publication (in part or in whole) and any information or material contained in it.
Cover Image: The bedded unit of the Oolloo Dolostone, Dorisvale Rd; Outcrop of the basal Cretaceous sandstone in the Daly River 1 Okm downstream from Black Bull Yard; Daly River at Bee Boon Crossing; Crystal Falls on the Douglas River; Outlet channel of the spring that originates from a pool on top of a gravel bar along the Daly River and Screen shot of a simulation from the FEFLOW modelling package.
© 2005 Department of Natural Resources, Environment and the Arts
Date printed 22/33/2005 Date Last Modified: 22 November 2005
Status: FINAL Page ii
Department of Natural Resources, Environment and TI1e Arts
Groundwater Modelling of the Oolloo Dolostone
Executive Summary
Background
The Oolloo Dolostone is a major aquifer in the Daly River catchment. Impacts on the groundwater
resource from extraction or changes to the natural recharge regime could have considerable
impact on the dry season flows in the Daly River. Groundwater modelling is used here to
determine the validity of the conceptual model developed for the Oolloo Dolostone aquifer system.
This report presents the development of a numerical groundwater model to provide a method to
assess the impacts of development (both due to clearing and extraction) on the groundwater
system and the flows in the Daly River.
Conceptual Model of the Oolloo Oolostone
The conceptual model was developed by the Water Resources section of NRETA from the
available groundwater and surface water data and observations. It can be summarized as:
• The aquifer may be represented as a single semi-unconfined to semi-confined layer as the
groundwater levels coincide with the base of the Cretaceous sediments.
• The dolostone aquifer was expected to have greatest permeability in the dolostone aquifer is
within the weathered zone, confined to the upper 100 metres from the surface. For the
purposes of this exercise the aquifer was considered to have a constant thickness below the
groundwater table (ie a single layer of variable transmissivity was used instead of varying
hydraulic conductivity and aquifer thickness).
• Transmissivity estimate of 10,000 m2/d, based on the limited pumping test data.
• Storage coefficient estimate of 0.04. This is considered a reasonable estimate as previous
experience (Jolly, pers comm.) indicates that this value should be between 0.01 and 0.07.
• The main influence of the Cretaceous sediments is to reduce the recharge to the Oolloo
Dolostone aquifer. This is based on the subdued response of hydrographs for bores located in
areas with the Cretaceous cover (eg RN7595). The recharge was therefore divided into two
areas, outcropping dolostone and areas with Cretaceous cover.
• Initial estimates of the steady state annual recharge over the two areas were 150 mm/yr
(0.41 mm/d) for the outcropping dolostone and 40 mm/yr (0.11 mm/d) for the Cretaceous
cover. Recharge was estimated using the potential recharge model developed for the
Katherine rainfall record (Jolly et al, 2000). The recharge model estimates the soil moisture
deficit and evapotranspiration to derive the potential recharge due to deep drainage.
Date printed 22/3312005 Date Last Modified: 22 November 2005
Status: FINAL Page iii
Department of Natural Resources, Environment and The A rts
I I I I I I I I I I I I I I I I I I I I I

I I I I I I I I I
1 1 I I I I I I I I I I
Groundwater Modelling of the Oolloo Dolostone
• The dominant discharge from the aquifer is through the streambed and via springs. Discharge
mainly occurs in the lower reaches of the Daly River from approximately 27 km downstream of
Dorisvale Crossing through to the Douglas River (Tickell, 2002b).
• Over the long term the dry season discharge to the river via spring flows range from 5 to
15 cumecs.
• Evapotranspiration from the riparian zone is estimated at approximately 3 mm/day, which
equates to a total usage of 0.2 cumecs. Assuming th is is all derived from groundwater this is a
relatively small component of the water balance (Tickell, 2002b ).
Model Calibration Results
Based on the conceptual model developed, cal ibration of both the steady state model and the
transient model to the observation data was possible. Relatively good fits were obtained for both
the head and discharge data available.
Conclusions
Initial modeling of the Oolloo Dolostone indicates that the conceptual model is valid . However,
further refinement is required before the groundwater model can be implemented to assess the
effects of groundwater pumping on discharge to the river. The major areas where refinement is
required relate to the improved representation of recharge, spring inflows and wet season river
heights in the model.
Date printed 22/3312005 Date Last Modified: 22 November 2005
Status: FINAL Page iv
Department o f Natural Resources, Environment and The Arts
'~-------
I Groundwater Modelling of the Oolloo Dolostone I
Contents
Executive Summary ...... .... ................................... ... .... ........................ ......... ... .......... ............ ..... ...... .. iii l Introduction ............... .............. ....................... ...... ... ... .. ...................... ....... ................................... 1
1.1 Background ... ..... ... .......... ........ .... .. ............ ..... ........ ................... .. ... ... ................................... 1 1.2 Objectives ......... ....... ... .. ...... ........ ... ........... .. ........... ....... ... .. ........... ..... ......... ... ......... .... ....... ... I 1.3 Model Steps ....... ..... .......... ............ .. ............ .......... ... ........ .............. ...................... ... ..... .. ....... I 1.4 Location ........ .. .. ........ ..... .... ...... ....... ....... ..... .. ........ .. ....... .. ............... ................. ... ... .... ........... 2 1.5 Climate ................... ... ...... ..... ....... .. ........ ..... ..... .. .. ............. ................................ ..... ..... ... ....... 2 1.6 Geomorphology ......... .... ....... ............. ....... .. ....... ............... .......... .. ... ....... ... .. ......................... 4
1.6.l Topography ........... ... .. ....... ............... .................................... ... ... .................................. 4 2 Hydrogeological Setting and Conceptual Model .......... ............................. .... .......................... .... 6
2.1 Hydrogeology ........ .... ....... ..... ........................ ........ .. ................................ .......... ................... 6 2.1 . l Cretaceous Rocks .. .. ....... .......... .. ......... .. ........ .. .................................................. .. .. .... ... 6 2.1.2 Oolloo Dolostone ............................... .. .. .......... ......... .. .. ............................................... 6 2. 1.3 Jinduckin Formation ..... .......... ... ... .. ...... .... ..... ... .... .. ..................... ......................... ........ 8
2.2 Observation Data ....................... .................... .......... .. ......................... .................................. 8 2.2. l Rainfall and Potential Recbarge ............... .... ........ ................ .............. ........ ... .......... ... .. 8 2.2.2 Observation Bores ..... .. ......... ......... ............ .......... ... .. ................ ...... .. ........... .. .. .. .. .. .. ... 10 2.2.3 Groundwater Level Hydrographs ................... .... .. ...... ..... ............. ..... ...... .... .. ..... ..... .. . 11 2.2.4 Potentiometric Head Distribution ............... .. .... ...... ....... ...................... ....... .... .. .. .. ... ... 11 2.2.5 River Gauging Data ....... ...... .... .. ...... .. ..... ... ... .... ...... .. .... .. ... ............... ... .. ... .. .... ...... .. .... 13
2.3 Conceptual Model .......... ... ......... .......... ........... ... ... ........ .................................................. ... 16 3 Model Design .... ................................... ......................... .. .. .. ... .. ..... ....... ....... ...... ...... ... ...... ....... ... 18
3.1 Model Specifications .......... ......... ......................... .. ... .. ................................ ... ..... ........ ....... 18 3.2 Layers ........ .......... .............. .... .. ........... ................ .. .. ..... ..... .............. ...... ................. .... ......... 18 3.3 Boundary Conditions ......... ....... .. ... .............................. .... .............. .. ..... ... ..................... ...... 18
3.3. l Recharge (Specified Flux) ................. ......... .... .... .. .. ........ ............... ...... .... ...... .... ......... 18 3.3.2 Transfer (Cauchy) Boundary ...... ............... .. ... .... ....... ............................... ....... ... .. ... .. . 18
3.4 Hydraulic Parameters ............... ....... ... ... ........ ............ .... ............ ............... .. .... ................. ... 19 3.4.1 Transmissivity Distribution .. .... .. ......... ........ .... .. .. .. .. ... .. ... .............. ... .... ....... ..... ... ...... . 20 3.4.2 Recharge Distribution .... ...... .. ................................ ................................ ........ ... .. .. .... . 21
3.5 Numerical Model Implementation ...... ...... ............ ... .......... ................... .. ... .. ...... ................ 23 3.5. l Numerical Model Code .... .... ......... ........ ........ ... ..... .... ... ...... .. .... .... .... ... .. ........ ........... .. 23 3.5.2 Spatial Discretisation .. ..... .... ... ...................... ....... ...... .......... ........ .. .. .. ... .... ........... .. ..... 23 3.5.3 Temporal Discretisation ... ..... ........ .... .... ......... ... .......... .... .... ............... ... .... ...... .. .... ..... 24
3.6 Steady State Model Development ................ ..... .......... ..... ..... .. ... ... ........ .............. ........ .. .. ... 25 3. 7 Steady State Model Calibration ....... .... ..... ..... ................. ... ..... .. .. .. ...................................... 25 3.8 Transient Model Development ................ .. .......... .. .......................................... ...... ........ ..... 27 3.9 Transient Model Calibration ...... ... ............. ........ ............... ......... ............. .. ... .... ............... ... 27 3.10 Calibrated Model Results ........ .. ...... ... ... ........ ................... .................. ....... ..... ........ .. ...... .. .. 28
3.10. l Groundwater Level Hydrograpbs ...... ............. ......... ... .. ... .. ......................................... 28 3.10.2 Groundwater Discharge Hydrograpbs ............ ........ ... .............. ............ .................... ... 30
3.11 Sensitivity Analysis ................... ........... .............. ...... .......... .............................................. .. 31 4 Model Validation ... ............... ... ....... ......................................... .............. ... ............................ ... ... 33
4.1 Stable Isotope vs Particle Tracking as an Estimate of Residence Time ............................. 33 4.1.1 14C Ageing to Estimate Groundwater Residence Time .... .... ........ .. .. ............ .... ... ....... 33 4.1.2 Storage vs Discharge to Estimate Groundwater Residence Time .... .. .... ............ ........ 33 4. 1 .3 Particle Tracking to Estimate Groundwater Residence Time .......... ... ... .. .................. 34
5 Conclusions .................... ........ ... ................. ......... .. ......... ....... ...... ...................... ........................ . 36 6 Recommendations ..... .. .................... ............. .. .. ... .... .. .. ..... .............. .. .. ... ..... .............. .. ... ... .......... 37
Date printed 22/33/2005 Date Last Modified: 22 November 2005
Status: FINAL Page v
Department of Natural Resources, Environment and The Arts
I I I I I I I I I I I I I I I I I I I

I I I I I I I I I I I I I I I I I I I I II
Groundwater Modelling of the Oolloo Dolostone
7 References ............................................. ........................................... .................. ..... ........... ........ 3 8 Appendix A Oolloo Monitoring Bores .............................................................. ..... ... ... .... ....... ....... 39 Appendix B Oolloo Dolostone Pumping Test Data .................. ...................... .. ............................ .41
Date printed 22/33/2005 Date Last Modified: 22 November 2005
Status: FINAL Page vi
Department of Natural Resources, Environment and The Arts

I Groundwater Modelling of the Oolloo Dolostone I
List of Figures
Figure 1 Figure 2
Figure 3 Figure 4 Figure 5 Figure 6
Figure 7 Figure 8 Figure 9 Figure 10 Figure 11
Figure 12 Figure 13
Figure 14
Figure 15 Figure 16
Figure 17
Figure 18
Figure 19
Figure 20
Figure 21
Figure 22
Study Area Location ................................... .............................. ..... .................. .. ............... 3 Variation in the monthly average rainfall across the Daly Basin from Katherine in the southeast to Adelaide River in the northwest. ......... ..................... ..... .............................. .4 3sec (90 metre) Shuttle Radar Topographic Model of the study area showing drainage.5 Simplified geology of the Daly Basin .. ............................................................................ 7 Geological cross-section of the Oolloo Dolostone ... ......... ................ ............................... 8 Relationship between rainfall at Katherine and potential recharge modified from Jolly, (2000) ............................................................................................................................... 9 Location of observation bores and bores used to calibrate model... ............................... I 0 Typical hydrographs across the study area ..................................................................... 11 Groundwater level contours for the late dry season 2002 (Tick ell, 2002b) ..... ..... ..... .... 12 Current Gauging Station Locations ................. .. ..... ........................................................ 13 Average monthly late dry season flows (cumecs) in the Daly River, estimating the groundwater discharge to the river from the aquifer. .................................... ................. 14 Transfer boundary conceptualization for a losing stream (Diersch, 2004) .................... 19 Distribution of transmissivity across the study area based on the mapped occurrence of the massive (Zone 1) and bedded (Zone 2) Oolloo Dolostone (Tickell, 2002) ....... ....... 21 Recharge zones, Zone 1 and Zone 3 represent the higher recharge rates associated with the outcropping Oolloo Dolostone, Zone 2 is the lower recharge rate in areas where Cretaceous cover exists .................. ................................................. ... .. ... ....................... 22 Model mesh geometry showing refinement along drainage features ........ ..................... 24 Comparison of modelled heads vs observed heads for RN7597. The response from the calibrated model are in blue (RunlO) ...... ....................................................................... 28 Comparison of modelled heads vs observed heads for RN8660. The response from the calibrated model are in blue (RunlO) ..... ....................................... ..... ............................ 29 Comparison of modelled heads vs observed heads for RN2 l 7 l 7. The response from the calibrated model are in blue (Run 10) .............................. ... ...................................... 29 Comparison of modelled discharge vs observed discharge along the Daly River from Dorisvale to Mt Nancar .. ...... .............. ...... ..... ... ... ... ............................ .... ...... ... ....... ........ 30 Comparison of modelled discharge vs observed discharge along the Daly River just upstream of Stray Creek .................... ...... .. .... ........ ......................................................... 31 Sensitivity analysis for variations in the transmissivity for the massive and bedded Oolloo dolostone units and storage coefficient. ............................................................ .32 Particle tracking results from the calibrated transient model. "X" markers at the head of the particle tracking indicate a time of one year, whilst " T " indicates a travel time of 50 years ......... ....................................... .. ....... ............................................... ................... 35
Date printed 22/33/2005 Status: FINAL Page vii
Department of Natural Resources, Environment and The Arts Date Last Modified: 22 November 2005
I I I I I I I I I I I I I I I I I I I

I I I I I I I I I I I I I I I I I I I I
Groundwater Modelling of the Oolloo Dolostonc
List of Tables
Table I
Table 2 Table 3
Gauged flows along the Daly River for Oct/Nov 1970, 1982, 2000 (Jolly, 2002) and September 200 I (Tickell, 2002a) ................................................................................... 14 Hydraulic Parameters ......................................... ....... ................................... ................. . 20 Selected steady state calibration run input parameters, outputs in the form of discharge to streams and RMS errors for hydraulic head data. Runl3 is considered to be the calibrated model. ............... .... .................... ..... .. .... .. .... ... .. ...... ........ ............ ........ ... ........ .. 26
Date printed 22133/2005 Status: FINAL Page viii
Department of Natural Resources, Environment and The Arts Date Last Modified: 22 November 2005

Groundwater Modelling of the Oolloo Dolostone
1 Introduction
1. 1 Background
The Oolloo Dolostone is a major aquifer in the Daly Basin. It represents the source of the majority
of the baseflow in the Daly River. The impending development of nearby horticultural districts
reliant on water from the Oolloo Dolostone aquifer, now represents a threat to the environmental
flow regime of the river. Changes to the aquifer recharge regime may also be associated with land
clearing and development.
1. 2 Objectives
The objective of this preliminary modelling is to validate the conceptual model developed for the
recharge, groundwater flow and discharge mechanisms for the Oolloo Dolostone aquifer
developed by NRETA. The modelling will then form the basis for recommendations for the future
refinement of the model and to conduct detailed modelling studies, such as extraction scenario
modelling.
A groundwater model has been developed based on a conceptual hydrogeological model
proposed by Tickell (2002b ). This work has provided affirmation of a viable hydrogeological model
and a tool to be applied under various development scenarios to assess aquifer and springflow
impacts.
This report presents the model's basis for development and identifies areas in which data
deficiencies exist.
1. 3 Model Steps
The groundwater model was developed using the following steps:
1) Conceptual model development;
2) Numerical model implementation;
3) Steady state model development;
4) Calibration of the steady state model;
5) Extension of the calibrated steady state model to the transient domain;
6) Calibration of the model to the transient hydrologic data from 1987 to 2005 including
rainfall/recharge data, water levels hydrographs and streamflow data;
7) Sensitivity analysis of the calibrated model to determine what are the key assumptions which
have a significant impact on the model;
Date printed 22/3312005 Date Last Modified: 22 November 2005
Status: FrNAL Page I
Department of Natural Resources, Environment and The Arts
I I I I I I I I I I I I I I I I I I I I I

I I I I I I I I I I I I I I I I I I I I
Groundwater Modelling of the Oolloo Dolostone
8) Model validation.
1.4 Location
The study area for the groundwater modelling comprises the full extent of the Oolloo Dolostone
some 230 km to the south-southeast of Darwin (Figure 1 ). The Oolloo Dolostone covers an area
of 4,600 km2 and is bounded approximately by the latitudes 13.75° S and 14.90° S and the
longitudes 132.22° E and 131.12° E. The Katherine River and Daly River are the major drainage
flowing through the region, tributaries include the Flora River, Fergusson River, Stray Creek and
Douglas River.
Katherine is the closest major centre and is approximately 40 km to the east of the study site.
1.5 Climate
The study area falls within the wet-dry tropics, that is, there are two distinct seasons. The wet
season is from December to April and the dry season spans the remainder of the year. Annual
rainfall increases to the northwest from an average of 980 mm at Katherine to 1, 156 mm at Oolloo
Crossing and 1,328 mm at Adelaide River. The variation in monthly rainfall at each of these sites
is presented in Figure 2.
Date printed 22133/2005 Date Last Modified: 22 November 2005
Status: FINAL Page 2
Department of Natural Resources, Environment and The Arts
I _ _____ _

Figure 1 Study Area Location
- - - - - - - - - - - - - - -
o Towns
-- Major Roads
-- Major Drainage
Oolloo Dolostone
Q Jinduckin Formation
0 Tindall limestone
Q Daly River Catchment
LOCATION MAP N°' to Scalt
TENNANT CREEK
0 10 20 40 60 80 100 Kilometres
- - - - - -

I I I I I I I I I I I I I I I I I I I I
~ 250 E
~ 200 ~ .: 150 co
Ck: :?:- 100 .= c ~ 50
0
Groundwater Modell ing of the Oolloo Dolostone
Average Monthly Rainfall
Jan Feb Mar Apr May Jun Jul Aug Sep Oct Nov Dec
Month
a Adelaide River · 66yrs • Oolloo Crossilg • 44yrs o Katherine· 119yrs
Figure 2 Variation in the monthly average rainfall across the Daly Basin from Katherine in the
southeast to Adelaide River in the northwest.
1.6 Geomorphology
The major drainage within the study area shows a rectangular drainage pattern, where both the main
stream and its tributaries exhibit right-angle bends, indicating that geological structures (ie faulting and
jointing) have strongly influenced the development of the drainage, especially where the drainage
incises the Oolloo Dolostone. The Daly River is orientated sub-parallel to the strike of the Daly Basin.
The ephemeral drainage shows a more dendritic pattern.
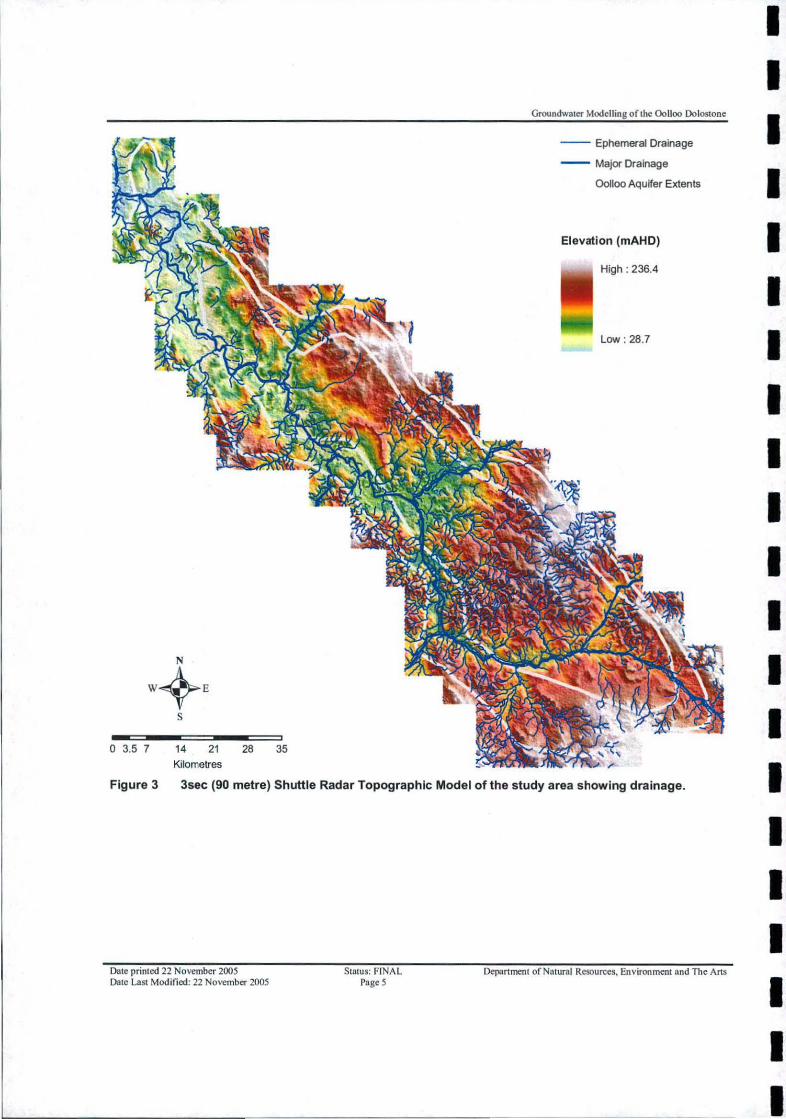
1.6.1 Topography
The study area varies in topography from approximately 29 to 236 metres above Australian Height
Datum (Figure 3). The low lying areas are along the main drainage, and the highest topography is
located along the flanks. Topography is relatively rugged on the dissected flanks of the plateaux,
where steep gullies have been incised into the soft Cretaceous rocks. In contrast the areas where the
Oolloo Dolostone is exposed have low undulating topography with generally sparse outcop.
Date printed 22 November 2005 Date Last Modi fied: 22 November 2005
Status: FINAL Page4
Department of Natural Resources, Environment and The Arts
'-~------
Groundwater Modelling of the Oolloo Dolostonc
-- Ephemeral Drainage
- Major Drainage
Oolloo Aquifer Extents
Elevation (mAHD)
High: 236.4
Low : 28.7
s
0 3.5 7 14 21 28 35 Kilometres
Figure 3 3sec (90 metre) Shuttle Radar Topographic Model of the study area showing drainage.
Date printed 22 November 2005 Date Last Modified: 22 November 2005
Status: FINAL Pages
Department of Natural Resources. Environment and The Arts
I I I I I I I I I I I I I I I I I I I I I

I
I I I I I I I I I I I I I I I I I I I I 11
Groundwater Modelling of the Oolloo Dolostone
2 Hydrogeological Setting and Conceptual Model
2.1 Hydrogeology
The study area is within the Daly River catchment (Figure 1 ). The major liydrogeological feature of
the region is the Cambrian-Ordovician Daly Basin comprising the Tindal Limestone, Jinduckin
Formation and the Oolloo Dolostone. Early Cretaceous rocks overlie much of the Oolloo Dolostone.
The surface geology of the Daly Basin is depicted in Figure 4. A geological cross-section depicting
the stratigraphic relations of the Cretaceous sands and clays, Oolloo Dolostone and Jinduckin
Formation is also presented in Figure 5. The unit of interest in this study is the, Oolloo Dolostone,
which, is the upper unit of the Daly River Group and the major aquifer with respect to base flows in the
Daly River. The hydrogeology of the study area is described in detail by Tickell, (2002b) and is
summarized below.
2.1.1 Cretaceous Rocks
The beds are sub-horizontal and consist predominantly of clay, claystone and sandy clay with lesser
sandstone, sand and clayey sand. Outcrop is generally sparse due to the soft nature of the rock but in
places silicification has altered them to porcellanite and quartzite which outcrop reasonably well. The
thickest accumulations are preserved along the axis of the Daly Basin running from the north side of
the King River, through Florina Station and then following the north east side of the Daly River as far
as Stray Creek (Tickell , 2002b). The main influence of the Cretaceous sediments is to reduce the
recharge to the Oolloo Dolostone aquifer. This assertion is based on the lithology of the unit, which is
predominantly clay/clayey sand and the subdued response of groundwater hydrographs for the bores
located in areas with the Cretaceous cover (eg RN7595 - Figure 8).
2.1.2 Oolloo Dolostone
The Oolloo Dolostone is the uppermost formation in the Cambrian-Ordovician Daly Basin, a largely
undeformed sequence of shallow water carbonate rocks. Outcrop is generally poor due to the
extensive cover of Cretaceous rocks. The main exposures occur at the northwestern and
southeastern ends of the basin (Tickell , 2002b). The transmissivity of the Oolloo Dolostone has been
estimated at 10,000 m2/d from pumping test data (Tickell, 2002b), which is also presented in
Appendix B. Jolly, (2000), used a storage coefficient of 2% in storage calculations of the Oolloo
Dolostone aquifer. It has been suggested that the storage coefficient could be between 1 % and 7%
and is probably closer to 4% (Jolly pers comm., 2005).
Date printed 22 November 2005 Date Last Modified: 22 November 2005
Status: FINAL Page 6
Department of Natural Resources, Environment and The Arts

Groundwater Modelling of the Oolloo Dolostone
Two broad units, an upper massive one and a lower well-bedded one are apparent in both gamma
logs and in outcrop. A contrast in the permeability of the two units is expected, due to the differences
in the lithology and from pumping test data.
The massive unit is a medium grained crystalline, pale pink, gray or cream coloured dolostone. It is a
hard, coarsely fractured rock, often showing abundant solution pits and cavities. Sedimentary
structures have mostly been destroyed by recrystallization (Tickell, 2002b).
N
·-<r' s
Northom Territory Govommont It_ ... _ ,......,_ "-1.-. ..... -~ ....... ,_ .......
Figure 4 Simplified geology of the Daly Basin
Date printed 22 November 2005 Date Last Modified: 22 November 2005
Status: FINAL Page 7
Oolloo Groundwater Model
Simplified Geology
- Drainage Cretaceous
Daly Basin D Oolloo Bedded CJ Oolloo Massiw CJ Tindall D Jinducki n
Department of Natural Resources, Environment and The Arts
I I I I I I I I I I I I I
I I I I I
I I I I I I I
'• I I I I I I I I I I I I ll
Groundwater Modelling of the Oolloo Dolostone
South west North east
g 200
M 150 M
100
50
0
·50
-100
-150
-200
0 2 4 6 8 10 Km
Horizontal scale
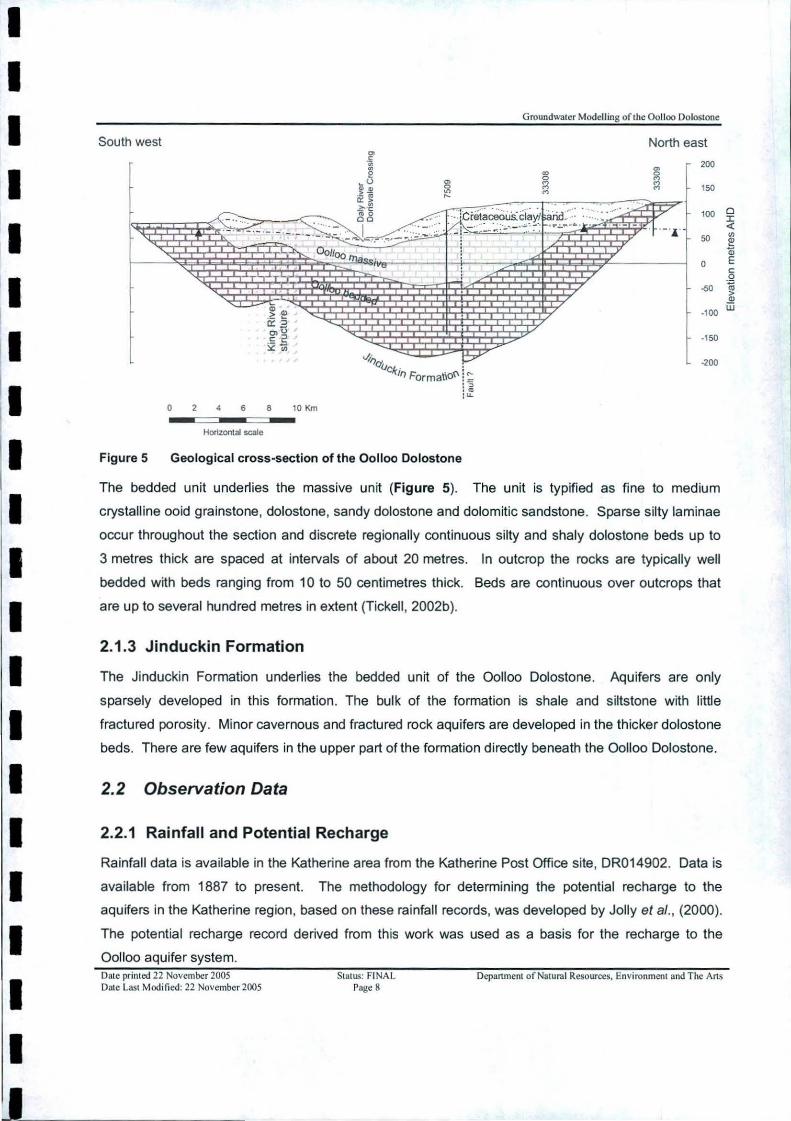
Figure 5 Geological cross-section of the Oolloo Dolostone
The bedded unit underlies the massive unit (Figure 5). The unit is typified as fine to medium
crystalline ooid grainstone, dolostone, sandy dolostone and dolomitic sandstone. Sparse silty laminae
occur throughout the section and discrete regionally continuous silty and shaly dolostone beds up to
3 metres thick are spaced at intervals of about 20 metres. In outcrop the rocks are typically well
bedded with beds ranging from 10 to 50 centimetres thick. Beds are continuous over outcrops that
are up to several hundred metres in extent (Tickell, 2002b).
2.1.3 Jinduckin Formation
The Jinduckin Formation underlies the bedded unit of the Oolloo Dolostone. Aquifers are only
sparsely developed in this formation. The bulk of the formation is shale and siltstone with little
fractured porosity. Minor cavernous and fractured rock aquifers are developed in the thicker dolostone
beds. There are few aquifers in the upper part of the formation directly beneath the Oolloo Dolostone.
2.2 Observation Data
2.2.1 Rainfall and Potential Recharge
Rainfall data is available in the Katherine area from the Katherine Post Office site , DR014902. Data is
available from 1887 to present. The methodology for determining the potential recharge to the
aquifers in the Katherine region, based on these rainfall records, was developed by Jolly et al., (2000).
The potential recharge record derived from this work was used as a basis for the recharge to the
Oolloo aquifer system. Date printed 22 November 2005 Date Last Modified: 22 Novembcr 2005
Srntus: FINAL Page 8
Department of Natural Resources, Environment and The Arts
0 I <{ I/)
~ E c .Q ro > Q)
w

Groundwater Modelling of the Oolloo Dolostooe
The potential recharge was calculated from the daily rainfall record, using estimates for the end of dry
season soil moisture deficit and daily losses (evapotranspiration etc). A soil moisture deficit of 150
mm and wet season evapotranspiration (ET) of 5mm/day were chosen. It was also assumed that
there was little surface runoff from the ground overlying the limestone aquifers (Jolly et al., 2000).
Daily potential recharge is calculated using the following expression:
where
If Else if Else if Else if
SMDd + PPTd- ET <= -150 then SMDd + PPTd - ET <= 0 then PPTd-ET > 0 then PPTd - ET <= 0 then
SMD = soi l mois ture deficit (mm) PPT = daily rainfall (mm) ET = daily evapotranspiration (mm) d = day since beginning of record
SMDd+,= -150 SMDd+1= SMDd+ PPTd- ET SMDd+1 = SMDd + PPTd- ET SMDd+,= 0
d+I where l = number of days since previous SMDd value R = daily recharge
The calculated potential recharge record was extended to 2004, and to reduce the computational
effort during the model simulations the monthly potential recharge was used, derived from summation
of the calculated daily data. The relationship between the monthly rainfall and monthly potential
recharge from 1962 to 2004 is presented in Figure 6.
Cl) Cl ... RI ~ u Cl)
~
800
600
!e 400 .E E ni-0:: >. ~ 200 -c 0 ::E
0
Rainfall
• Pote ntial Recharge
1970 1975
J I 1 I
1980 1985 1990 1995 2000 2005 Date
Figure 6 Relationship between rainfall at Katherine and potential recharge modified from Jolly, (2000).
Date printed 22 November 2005 Date Last Modified: 22 November 2005
Status: FINAL Page 9
Department of Natural Resources, Environment and The Arts
I I I I I I I I I I I I I I I I I I

I I I I I I I I
I I I I I I I I I I I
Groundwater Modelling of the Oolloo Dolostone
2.2.2 Observation Bores
24 bores within the Oolloo groundwater model extent have time series water level data. The list of
bores is provided in Appendix A Oolloo Monitoring Bores. RN007595, RN08660 and RN021717
were selected to provide a basis for the transient calibration.
0 5 10
RN0252 • RN025285
N025286e
~~021830
s
20 30 Kilometres
RN033033 • RN033034 •
RN007595 •
RN032751 • RN032750 •
RN026555 •
• Model Obs Bores
• Observation Bores
Major Drainage
~ Oolloo Extent
RN033132 RN033133
RN033131 •
RN033039 • RN006660 •
Figure 7 Location of observation bores and bores used to calibrate model
Date printed 22 November 2005 Date Last Modified: 22 ovembcr 2005
Status: FINAL Page 10
Department of Natural Resources. Environment and The Arts

Groundwater Modelling of !be Oolloo Dolostone
2.2.3 Groundwater Level Hydrographs
RN7595 is located in an area with considerable Cretaceous cover, the subdued response to the
seasonal recharge events is interpreted to be due to lower recharge rate through the Cretaceous
layer. The obvious deviation from the response observed in the other hydrographs is attributed to this
reduced I buffered recharge regime, as opposed to a differing diffusivity (the ratio of transmissivity to
storage coefficient and describes the ability of an aquifer to transmit water).
RN8660 is located in the southeastern portion of the study area and shows a very strong response to
recharge events. This is interpreted to be due to a relatively high diffusivity (T/S). If it is assumed that
the transmissivity is relatively constant for the aquifer material then a lower specific yield than the rest
of the system is indicated. This may also be reflected in the topographic relief in this area, perhaps
suggesting a more competent aquifer material (ie the bedded Oolloo unit).
RN21717 is located in the northwest of the study area in the massive Oolloo unit. This area has been
mapped as having minimal Cretaceous cover, and the response to recharge events reflects this. The
response indicates strong seasonal influences, although not as strong as the response observed in
the southeast of the study area.
130
120
110
100 Qj > Ill ..J 90 ... .so ~~ 80 ci E c:-'i5 70 c: J!I (/)
60
50
40
30
1970
- RN7595 .,._, RN8660
...._ RN21717
1975 1980 1985
Figure 8 Typical hydrographs across the study area
2.2.4 Potentiometric Head Distribution
1990 1995 2000 2005 Date
The groundwater levels for November 2002 were collated and contours of the head distribution are
presented by Tickell, (2002). The head distribution provides some indication of the distribution of Date printed 22 November 2005 Dale Last Modified: 22 November 2005
S1a1us: FINAL Page 11
Depanmenl of Natural Resources, Enviroamem and The Ans
I I I I
I I I I I I I I I I I I I I I

I I I I I I I I
I I I I I I I I I I LI_
Groundwater Modell ing of the Oolloo Dolostone
transmissivity across the study area. The area to the south of the Katherine River shows relatively
high groundwater gradient (1 in 400 or 0.0025), supporting the conceptualization that lower
transmisivities exist here. The area to the northwest of Stray Creek also shows a relatively high
gradient (1 in 400 to 1 in 800 or 0.0025 and 0.00125), although the majority of the discharge occurs in
this part of the system, making a similar correlation a bit more difficult. The central portion of the study
area between Stray Creek and the Katherine River exhibits a very low gradient (1 in 4000 or 0.00025),
suggesting a relatively high transmissivity.
0 2 4 8 12 16 20
Kilometres
• Observation Bores
Major Drainage
- Groundwater Contours
c:> Oolloo Extent
Figure 9 Groundwater level contours for the late dry season 2002 (Tickell, 2002b)
Date printed 22 November 2005 Date Last Modified: 22 ovcmber 2005
Status: FINAL Page 12
Dcpanment of Natural Resources, Environment and The Ans
Groundwater Modelling of the Oolloo Dolostone
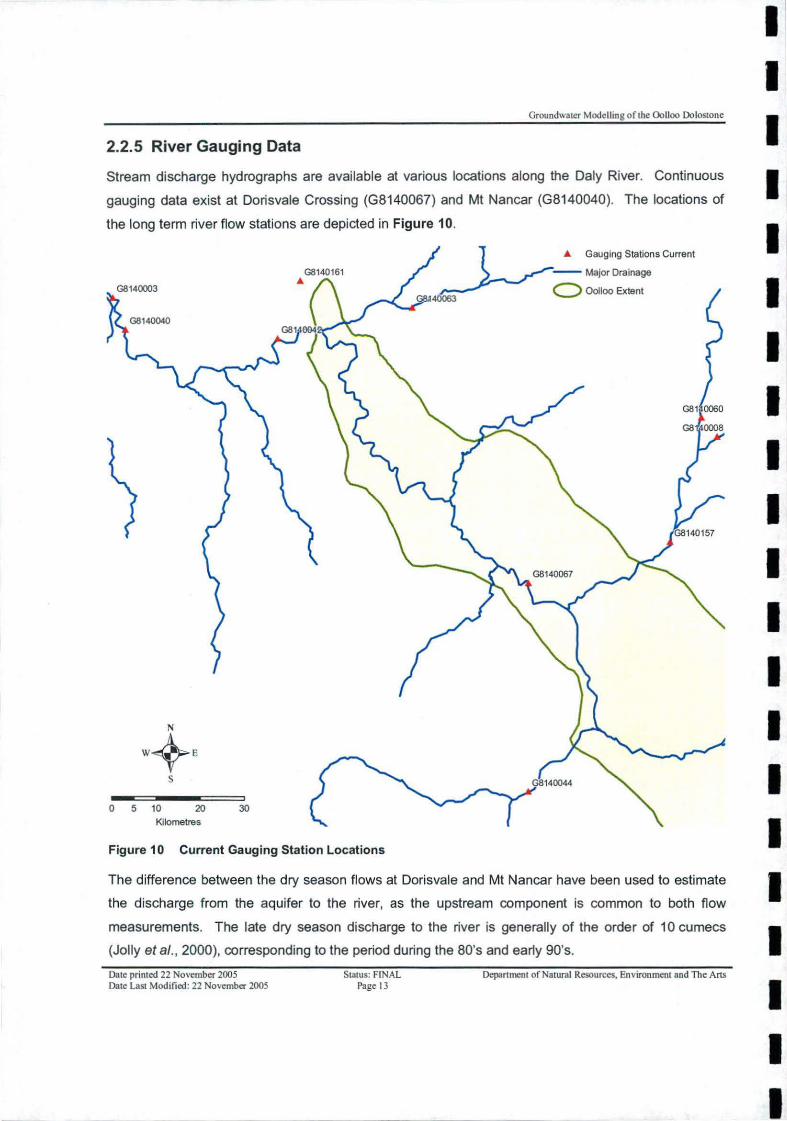
2.2.5 River Gauging Data
Stream discharge hydrographs are available at various locations along the Daly River. Continuous
gauging data exist at Dorisvale Crossing (G8140067) and Mt Nancar (G8140040). The locations of
the long term river flow stations are depicted in Figure 10.
0 5 10 20 30 Kilometres
Figure 10 Current Gauging Station Locations
G81 0060
G8 0008
The difference between the dry season flows at Dorisvale and Mt Nancar have been used to estimate
the discharge from the aquifer to the river, as the upstream component is common to both flow
measurements. The late dry season discharge to the river is generally of the order of 10 cumecs
(Jolly et al., 2000), corresponding to the period during the SO's and early 90's.
Date printed 22 November 2005 Date Last Modified: 22 November 2005
SIBtus: FINAL Page 13
Depanment of Natural Resources, Environment and The Ans
I I I I I I I I I I I I I I I I I I I I I
I I I I I I I I I I I I I I I I I I I I _I
-l/j u Cl)
E
100
:I 10 .£.
1970
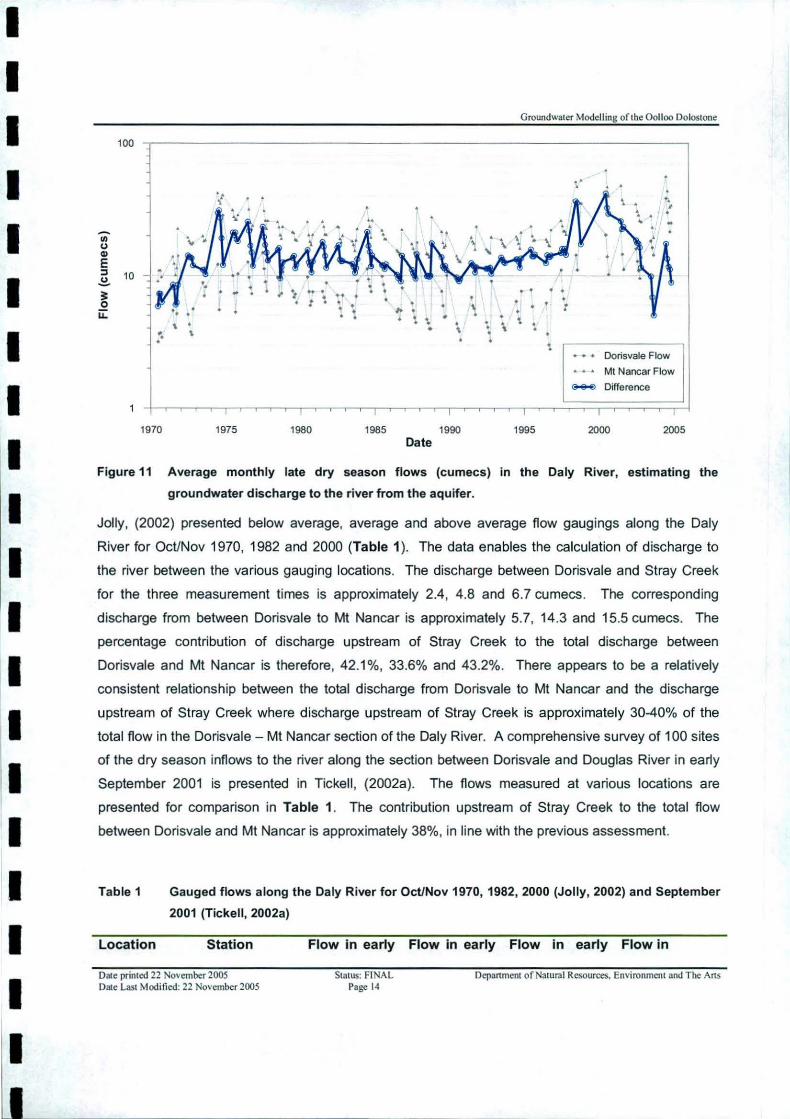
Figure 11
\ . \
1975
.. i •. ~ . : .
1980
•• • . . . • . .
1985
Groundwater Modelling of the Oolloo Dolostone
. . ,. . ' . . . . . . . . . . . . \ . . . \ ~ .
•
1990 1995 Date
. . • :
.. . .. ; .
Dorisvale Flow
Mt Nancar Flow
~ Difference
2000 2005
Average monthly late dry season flows (cumecs) in the Daly River, estimating the
groundwater discharge to the r iver from the aquifer.
Jolly, (2002) presented below average, average and above average flow gaugings along the Daly
River for Oct/Nov 1970, 1982 and 2000 (Table 1 ). The data enables the calculation of discharge to
the river between the various gauging locations. The discharge between Dorisvale and Stray Creek
for the three measurement times is approximately 2.4, 4.8 and 6.7 cumecs. The corresponding
discharge from between Dorisvale to Mt Nancar is approximately 5. 7, 14.3 and 15.5 cumecs. The
percentage contribution of discharge upstream of Stray Creek to the total discharge between
Dorisvale and Mt Nancar is therefore, 42.1 %, 33.6% and 43.2%. There appears to be a relatively
consistent relationship between the total discharge from Dorisvale to Mt Nancar and the discharge
upstream of Stray Creek where discharge upstream of Stray Creek is approximately 30-40% of the
tota l flow in the Dorisvale - Mt Nancar section of the Daly River. A comprehensive survey of 100 sites
of the dry season inflows to the river along the section between Dorisvale and Douglas River in early
September 2001 is presented in Tickell, (2002a). The flows measured at various locations are
presented for comparison in Table 1. The contribution upstream of Stray Creek to the total flow
between Dorisvale and Mt Nancar is approximately 38%, in line with the previous assessment.
Table 1 Gauged flows along the Daly River for Oct/Nov 1970, 1982, 2000 (Jolly, 2002) and September
2001 (Tickell, 2002a)
Location Station
Date printed 22 November 2005 Diiie Last Modified: 22 Novcmber 2005
Flow in early Flow in early Flow in early Flow in
Status: FINAL Page 14
Department of Natural Resources, Environment and The Ans

November 1970
(cumecs)
Sum of Flora GS8140301 + 4.2* River and GS8140044 Katherine River Flows
Daly River at GS8140067 2.8 Doris vale Crossing
Daly River 5.2 near Stray Creek
Daly River at GS8140038 5.9 Oolloo Crossing
Douglas River GS8140063 0.26
Daly River at GS8140042 7.7 Bee Boom Crossing
Daly River at GS8140041 8.2 Gourley
Daly River at GS8140040 8.5 Mount Nancar
*indicates estimated value
#values derived from Tickell, (2002a)
Date printed 22 November 2005 Dace Last Modified: 22 November 2005
Status: FINAL Page 15
Groundwater Modelling of the Oolloo Dolostone
November November September 1982 2000 2001
(cumecs) (cumecs) (cumecs) 5.74* 7.1*
5.1 8.5 12#
9.9 15.2 20#
13 20.8 26#
0.66 1.2
16.9
17.2
19.4 24* 33#
Department of Natural Resources, Environment and The Ans
I I I I I I I I I I I I I I I I I I I I I

I I I
1• I I I I I I I I I I
11 I I I I I
Groundwater Modelling oftbe Oolloo Dolostone
2.3 Conceptual Model
The conceptual model for the Oolloo Dolostone was developed by the Water Resources section of
NRETA from the available data and observations outlined in the previous sections. The conceptual
model for the Oolloo dolostone system can be summarized as:
• The aquifer may be represented as a single semi-unconfined to semi-confined layer as the
groundwater levels coincide with the base of the Cretaceous sediments.
• The dolostone aquifer was expected to have greatest permeability in the dolostone aquifer is
within the weathered zone, confined to the upper 100 metres from the surface. For the purposes
of this exercise the aquifer was considered to have a constant thickness below the groundwater
table (ie a single layer of variable transmissivity was used instead of varying hydraulic conductivity
and aquifer thickness).
• Aquifer transmissivity of 10,000 m2/d, based on the limited pumping test data, which is
summarized by Tickell, (2002b).
• Aquifer storage coefficient was 0.04. This is considered a reasonable estimate as previous
experience (Jolly, pers comm.) indicates that this value should be between 0.01 and 0.07.
• The main influence of the Cretaceous sediments is to reduce the recharge to the Oolloo Dolostone
aquifer. This is based on the subdued response of hydrographs for bores located in areas with the
Cretaceous cover (eg RN7595). The recharge was therefore divided into two areas, outcropping
dolostone and areas with Cretaceous cover.
• Initial estimates of the steady state annual recharge over the two areas were 150 mm/yr
(0.41 mm/d) for the outcropping dolostone and 40 mm/yr (0.11 mm/d) for the Cretaceous cover.
Recharge was estimated using the potential recharge model developed for the Katherine rainfall
record (Jolly et al, 2000). The recharge model estimates the soil moisture deficit and
evapotranspiration to derive the potential recharge due to deep drainage.
• The dominant discharge from the aquifer is through the streambed and via springs. Discharge
mainly occurs in the lower reaches of the Daly River from approximately 27 km downstream of
Dorisvale Crossing through to the Douglas River (Tickell, 2002b)
• Over the long term the late dry season discharge to the river via spring flows range from 5 to 15
cumecs, with an average discharge rate of 10 cumecs, with approximately 30% or 3 cumecs
discharging near Stray Creek.
Date printed 22 November 2005 Date Last Modified: 22 November 2005
Status: FINAL Page 16
Department of Natural Resources, Environment and The ArtS

Groundwater Modelling of the Oolloo Dolostone
• Evapotranspiration from the riparian zone is estimated at approximately 3 mm/day, which equates
to a total usage of 0.2 cumecs. Assuming this is all derived from groundwater this is a relatively
small component of the water balance (Tickell , 2002b).
Date printed 22 November 2005 Date Last Modified: 22 November 2005
Status: FINAL Page 17
Department of Natural Resources, Environment and The Ans
I I I I I I I I I I I I I I I I I 1. I!
'
I

I
I I I
II I I I I I I I
1:
Groundwater Modelling of the Oolloo Dolostooe
3 Model Design
3. 1 Model Specifications
The model encompasses the mapped occurrence of the Oolloo Dolostone aquifer and covers an area
of 4637 km2•
3.2 Layers
It was considered that the aquifer could be approximated as a single layer system, with spatially
variable transmissivity.
3.3 Boundary Conditions
The entire surface of the model is a variable flux boundary describing the recharge to the aquifer. The
conceptual model assumes that the dominant mechanism for discharge of groundwater from the
system is through spring flow to the rivers. Based on this assumption the discharge to the rivers has
been implemented using a transfer boundary. The boundaries for the rest of the model domain are
no-flow.
3.3.1 Recharge (Specified Flux)
Recharge was applied to the entire model based on the surface geology. In areas were the
Cretaceous unit occurred the recharge rate was reduced by a factor of 3-4. Also, the groundwater
table has been modelled to be in direct connection to the recharge from the surface (ie no time lag has
been introduced to simulate the time for the deep drainage to travel through the Cretaceous unit,
which, can be up to 100 metres thick).
3.3.2 Transfer (Cauchy) Boundary
The discharge along the river was simulated using transfer (Cauchy) boundary condition. The transfer
boundary is similar to the RIV package used by MODFLOW (Anderson and Woessner, 2002). The
transfer boundary condition (Figure 12) describes a reference hydraulic head which has an imperfect
hydraulic contact with the groundwater body caused by a colmation layer (related to the stream bed
conductance) . Additionally to the reference head for the Transfer boundary condition you have to
assign a transfer rate (leakage) to describe the hydraulic properties of the colmation layer (Diersch,
2004).
Date printed 22 November 2005 Dale Last Modified: 22 November 2005
Status: FINAL Page 18
Depanment of Natural Resources, Environment and The Ans

Groundwater Modelling of the Oolloo Dolostonc
jg] = modeling area K1 ,,. conductivity of model area
1i: =reference hydraulic head 1(11 • conductivity of colmation layer •
h = hydraulic head
Figure 12 Transfer boundary conceptualization for a losing stream (Diersch, 2004).
The flux through the colmation layer as shown above can be described using the Darcy equation:
The transfer rate (¢~: )can be estimated by:
The reference hydraulic ( h: ) was initially determined from the 3 second (90 metre) digital terrain
model. It was found during steady state calibration that the reference heads were too high by
approximately 10-15 metres. It is expected that the elevations derived were of the banks of the river.
It is suggested that further work is required to obtain more accurate river height data.
3.4 Hydraulic Parameters
The hydraulic parameters of interest in the steady state model were the transmissivity and recharge
rate and the reference hydraulic heads and the transfer out rate associated with the Transfer
Boundary condition. The methodology for the choice of values for the major hydraulic parameters are
discussed below, and the range of values employed are summarized in Table 2.
• Transmissivity was initially defined as being consistent across the model with an estimated initial
value of 10,000 m2/d. However, it was found that zoning of the transmissivity was necessary. The
head distribution presented in section 2.2.4 provides some indication of the distribution of Date printed 22 November 2005 Date Last Modified: 22 November 2005
S1a1Us: FINAL Page 19
Department of Natural Resources, Environment and The Ans
I I I I I I I I I I I I I I I I I I I I I
I I I I I I I I I I I I I I I I I I I I
Groundwater Modelling of the Oolloo Dolostone
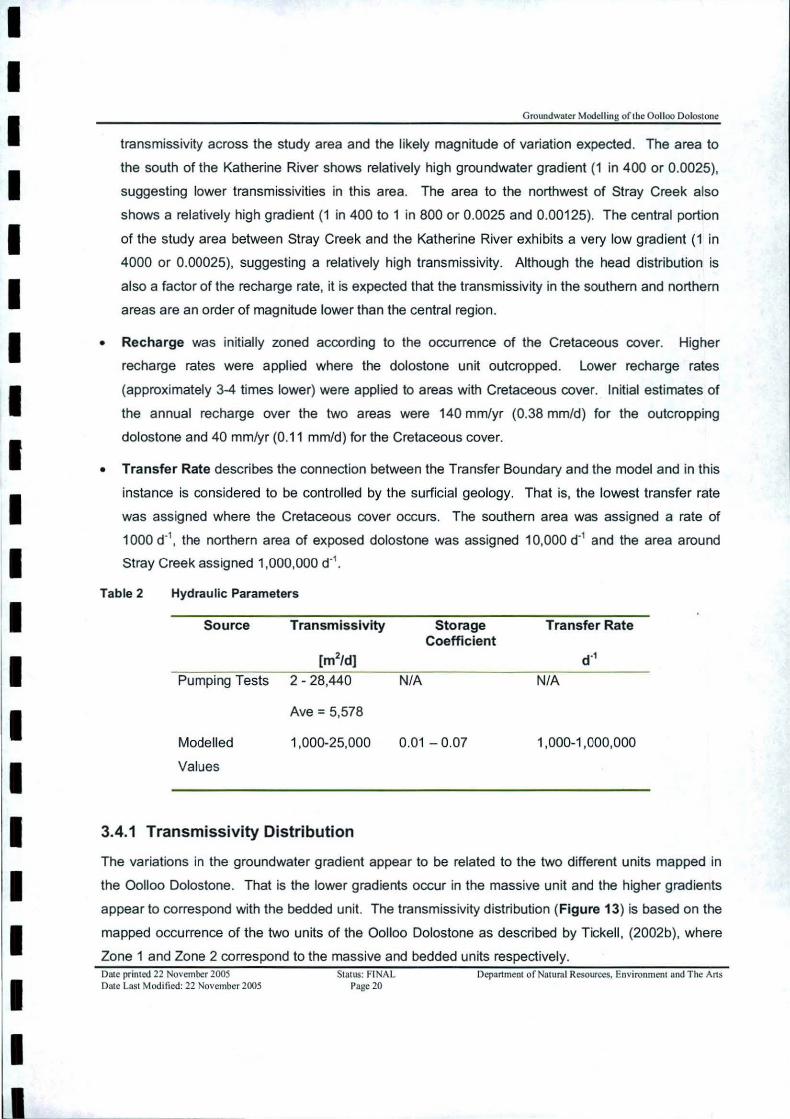
transmissivity across the study area and the likely magnitude of variation expected. The area to
the south of the Katherine River shows relatively high groundwater gradient (1 in 400 or 0.0025),
suggesting lower transmissivities in this area. The area to the northwest of Stray Creek also
shows a relatively high gradient (1 in 400 to 1 in 800 or 0.0025 and 0.00125). The central portion
of the study area between Stray Creek and the Katherine River exhibits a very low gradient (1 in
4000 or 0.00025), suggesting a relatively high transmissivity. Although the head distribution is
also a factor of the recharge rate, it is expected that the transmissivity in the southern and northern
areas are an order of magnitude lower than the central region.
• Recharge was initially zoned according to the occurrence of the Cretaceous cover. Higher
recharge rates were applied where the dolostone unit outcropped. Lower recharge rates
(approximately 3-4 times lower) were applied to areas with Cretaceous cover. Initial estimates of
the annual recharge over the two areas were 140 mm/yr (0.38 mm/d) for the outcropping
dolostone and 40 mm/yr (0.11 mm/d) for the Cretaceous cover.
• Transfer Rate describes the connection between the Transfer Boundary and the model and in this
instance is considered to be controlled by the surficial geology. That is, the lowest transfer rate
was assigned where the Cretaceous cover occurs. The southern area was assigned a rate of
1000 d-1, the northern area of exposed dolostone was assigned 10,000 d-1 and the area around
Stray Creek assigned 1,000,000 d-1.
Table 2 Hydraulic Parameters
Source
Pumping Tests
Modelled
Values
Transmissivity
[m2/d]
2 - 28,440
Ave= 5,578
1,000-25,000
3.4.1 Transmissivity Distribution
Storage Transfer Rate Coefficient
d"1
N/A N/A
0.01 - 0.07 1,000-1 ,000,000
The variations in the groundwater gradient appear to be related to the two different units mapped in
the Oolloo Dolostone. That is the lower gradients occur in the massive unit and the higher gradients
appear to correspond with the bedded unit. The transmissivity distribution (Figure 13) is based on the
mapped occurrence of the two units of the Oolloo Dolostone as described by Tickell, (2002b), where
Zone 1 and Zone 2 correspond to the massive and bedded units respectively. Date printed 22 November 2005 Date Last Modified: 22 November 2005
Status: FINAL Page 20
Department of Natural Resources, Environment and The Ans

s
0 5 10 20 Kilometres
30
Groundwater Modelling of the Oolloo Dolostone
Transmlssivity Zones
0 Zone 1 (Bedded Unit)
Zone 2 (Massive Unit)
<:::) Oolloo Extent
Figure 13 Distribution of transmlssivity across the study area based on the mapped occurrence of the
massive (Zone 1) and bedded (Zone 2) Oolloo Dolostone (Tickell, 2002).
3.4.2 Recharge Distribution
As discussed previously, the steady state recharge to the model was zoned depending on the
occurrence of the Cretaceous unit. In areas where the Cretaceous layer was absent (Zone1 and
Zone3) higher recharge rates were applied (-1 50 mm/yr), in areas where the Cretaceous cover exists
(Zone2) the recharge was reduced by approximately 3-4 times (-40 mm/yr). Date printed 22 November 2005 Date Last Modified: 22 November 2005
Status: FINAL Page 2 1
Department of Natural Resources, Environment and The Ans
I I I I I I I I I I I I I I I I I I I I I

I I I I I I I I I I
I I I I I I I I I
s
0 5 10 20
Kilometres 30
Groundwater Modell ing of the Oolloo Dolostone
Recharge Zones
Q zone1
Q zone2
Q zone3
<::::) Oolloo Extent
Figure 14 Recharge zones, Zone 1 and Zone 3 represent the higher recharge rates associated with the
outcropping Oolloo Dolostone, Zone 2 is the lower recharge rate in areas where Cretaceous
cover exists.
Date printed 22 November 2005 Date Last Modified: 22 November 2005
Status: FINAL Page 22
Ocpanmeat of Natural Resources, Environment and The Ans

Groundwater Modelling of the Oolloo Dolostone
3.5 Numerical Model Implementation
3.5.1 Numerical Model Code
Finite element modelling code was employed to simulate the groundwater system. Finite elements
provide greater flexibility in the mesh design than the rectilinear grids employed by finite difference
code, and allows for refinement of the mesh around points such as bores and linear features such as
rivers. The code is limited because the software requires a licence to run - unlike the core code for
Modflow which is "freeware" from the US Geological Survey.
The finite element package FEFLOw® vS.11 from WASY was used to simulate the saturated flow
processes (Diersch, 2004). FEFLOw® is a fully three dimensional finite-element package capable of
simulating unsaturated and saturated flow and contaminant transport. FEFLOw® also has built-in
mesh-design, problem editing and graphical post processing display modules that allow rapid model
development, execution and analysis. A 32-bit PC laptop under Windows XP was used as the
platform for the numerical simulations (transient simulations over 18 years typical took 5-10 minutes).
3.5.2 Spatial Discretisation
The superelement, mesh and model were developed with the FEFLOvv® package using the automatic
Triangle option (Shewchuk, 2002). This feature offers the ability to define the local variation of mesh
density by allowing for the refinement of the mesh around specified point and line features.
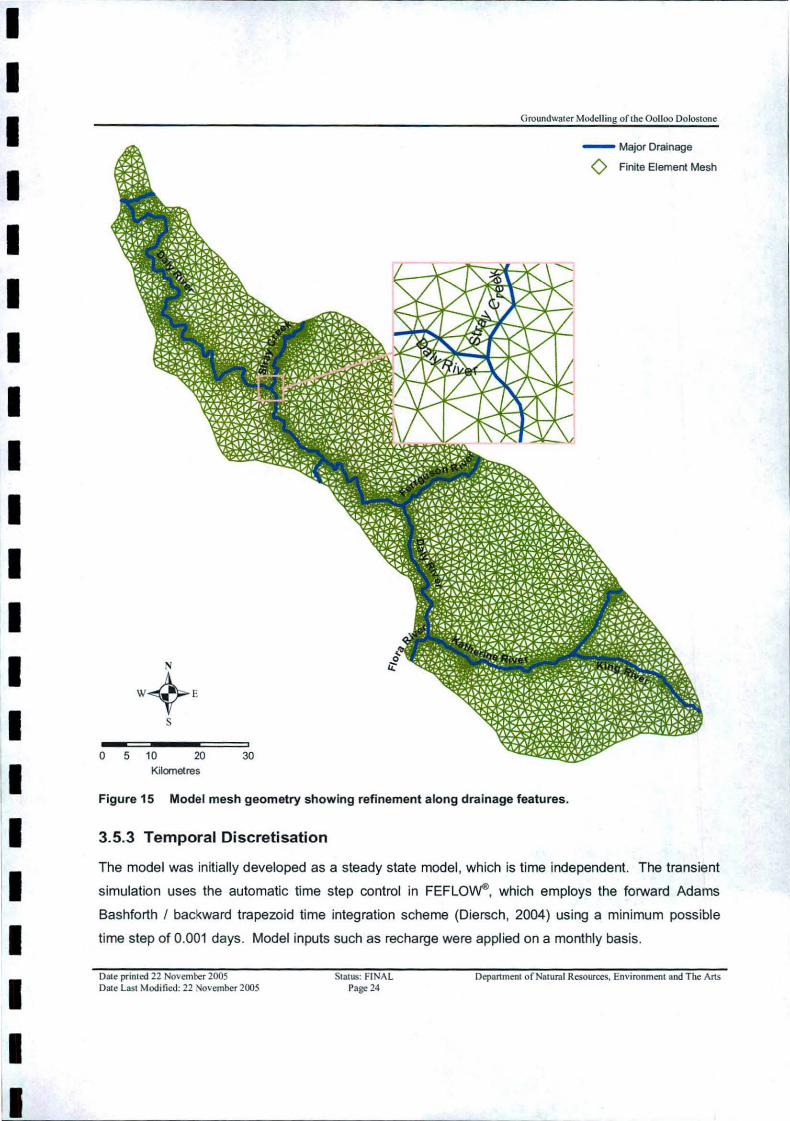
Refinement of the model mesh was defined along the major drainage features within the model extent.
The resultant mesh used in the modelling is presented in Figure 15 and comprises 8433 elements
and 4379 nodes.
Date printed 22 November 2005 Date Last Modified: 22 November 2005
Status: FINAL Page 23
Department of Natural Resources, Environment and The Arts
I I I I I I I I I I I I I I I I I I I I I
I I I I I I I I I I I I I I I I I I I I I
Groundwater Modelling of the Oolloo Dolostone
- Major Drainage
(> Finite Element Mesh
0 5 10 20 30 Kilometres
Figure 15 Model mesh geometry showing refinement along drainage features.
3.5.3 Temporal Discretisation
The model was initially developed as a steady state model, which is time independent. The transient
simulation uses the automatic time step control in FEFLOw®, which employs the forward Adams
Bashforth I backward trapezoid time integration scheme (Diersch, 2004) using a minimum possible
time step of 0.001 days. Model inputs such as recharge were applied on a monthly basis.
Date printed 22 November 2005 Date Last Modified: 22 November 2005
S1atus: FINAL Page 24
Department of Natural Resources, Environment and The Arts
Groundwater Modelling of the Oolloo Dolostone
3.6 Steady State Model Development
The initial conceptual model described in section 2.2 was implemented using a single semi
unconfined layer with inputs from regional/diffuse recharge (implemented as source/sink on the upper
slice of the model) and outputs, as discharge along the river features using the transfer boundary
condition applied at the nodes along the rivers.
The steady state model initially used a single value across the entire model domain for the
transmissivity. These were then adjusted to more closely represent the mapped occurrence of
massive and bedded units in the Oolloo Dolostone.
The 1987 late dry season water levels were considered as "average" and constituted a reasonable
approximation of the system in steady state.
3. 7 Steady State Model Calibration
The dependent variables considered in the steady state calibration process were the hydraulic heads
and the groundwater discharge along the section upstream of Stray Creek and the total discharge to
the Daly River from between Dorisvale and Douglas River. The steady state water levels are
considered to be during 1987. The discharge to the Daly River was estimated from the difference in
flow between Dorisvale and Nancar.
The measure of the "goodness" of fit of the heads is the root mean square error (RMS error) where:
n
I (hobo.(i)- h model(i))2
RMS error= /cl
n
and
RMS error is the root mean square error (metres)
h obs{.i) is the i1h observed water level (metres)
hmoc1et(iJ is the i1h modelled water level (metres)
n is the number of observations
The target for calibration was to adjust the transmissivity and recharge rates to minimise the overall
RMS error and provide a discharge from the transfer boundary, in line with the estimate of 10-
12 cumecs (section 2.2.5).
As stated previously the steady state model has been calibrated against the observed heads on site
for the late dry season of 1987. The resulting calibrated model parameters are indicated by Run13 Date printed 22 November 2005 Date Last Modified: 22 November 2005
Status: FINAL Page 25
Department of Natural Resources, Environment and The Arts
I I I I I I I I I I I I I I I I I I I I I

I I I I I I I I I I I I I I I I I I I I I
Groundwater Modelling of the Oolloo Dolostone
(Table 3) with hydraulic conductivities for Zone 1 = 25,000 m2/d and Zone 2 = 2500 m2/d and a RMS
error value of 1.0 metres.
Table 3 Selected steady state calibration run input parameters, outputs in the form of discharge to
streams and RMS errors for hydraulic head data. Run13 is considered to be the calibrated
model.
Run Trans. Trans. Recharge Recharge Bndry Discharge Discharge RMS Zone1 Zone2 Zone1 & 3 Zone2 Elev @Stray along Daly Error (m2/d) (m2/d) (mm/d) (mm/d) Creek River (m)
!cumecs} {cumecs}
Run1 25,000 5000 0.55 0.055 -10 1.87 9.17 4 .3 Run2 25,000 5000 0.55 0.055 -12 1.91 9.19 2.5 Run3 25,000 25,000 0.55 0.055 -12 1.82 9.83 2.2 Run4 25,000 25,000 0.55 0.055 -10 1.86 9.90 3.6 Runs 25,000 25,000 0.55 0.055 0 1.82 9.83 13.2 Run6 25,000 25,000 0.55 0.055 -5 1.82 9.83 8.3 Run7 25,000 25,000 0.55 0.055 -7 1.86 9.90 6.4
Run8 25,000 25,000 0.55 0.055 -15 1.82 9.83 2.7
Run9 25,000 25,000 0.55 0.055 -20 1.82 9.83 7.2 Run10 25,000 2500 0 .55 0.055 -12 1.94 8.95 3.6
Run11 25,000 2500 0.55 0.01 -12 2.33 9.84 3.9 Run12 25,000 2500 0.55 0.01 -15 2.35 9.87 1.3 Run13 25L000 2500 0.45 0.15 -15 3.04 10.25 1.0
Run14 25,000 2500 0.45 0.20 -1 5 2.87 10.52 1.6 Run15 25,000 2500 0.40 0.20 -15 2.69 9.92 1.4 Run16 25,000 2500 0.40 0.40 -15 4.49 13.67 5.0 Run17 25,000 2500 0.55 0.20 -15 3.23 11.74 2.2 Run18 25,000 25,000 0.55 0.20 -15 3.15 12.79 1.4 Run19 25,000 25,000 0.55 0.30 -15 4.11 14.77 2.2
Run20 25,000 25,000 0.55 0.30 -15 4.81 15.34 2.2 Run21 25,000 25,000 0.45 0.15 -15 2.86 11 .14 2.0
Run22 10,000 2500 0.45 0.15 -15 1.91 8.82 1.8 Run23 25,000 1000 0.45 0.15 -15 3.24 10.10 3.3 Run24 25,000 25,000 0.26 0.26 -15 3.56 9.93 2.6
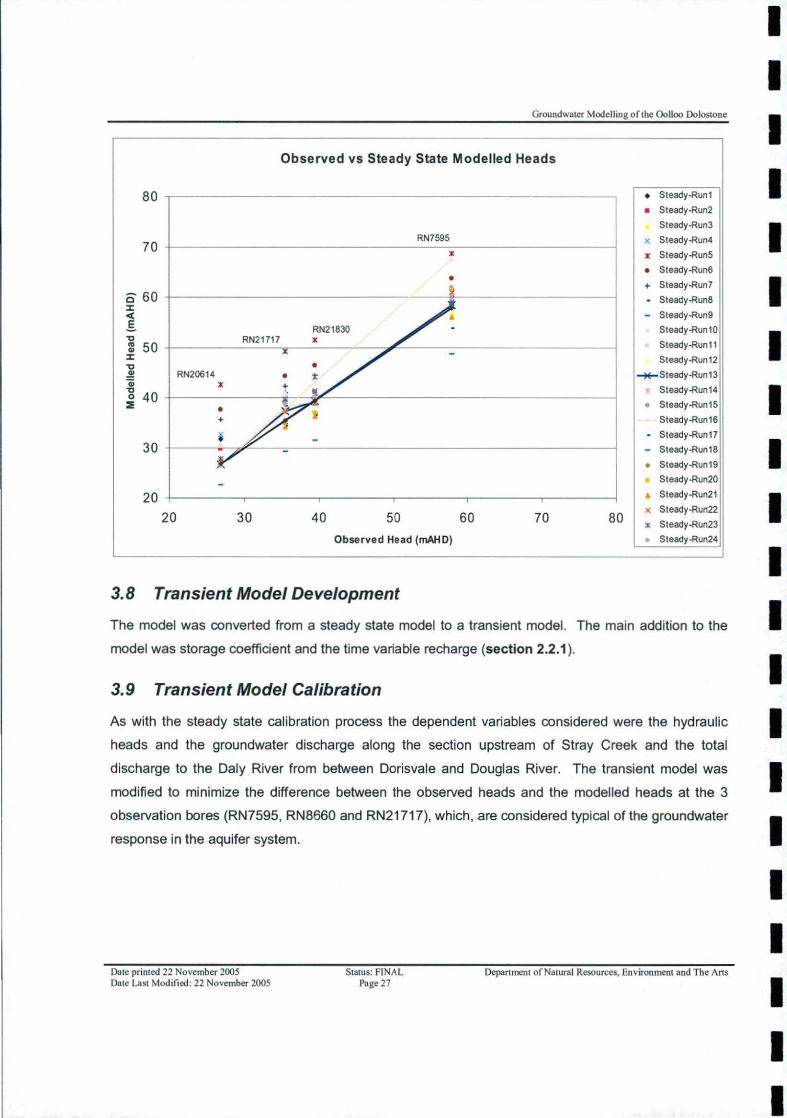
The results of the calibrated steady state model (highlighted - Run13) provides a reasonable fit to the
selected observation data, with the RMS error for the observed versus modelled heads of 1.0 metres.
This is an error of approximately 1-2% considering the head distribution across the site ranges from 20
-110 metres above Australian Height Datum.
One of the major controls on the calibration turned out to be the proportioning of the discharge along
the Daly River. It can be seen from Table 3 that in order to obtain approximately 30% of the discharge
from upstream of Stray Creek, the transmissivity requires zoning with Zone 1 having a transmissivity
of approximately 10 times that of Zone 2.
Date printed 22 November 2005 Date Last Modified: 22 November 2005
Status: FINAL Page 26
Department of Natural Resources, Environment and The Arts
Groundwater Modelling of the Oolloo Dolostone
Observed vs Steady State Modelled Heads
80 • Steady-Run1
• Steady-Run2
Steady-Run3
70 RN7595 x Steady-Run4
JC Steady-Runs
• Steady-Run6 • + Steady-Run7
0 60 ::c < .§.
. Steady-Runs
- Steady-Run9
Steady-Run10 "C
"' 50 Ci> Steady-Run11
::c "C
Steady-Run12
~ RN20614 '"*-Steady-Run13 Ci>
"C 40 0
:IE
Steady-Run 14
• Steady-Run15
Steady-Run16
. Steady-Run17
30 - Steady-Run18
• Steady-Run19
Steady-Run20
20 • Steady-Run21
20 30 80 x Steady-Run22
JC Steady-Run23 40 50 60 70
Observed Head (mAHD) Steady-Run24
3.8 Transient Model Development
The model was converted from a steady state model to a transient model. The main addition to the
model was storage coefficient and the time variable recharge (section 2.2.1 ).
3.9 Transient Model Calibration
As with the steady state calibration process the dependent variables considered were the hydraulic
heads and the groundwater discharge along the section upstream of Stray Creek and the total
discharge to the Daly River from between Dorisvale and Douglas River. The transient model was
modified to minimize the difference between the observed heads and the modelled heads at the 3
observation bores (RN7595, RN8660 and RN21717), which, are considered typical of the groundwater
response in the aquifer system.
Date printed 22 November 2005 Date Last Modified : 22 November 2005
Status: FINAL Page 27
Department of Natural Resources, Environment and The Ans
I I I I I I I I I I I I I I I I I I I I I

Groundwater Modelling of the Oolloo Dolostone
3.10 Calibrated Model Results
3.10.1 Groundwater Level Hydrographs
The resultant calibrated hydrographs for RN7595, RN8660 and RN21717 are presented in Figure 16,
Figure 17 and Figure 18.
The resultant average annual recharge rate for Zone1 , Zone2 and Zone3 respectively are 0.95 mm/d,
0.32 mm/d and 0.74 mm/d, which, is approximately twice the steady state calibrated recharge rates
(approximately 0.41 mm/d for Zone1 & Zone3 and 0.11 mm/d for Zone2). It should be noted,
however, that the second half of the simulation is during a period of relatively high rainfall and
therefore the average over the 20 years would be expected to be greater. If the period from 1987 to
1997 is used to estimate the recharge, the average annual rates for Zone1 , Zone2 and Zone3
respectively are 0.52 mm/d, 0.17 mm/d and 0.40 mm/d in line with the steady state and conceptual
model recharge rates.
Cl> > Cl>
...I so Ill :::c
90
80
70
:i: <( -c E c- 60 :J 0 ...
C>
50
40
+++ ~ . -••
1980
Observat ion Data RN7595 Run1
Run10
Run13
Run18 • •
.. ++..,. t +
1985 1990 1996 2001 Date
Fig ure 16 Comparison of modelled heads vs observed heads for RN7597. The response from the
calibrated model are in blue {Run10).
Date printed 22 November 2005 Dale Last Modified: 22 November 2005
Status: FINAL Page 28
Department of Natural Resources, Environment and The Arts

Cl> > Cl> ..J ... -s~ ns <(
~E c;, 0 ...
<.!)
130
120
11 0
100
90
80
1980
+++ Observation Data Run1 - Run10 Run13
••• Run18
1985
I I
Groundwa1er Modelling of1he Oolloo Dolosione
I RN8660
I I I
+ I I
1990 1995 2000 2005 Date
Figure 17 Comparison of modelled heads vs observed heads for RN8660. The response from the I calibrated model are in blue (Run10) .
Cl> > 3 ... -sC ns ::J: ~ <( ,, E
70
60
50
c-;, 40 0 ...
<.!)
30
20
+++ + + -••
1980
RN21717 Observation Data Run1 Run10 Run13 Run18
1985 1990 1995 2000 2005 Date
Figure 18 Comparison of modelled heads vs observed heads for RN21717. The response from the
calibrated model are in blue (Run10).
Date primed 22 November 2005 Date Last Modified: 22 November 2005
Sta1us: FINAL Page 29
Deparlment ofNa1urul Resources, Environment and The Arts
I I I I
I I I I I I

I I I I I I I I I I I I I I I I I I I I
Groundwater Modelling of the Oolloo Dolostone
3.10.2 Groundwater Discharge Hydrographs
The modelled and observed discharge to the river between Dorisvale and Mt Nancar are presented in
Figure 19. The modelled response shows a reasonable fit to the observed data, except in the late
80's to early 90's, where the modelled response is lower. It is interpreted that this is due to the use of
rainfall data from Katherine to simulate the recharge pattern in the northwestern portion of the study
area, where, in section 1.5 it was shown that the average rainfall increases to the northwest, also
rainfall events in the northwest of the study area, may not have been recorded in the southeast of the
study area or poor dry season river flow data at gauging stations G810067 and G8140040.
The results from Run18 have been added to demonstrate the effects of a constant transmissivity
across the model.
100
Discharge along Daly River from Dorisvale to Mt Na near
10
0.1
1980
Run18
- Run10 ......._... Observed Flows
1985 1990 Date
Discharge underestimated - associated with underestimated recharge in northwest of the study area.
1995 2000 2005
Figure 19 Comparison of modelled discharge vs observed discharge along the Daly River from
Dorisvale to Mt Nancar.
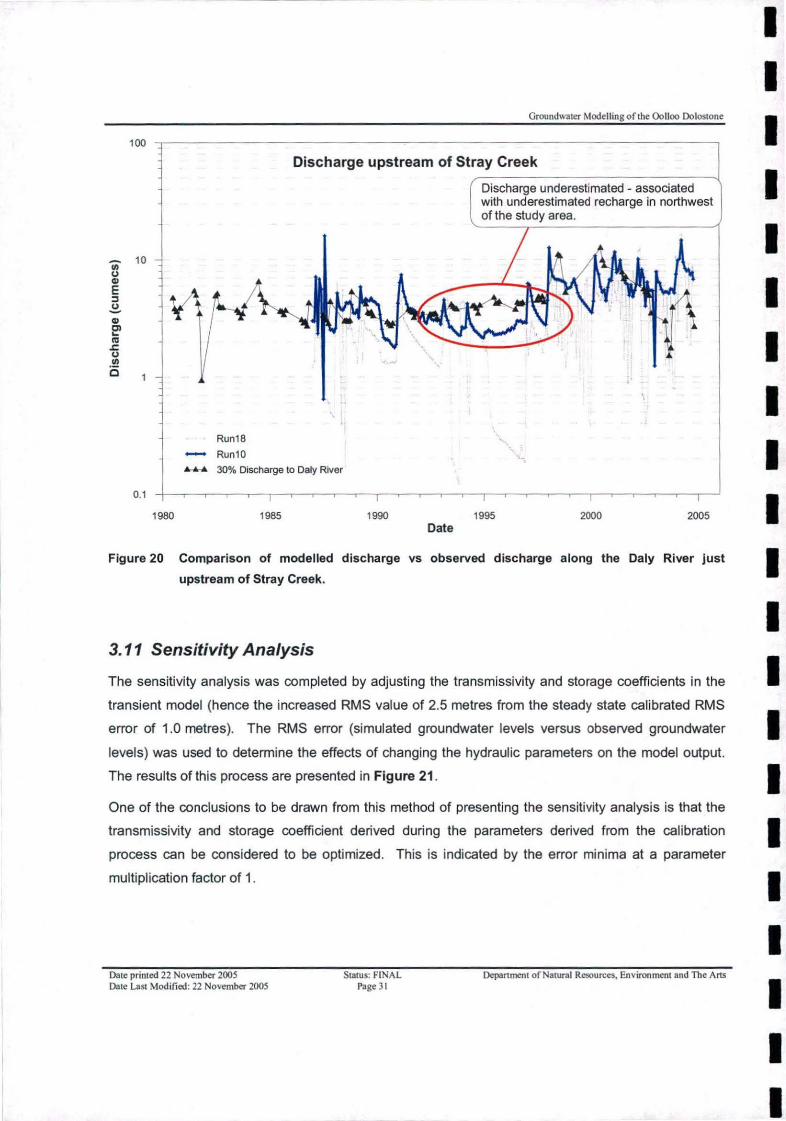
The modelled and observed discharge to the river upstream of Stray Creek are presented in Figure
20. Again the modelled response shows a reasonable fit to the observed data, except in the late 80's
to early 90's, where the modelled response is lower.
Date printed 22 November 2005 Date Last Modified: 22 November 2005
Status: FINAL Page 30
Department of Natural Resources, Environment and The Arts
'---~-
Groundwater Modelling of the Oolloo Dolostone
Discharge upstream of Stray Creek
0.1
1980
Run18
- Run10 ......_. 30% Discharge to Daly River
1985 1990 Date
Discharge underestimated - associated with underestimated recharge in northwest of the study area.
\
1995 2000 2005
Figure 20 Comparison of modelled discharge vs observed discharge along the Daly River just
upstream of Stray Creek.
3. 11 Sensitivity Analysis
The sensitivity analysis was completed by adjusting the transmissivity and storage coefficients in the
transient model (hence the increased RMS value of 2.5 metres from the steady state calibrated RMS
error of 1.0 metres). The RMS error (simulated groundwater levels versus observed groundwater
levels) was used to determine the effects of changing the hydraulic parameters on the model output.
The results of this process are presented in Figure 21 .
One of the conclusions to be drawn from this method of presenting the sensitivity analysis is that the
transmissivity and storage coefficient derived during the parameters derived from the calibration
process can be considered to be optimized. This is indicated by the error minima at a parameter
multiplication factor of 1.
Date printed 22 November 2005 Date Las1 Modified: 22 November 2005
Status: FINAL Page 31
Depenment of Natural Resources, Environment end The Arts
I I I I I I I I I I I I I I I I I I I I I

I I I I I I I I I I I I I I I I I I I I 11
10.0
9.0
8.0
7.0 ...
6.0 e ... w 5.0 Cl)
~ 4.0
~ ·~ "'-' I'..
~
3.0
2.0
1.0
0.0 0.1
Sensitivity Analysis
"' I "\ // ' I\.
'\ ~ "\ /. ---..._ i'.. i\ - ~-,,....
1
Multiplication Factor
I If
J v
/ ./
I _......
10
Groundwater Modelling of the Oolloo Dolostone
~ Transmissi~ty Zone1
- Transmissi~ty Zone2
-.-storage Coefficient
Figure 21 Sensitivity analysis for variations in the transmissivlty for the massive and bedded Oolloo
dolostone units and storage coefficient.
Date printed 22 November 2005 Date Last Modified: 22 Novcmber2005
Status: FINAL Page 32
Deparuncnt of Natural Resources, Environment and The Arts

Groundwater Modelling of the Oolloo Dolostone
4 Model Validation
4. 1 Stable Isotope vs Particle Tracking as an Estimate of Residence Time
4.1.1 14C Ageing to Estimate Groundwater Residence Time
Tickell, (2004) and Herczeg, (2004), presented the results of a carbon 14 survey conducted in late
July and mid August of 2003 (two samples were obtained in early September 2002).
"The corrected results indicate that the water is modem. The (14C) model age
estimates give mostly negative ages, and are expressed here as modern which
means that they must contain some bomb-fallout 14C making them less than 50
years old. This means that recharge is very rapid and that all groundwater ages with
the exception of G8145619, G8145130 (samples taken at springs) and RN32751 are
less than 50 years old."
(Herczeg, 2004)
4.1.2 Storage vs Discharge to Estimate Groundwater Residence Time
Assuming the conceptual model employed in the numerical modelling (section 2.3), the estimated
turnover time for the basin can be estimated by dividing the average discharge rate per year by the
total storage of the aquifer. The storage of the aquifer S is estimated as:
S=A x bxs
where:
S is the groundwater stored in the aquifer
A is the area of the aquifer= 4637 km2 (4.637 x 10⁹ m2)
b is the aquifer thickness = 100 m
sis the specific yield of the aquifer= 0.04
s = 4.637 x 109 x 100 x 0.04
S = 1.8548 x 10¹⁰ m3
the aquifer discharges on average approximately 10 m3/sec = 3.78x10⁸ m3/yr
the estimate of the turnover time is the groundwater stored divided by the discharge
1.8548 x 10¹⁰ m3 / 3.78 x 10⁸ m3/yr
= 49 years
Date printed 22 November 2005 Date Last Modified: 22 November 2005
Status: FINAL Page 33
Depanment of Natural Resources, Environment and The Ans
I I I I I I I I I I I I I I I I I I I I I

I I I I I I I I I I I I I I I I I I I I
Groundwater Modelling o f the Oolloo Dolostone
4.1.3 Particle Tracking to Estimate Groundwater Residence Time
The particle tracking computation methods are based on the Darcian velocity distributions determined
from the steady state head distribution (Anderson and Woessner, 2002).
where
vd = darcy velocity
K = hydraulic conductivity
& = specific yield
az = groundwater gradient a
This technique can provide point related information about groundwater age in the form of isochrones,
which are often used to delineate well capture zones. It should be noted that particle tracking
simulates advective transport and neglects to include dispersion processes.
The hydraulic head determined from the steady state simulation is independent of porosity, however,
as noted above, to determine the particle track of the plume migration using the Darcy velocity a
porosity is required, a porosity of 0.04 and an aquifer thickness of 100 meters was employed.
The simulations have been presented in isochrones (the distance covered by a "particle" for a given
time) to show the migration of a water "particle". The results are presented in Figure 22 "X" markers
at the head of the particle track indicate a time of one year, whilst "'Y " indicates a travel time of
50 years.
The particle tracking indicates that the residence time of the groundwater in the Oolloo Dolostone is
generally younger than 100 years as evidenced by the particle tracks originating near the Katherine
River. Water recharging closer to Stray Creek shows residence times of the order of a decade or so.
It could therefore be argued that an average residence time of -50 years is a reasonable assertion.
This estimate is in line with the previous analytical estimates.
Dille printed 22 November 2005 Drue Last Modified: 22 November 2005
Status: FINAL Page 34
Department of Natural Resources, Environment and The Arts

T
+ T
+
• • •
0 5 10 20 30
Kilometres
• •
Groundwater Modelling oflhe Oolloo Dolostone
• +
• +
lsocrone Marker
1 yr
+ 10 yrs
• 20 yrs
t 40 yrs
T 50 yrs
Particle Track
- Major Drainage
~ Oolloo Extent
Figure 22 Particle tracking results from the calibrated transient model. "X" markers at the head of the
particle tracking indicate a time of one year, whilst " ~ " indicates a travel time of 50 years.
Date printed 22 November 2005 Date Last Modified: 22 November 2005
Status: FINAL Page 35
Depanrnent of Nat11r11I Resources, Environment and The Ans
I I I I I I I I I I I I I I I I I I I I I

I I I I I I I I I I I I I I I I I I I I l) ___ _
Groundwater Modell ing of the Oolloo Dolostone
5 Conclusions
• Initial modeling of the Oolloo Dolostone indicates that the conceptual model is valid. However,
further refinement is required before the groundwater model can be implemented to assess the
effects of groundwater pumping on discharge to the river. The major areas where refinement is
required relate to the improved representation of recharge, spring inflows and wet season river
heights in the model.
• Recharge events for the model area need to take into account the variable nature of the rainfall
across the study area. There is an increase in average rainfall going towards the coast, it is also
suggested that some rainfall events in the northwest of the study area may not be represented in
the records from the southeast of the study area.
Da1e printed 22 November 2005 Status: FINAL Page 36
Depanmcnt of Natural Resources, Environment and The Ans Dale Last Modified: 22 November 2005

Groundwater Modelling of the Oolloo Dolostoae
6 Recommendations
• Inclusion of gauged stream heights to be used for the transfer boundary, this will provide a closer
simulation of the recharge/discharge processes occurring during the wet and dry seasons. This
would involve:
o Survey groundwater monitoring sites to obtain actual stream heights
• An upgrade of dry season river flow data contained in Hydsys for gauging stations G8140040 and
G8140067 located on the Daly River is required to remove discrepancies between Hydsys flows
(generated from river heights and rating curves) and actual gauged flows.
• Include rainfall data from the northwest of the study area and determine the relationship to
potential recharge, as has been completed for the Katherine region.
• Locate springs and define actual spring zones in river (rather than making entire river bed a
spring/discharge)
• Include assessment in the variation in recharge rate associated with natural vegetation and
cleared in areas where development is occurring/expected.
• Scenario modelling - what do we see as the future developments- land clearing, groundwater
pumping.
• Riparian evapotranspiration could be included, although this is only a small component of the
water balance.
• Identify sites where additional groundwater level data is required;
Date printed 22 November 2005 Date Last Modified: 22 Novernbes- 2005
Status: FINAL Page 37
Department of Natural Resources, Environment and The Arts
I I I I I I I I I I I I I I I I I I I I I

I I I I I I I I I I I I I I I I I I I I
Groundwater Modelling of the Oolloo Dolostonc
7 References
Anderson, M. P. and Woessner, W. W., (2002) Applied groundwater modelling: simulation of flow and
advective transport, Elsevier (USA)
Diersch, H.-J .G., (2004), FEFLO~ 5.1 Users Manual, WASY - Institute for Water Resources
Planning and System Research, Berlin, Germany.
Herczeg, A., (2004), 14C Ages for Groundwaters in the Daly River Region, Northern Territory, CSIRO
Land and Water
Jolly, P.J ., (2002), Daly River Catchment Water Balance, NTG Report No. 10/2002
Jolly, P.J., George, D., Jolly, I., and Z Spiers, (2000), Analysis of Groundwater Fed Flows for the
Flora, Katherine, Douglas and Daly Rivers, NTG Report No. 36/2000
Tickell , S.J., (2002a), A Survey of Springs along the Daly River, NTG Report No. 06/2002
Tickell , S.J., (2002b), Water Resources of the Oolloo Dolostone, NTG Report No. 17/2002
Tickel, S.J., (2003), Carbon Dating of Groundwaters in the Oolloo Dolostone Aquifer, NTG Report No. 21/2004
Date printed 22 November 2005 Date Last Modified: 22 November 2005
Status: FINAL Page 38
Depanment of Natural Resources, Environment and The Ans
LI _ _____ _

Groundwater Modelling of the Oolloo Dolostonc
Appendix A Oolloo Monitoring Bores
Station Easting Northing Completion Rlmp Completed SWLRL Monitoring Monitoring
Date (mAHD) SWL (mAHD) Commenced Ceased
(mBGL)
RN007509 133802.3 8413500 29/01 /1971 107.5 58.2 49.3
RN007595 133706.1 8413432 18/02/1971 110.3 57.7 52.6 3/05/1974 Present
RN008660 170461 8362829 22/11/1974 120.7 16.3 104.4 24/10/2000 Present
RN020614 87747.5 8466984 19/12/1980 42.8 16.18 26.6 22/08/1985 Present
RN021717 100642.2 8451881 20/10/1982 71 .4 22108/1985 Present
RN021830 92661.0 8435917 28/10/1982 56.2 11 .2 45.0 21/08/1985 Present
RN021833 100969.5 8452407 18/11/1982 73.1 7/03/1986 7/05/1987
RN025285 97488.6 8439119 20/05/1988 46.0 12.8 33.2 26/07/1988 Present
RN025286 94939 8436873 24/05/1988 47.6 12.5 35.1 26/07/1988 Present
RN025287 102309.2 8442830 27/05/1988 75.4 39.4 36.0 26/07/1988 Present
RN026555 150299.3 8372294 27/06/1988 83.1 13 70.1 6/09/2000 22/02/2001
RN030803 173765.1 8388082 19/10/1996 109.8 49.7 60.1 20/04/2002 Present
RN031101 92484.7 8457804 16/06/1997 42.0 2.68 39.3 28/01/1999 Present
RN032750 156367.3 8393206 1/09/2000 122.6 61.31 61 .3 24/10/2000 Present
RN032751 142749.3 8399793 6/09/2000 68.2 9.75 58.4 9/10/2000 Present
RN033033 110576 8434338 14/06/2001 70.9 13.7 57.2 16/04/2002 Present
RN033034 110616.8 8429468 20/06/2001 68.9 19.6 49.3 16/04/2002 Present
RN033035 113103.6 8441191 26/06/2001 85.5 16.6 68.9 16/04/2002 Present
RN033039 178468 8367454 1/08/2001 102.1 12.9 89.2 16/04/2002 Present
RN033130 189239 8378588 8/08/2001 135.8 58.9 76.9
RN033131 174367.4 8373019 10/08/2001 84.1 11.8 72.3
RN033132 174370.9 8373000 13/08/2001 85.1 12.2 72.9 8/10/2001 Present
Date printed 22 November 2005 Status: FINAL Department of Natural Resources, Environment and The Arts Date Last Modi fied: 22 November 2005 Page 39
---------------------

- - - - - - - -RN033133 174667.5 8372605 15/08/2001
RN033308 136723.8 8420625 13/11/2001
Note: Coordinates are in GDA94 MGA Zone 53
Date printed 22 November 2005 Date Last Modified: 22 November 2005
Status: FINAL Pagc40
-85.5
- -6.3
42.5
-79.2
- -8/10/2001
17/04/2002
Department ofNatural Resources, Environment and The Arts
- - - - -Groundwater Modelling of the Oolloo Dolostonc
Present
Present
- -

Groundwater Modelling of the Oolloo Dolostone
Appendix B Oolloo Dolostone Pumping Test Data
Screen Screen I Recommended Depths Slots I Diameter T Storage Test Rate Obs.
RN. Area Formation. Rate (Usec.) (mBGL) O~en Hole . (mm) (m2/d) Coefficient Test !):~e (Usec) Bore South of 120 min.
7595 Dorisvale Rd. Massive 53 - 87.5 open hole 19 constant rate 42.8 South of 180 min.
7838 Dorisvale Rd. Massive 66.7-125 open hole constant rate 10.9 360 min.
8014 Massive 30.5 - 103.5 open hole 125 constant rate 0.75 South of
8015 Dorisvale Rd. Bedded 3.5 0 - 47 slots 152 5 x ? min steps 583 3 x 150 min
47 - 71.45 open hole steps 533 300 min. constant rate 1422 300 min.
8109 DouglaslDaly Bedded 25 19.5 - 52.7 open hole 193 constant rate 25 South of 1000 min.
8660 Dorisvale Rd. Bedded 4 36.4 - 60 slots 117 constant rate 9 South of 1400 min.
8661 Dorisvale Rd. Bedded 6 34.8 - 58 slots 117 116.5 constant rate 12 4 x 100 min.
20628 Douglas/Daly Bedded 50 40.2 - 81.2 open hole 178 1490 7.50E-03 steps 37 - 56 20614 1440 min
2150 constant rate 56 5540 Jolly(1984) 56
480 min. 21671 Douglas/Daly Massive 5 44.6 - 51.0 slots 152 35 constant rate 11.4 21672 Douglas/Daly Bedded 10 57 -68 slots 152 2590 3 x 30 min 2.5 - 6.6
68-78 open hole 3x100min 7.4 - 15 with extended last step 10 480 min.
21673 DouglaslDaly Bedded 7 40.6 - 47 open hole 140 constant rate 7 21834 DouglaslDaly Massive 40 97_5 - 99.7 screens 152 350 5.00E-05 2 x 30min. Steps 21717
60 min. constant 105.7-110 152 689 rate 50
1430 min. 3320 constant rate 80
103 Jolly(1984) 30
Date printed 22 November 2005 Status: FINAL Departmcn1 of Natural Resources, Environment and The Arts Date Last Modified: 22 November 2005 Page41
- - - - - - - - - - - - - - - - - - - -

- ----------- - - - - - - - - - - -28956 Douglas/Daly Bedded
South of 30404 Dorisvale Rd Bedded
South of 30451 Dorisvale Rd Massive
South of 30491 Dorisvale Rd Massive
South of 30802 Dorisvale Rd Massive
30949 Douglas/Daly Bedded
31101 Douglas/Daly Bedded
South of 32415 Dorisvale Rd Massive
33308 Douglas/Daly Massive
7626 Douslas/Dal~ Bedded
Date printed 22 November 2005 Date Last Modified: 22 November 2005
0.2
1.5
10
60
100
70
80
0.75
Status: FINAL Page42
80-98 slots 152
31 - 35 screens 154 16.6
20.8
69- 75 slots 140 244
screens & 78-119 slots 206 8054
79 - 95.1 screens 203 14972
28440
39.5 - 73.0 slots 202 16368
14483
33.1 - 99.4 slots 203 2304
5530
94.6-100.94 screens 206 3326 100.94 -119.01 slots 206
61.1-218.8 open hole 152 23700
78.7 - 91.0 slots 152 2
Department of Natural Resources, Environment and The Arts
- - - - - - -Groundwater Modelling of the Oolloo Dolostone
36 min. constant rate 0.5 3 x 100 min. steps 0.5 - 2 1440 min constant rate 2.5 4 x 100 min. step test with Aug-14 extended last step to1440 min. 10 3 x 100 min. step test with 65 - 100 extended last step 30- 75
3 x 60 min. steps 3 x 100 min. steps 30-90 30803 1440 min constant rate 90 4 x 100 min. steps 70-118 1440 min constant rate 110 4 x 100 min. step test with 30 - 65 30948 extended last step 70 30949
1470 min constant rate 4 x 100 min. step lest with 100
extended last step to 1440
min. 3 x 100 min. step test 6- 18 1440 min constant rate 1.25