preliminary report on fiscal designs for the...
TRANSCRIPT

PRELIMINARY REPORT ON FISCAL DESIGNS FOR THE DEVELOPMENT OF ALASKA NATURAL GAS
BY
DAVID WOOD NOVEMBER 2008
For
State of Alaska Legislative Budget & Audit Committee
David Wood & Associates www.dwasolutions.com
Appendix 3
Upstream Oil & Gas Fiscal Design –
Detailed Analysis of Specific Countries
Analysis of Fiscal Design of Specific Countries & Regions with Relevance to Upstream Natural Gas and Large‐scale Natural Gas Exports
Part 3: Upstream Oil & Gas Fiscal Design – Specific Countries
Analysis of Fiscal Design of Specific Countries & Regions with Relevance to Upstream Natural Gas and Large‐scale Natural Gas Exports
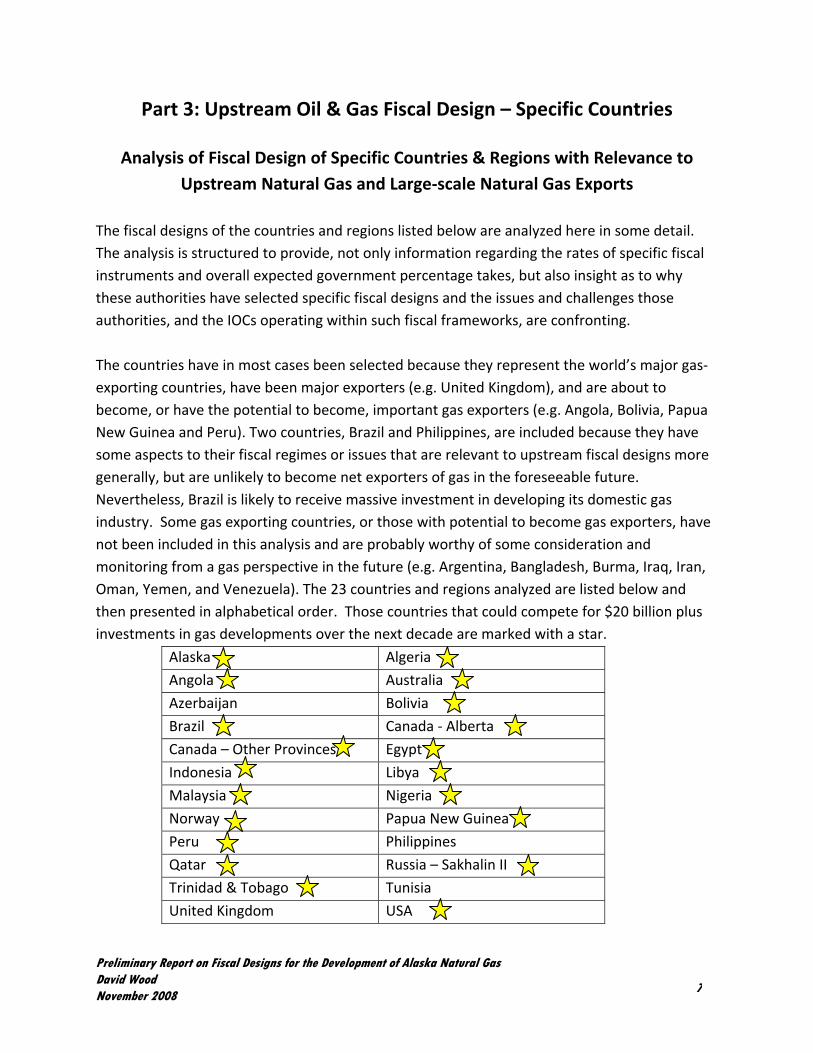
The fiscal designs of the countries and regions listed below are analyzed here in some detail. The analysis is structured to provide, not only information regarding the rates of specific fiscal instruments and overall expected government percentage takes, but also insight as to why these authorities have selected specific fiscal designs and the issues and challenges those authorities, and the IOCs operating within such fiscal frameworks, are confronting. The countries have in most cases been selected because they represent the world’s major gas‐exporting countries, have been major exporters (e.g. United Kingdom), and are about to become, or have the potential to become, important gas exporters (e.g. Angola, Bolivia, Papua New Guinea and Peru). Two countries, Brazil and Philippines, are included because they have some aspects to their fiscal regimes or issues that are relevant to upstream fiscal designs more generally, but are unlikely to become net exporters of gas in the foreseeable future. Nevertheless, Brazil is likely to receive massive investment in developing its domestic gas industry. Some gas exporting countries, or those with potential to become gas exporters, have not been included in this analysis and are probably worthy of some consideration and monitoring from a gas perspective in the future (e.g. Argentina, Bangladesh, Burma, Iraq, Iran, Oman, Yemen, and Venezuela). The 23 countries and regions analyzed are listed below and then presented in alphabetical order. Those countries that could compete for $20 billion plus investments in gas developments over the next decade are marked with a star.
Alaska Algeria
Angola Australia
Azerbaijan Bolivia
Brazil Canada ‐ Alberta
Canada – Other Provinces Egypt
Indonesia Libya
Malaysia Nigeria
Norway Papua New Guinea
Peru Philippines
Qatar Russia – Sakhalin II
Trinidad & Tobago Tunisia
United Kingdom USA
Preliminary Report on Fiscal Designs for the Development of Alaska Natural Gas David Wood November 2008 7

Both oil and gas fiscal designs are considered as the two interact and in most cases the natural gas fiscal designs have evolved from existing fiscal design focused on oil.
Preliminary Report on Fiscal Designs for the Development of Alaska Natural Gas David Wood November 2008 8
Alaska A more detailed analysis of Alaska’s fiscal system is provided in Section 3 of this report. The main structure of the prevailing oil and gas fiscal design is summarized here for comparative purposes. The state of Alaska has five major sources of revenue from the petroleum industry. • Royalty (~12.5%) • Basic production tax (BPT) – (25%) • Progressivity increment to BPT (0% to 50%) • Property tax • Alaska Corporate Income tax Note ‐ the production tax reforms of 2006 were known as the PPT reforms, while the production tax reforms of 2007 are known as ACES. A 20% investment tax credit also applies to moderate the impact of the BPT. Companies holding tax credits but without sufficient tax liability to use the credits may sell them to other BPT‐paying companies or under certain conditions, directly to the state. Most of the property tax goes to the North Slope Borough and other municipalities. The total tax is 20 mills, or 2% of the assessed value of oil and gas property in the state. Progressivity Increment to BPT Tax In high‐price environments much of the tax revenue comes from the oil progressivity tax – referred to here as CPT (combined progressivity tax). Although applied to both oil and gas, the CPT was designed with reference to oil prices and costs. Any gas revenues and costs are currently converted to barrels of oil equivalent (boe) at a rate of 6 million British Thermal Units (mmbtu) equal 1 barrel of oil. As a consequence of the prevailing CPT mechanism, oil price has become an important component of Alaska’s fiscal design for natural gas. The progressivity adjustment to BPT was introduced in 2006, with rates amended in 2007. Its current mechanism effectively increases the PPT tax rate by 0.4% for every dollar the PTV (production tax value – defined as revenues minus all costs) for the period is above US$30/barrel up to US$92.5/barrel. For higher PTVs the progressivity adjustment increases the progressivity tax rate by 0.10% for every dollar the PTV for the period is above US$92.5/barrel, with a total cap on progressivity of 50%.
Preliminary Report on Fiscal Designs for the Development of Alaska Natural Gas David Wood November 2008 9

Alaska Corporate Income Tax (CIT) Alaska, like many other states in the union, is an apportionment state. This means that for state corporate income tax calculations a company’s tax on worldwide earnings is adjusted by the state’s apportionment factor. Hence, for income tax analysis, information is required on its worldwide income in order to calculate what Alaska would ultimately receive as its share of that tax. Alaska’s apportionment factor is driven by the ratio of a taxpayer’s Alaska property, production and sales to its worldwide property, production and sales. For most large IOCs the denominator (worldwide component) in that ratio is very large. This makes detailed modelling of Alaska’s CIT difficult and requires many company‐specific inputs to compute accurately. A combined federal and Alaska CIT rate is approximately 41%, comprising a federal rate of 35% calculated on the same tax base as the state CIT component less a deduction for the state CIT component.
Preliminary Report on Fiscal Designs for the Development of Alaska Natural Gas David Wood November 2008 10

Algeria Fiscal instability: Algeria was the first OPEC member to nationalize its oil industry. At the end of 1970, all non‐French companies’ assets were nationalized. In 1971 partial nationalization followed for concessions held by French companies (51% of oil concessions, 100% gas sector, 100% oil and gas pipelines), and a new hydrocarbon law was introduced as the basis for cooperation with international oil companies (IOCs)based on partnership with Sonatrach – the national oil company (NOC) – which held a 51% share. This provided Sonatrach with about 77% of crude oil production and 100% of gas production in 1972. In 1980 the historic association agreements with Total were not renewed but IOCs were permitted to participate in upstream oil projects as minority partners. In 1986, in response to $10/barrel oil prices, Algeria enacted a new hydrocarbon law allowing greater access to IOCs through production‐sharing agreements (PSAs), joint ventures, and risk service contracts and relaxed fiscal terms by reducing royalty and income tax rates. IOCs did not respond to this, and further amendments were made to the hydrocarbon law in 1991. Fiscal terms were tough with high government takes (>70%) with price caps in place in many contracts. Between 1987 and 2000 exploration budgets totaled some $1.5 billion and resulted in more than 30 discoveries representing reserves of some 7 billion boe. From 1995 production has increased from 168 million tones of oil equivalent (toe) including 2 million toe from projects in association with IOCs to 230 million toe in 2006 including 66 toe (more than one‐third) from IOC‐operated ventures. Sonatrach‐only production ventures produced 166 toe in 1995 and 164 toe in 2006 (136 million toe were exported). In 2005 a new hydrocarbon law was introduced (with amendments in 2006) aimed at encouraging IOCs to invest and operate in areas previously controlled solely by Sonatrach. This law initiates a move away from the PSA design (perhaps influenced by closer ties with Russia, with whom Sonatrach is supporting the formation of a gas‐focused international cartel similar to OPEC). In June 2008 Gazprom and Sonatrach announced intentions to prepare gas‐swap contracts for pipeline and LNG supplies to Europe. The favored contracts are new exploration contracts (mineral‐interest fiscal scheme) based on regular tax and royalty structure, with limited guarantees of fiscal stability for IOC investors. The 2006 amendments introduced a windfall tax of up to 50% on profits when oil prices rise above $30/barrel. The rate of participation for Sonatrach was set at 51% in all new contracts. The new contracts offered adhere to the following fiscal design:
Preliminary Report on Fiscal Designs for the Development of Alaska Natural Gas David Wood November 2008 11

Bonuses: None are applied. Royalties: Vary according to prospectivity and production rates. These rates vary in four tranches from 5.5% for production < 20,000 boe/day to 12% for production >100,000 boe/day for frontier areas. In highly prospective areas these rates vary in four tranches from 12.5% for production < 20,000 boe/day to 20% for production >100,000 boe/day. Base prices are applied, and these are different for gas and oil exported versus that destined for the domestic market. The calculation is made in Algerian Dinars indexed to a U.S. dollar exchange rate. Tax on oil revenues (TRP) is calculated on marketed quantities minus amortizations. Pipeline transport fees to Algerian border are deductible, and LNG and LPG projects processing investment costs are also deductible. Amortization annuity rates are 20% for frontier areas (and those requiring assisted recovery) and 12.5% for the most prospective areas, and the deductible costs are uplifted by 15% in frontier areas and 20% in the most prospective areas and those requiring assisted recovery. The TRP rates are a function of the cumulative value of production (CVP) since the beginning of exploitation measured in Algerian Dinars (AD). When CVP is less than $70 billion AD (about US$1 billion) the rate is 30%. When CVP is greater than $385 billion AD (about US$5.5 billion) the rate is 70%. Between these two values the rate is calculated by a formula {[40/(385‐70)] *(PV‐70) +30%.} Tax on income (ICR) is calculated on profits after deduction of TRP and allowable expenditures. The rate is 30% with reinvested earnings subjected to a reduced rate of 15%. Tax on extraordinary income (TPE) is a windfall tax and is applied at a minimum rate of 5% up to a maximum rate of 50%. It is a non‐deductible tax on exceptional profit obtained by IOCs and applies to the portion of production (oil and gas) reverting to them if monthly arithmetic mean of Brent petroleum price is greater than $30 per barrel. The escalation of rates of TPE is linked to varying tranches of production in some contracts and in others with price caps it is based upon the price differential between the actual price and the specified price cap. State participation: The rate of participation of the NOC is fixed at minimum rate of 51%. Bank guarantee: This is required as the minimum work program agreed in each contract. The National Agency for the Development of Hydrocarbon Resources (Alnaft) is counterparty to all IOC agreements.
Preliminary Report on Fiscal Designs for the Development of Alaska Natural Gas David Wood November 2008 12

No gas‐flaring rule is imposed on economic and environmental grounds with exceptional maximum 90‐day exemption at a non‐deductible cost of 8,000 dinars (indexed to US dollar)/thousand cubic meters. Alnaft holds special powers in relation to gas: 1) It is responsible for a ten‐year plan and forecasting/reporting of gas production and reserves and allocations between domestic market and export requirements. 2) it must ensure a minimum 85% take‐or‐pay component in any gas sales agreements and be provided with copies of all sales agreements concluded to establish national benchmark gas prices; 3) Gas suppliers are encouraged to use gas‐swap agreements to balance supply and demand, but they are monitored so as not to negatively impact the government’s tax take. 4) Authorizing carbon‐credit transfers on the international markets under the Kyoto Agreement. Tender process for pipeline construction is specified in the hydrocarbon law. A pipeline transportation fund has been established and guidelines for structuring a pipeline tariff to provide users with an efficient and commercially sustainable mechanism. Surface area tax is subject to revisions annually and adjustments for US dollar exchange rates. The rates are non‐deductible and increase substantially from exploration to exploitation periods. Other taxes on flaring, water use and carbon credit transfers may also apply. Property taxes are payable on properties not directly involved in field operations. Farm‐out deals are charged 1% of the transaction value. Exemptions from customs duties and VAT continue to apply. PSAs: There are a number of contract types in existence in Algeria. In historic production‐sharing agreements the normal royalty rate is 20%, which can be reduced to 16.25% and 12.5% in less prospective areas. Income tax rate of 38% is paid on the IOC’s profit oil (which is their percentage in the contract now specified to be less than or equal to 49%). Taxes on corporate earnings are paid from Sonatrach’s share only. The TRP windfall tax is also applied to PSA contracts. Excluding the windfall TRP tax, the Algerian PSA agreements provide Algeria with some 70% to 75% take of revenues.
Preliminary Report on Fiscal Designs for the Development of Alaska Natural Gas David Wood November 2008 13

Angola Angola has preferred to operate production‐sharing fiscal designs since the 1980s, but still operates production offshore Cabinda under a mineral‐interest concession agreement signed originally with Gulf Oil in the 1970s and now operated by Chevron. Outline of Historic Offshore Cabinda Concession Fiscal Terms Bonus: Negotiable item in order to periodically extend contract. Royalty: 20% of gross production. Petroleum transaction tax (TTP): 70% of revenue less depreciation less opex (US$/barrel production allowance) less investment allowance (50% uplift). Depreciation of capital costs over 4 to 6 years depending upon type. Income tax (IRP) 65.75% of revenue less depreciation less opex less 50% capital cost uplift less royalty less TTP. Government participation: Sonangol (NOC) holds 41% of investor equity. Outline of Offshore PSC Terms In the 1980s these terms involved: Bonuses: Negotiable (maximum a few million signature bonus) and not recovered or amortized for cost recovery purposes. Royalty: None. Development area rentals: US$300 per km2. Cost‐ oil allocation: Typically 50% (negotiable). Depreciation of capital costs: Straight line over 5 years. Capital‐cost uplift: Factor = 1.4 (or 40%). Profit oil is split on a sliding scale triggered by cumulative production levels (negotiable). Typical tranches for profit oil to IOCs are: Up to 25 million barrels of oil, 60%.
Preliminary Report on Fiscal Designs for the Development of Alaska Natural Gas David Wood November 2008 14

From 25 million to 50 million barrels of oil, 50%. From 50 million to 100 million barrels of oil, 40%. >= 100 million barrels of oil, 30%. Gas: No market; flaring of associated gas allowed. Price Cap – above about $30/barrel: Negotiable and escalated each year with inflation; all excess revenues went to government. Petroleum income tax rate: 50%. State equity participation: Negotiable, less than 20% (zero percent state participation was agreed to in some of the earlier contracts signed). Evolution of PSC Terms Through 1990s During the 1990s the range of admissible expenses for cost‐recovery purposes was increased, the price cap excess‐fee provision was eliminated and the rate of straight‐line depreciation of development expenses was increased from 20% per year to 25% per year. The uplift and depreciation parameters were no longer specified in the model PSA agreement of 1997 but became negotiable. Signature bonuses remained negotiable, and major IOCs started to trade off large bonuses for higher share of production in case of discoveries. Tax stability clause was introduced: Government is open to revisions regarding fiscal design subject to the fact that it does not impact negatively on either party’s economic benefit. Sonangol reimburses the contractor for any increases in taxes including clearance, stamp duty and/or the statistical levy applicable to imports. Ring‐fences: Capital development costs ring‐fenced to each developed field. No ring‐fence applies for exploration expenditure within the contract area. Non‐ recoverable expenditures: Signature bonus, petroleum income tax, contributions and taxes on salaries and wages of workers employed by the IOC. A wider range of cost items now classified as recoverable only with prior approval of Sonangol has increased. Element of Sonangol discretion applies to costs incurred before the effective date of the agreement,
Preliminary Report on Fiscal Designs for the Development of Alaska Natural Gas David Wood November 2008 15

promotional and advertising expenses, and cost incurred without prior authorization. There are now a greater number of audit exemptions and negotiations over what costs are allowable. Loss carry‐forwards: 5 years for development expenditures, after which contractor’s share of crude oil is increased to allow for cost recovery. Indefinite carry‐forward with no change in cost recovery parameter for other types of expenditure. Production sharing liked to after‐tax rate of return (IRR): Crude oil produced and saved in a quarter from each commercial discovery and its development area and not used in petroleum operations less cost‐recovery crude oil from the same area is referred to as “development area profit oil” and shared between Sonangol and IOC according to the after‐tax nominal rate of return achieved in the preceding quarter. The Angola model PSA has 5 different rates of return triggering profit‐oil shares which are negotiable. Rate of return is determined on the basis of the accumulated compounded net cash flow for each development area. Outline of Deepwater PSC terms Signature bonus: One of the main bidding items in competitive acreage auctions has been bid bonuses of hundreds of millions of US dollars. Many IOCs (and NOCs) have bid large amounts for deepwater Angola acreage. The highest signature bonuses ever paid have been for Angola deepwater PSC areas. Cost recovery: typically 50% of gross production revenues (can be 65%). Uplift on capital expenditure: negotiable in the range 20% to 50%. Depreciation of capital costs: Straight‐line over 4 years (25%/year). Production sharing sliding scale for profit oil: Linked to post‐tax IRR of each field. Government share increases progressively through five threshold IRR percentages at negotiable rates, typically starting at about 20% for lowest IRRs and rising to 85% ‐ 90% above IRRs of 40% or so. Petroleum income tax: 50% of investor profit share. Government participation: Sonangol 0%‐20% of IOC equity (negotiable). Natural gas: No‐flaring rules introduced in 2007. Final investment decision on Soyo LNG plant was made in February 2008 led by Chevron, but there will be no market for export gas for at
Preliminary Report on Fiscal Designs for the Development of Alaska Natural Gas David Wood November 2008 16

least 5 years. Much of the gas in deepwater is associated gas, and offshore costs to gather it and pipe it to the onshore LNG facility are substantial. Gas pricing and LNG contracts have taken almost a decade to negotiate and suggest that terms for IOCs are not that favorable. LNG plans: After years of discussion, the final investment decision was finally made in early 2008 on the Angola LNG project. Chevron and partners agreed to a deal with Sonangol to develop the project. According to the project consortium, gas will be supplied to the plant from associated gas fields, thereby helping to avoid gas flaring and enabling enhanced production of oil on associated fields. The development consortium comprises Chevron subsidiary Cabinda Gulf Oil Company (36.4%), Sonangol offshoot Sonagas (22.8%), BP (13.6%), Enl (13.6%) and Total (13.6%). A single liquefied natural gas (LNG) train with production capacity of 5.2 million tonnes a year will be developed on the Angolan coast close to the city of Soyo, about 350 km north of Luanda. Gas is expected to be shipped from the Soyo plant from the first quarter of 2012 to Gulf LNG's regasification terminal in Mississippi for sale across the U.S. According to Angolan sources, the project is budgeted to cost some $4 billion to develop, making it the single biggest individual investment in Angola. ExxonMobil withdrew from the consortium in 2005 and Eni joined the consortium as the result of a strategic cooperation agreement with Sonangol in December 2006. In late 2007 Eni signed a participation agreement to join another LNG consortium, led by Sonagas with a 40% stake, which will assess proven gas reserves with a view to developing a second LNG plant that would also be fed by offshore reserves. Significant change in fiscal design: The structure of the deepwater contracts since the late 1990s has fundamentally altered the distribution of gross oil revenue between IOC and the government. The deepwater water fields incur substantially higher costs than shallow water properties and are taxed under varying production‐sharing contract terms that split profit oil according to rate of return rather than according to the cumulative production models used during the 1980s. The Angolan government has traded these terms for very high signature bonuses. Under these deepwater terms, the government share of profit oil ranges in some cases as high as 90% where the rate of return reaches more than 40%. However, in practice, most deepwater projects are likely to achieve much lower returns even at high oil prices for many years into production. Hence the government share of profit oil typically remains about 25% to 40% until several years after payback. In contrast, the government's share of profit oil under the 1980s/early 1990s PSCs was usually 90% in shallow water fields once production exceeded 100 million barrels of cumulative production.
Preliminary Report on Fiscal Designs for the Development of Alaska Natural Gas David Wood November 2008 17

Competitive bidding rounds highlight enthusiasm of IOCs for deepwater acreage: Sonangol conducted a public opening of sealed tenders for five deepwater offshore Blocks 1, 5, 6, 26, and the relinquished portion of Block 15. The bid round was launched in December 2005 and each block attracted substantial bids. The public opening of the tenders was held in Luanda on 3rd April 2006. Eni outbid all competitors with a cumulative bid of $902 million and an offer to pay a signature bonus of $150 million for the relinquished portion of Angola’s Block 15. Already a player in the ExxonMobil‐operated Block 15 Kizomba area, Eni wished to expand its presence and demonstrated that it was willing to pay for it. Other cumulative bids in that round were: Sinopec, $750 million; Total, $560 million; Petrobras, $265 million; and Statoil, $254 million.
Preliminary Report on Fiscal Designs for the Development of Alaska Natural Gas David Wood November 2008 18
Australia Since the mid‐1980s, following the introduction of a resource rent taxation system in Barrow Island in 1985, the Australian government has progressively shifted from the historical volume‐based royalty arrangements to the more progressive resource rent taxation system, but operates more than one fiscal system. The petroleum resource rent tax (PRRT) is levied under the provisions of the Petroleum Resource Rent Tax Assessment Act 1987 and was extended to all new developments and new discoveries made after 1990. PRRT is applied to the recovery of all petroleum products from Australian government waters (including crude oil, natural gas, LPG condensate and ethane) except for petroleum products extracted from the North West Shelf project and the Joint Petroleum Development Area and value‐added products such as LNG. The PRRT fiscal design, in the words of the Australian government, through several key features provides a regime that encourages exploration and production while ensuring adequate return to the community. PRRT is a profit‐based tax applied to individual projects. Each entity with an interest in a PRRT‐liable project will be liable for that PRRT. A project consists of facilities in the project title area and any facilities outside that area necessary for the production and initial storage of marketable petroleum commodities, such as stabilized crude oil, condensate, natural gas, liquefied petroleum gas, and ethane. Value‐added products, such as LNG, are excluded. PRRT is levied at a rate of 40% of a project’s taxable profit. Taxable profit is the project’s income after all project and other exploration expenditures, including a compounded amount for carried‐forward expenditures, have been deducted from all assessable receipts. PRRT payments are deductible for company income tax purposes. PRRT effectively becomes payable once project cash‐flow basis achieves a rate of return of 5% over the long‐term bond rate on the development investments and a 15% rate of return over the long‐term bond rate on exploration or risk capital investment. Eligible expenditures include exploration and all project development and operating expenditures. Closing‐down expenditures, including offshore platform removal and environmental restoration, are also deductible in the year in which they are incurred. If receipts during the year the project is closed down are less than the closing‐down expenditures, a credit is available, depending on whether the project has previously paid PRRT, for offset against other liabilities owed to the Australian government.
Preliminary Report on Fiscal Designs for the Development of Alaska Natural Gas David Wood November 2008 19

Cost uplift: All expenditures, except those incurred more than 5 years before the issue of a "statement of receipt" for information pertaining to a successful production license application, are eligible for uplift at the following rates:
• Exploration expenditure ‐ 15 percentage points above the Australian government long‐term bond rate (LTBR).
• Other expenditures (such as capital and operating expenditures) ‐ 5 percentage points above the LTBR.
Exploration expenditures incurred more than 5 years before the statement of receipt are compounded at a rate that compensates for inflation (represented by the gross domestic product factor). No exploration ring‐fence: All exploration expenditures incurred in areas covered by the PRRT are deductible against all PRRT‐liable projects held by that entity subject to compliance with anti‐avoidance provisions. In the case of a company in a company group, the expenditure will be deductible against all PRRT‐liable projects held by the group. This ensures that the pattern of exploration is not affected by taxation arrangements. Corporate income tax rate of 30% applies to all upstream projects in offshore areas. The PRRT system described above applies to all offshore petroleum projects in the Australian government’s jurisdiction, except for the North West Shelf (NWS) production area (off the northwest coast of Western Australia) to which petroleum royalties and crude oil excise apply and the Joint Petroleum Development Area (JPDA) between Australia and East Timor which is subject to production‐sharing contract (PSC) arrangements. NWS production area is subject to royalty and crude oil excise tax. The rate of excise tax applied depends on the annual rate of production of crude oil, the date of discovery of the petroleum reservoir and the date on which production commenced. In May 2008 the new Labor Party government removed the oil excise exemption for condensate. That change is expected to add $564 million (Aus.) to federal government revenue during the next financial year (2008‐09) and about $2.5 billion over the next 4 years. Under previous arrangements the first 30 million bbl of oil produced from a field was exempt from excise duty. Past production of condensate will now contribute to reaching that threshold. Industry representatives expressed surprise at the government's unexpected move and concern at the absence of any prior consultation. In contrast to the PRRT system the royalty and excise system applied to NWS means that IOCs pay both royalty and excise from first production, despite incurring large capital costs that would take years to recover. These arrangements resulted in the government
Preliminary Report on Fiscal Designs for the Development of Alaska Natural Gas David Wood November 2008 20
gaining revenues from first production many years before the project has recovered costs. In contrast, the PRRT regime, although providing a higher government take, results in tax payments commencing only after a project has recovered capital costs. The removal of the condensate exemption means that there is little overall difference in the ultimate take of the two systems on an undiscounted basis. Onshore: An older style tax and royalty system applies. Royalties are levied at 10% on petroleum and crude oil excise applies. The first 30 million barrels is excise exempt, and variable excise rates apply to annual production at different levels. Excise is waived where a state introduces a resource rent royalty (RRR) on a petroleum development within its jurisdiction and where a revenue‐sharing agreement is negotiated with the Australian government.
Preliminary Report on Fiscal Designs for the Development of Alaska Natural Gas David Wood November 2008 21

Azerbaijan Fiscal system involves a production sharing agreement. Signature bonuses are high (in the tens of millions to hundreds of millions of dollars). Royalties: Azeri PSAs involve no royalty payments. Cost oil gas allocation: 100% for operating costs and from 50% to 60% for capital costs. Profit oil gas is calculated in some contracts according to R‐factor based sliding scales with as many as nine steps. The government (SOCAR is the NOC) share progressively increases from some 50% (when R<1.5) to some 90% (when R>3.5 of total profit oil). R‐factor is defined as cumulative contract revenues earned to date by IOC from cost recovery and profit oil divided by the cumulative expenses to date. R‐factor scales: A typical scale is: R‐Factor SOCAR (%) IOC (%) R<1.50 50 50 1.50<=R<2.00 60 40 2.00<=R<2.25 62.5 37.5 2.25<=R<2.50 65 35 2.50<=R<2.75 70 30 2.75<=R<3.00 75 25 3.00<=R< 3.25 80 20 3.25<=R<3.50 85 15 R>=3.50 90 10 IRR scales: In other contracts the profit‐oil sliding scale is based on a real after‐tax IRR. For example, up to a real IRR of 16.75%, 20% profit oil goes to government (SOCAR) rising to 50% (for IRR 16.75% to 24.75%) and up to 75% for IRR > 24.75%. Government participation: SOCAR participates with up to a 20% equity share in most projects on a fully‐paid (not carried) basis. Income tax is on a sliding scale based upon rate of return typically varying between 10% and 35% percent. The upper tax rate also depends on the working interest held by an IOC. For working interests above 30% the tax rate is 30%. For working interests less than 30% the tax
Preliminary Report on Fiscal Designs for the Development of Alaska Natural Gas David Wood November 2008 22

rate is 25%, increasing to 35% at higher profit levels. In remote mountainous areas onshore the tax rate is 10%. Profits reinvested in Azerbaijan are exempt from income tax. Azerbaijan is unusual in the 100% exemption of this instrument, although many countries offer partial exemptions. These terms result in government takes in profit of between about 50% and 80%, depending on the contract, field size and market conditions. In 2005 there were 24 ratified PSAs, each with its own separate negotiated tax regime. These contracts refer to fiscal stability.
Preliminary Report on Fiscal Designs for the Development of Alaska Natural Gas David Wood November 2008 23
Bolivia History of exploration success by IOCs for natural gas: In the 1990s Bolivia privatized its NOC (Yacimentos Petroliferos Fiscales Bolivianos, YPFB) and introduced petroleum sector incentives which attracted several IOCs (notably RepsolYPF, BP, BG, Total and Petrobras) to explore and find significant new gas reserves (increasing the country’s proven gas reserves some ten‐fold to some 55 tcf). This led to plans for an ambitious LNG export project to the U.S. However, a disgruntled sector of the majority indigenous population outside the petroleum producing provinces around Santa Cruz staged street riots in La Paz in October 2003 in which many died and ultimately forced the resignation of the then recently elected President Lozada. 2003 to 2005 revolution: President Lozada had proposed legislation providing for LNG exports via a gas pipeline to a gas liquefaction plant on the coast of Chile (an old enemy of Bolivia that had seized Bolivia’s coastline in the Chaco wars of 1880s). The indigenous Indian majority saw no benefits from Bolivia’s export of gas by pipeline to Bolivia and Argentina and believed they would also be disenfranchised from the LNG export revenues. The unrest continued and removed another interim president before the 2005 election of Evo Morales, who annulled the country’s existing petroleum contracts with the IOCs and re‐instated the NOC YPFB. New 2005 petroleum terms: A new hydrocarbon law passed in May 2005 nationalized the oil and gas interests of the country and required the dissolution of any existing joint‐operating agreements (JOAs) within 180 days and renegotiation of the JOAs to include YPFB as a partner. All production under the new terms (applied across all agreements retroactively) is sold through YPFB. Fiscal terms include a combined tax and royalty rate of 50% (up from 18%) on all the oil and gas production, as well as an additional tax/royalty of 32% applied to large fields/high production rates. The aim of the additional tax increments is to distribute them to the non‐producing provinces. IOCs facing a dilemma: IOCs with substantial undeveloped gas reserves that can no longer be exported through LNG projects have little choice but to accept the changes. For Petrobras, one of the IOCs most affected, the problem is complicated by the fact that it is the main customer for Bolivian gas through an existing export pipeline. It is clear that Brazil is no longer planning to expand gas purchases from Bolivia. A new alliance between Bolivia, Venezuela and Cuba has emerged, seeking tougher terms from IOCs. With no guarantees of fiscal stability and further appropriations in 2008 (e.g. Ashmore's 50‐percent stake in Transredes, which operates pipelines that carry Bolivian natural gas to neighboring Brazil and Argentina), it is hard to see how IOCs will have confidence to invest further to develop Bolivia’s major gas resources.
Preliminary Report on Fiscal Designs for the Development of Alaska Natural Gas David Wood November 2008 24

Brazil The ratification of Brazil’s new hydrocarbons law on 6 August 1997 signaled the beginning of a new era in the exploitation of Brazil’s oil and gas reserves. Previously, the national oil company, Petrobras, had held a monopoly on all aspects of oil activity in the country. The new law effectively transferred control of the regulation of oil rights to the National Petroleum Agency (ANP). The main result of this action was to open the country’s oil sector to foreign and domestic competition. Oil and gas balance: Brazil was in 1997 a net importer of oil: it produced 0.9 million bopd and consumed 2.0 million bopd. It sought an aggressive expansion of offshore production capacity. Petrobras’s budget was US $2.5 billion to $3 billion per year. The expanded investment market from licensing increased investment to some US$30 billion from 1999 to 2002. In 2007 Brazil consumed 2.1 million bopd and produced 1.8 million bopd, and is expecting to become an exporter over the next decade following multi‐billion barrel deepwater oil field discoveries in the Santos Basin in 2007 (e.g. Tupi). Natural gas production has increased from 0.6 bcf/day in 1997 to 1.1 bcf/day in 2007, whereas natural gas consumption has increased from 0.6 bcf/day in 1997 to 2.1 bcf/day in 2007. It has a much more difficult task to become a natural gas exporter, but could also achieve this. In 2007 Brazil was the 10th largest energy consumer in the world. Licensing rounds: ANP initiated the first round of bidding for exploration acreage in 1999. Signature bonuses totaled R321m (US$189 million) and represented a significant new source of revenue to the government. Petrobras won 5 of the 12 blocks and has managed to hold onto the most prospective acreage. Partial privatization of Petrobras: In August 2000, the government sold a 28.5% stake in Petrobras, but remained the majority shareholder. The offering generated over $4 billion, and over half of the shares were sold to foreign investors. The revenue was to be used to finance the company's debt and to invest in exploration. Since 2001 the government’s holding in Petrobras has remained at 40%. Fiscal regime has a mineral‐interest structure: A new tax regime introduced in 1998 by ANP in advance of the first licensing round in 1999 consists of four main components: a signature bonus; royalty payments; a special participation tax; and state and federal taxes. Land rentals range from R50to R300/km2/year. They are doubled in the 2nd & 3rd exploration periods and are paid in local currency and adjusted annually by an inflation index.
Preliminary Report on Fiscal Designs for the Development of Alaska Natural Gas David Wood November 2008 25

Royalties on oil and gas production are paid monthly for each field at a rate of 10%. ANP at one stage considered reducing the rate to a minimum of 5% to enable commerciality of marginal fields. An additional royalty of 1% of the value of production is paid to the surface owner where the production is onshore. Special participation tax (SPT) is applied only to large production volumes or great profitability and rises in tranches to a maximum marginal rate of 40%. The special participation tax has potential to be the most significant component in the calculation and, as this is based on production rate, field size could significantly increase the amount of tax paid. The upper rate of 40% exceeds the rate of all other fiscal elements. The tax depends on production rate and location and is on a sliding scale to make it progressive. It really becomes significant for a very large field. For a field producing 100 kbopd in 500m of water depth the effective average SPT rate is some 11.5%. Revisions to SPT rates expected: In June 2008, the director of ANP said the increase of oil prices together with the recent discovery of large offshore oil reserves has made revision of SPT on oil production an urgent requirement and suggested that it be rushed through by presidential decree rather than by conventionally slow legislative reform. He pointed out that companies producing less than 2.8 million barrels quarterly are exempt from the tax. It was suggested that existing legislation, introduced in 1998, has become obsolete with a surge in oil prices to over $130 per barrel and the recent discovery of a vast deep‐water oil reserve known as Tupi off the country's southeastern coast. Petrobras President agreed that tax rules for the sector should be revised but said the changes should be made by Congress.
Preliminary Report on Fiscal Designs for the Development of Alaska Natural Gas David Wood November 2008 2
6

Multiple local and corporate taxes that apply to petroleum production amount to a rate of some 29% in total. These taxes include:
• Sales tax (ICMS) varies between 7% and 25%.
• Service tax (ISS) is 5% on gross revenue from services.
• Corporate income tax (CIT) is 15% of net taxable income after net operating charges.
• Surtax (AIR) is 10% on net taxable income exceeding R240,000.
• Social contribution tax on profits (SCT) is 8% of book profits.
• Other taxes include tax on financial transactions (IOF), banking tax (CPMF), excise tax (IPI), import tax (II), a social contribution tax (COFINS) and the social integration program (PIS) tax.
Deductions and depreciation: Depreciation is normally on a straight‐line basis over the useful life of the asset. Standard annual rates apply to different classes of asset. For example: buildings 4%; machinery and equipment 10%; vehicles 20%. Oil and& gas valuation: Crude oil value is calculated monthly on a field‐by‐field basis based on reference prices, which may either be equal to the crude weighted average of the sale prices, at fair market price, or equal to the minimum price established by ANP, whichever is greater. The Preliminary Report on Fiscal Designs for the Development of Alaska Natural Gas David Wood November 2008 27

minimum prices set by ANP are derived from a monthly average value of Brent, plus the differential between the gross value of Brent petroleum products derived from Brent blend and the gross value of petroleum products derived from domestic crude, expressed in US$ per barrel. The price of natural gas is established by ANP in the absence of sale agreements for the natural gas produced in the concession area, or when the sale prices and shipment tariffs presented do not reflect normal domestic market conditions. Ring‐fence: There is a ring‐fence around the country for most taxes but around each field for special participation fee purposes. Withholding tax: Abolished effective 1 January 1996. Import duties: Based on ad valorem CIF value of imported goods at the average rate of 15%, the maximum rate being 85%. Port charges of 3% and warehouse charges of 2% are payable on the CIF value. Tax incentives and VAT exemption: In 1999, the Brazilian federal government implemented tax benefits, called REPETRO, to stimulate investment in upstream activities and improve the domestic energy industry. These provisions reduced the operating costs of oil and gas E&P during the initial exploration phase by suspending federal taxes, such as the import duty and excise tax on the importation of goods and equipment for the term of the concession contract so long as the equipment returned to its country of origin at the end of the concession period. REPETRO expired in December 2007. Following the federal policy as set forth in REPETRO regulations, the National Council of Fiscal Policy (CONFAZ), through Agreement #58/99, authorized the states to exempt the equipment imported through REPETRO from the state value‐added tax (VAT or ICMS). VAT on equipment is payable in some regions. RJ State Law No. 3.851/2002 provided that, from June 30, 2003, the RJ state tax authorities will impose VAT (currently at the rate of 19%) on all operations of direct importation and interstate transfers carried through ports outside RJ, of goods and equipments destined for the oil and gas industry imported under REPETRO rule. This state law is contrary to the CONFAZ agreement and Brazilian Complementary Law No. 24/75, which regulates states’ agreements about fiscal incentives.
Preliminary Report on Fiscal Designs for the Development of Alaska Natural Gas David Wood November 2008 28

Giant discoveries change government’s fiscal strategy: In November 2007, shortly following the giant field discoveries, the government pulled 41 blocks from near the Tupi from bidding in its annual oil auction. According to some estimates, the area could contain up to 8 billion barrels of oil equivalent. Petrobras recently said it would begin long‐term production tests in Tupi starting in 2009. It is now clear that fiscal terms will be tightened for IOCs (and probably Petrobras) in the near future. Deepwater challenges: Petrobras has a strong reputation of technical innovation, particularly in deepwater field developments. However, developments in the past decade have not all gone smoothly. On March 20, 2001, Petrobras's giant P‐36 offshore oil platform in the Campos Basin sank with the loss of 11 lives after suffering three explosions in one of its supporting pillars. The rig had a production capacity of 180,000 bbl/d and was producing about 83,000 bbl/d from the Roncador field at the time of the accident. A permanent replacement has only recently become operational. This incident highlights the risks and challenges faced by operators and governments in difficult deepwater environments. IOC field developments: Shell’s Bijupira‐Salema project in the Campos Basin was the first field in Brazil not operated by Petrobras. The project came on‐stream in 2003 and produces about 50,000 bbl/day. Shell also hopes to begin production at its BC‐10 project (100,000 bbl/d) by the end of 2009. Devon brought its Polvo project (50,000 bbl/d) online in August 2007, representing the only upstream oil project without any Petrobras participation. Chevron is developing the Frade project (100,000 bbl/d), with first production expected in early 2009. Norsk Hydro plans to begin production at its Peregrine (formerly Chinook) field (100,000 bbl/d) in 2010. However, despite these potential new projects, Petrobras will remain the dominant oil producer in Brazil for the foreseeable future. BG and GALP (Portugal) are partners with Petrobras in the Tupi discovery. Natural gas lagging behind oil: Brazil had 12.9 tcf of proven natural gas reserves in 2007. The Campos and Santos Basins hold the majority of reserves. Natural gas production has grown slowly in recent years mainly due to a lack of domestic transportation capacity and low domestic prices. In 2007, Brazil produced 368 bcf of natural gas. In the future, Brazil hopes to increase development of natural gas production through an expansion of the domestic natural gas transport network, end flaring at oil‐producing facilities, and increase development of existing reserves. Natural gas consumption is a small part of the country’s overall energy mix, constituting only 8.5% of total energy consumption in 2007. However, natural gas demand is rising. High oil prices have helped spur natural gas demand in Brazil: natural gas is mostly used as a substitute
Preliminary Report on Fiscal Designs for the Development of Alaska Natural Gas David Wood November 2008 29

for fuel oil in industrial and power‐generating applications, and domestic prices for natural gas are much lower than international fuel oil prices. Further, the introduction of natural gas imports has led to a rapid growth in domestic consumption. Domestic supply obligation: None.
Preliminary Report on Fiscal Designs for the Development of Alaska Natural Gas David Wood November 2008 30

Canada Canada has vast natural gas resources and has been exploiting them successfully and exporting them to the Lower 48 states for several decades. These resources represent a major source of competition to Alaska gas and a substantial portion of them are located strategically between Alaska and the Lower 48 states. Canadian Sedimentary Basins – Conventional Natural Gas (tcf) Source: EUB/NEB 2005‐A Report
Preliminary Report on Fiscal Designs for the Development of Alaska Natural Gas David Wood November 2008 31
Finding and Development Costs for Natural Gas in the Western Canada Sedimentary Basin (WCSB) – CDN $/mcf. Costs have been rising steeply in recent years, but are probably more competitive than in Alaska natural gas basins due to higher activity levels. (Source Canadian Association of Petroleum Producers, March 2005). Ziff (Oil & Gas Journal, March 2008) estimated that the full‐cycle cost of new gas supplies in Alberta increased to $4.70/Mcf (Can.) in 2006 from $1.50/Mcf in 1995. Of the 1995 estimate, $0.85/Mcf represents finding and development costs, including drilling, seismic work, land, and facilities; $0.40/Mcf reflects operating costs; and $0.25/Mcf is administrative cost. The 2006 costs breakout is as follows: $3.05/Mcf finding and development, $1.30 operating, and $0.35 administrative. Royalty is the key fiscal element imposed in Canada. However, royalty mechanisms vary significantly from province to province and generally involve quite complex calculations but achieve highly flexible and progressive fiscal systems. Canada – Alberta Fiscal Tightening Oct 2007 In October 2007 the Alberta government announced changes in fiscal terms that will impact the entire oil and gas sector referred to as a New Royalty Framework, rejecting a special tax on oil sands recommended by a review panel but lifting royalty rates across all sectors of the upstream oil and gas industry. For natural gas, the framework raises the maximum royalty to 50% from 35% and eliminates tiers (tiers in conventional natural gas distinguish vintages based on the discovery date) to simplify the system, starting in 2009. Royalty rates, prior to October 2007, ranged from 5% to 35%, while under the new framework they will range from 5% to 50%, with rate caps at Cdn $16.59/gigajoule (up from Cdn $3.7/GJ). It retains and will revamp exemptions and incentives for special production categories such as deep formations and marginal wells. Royalties for natural gas liquids will now be set at 40% for pentanes, a change from
22%‐50% for old tiers and 22%‐35% for new. The new royalties for butanes and propane will be 30%, up
from 15%‐30%.On the incentive side, lower royalty rates now apply over a wide price range for wells with limited productivity. A program that eliminates royalty on gas that would be flared without the incentive is also retained in the new framework. The new framework was forecast by the Alberta government to increase royalty receipts by $1.4 billion in 2010, 20% above the level projected for fiscal regime prior to October 2007 but $500 million less than the increase estimated for the September 2007 recommendations of the Royalty Review Panel (Oil & Gas Journal, October 2007). However, a slowdown in activity
Preliminary Report on Fiscal Designs for the Development of Alaska Natural Gas David Wood November 2008 32
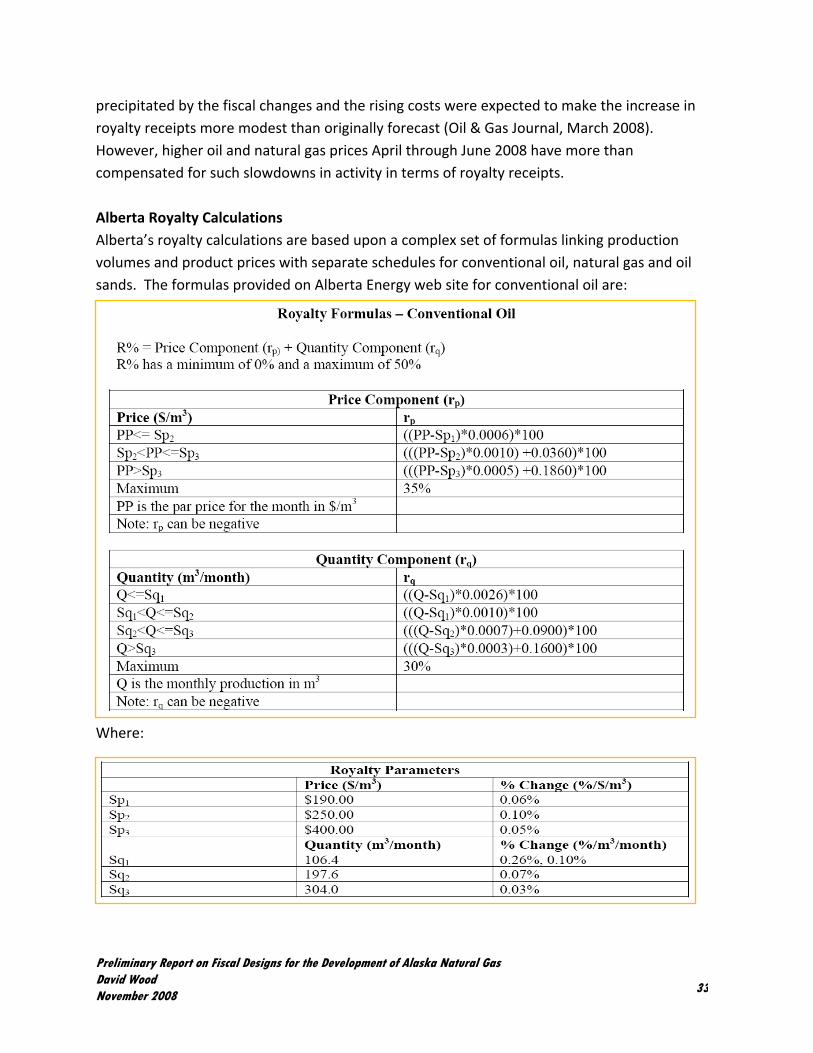
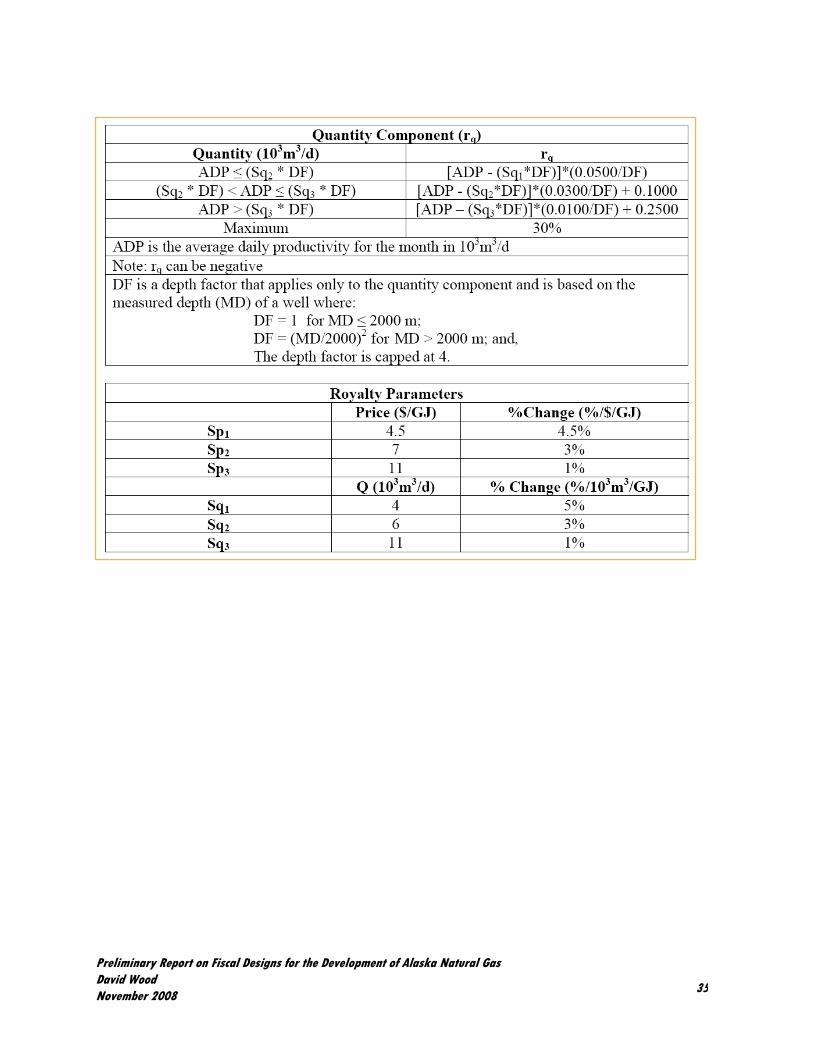
precipitated by the fiscal changes and the rising costs were expected to make the increase in royalty receipts more modest than originally forecast (Oil & Gas Journal, March 2008). However, higher oil and natural gas prices April through June 2008 have more than compensated for such slowdowns in activity in terms of royalty receipts. Alberta Royalty Calculations Alberta’s royalty calculations are based upon a complex set of formulas linking production volumes and product prices with separate schedules for conventional oil, natural gas and oil sands. The formulas provided on Alberta Energy web site for conventional oil are: Where:
Preliminary Report on Fiscal Designs for the Development of Alaska Natural Gas David Wood November 2008 33
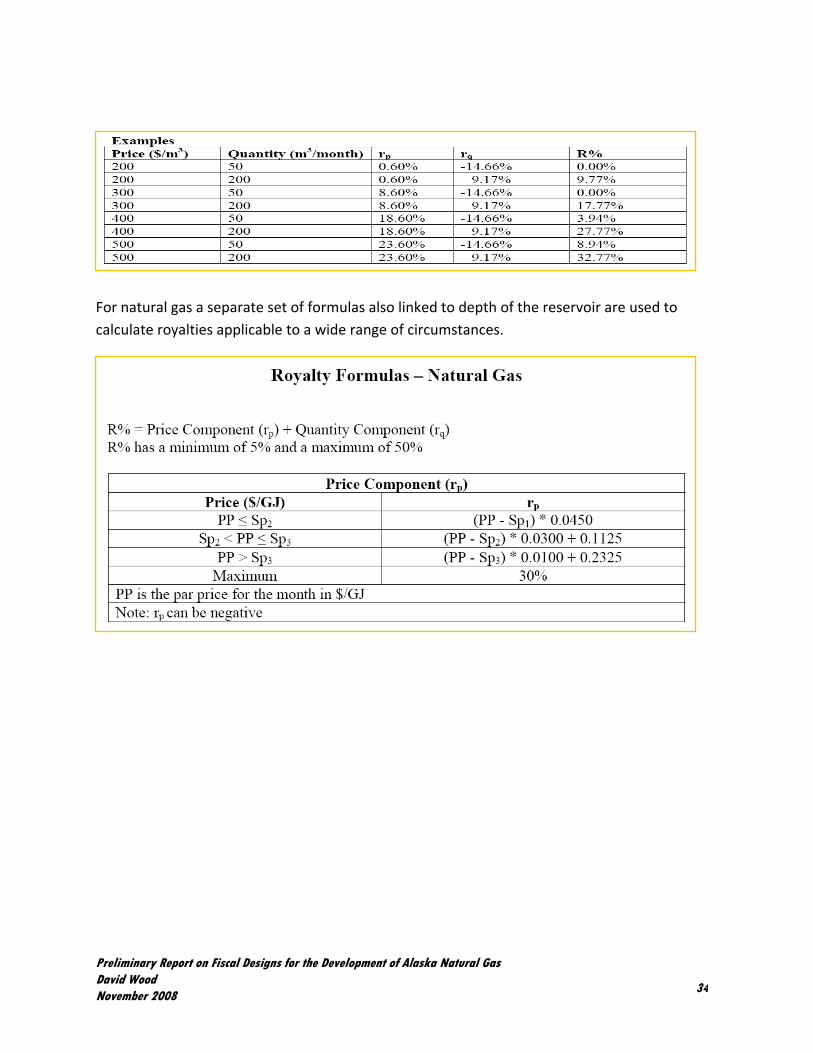
For natural gas a separate set of formulas also linked to depth of the reservoir are used to calculate royalties applicable to a wide range of circumstances.
Preliminary Report on Fiscal Designs for the Development of Alaska Natural Gas David Wood November 2008 34
Preliminary Report on Fiscal Designs for the Development of Alaska Natural Gas David Wood November 2008 35

A depth adjustment factor is also applied as shown in the table below. Programs Eliciting Fiscal Incentives Alberta operates a series of programs to provide fiscal incentives to improve industry performance. For example (from Alberta’s Royalty Information Briefing #7, October 2007): Enhanced Recovery of Oil Royalty Reduction (EOR) Purpose: Production from an oil well will generally fall under three broad categories. The first is primary production, which generally involves drilling a well and the oil will then flow with the assistance of a pump. Secondary production is generally water‐flood production. Water is pumped into the reservoir to increase production. Tertiary production (enhanced oil recovery)
Preliminary Report on Fiscal Designs for the Development of Alaska Natural Gas David Wood November 2008 36

is a project that uses a substance other than water as an injectant to increase production and is the type of production targeted by this program. Examples of injectants are hydrocarbons,
carbon dioxide (CO2), nitrogen or chemicals. Production costs increase from primary to
secondary to tertiary recovery. Benefits: The Crown shares in the cost of oil recovery through a reduction in oil royalties on tertiary production. There is no specified end date to such relief, although the program is reviewed periodically. CO2 Projects Royalty Credit
Purpose: This program includes four pilot projects that use CO2 as an injectant for enhanced oil
recovery. The purpose of this program was to promote the use of CO2 as an injectant to allow
more to be known about how this EOR method will work in Alberta. The technology is fairly new and has a great deal of potential. Pilot projects are essential for learning and developing this technology. This program was capped at $15 million and is fully subscribed. No new projects are eligible for this program. Benefits: Benefits of this program are similar to the EOR program in that the Crown shares in the cost of the tertiary production. End Date: One‐time program. No new projects are eligible. Sliding scale Royalty Credit ‐ Natural Gas Deep Drilling Program In order to encourage deeper natural gas exploration and development, the Natural Gas Deep Drilling Program will have an escalating royalty credit in line with gradually deeper wells, with additional benefits for the deepest wells. The minimum credit is $625 per meter and the maximum credit is $3,750 per meter. The additional benefit for the deepest wells is $1,625,000 and is for wells greater than 4,000 meters in depth.
Preliminary Report on Fiscal Designs for the Development of Alaska Natural Gas David Wood November 2008 37

Wells that begin drilling on or after April 10, 2008 will be eligible for benefits in this program if they meet the other qualifying criteria. The benefits under this program cannot be claimed until January 1, 2009 when the new royalty formulas become effective. Additional benefits are applied to wells drilled deeper than 4,000 meters to recognize the additional costs of drilling these wells and to encourage the drilling of these ultra‐deep wells. Federal and Provincial (Territorial) Corporate Income Tax (CIT) Rates In 2006, the general rate of federal tax was 22.12%, comprising a basic rate of 21% and a surtax of 1.12%. The federal government announced in Bill C‐13 the intention to eliminate the surtax as of January 1, 2008 and to further reduce the general rate from 21% to 19% by January 1, 2010. Provincial rates vary between 10 % in Alberta and up to 17 % elsewhere, so combined federal/provincial tax rates on corporate income for 2006 ranged from 32.12% to 39.12%. Note: The provincial (state) tax is not deductible against the federal tax. In the United States, state CIT is deductible from federal CIT.
CIT is the main fiscal instrument applied to midstream infrastructure and is also applied to upstream income streams. Royalties are in most cases now deductible for CIT purposes. Canada ‐ NW Territories (NWT) The fiscal terms of Canada’s NW Territories were described by Van Meurs (December 2006) in Appendix S to his Alaska Report “Gas International Comparison.”
Preliminary Report on Fiscal Designs for the Development of Alaska Natural Gas David Wood November 2008 38

The NWT has a profit‐sharing royalty which is 30% of the profits, measured on a cash‐flow basis, over an internal rate of return of 10% over the long‐term bond rate. This profit‐sharing royalty is compared with a basic royalty which starts at 1% and increases over time to 5% from the start of production, with an increase of 1% every 18 months. The applicable royalty is the higher of the two values. Canada ‐ Newfoundland & Nova Scotia These provinces also apply complex, but progressive, fiscal designs incorporating royalty components linked to rates of return (ROR). In a 2001 article Rodgers (Oil & Gas Journal, 30 April 2001) described in outline the fiscal systems as follows: Canada, Nova Scotia: Income tax 45.12%; sliding scale royalty 2%, and 5% after a simple ROR of 13%. Resource rent royalty 20%‐35% after simple RORs of 28% and 53%. Newfoundland & Labrador: Income tax 43.12%; sliding scale royalty 1%‐7.5%, based on production. Resource rent royalty 20‐30% after compound RORs of 13% and 23%. The income tax rates have subsequently been reduced to <40%, but the sliding scale royalties driven by rates of return make these fiscal designs highly progressive and workable from both province and company perspectives over a wide range of field sizes, production rates and market conditions. Hibernia Field Royalty Regime (Newfoundland) The Petroleum Projects Monitoring Division of Newfoundland’s Department of Natural Resources has published details (www.nr.gov.nl.ca) of the royalty regime that is applied to the large offshore producing Hibernia Field. Discovered in 1979, the Hibernia Field is located about 315 kilometres east southeast of St. John’s in 80 meters of water. The field is located within the Jeanne d’Arc Basin and, according to the Canada‐ Newfoundland Offshore Petroleum Board, contains an estimated 884 million barrels of recoverable reserves. The royalty calculation involves two components: (1) basic royalty and (2) net royalty.
Preliminary Report on Fiscal Designs for the Development of Alaska Natural Gas David Wood November 2008 39
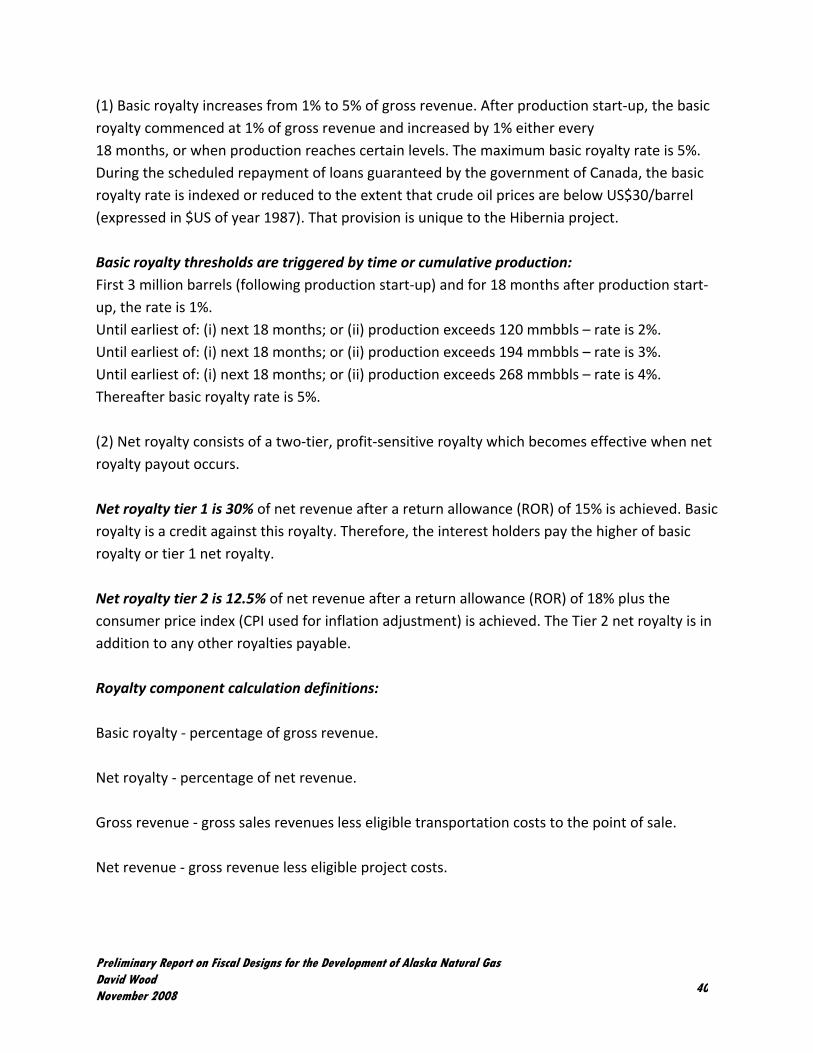
(1) Basic royalty increases from 1% to 5% of gross revenue. After production start‐up, the basic royalty commenced at 1% of gross revenue and increased by 1% either every 18 months, or when production reaches certain levels. The maximum basic royalty rate is 5%. During the scheduled repayment of loans guaranteed by the government of Canada, the basic royalty rate is indexed or reduced to the extent that crude oil prices are below US$30/barrel (expressed in $US of year 1987). That provision is unique to the Hibernia project. Basic royalty thresholds are triggered by time or cumulative production: First 3 million barrels (following production start‐up) and for 18 months after production start‐up, the rate is 1%. Until earliest of: (i) next 18 months; or (ii) production exceeds 120 mmbbls – rate is 2%. Until earliest of: (i) next 18 months; or (ii) production exceeds 194 mmbbls – rate is 3%. Until earliest of: (i) next 18 months; or (ii) production exceeds 268 mmbbls – rate is 4%. Thereafter basic royalty rate is 5%. (2) Net royalty consists of a two‐tier, profit‐sensitive royalty which becomes effective when net royalty payout occurs. Net royalty tier 1 is 30% of net revenue after a return allowance (ROR) of 15% is achieved. Basic royalty is a credit against this royalty. Therefore, the interest holders pay the higher of basic royalty or tier 1 net royalty. Net royalty tier 2 is 12.5% of net revenue after a return allowance (ROR) of 18% plus the consumer price index (CPI used for inflation adjustment) is achieved. The Tier 2 net royalty is in addition to any other royalties payable. Royalty component calculation definitions: Basic royalty ‐ percentage of gross revenue. Net royalty ‐ percentage of net revenue. Gross revenue ‐ gross sales revenues less eligible transportation costs to the point of sale. Net revenue ‐ gross revenue less eligible project costs.
Preliminary Report on Fiscal Designs for the Development of Alaska Natural Gas David Wood November 2008 40

Net royalty payout ‐ point in time when the costs related to a particular project are recovered plus a specified return allowance on those costs. The net royalty payout is divided into two tiers, with each tier having a different return allowance. Return allowance ‐ rate of return on unrecovered costs.
Preliminary Report on Fiscal Designs for the Development of Alaska Natural Gas David Wood November 2008 41
Egypt First oil production was achieved in Egypt in 1910. Production was then dominated by Anglo‐Egyptian fields (50‐ 50 joint venture between BP and Shell). In 1964 IOCs’ assets were nationalized, but IOCs maintained foreign presence through a series of joint ventures. In 1973 Egypt abandoned the joint venture with IOCs in favor of contractual arrangements based on moderately regressive production‐sharing agreements (PSAs). Egyptian General Petroleum Corporation (EGPC) is the government vehicle and NOC overseeing the industry. Egyptian Natural Gas Holding Company (EGAS) is the government body responsible for natural gas licensing. Oil production peaked in 1993, but domestic oil consumption has continued to rise significantly. Since the early 1990s the government has placed much greater emphasis on gas exploration and production. Some 200 wells were drilled each year between 2000 and 2006 and significant oil and gas discoveries continue to be made. There are more than 50 IOCs operating in Egypt, investing more than US$2 billion/year. From 2000 to 2005, agreements with IOCs brought in an excess of $6.8 billion and saved the local economy from recent price swings in the petroleum market. Since 2004 natural gas has been exported to Europe and the United States as LNG, and Egypt has become the world’s sixth‐largest producer of natural gas. New discoveries in that period numbered 227 in all — 153 crude‐oil discoveries and 74 natural gas. These new discoveries increased reserves by an estimated 8 billion barrels of crude oil, a figure equivalent to approximately 78% of total proven reserves, as well as about 82% of the total natural gas reserves. The government and its selected fiscal design have played a key role by creating a climate that is conducive to investment and long‐term development. Concessions are only awarded to EGPC. IOCs participate in PSAs the terms of which are negotiable, but indicative terms are: Corporate structure: EGPC and foreign contractor form a joint stock operating company. This is a feature of several North African fiscal designs and ensures local control and substantial employment of local staff (professional, technical and administrative). A full suite of bonuses are payable by IOC: signature bonuses, development bonuses, production bonuses, contract extension bonuses. Signature, discovery and production bonuses are usually in the range US$1 million to US$10 million. Production bonuses are often set at five daily thresholds e.g. 5,000, 10,000, 25,000, 50,000 and 100,000 boe/day.
Preliminary Report on Fiscal Designs for the Development of Alaska Natural Gas David Wood November 2008 42

Rental fees are paid by the operating company. Royalties: 10% of well‐head output are paid by the EGPC. Income tax: Paid on behalf of IOC by EGPC. Cost oil: The cost oil allocation is negotiable – 40% for oil and 50% for gas are not unusual. Exploration & development costs amortized over a minimum of 5 years; operation costs totally amortizable. This slow recovery of capital investments is an issue in high‐cost offshore field developments in times of low prices. Profit oil: This is on a sliding scale rising to a government share of 80%‐85% for output over 50,000 barrels/day and 500 million cubic feet per day in six or so tranches beginning at <25 mmcf/day (Negotiable). Fiscal Stability: Guaranteed for all terms in contract. Contract period: 20 years from the date of commercial discovery with a 5‐year extension subject to EGAS approval and a competitive bonus payment. Assignment bonus: Not less than 10% of the value of the deed of assignment. EGAS has pre‐emption rights. Egyptian Natural Gas Holding Company (EGAS): Due to the importance of natural gas EGAS was set up in 2001. Gas terms and domestic market obligations: Cost recovery and profit gas for Egypt’s domestic gas market is valued in accordance to a gas price formula, with floor and ceiling prices, indexed to Brent crude oil prices. The formula, where B = price of Brent crude oil (US$/barrel) and G = gas price (US$/mmbtu) is: G = 1.5 $/mmbtu when B ≤10 G = linear equation will be applied when 10 < B < 22 G = 2.65 $/mmbtu when B ≥ $22/barrel This formula provides a floor price for gas, but real value lies in gas exports through LNG facilities.
Preliminary Report on Fiscal Designs for the Development of Alaska Natural Gas David Wood November 2008 43
In cases where gas is exported by EGAS and contractor, the price of the cost‐recovery volumes is based on the domestic gas price and profit‐share gas is valued at the netback price. Take‐or‐pay and shortfall/non‐delivery commitments are applied. Priority is given to the domestic market, and EGAS has the right to buy IOC’s share of crude oil and the gas allocated for domestic market according to the domestic market gas price. EGAS has the right to dispose such gas as it wishes. Domestic gas demand has grown rapidly in Egypt as power plants, which account for about 65% of Egypt's total gas consumption, have switched from oil to gas.
Preliminary Report on Fiscal Designs for the Development of Alaska Natural Gas David Wood November 2008 44

Indonesia PSC administering agency: All minerals, oil and gas existing within the statutory mining territory of Indonesia are controlled by the state. The government holds exclusive authority to mine. The government established the Executive Agency for Upstream Oil & Gas Business Activities (Badan Pelaksana ‐BPMIGAS), and business entities conduct oil and gas business based on cooperation contracts with BPMIGAS, mostly in the form of production‐sharing contracts (PSCs). Prior to 2002 this was conducted through the NOC Pertamina. The PSC contracting parties are IOCs and BPMIGAS. The PSC indemnifies the government from any liability arising from oil and gas activities conducted under its provisions. Indonesia was the first country to apply PSCs in 1966. Following promulgation of Indonesia's revised oil law the model PSC of Indonesia was revised in 2003. PSC term: This is 30 years to conduct exploration, development and production activities; extendable up to 20 more years. Special durations can be negotiated for gas. Relinquishments: The exploration period is the first 6 years of a contract term, and that period is extendable up to 4 more years. Typically, after every 2 or 3 years of exploratory activities, a portion of contract area has to be surrendered, leaving a sufficient size and shape to conduct petroleum operations in relinquished areas. Contracts are surrendered if no discovery during exploration. Recent contracts involve 25% relinquishment at the end of three years, plus 15% relinquishment if work programs are not accomplished. IOCs retain 20% after sixth year. Work commitments are specified for each exploration period: Normally PSCs include commitments to work programs or expenditures to be spent for the succeeding years. Ring‐fencing applied: Each business entity or joint venture of IOCs operates only one contract area; when an oil company holds ownership of several contract areas, a separate legal entity has to be established for each contract area. No tax consolidation is allowed among all PSCs held by one IOC, although in the case of adjacent PSC areas with fields straddling the boundaries unitization solutions may have to be applied to enable field development on a commercial basis. Production‐sharing methodology: The PSC sharing mechanism is applied annually based on the Gregorian calendar year. This means that the prices used are the weighted average prices of all crudes oils and gas produced and sold from the contract area; production for the period is the petroleum sold (lifted) during the calendar year; cost recoverable items and costs are those
Preliminary Report on Fiscal Designs for the Development of Alaska Natural Gas David Wood November 2008 45

incurred during the calendar year. Oil and gas sharing is calculated separately, due to the different contractually defined splits and investment credit rates for oil and gas. There are nine key fiscal elements:
• First‐tranche petroleum
• Tax structure
• Sharing split
• Investment credit
• Cost recovery
• Domestic market obligation
• Capital and non‐capital expenditures
• Indonesian equity participation
• Bonuses First‐tranche petroleum (FTP): The parties are entitled to take and receive each year a percentage (e.g. standard is 20%) of all petroleum produced and saved before any deduction for the recovery of investment credit and operating costs. The FTP is 15% in Eastern Frontier for gas (e.g. BP’s Tangguh LNG project due onstream in 2009). FTP is shared between BPMIGAS and IOCs in accordance with the PSC splits. FTP differs from royalty in that: 1) it is shared between the parties; 2) FTP has no impact on fiscal take when financial operation runs normally; 3) FTP is designed to ensure the minimum income for the state. However, for some more recent PSCs, the whole FTP goes to BPMIGAS, but then it is usually 10%. If FTP is 20% it behaves like an 80% cost‐recovery allocation limit, so from a cost‐recovery perspective it is better for contractor to have it specified as 10% to BPMIGAS (effectively as a royalty). Sharing splits: The splits quoted in the PSCs include an income tax component (i.e. splits are after tax). The splits are applicable to FTP, equity to be split and domestic market obligation (DMO). In practice IOC pays the income tax component to the government, so it is important to know what rate is involved in the sharing split. IOCs are exempt from other taxes and levies. This mechanism introduces fiscal stability into the contracts. Tax rates have changed over time and these impact the before tax IOC splits.
Preliminary Report on Fiscal Designs for the Development of Alaska Natural Gas David Wood November 2008 46

Gas incentives: Recent PSCs signed in Indonesia have involved an 80/20 split for oil and a 70/30 split for gas (which has been effective since the 1980s) after a 44% income tax paid by the IOC. In the Tangguh East Indonesian PSC (early 1990s), the 15% FTP acts as an 85% cost‐recovery limit, and when divided according to the 70/30 profit split acts as a 4.5% (after tax) royalty to the Indonesian government. Taking into account this “royalty”, the domestic market obligation and equity participation terms provide the government with more than an 80% take of profits (not the 70/30 split that is implied from the profit splits specified in the PSCs). Investment credit: IOC can recover an investment credit amounting to 17% of the capital investment costs directly required for developing crude oil production facilities of each new field as a deduction from gross production before recovering operating costs, commencing in the earliest production year or years before tax deduction (to be paid in advance in such production year when taken).
Preliminary Report on Fiscal Designs for the Development of Alaska Natural Gas David Wood November 2008 47

The investment credit may be applied to new secondary recovery and tertiary recovery EOR projects but is not applicable to interim production schemes or further investment to enhance production and reservoir drainage in excess of what was contemplated in the original project as approved by BPMIGAS. Indonesian crude price (ICP): This is a posted price for quoted crudes (i.e. SLC, Senipah, Widuri, Cinta, Arjuna, Attaka, Duri) using an ICP Formula (20% APPI + 40% Platt’s + 40% RIM) for establishing prices. In the case of unquoted crudes, these are indexed via a discount or premium to a quoted crude (e.g. Bula price is Duri price less $0.50/barrel). Gas prices are contract specific: Unlike oil, it is usual for a gas field to be developed only once a sales contract has been agreed and often after external financing is arranged. This usually involves a long‐term sales contract (more than 10 years) with an LNG price formula usually indexed to crude oil export prices. Allowable expenditures for cost recovery:
1. Exploration & development: Seismic, geological and geophysical studies, drilling, administration.
2. Production: Oil well operations, secondary‐recovery operations, storage, handling, delivery, supervision, maintenance, electricity services, transportation, administration.
3. Administration: Finance and administration, safety & security, transportation, training, accommodations, personal expenses, public relations, office rents; general office expenses.
For any year in which commercial production occurs, recoverable costs consist of: (a) Current year non‐capital costs. (b) Current year’s depreciation for capital costs. (c) Current year’s allowed recovery of prior year’s unrecovered allowable costs. Cost recovery is deducted from gross revenue and is one element of the contractor’s revenue. Oil & gas costs are recovered separately. But if after commencement of production natural gas revenues do not permit full recovery of natural gas costs, those can be recovered from oil revenues or vice versa. Verifying costs that are recoverable involves a bureaucratic process which BPMIGAS in June 2008 vowed to simplify. In BPMIGAS’ latest report, the government paid some $8.33 billion to oil and gas producers in 2007 for recovery costs, up 6.4% over the $7.8 billion paid in 2006. In 2005, it said, the government received $19.9 billion net take from the oil and gas sector after
Preliminary Report on Fiscal Designs for the Development of Alaska Natural Gas David Wood November 2008 48

paying out $7.68 billion in refunds. Indonesia’s Supreme Audit Agency (BPK), as part of its latest 2005 account audits of nine oil and gas blocks (of a total 80), unveiled some $525 million in questionable claims for government refunds under the cost‐recovery schemes. Citing BPK, a local Indonesian newspaper said the questionable claims were associated with refunds filed by the IOCs Total, ExxonMobil, Chevron, ConocoPhillips, and CNOOC (China’s NOC). Depreciation is declining balance based on specific items: There are slight differences for oil and gas.
• Group 1 items (e.g. cars) are depreciated over 1.5 to 2 years, with a depreciation factor of 50%.
• Group 2 items (e.g. construction equipment) are depreciated over 3 to 5 years, with a depreciation factor of 25% (drilling and production tools 5 years for oil, but 4 years for gas).
• Group 3 (e.g. production facilities) are depreciated over 5 years (4 for gas), with a depreciation factor of 25%.
Domestic market obligation: After commercial production commences, IOC agrees to sell and deliver a portion of the share of crude oil and natural gas to which it is entitled – typically 25% in recent contracts. DMO fees vary by when a contract was issued and the prospectivity of the area. In some it is a per barrel fee of US$0.20/barrel; in others it is a percentage of the sales price (e.g. 10%, 15% or 25% of the price, as stated in the contract). The effective formula for calculating DMO if the contract percentage is 25% is: 25% x sharing split x production x DMO contract‐specific price When a portion of operating costs remains unrecovered, contractor is relieved from the DMO obligation. A typical arrangement in 2003 PSCs is 25% contractor's production to go to domestic market at 15% of the market price for oil. For gas the DMO price is the average of Indonesian market value. Indonesian equity participation: Minimum equity participation by Indonesian companies in post‐2003 PSCs is 10%. Offered first to local companies and then to Pertamina on a heads‐up basis. Bonuses: These are negotiable with signature bonuses in excess of $1 million typical, plus production bonuses increasing in magnitude around $1 million as thresholds of cumulative
Preliminary Report on Fiscal Designs for the Development of Alaska Natural Gas David Wood November 2008 49

production are achieved (e.g. 25, 50 and 75 million boe). These bonuses are borne solely by the IOC and are not included as operating costs for cost‐recovery purposes.
Preliminary Report on Fiscal Designs for the Development of Alaska Natural Gas David Wood November 2008 50
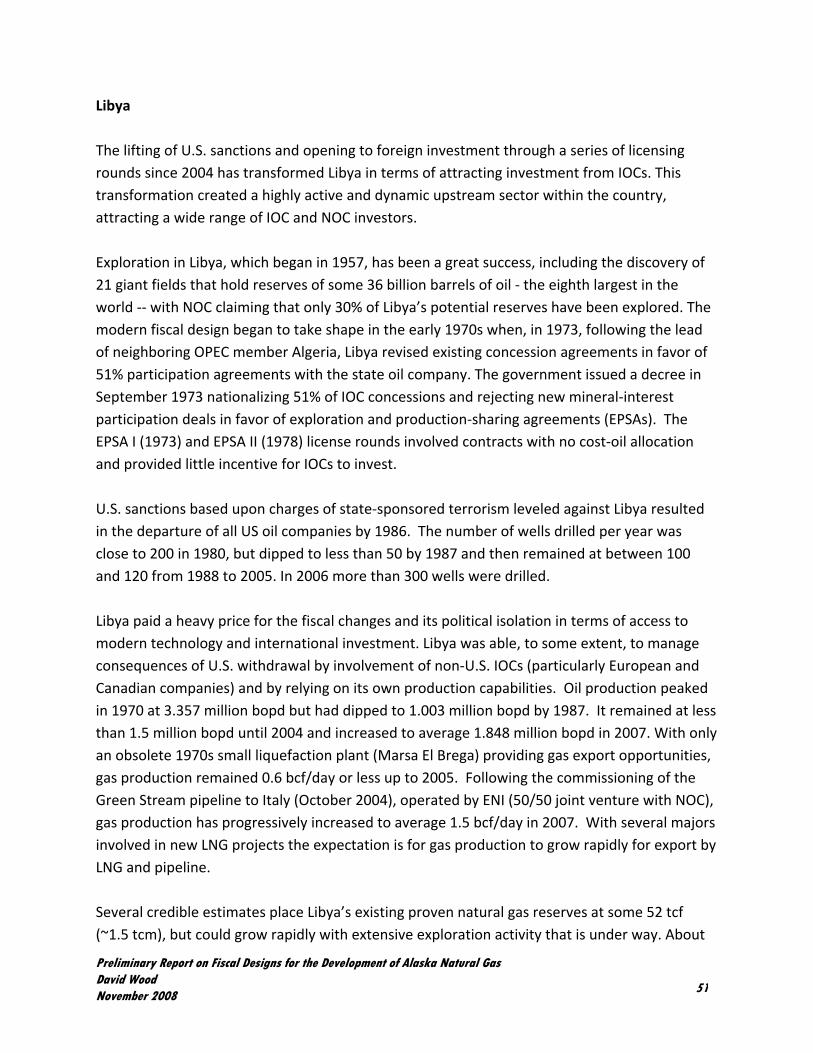
Libya The lifting of U.S. sanctions and opening to foreign investment through a series of licensing rounds since 2004 has transformed Libya in terms of attracting investment from IOCs. This transformation created a highly active and dynamic upstream sector within the country, attracting a wide range of IOC and NOC investors. Exploration in Libya, which began in 1957, has been a great success, including the discovery of 21 giant fields that hold reserves of some 36 billion barrels of oil ‐ the eighth largest in the world ‐‐ with NOC claiming that only 30% of Libya’s potential reserves have been explored. The modern fiscal design began to take shape in the early 1970s when, in 1973, following the lead of neighboring OPEC member Algeria, Libya revised existing concession agreements in favor of 51% participation agreements with the state oil company. The government issued a decree in September 1973 nationalizing 51% of IOC concessions and rejecting new mineral‐interest participation deals in favor of exploration and production‐sharing agreements (EPSAs). The EPSA I (1973) and EPSA II (1978) license rounds involved contracts with no cost‐oil allocation and provided little incentive for IOCs to invest. U.S. sanctions based upon charges of state‐sponsored terrorism leveled against Libya resulted in the departure of all US oil companies by 1986. The number of wells drilled per year was close to 200 in 1980, but dipped to less than 50 by 1987 and then remained at between 100 and 120 from 1988 to 2005. In 2006 more than 300 wells were drilled. Libya paid a heavy price for the fiscal changes and its political isolation in terms of access to modern technology and international investment. Libya was able, to some extent, to manage consequences of U.S. withdrawal by involvement of non‐U.S. IOCs (particularly European and Canadian companies) and by relying on its own production capabilities. Oil production peaked in 1970 at 3.357 million bopd but had dipped to 1.003 million bopd by 1987. It remained at less than 1.5 million bopd until 2004 and increased to average 1.848 million bopd in 2007. With only an obsolete 1970s small liquefaction plant (Marsa El Brega) providing gas export opportunities, gas production remained 0.6 bcf/day or less up to 2005. Following the commissioning of the Green Stream pipeline to Italy (October 2004), operated by ENI (50/50 joint venture with NOC), gas production has progressively increased to average 1.5 bcf/day in 2007. With several majors involved in new LNG projects the expectation is for gas production to grow rapidly for export by LNG and pipeline. Several credible estimates place Libya’s existing proven natural gas reserves at some 52 tcf (~1.5 tcm), but could grow rapidly with extensive exploration activity that is under way. About
Preliminary Report on Fiscal Designs for the Development of Alaska Natural Gas David Wood November 2008 51
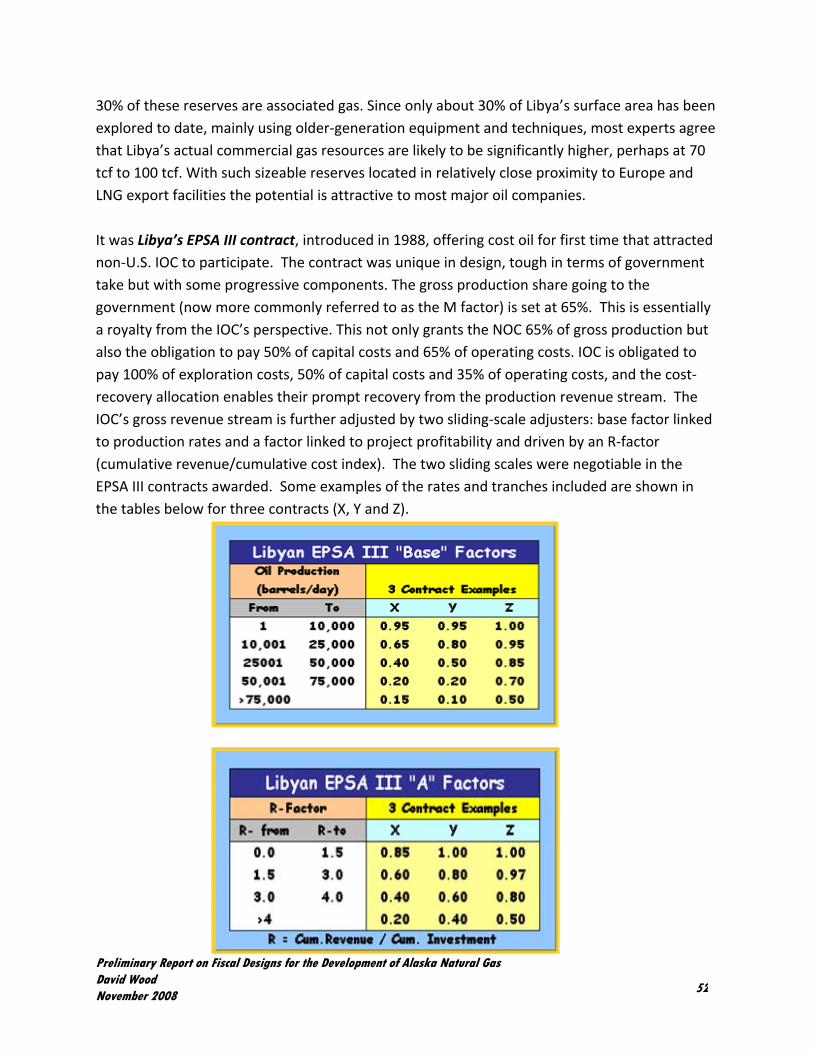
30% of these reserves are associated gas. Since only about 30% of Libya’s surface area has been explored to date, mainly using older‐generation equipment and techniques, most experts agree that Libya’s actual commercial gas resources are likely to be significantly higher, perhaps at 70 tcf to 100 tcf. With such sizeable reserves located in relatively close proximity to Europe and LNG export facilities the potential is attractive to most major oil companies. It was Libya’s EPSA III contract, introduced in 1988, offering cost oil for first time that attracted non‐U.S. IOC to participate. The contract was unique in design, tough in terms of government take but with some progressive components. The gross production share going to the government (now more commonly referred to as the M factor) is set at 65%. This is essentially a royalty from the IOC’s perspective. This not only grants the NOC 65% of gross production but also the obligation to pay 50% of capital costs and 65% of operating costs. IOC is obligated to pay 100% of exploration costs, 50% of capital costs and 35% of operating costs, and the cost‐recovery allocation enables their prompt recovery from the production revenue stream. The IOC’s gross revenue stream is further adjusted by two sliding‐scale adjusters: base factor linked to production rates and a factor linked to project profitability and driven by an R‐factor (cumulative revenue/cumulative cost index). The two sliding scales were negotiable in the EPSA III contracts awarded. Some examples of the rates and tranches included are shown in the tables below for three contracts (X, Y and Z).
Preliminary Report on Fiscal Designs for the Development of Alaska Natural Gas David Wood November 2008 52

These adjustments are quite brutal in reducing the IOC’s net share of revenue in larger more profitable projects with some 85% to 90% of profits going ultimately to the government. As part of the first licensing round in the sanction‐free era, which closed in January 2005, attracting substantial interest and competition, particularly from U.S. IOCs, a new simplified EPSA IV contract was introduced. In the EPSA IV contract the gross production share to the government (M factor) became the main biddable item accompanied by a subordinate B factor (bid bonus). The base factor was removed (essentially set at 1.0 for all production tranches). The R‐factor adjustment was on a fixed sliding scale of 0.9 up to R of 1.5, 0.7 for R between 1.5 and 3 and 0.5 for R greater than 3. EPSA IV cost shares and cost recovery: NOC is carried through exploration costs, pays 50% of capital costs and 65% of operating costs. IOC cost‐recovery allocations are 100% for exploration costs, 50% for development costs and 35% for production costs. In the first license round (January 2005), some very aggressive bids were placed, especially by U.S. companies with M‐factors substantially above 80% in most cases. For some of the most prospective blocks, 15 competing bids were submitted and winning bid bonuses ranged up to US$25.6 million. For Licenses 124 and 35, Occidental and partners submitted winning bids with M‐factors of 89.2% and 89.6% respectively. For Block 54 Hess submitted a winning bid with an 87.6% M‐factor and a US$6.18 million bid bonus. The terms bid on the most prospective areas resulted in government take of profits ranging up to above 95%. Even for the most frontier areas winning bids provided the government with more than 75% share of profits (e.g. license 59 in the Cyrenaica basin was awarded with an M‐factor of 61.1% to Occidental and partners with a US$1.1 bid bonus). Sonatrach, the Algerian NOC, won License 65 in the Ghadames basin with an M‐factor of 75% and a bid bonus of US$2 million. The fact that NOCs were also competing for this acreage highlights the industry interest in Libya. Most European and Canadian companies that had won nothing in the first EPSA IV round had bid M‐factors in the 70% to 80% range. In the second license round, which closed in October 2005, these companies increased their M‐factor bids to the 75% to 85% range and won several blocks, along with many other IOCs from around the world.
Preliminary Report on Fiscal Designs for the Development of Alaska Natural Gas David Wood November 2008 53

The EPSA IV licenses awarded in Round 1 averaged just over 2 million acres each. For the 15 licenses awarded, the total work commitment came to $298.7 million, or about $20 million/block (to be successful in such large blocks contractors would realistically have to spend more risk capital than this). Mixed exploration results have been announced so far from the first licenses to be awarded. Not so good for Woodside, but good for Verenex (Calgary independent) and partner Medco (Indonesian independent) in License 47 (M‐factor 86.3% and bid bonus US$0.35 million) with one oil discovery in 2006, 5 discoveries in 2007 and two rigs active in 2008 and plans to drill as many as 12 wells in 2008. The economic realities of these harsh terms are now a commercial challenge being helped by high oil prices. Decommissioning was not addressed in EPSA III contracts, but an abandonment clause was added to EPSA IV that requires each IOC and NOC to bear and finance 50% of all costs related to the abandonment of installations and site restoration. It also provides a mechanism whereby provisions for estimated abandonment and site restoration are deposited in an interest‐bearing account. Joint stock operating company: EPSA IV provides that as soon as a commercial discovery is declared, the operatorship shall be transferred from the IOC to a company jointly owned by the foreign contractor and NOC. The management committee of the operator will be composed of four members, with two members appointed by each party. All decisions will be by simple majority of the members of the joint owned company. This is consistent with some other North African countries (e.g. Tunisia and Egypt). Reduced power of management committee: EPSA IV also gives foreign contractors more influence over decision making by the management committee. Under EPSA III, NOC had the right to appoint two members to the management committee while the foreign contractor had the ability to appoint only one member. All decisions of the management committee were taken by simple majority. The management committee’s powers are substantial and include the right to approve work programs and budgets. EPSA IV calls for unanimous voting and thus gives the foreign contractor the power to block decisions of the management committee, a power that it did not have under EPSA III. Re‐negotiation of many EPSA III contracts: Operators of older licenses have been pressured in recent years to convert EPSA III into tougher EPSA IV terms. For example ENI, Libya’s biggest IOC producer active since 1959 in Libya, signed renewals of 6 EPSAs in May 2008 for new periods of 25 years (30 years for gas), with agreements to invest some $14 billion including the construction of a new LNG export facility.
Preliminary Report on Fiscal Designs for the Development of Alaska Natural Gas David Wood November 2008 54

Bilateral negotiations still possible: Both Shell and BP have separately been able to negotiate substantial investments linking license awards to commitments to build gas liquefaction export facilities and other infrastructure that have been outside of the license round competitive bidding systems. However, the fiscal contracts on which these are based are believed to follow the EPSA IV design. EPSA IV gas clauses includes a comprehensive gas clause that provides that natural gas discovered and produced by foreign contractors will be marketed jointly with NOC. Domestic gas sales will be indexed to international fuel prices. Gas sales to Europe will be tied to other fuels used for generating power in such region. If a gas market is not available, then foreign companies will not be required to appraise their gas discoveries. EPSA IV also extends the development and production period for non‐associated gas from 25 to 30 years. Gas bidding round: Libya’s fourth exploration and production bid round since 2005 in post‐sanction era was the first round focused on natural gas and the results were announced in December 2007. Two of the four acreage winners, out of 13 bidders, were Gazprom (Russia) and Sonatrach (Algeria), two large NOCs with huge gas reserves of their own to develop. Why would such companies want to spend risk capital exploring for more gas in Libya? The answer to that question appears to lie in the strategic significance of large reserves close to Europe and a desire to prevent the IOCs gaining access to them and then competing with Russian and Algerian gas sales into Europe. Some 35 companies pre‐qualified for Round 4 as operators and 21 as investors to consider bidding on the 41 onshore and offshore blocks offered. Those companies, including most of the European and North American majors and several Asian companies, were unable to compete in key Ghadames basin acreage with Gazprom and Sonatrach in the fiscal terms and signature bonuses offered. Sonatrach won four blocks in partnership with Oil India outbidding BG, Gaz de France, Polish Oil and Gas Company (PGNiG) and RWE with M‐factor bids of 87%. Gazprom beat off competing bids from BG, Gaz de France, Inpex, Lukoil and PGNiG by bidding M‐factors of 90% for three blocks. Shell won two Sirte basin blocks (M‐factor 85% and $93 million signature bonus) and PGNiG was awarded two blocks in the Murzuk basin. Acreage in two other areas was not awarded because the eight blocks received only single bids. PGNiG is another state‐owned entity, but its requirements for international gas are quite clear – in 2006, PGNiG produced 4.3 billion cubic meters of gas against gas sales of 13.7 billion cubic meters in Poland.
Preliminary Report on Fiscal Designs for the Development of Alaska Natural Gas David Wood November 2008 55
Gazprom and Sonatrach are major forces within the Gas Exporting Countries Forum (GECF) and protagonists for a gas producer’s cartel equivalent OPEC. They are keen to gain control and influence over as much competing gas as possible in order to limit the options of their European buyers to diversify their supply. The high state take offered in these deals is probably from their perspective a small price to pay to keep competitors away from large gas resources. It is possible to argue that any gas that Gazprom and Sonatrach find in these licenses could be of more value to them in the ground (i.e. not competing with their own supply to Europe). It is doubtful then that they will rush any exploration or appraisal drilling programs, and Libya’s NOC will find it hard to accelerate development and production from any discoveries made. On the other hand Shell and PGNiG have plenty of motivation to put any gas assets they find in Libya quickly into production. Many opportunities for gas infrastructure projects: Libya’s strategic location close to many southern European gas markets means that pipelines as well as LNG offer huge development opportunities. For example, in December 2007 it was reported that Greece was in discussions with Libya to build a gas pipeline from Libya to the Mediterranean island of Crete. Greece is already a major buyer of Libyan oil.
Preliminary Report on Fiscal Designs for the Development of Alaska Natural Gas David Wood November 2008 56

Malaysia The Malaysian government replaced its former mineral‐interest concession system with a production‐sharing contract (PSC) system in 1976 and has amended the PSC fiscal design on occasions to adjust returns to IOCs. The early PSCs were amongst the toughest ever negotiated with IOCs, and the amendments since the 1990s have been primarily focused on reducing the fiscal take as field sizes have decreased and to attract investors into high‐cost/high‐risk exploration. There are specific provisions for gas, but the state company, Petronas, enjoys preferential rights with respect to gas developments. The entire ownership of Malaysia's petroleum resources is vested to Petronas, which has exclusive rights to exploit Malaysia's petroleum resources. Petronas formulates relevant policy and guidelines and provides the necessary incentives and a conducive investment environment for upstream petroleum business with a view to adding value to the petroleum resources. The PSC system obligates IOCs to provide all technology and financing and to insulate Petronas from risks. Fiscal design philosophy: The government emphasizes 5 key objectives:
1. Ensure fair return/rewards to successful investors based on prospectivity and level of risk taken.
2. Allow recovery of all cost in exploration and development upon success. 3. Encourage reinvestment to sustain production profile of discovered fields. 4. Adopt partnership approach in dealing with foreign investors. 5. Create conducive work environment to facilitate business activities.
1985 PSC Terms Outline: There were no bonuses. The royalty rate was (and remains) 10% of gross production. Cost‐oil allocation was limited to 50% of gross revenues after royalty. Facilities and tangible drilling (exploration and development) costs are depreciated at 10%/year. Intangible drilling (exploration and development) costs are depreciated at 30%/year in the year in which they were incurred or carried forward for recovery in future years. The income tax rate was 45% (reduced in 1990s to 38%) on contractor's taxable income.
Preliminary Report on Fiscal Designs for the Development of Alaska Natural Gas David Wood November 2008 57
The export tax (remittance tax) was 25% of contractor's profit oil if profits were repatriated abroad. The research fund (Cess) of 0.5% was paid from contractor's cost oil plus profit oil share. The excess value tax rate (a price cap) was negotiable but typically 75% and applied to the portion of contractor's profit‐oil share of revenues derived from oil prices above a threshold price of US$25/barrel (that threshold oil price escalated at 5%/year from the start year of the contract). Government carried interest was a minimum of 15%, but reached 25% in some contracts (it did not pay any exploration costs but became a 25% partner in any discovery paying 25% share of capital and operating costs). Production remaining after cost oil was split between state oil company and IOC (profit oil) on a sliding scale according to production: From 0 to 10,000 bopd profit oil was 50%. From 10,001 to 20,000 bopd profit oil was 40%. Above 20,000 bopd profit oil was 30%. After 50 million barrels has been produced in the contract area the contractor's profit oil automatically fell to 30% regardless of production rate. In the 1976 PSC terms there was no sliding scale and the IOC’s profit oil was fixed at 30%. Gas developments were impeded by the low domestic gas price available and the control by Petronas of gas export projects. These terms, taking into account the large Petronas equity share, meant that the government take of profits exceeded 90% in most field cases. Fiscal Terms Modifications of mid‐1990s By the mid‐1990s lack of significant investment by IOCs led Malaysia to ease the fiscal burden on the upstream sector. Income tax was reduced to 38% and more favorable PSC terms were introduced in the form of a deepwater PSC to attract major IOCs into high‐cost, high‐risk areas and a more progressive revenue‐over‐cost (R/C) mechanism to determine profit oil split. The R/C mechanism is linked to profitability rather than production thresholds and is therefore more progressive than the 1985 mechanism.
Preliminary Report on Fiscal Designs for the Development of Alaska Natural Gas David Wood November 2008 58

The R/C profitability‐based fiscal regime involved cost recovery tranches & profit split varying with R/C Index. This was designed to promote cost effectiveness, reinvestment, and the development of marginal fields. It was primarily focused on making small/marginal discoveries commercial.
Preliminary Report on Fiscal Designs for the Development of Alaska Natural Gas David Wood November 2008 59
IOC is given incentives to save costs as it obtains a higher split of unused cost oil. The R/C index is the ratio of contractor’s cumulative cost oil + profit oil from the effective date of the PSC to the contractor’s cumulative petroleum costs from the effective date. On a nominal undiscounted basis R/C of 1 represents project payout. On a discounted basis, considering the time value of revenues, costs and fiscal payments, the payout is approximately R/C of 1.4. The pre‐1995 fiscal terms were tied only to production rate and volumes produced level, NOT related to profitability. The fixed cost oil/gas was not sensitive to investment levels, especially in the early phases of the project life. Moreover, the earlier PSC fiscal terms applied to the contract area as a whole (rather than ring‐fenced to the field level). This meant that only the first field developed benefited from higher profit splits to the IOC. Once the thresholds were exceeded by the first field all other fields developed in the area were subject to lower profit splits. Later life development investment also did not enjoy a higher profit split. The earlier PSC fiscal design offered no fiscal incentives for the IOC to save costs, because any unused cost oil or cost gas was treated as profit production and a bigger proportion of that accrued to Petronas. The R/C mechanism addresses all of these issues and improves the position of the IOC. It allows IOC to take more when its profitability is low and Petronas' to take progressively more as IOC's profitability improves.

This change in terms led to some 20 new contracts signed and some 75 wells drilled over the first decade of its application. The diagram below illustrates ‐‐ based on Petronas’ assessment in 2003 ‐‐ how the IOC take has been improved by the R/C terms. The takes shown do not include the price cap and export tax provisions introduced in the 1985 PSC, which reduce IOC take of profits substantially at high prices. The analysis in the diagram is based upon a 50 million barrel oil field. Contract term: This has also been improved in the 1990s’ contracts. For the R/C terms the total period is 29 years consisting of: 5 years exploration (with 5 years grace for the IOC to hold on to gas discoveries prior to declaring them commercial); 4 years development; 20 years production. For the deepwater terms the total period is 38 years consisting of: 7 years exploration (with 5 years grace for the IOC to hold on to gas discoveries prior to declaring them commercial); 6 years development; 25 years production. Deepwater terms: These vary according to water depth as described by Petronas in a 2003 presentation and for gas and oil.
Preliminary Report on Fiscal Designs for the Development of Alaska Natural Gas David Wood November 2008 60

The deepwater terms specify distinct mechanisms for gas and oil. There is no R/C mechanism so they are quite regressive based upon production rates and cumulative volumes. Note for gas fields the cost gas allocation of 60% is lower than for oil, and also for large gas reserves Petronas takes a higher share of profits than for oil.
Preliminary Report on Fiscal Designs for the Development of Alaska Natural Gas David Wood November 2008 61

Nigeria Nigeria is a member of OPEC, one of the world's largest oil exporters and Africa's most populous country with some 120 million people. The petroleum sector is the backbone of the Nigerian economy, accounting for some 95% of total foreign exchange revenue and more than 40 percent of gross domestic product (GDP). Since the first discovery of commercial quantities of oil in Nigeria in 1956 and first oil exports in 1958, the Nigerian oil sector has not only survived civil war, nationalization, local lawlessness, political and fiscal interference, corruption and financial uncertainty, crippling national debt levels at various times of low oil prices (e.g. some $30 billion in 1999 – more than 90% of GDP and > 150% of annual export earnings – were partly rescheduled in 2001), but has managed to almost continuously expand and flourish. In 2008 it claims 36 billion barrels of proved oil reserves and 2.2 million barrels/day of oil production. Its aspiration, despite community unrest, is to achieve 40 billion barrels of proved oil reserves and 4.5 million barrels/day of oil production by 2010. Nigeria has also been very innovative and flexible in its upstream petroleum sector fiscal design and can offer some lessons to more developed regions in how to attract and retain inward investment. Joint‐venture concessions: The upstream industry remains dominated by 6 major joint‐venture operations managed by the majors, Shell, Mobil, ENI (Agip), TotalFinaElf, Chevron and Texaco (Nigeria is resisting attempts by ChevronTexaco to merge its Nigerian subsidiaries because of job losses). Most onshore and shallow‐water production concessions are managed through long‐standing, joint‐venture concession (mineral‐interest) agreements and companies, in which the Nigerian government, through the Nigerian National Petroleum Company (NNPC), holds a 60% shareholding (except in the case of the Shell joint venture where this is 55%; NNPC sold 5% in 1993 to raise finance). The Nigerian government has two major funding arrangements for oil production: joint ventures (JVs) and production‐sharing contracts (PSCs), but NNPC also uses service contracts for certain projects (e.g. ENI developed Okono field under such an arrangement). Production from JVs accounted for some 95% of Nigeria's crude oil production in 2002, but this is progressively declining as more of the giant deepwater PSC fields are coming onstream. The Shell joint venture accounts for about 35% of Nigeria’s oil production, and Shell holds some 50% of Nigeria’s total oil reserves. Shell allocated some $8.5 billion of capital investment in Nigeria between 1997 and 2002 and has spent closer to $10 billion of capital investment in Nigeria from 2003 to 2008, mainly on deepwater field developments and LNG expansions.
Preliminary Report on Fiscal Designs for the Development of Alaska Natural Gas David Wood November 2008 62
JV royalty rate: 20%. Petroleum profits tax rate: 85%. The memorandum of understanding (MOU): The foreign JV partners manage and administer the operations, under a joint equity financing structure regulated by a Joint Operating Agreement (JOA). All operating costs are financed jointly by a system of monthly cash‐calls. An MOU, re‐negotiated periodically (e.g. 1991, 2000 and 2008) defines the commercial agreement between the joint‐venture partners and the government. The MOU provides the IOCs with some minimum returns in periods of low oil prices and some incentives to invest more capital. A major recurring problem facing Nigeria's upstream oil sector has been insufficient government funding of its JV commitments (NNPC’s share of up to 60%). This has lead to perpetual financial wrangles between the Finance Ministry, NNPC and the IOCs, late payment of cash calls by NNPC, mounting debts owed by NNPC to IOCs, and delays to investment programs. The MOU was introduced in 1986 to act as a safeguard clause to protect the foreign JV partners from high marginal tax rates (royalty 20% and petroleum profits tax, PPT, 85%) in low oil price environments, making production operations sub‐economic. The MOU provided JV partners a minimum guaranteed notional margin on their share of production (generally 40% less taxes; NNPC 60%) subject to the amount of capital invested. This was designed to encourage the oil producers to increase investments in exploration and development activities and enhance crude oil exports. The margins were: US $2.5/bbl for capex < $2.00/bbl US $2.7/bbl for capex > $2.00/bbl These deemed fiscal margins are applied when the realised oil price (RP) for crude sales falls in the range US$15/bbl < RP < $19/bbl. In calculating the deemed margins, the deemed allowable technical costs were limited to US$4/bbl ($2/bbl capex; $2/bbl opex). Such cost constraints have been breached in recent years due to cost inflation and security issues associated with damages caused by unrest in the delta communities. The 1991 MOU amendments provided amongst other changes a reserves addition bonus claims (RAB) for those IOCVs adding more to the crude oil reserves than was produced in a particular year. Shell and others used the RAB aggressively to book large increases in their reserves in the 1990s. The purpose and need for an MOU has diminished in the high oil price environment since 2004. From Nigeria’s perspective it erodes government take as defined under the PPT tax act.
Preliminary Report on Fiscal Designs for the Development of Alaska Natural Gas David Wood November 2008 63
Alternative funding of JV field developments: A number of innovative alternative funding mechanisms have been devised in the past decade by some IOCs with NNPC to enable large investments required for offshore field developments in those shallow water areas covered by JV agreements to move forward. Total's $1 billion Amenam and Chevron's $450 million Ayamaladu oil field were developed under such temporary agreements. The IOCs fund NNPC’s share of investment costs (i.e. working as a modified PSC arrangements). Once investments are recouped from revenues, the projects then revert to the prevailing joint‐venture terms. Production‐sharing contracts – an attractive alternative: Since 1993 deepwater blocks have been awarded with significant signature bonuses paid to NNPC based on PSCs. In such arrangements the capital costs are borne by the IOCs, and if oil is produced the IOCs benefit from low royalties and taxes (relative to onshore and shallow water fiscal terms) to compensate them for the high costs and risks they have taken on. As for JV arrangements, exploration is conducted under oil prospecting licenses (OPLs), which are converted to oil mining leases (OMLs) once development plans have been agreed between IOCs and NNPC. At conversion NNPC may negotiate back‐in rights specified in later PSCs but not the earlier ones. Due to original licensing irregularities NNPC was able to negotiate in 2003 substantial back‐in rights to the deepwater PSC Agbami field operated by Chevron. PSC terms periodically re‐negotiated: Nigeria’s Deep Offshore and Inland basin Production Sharing Contracts Decree No. 9 and Amendment Decree No. 26, effective from 1993 (PSC Decree), specified the essential terms and also that those terms would be subject to review in January 2008 and every five years thereafter. It is unfortunate for the IOCs that these terms have come up for renegotiation at a time when several large fields have just come onstream following multibillion‐dollar investments and years of development work, but when oil prices are around $130/barrel. NNPC is in a strong position to tighten the terms, meaning that the major IOCs will probably make much smaller returns than they might have hoped for when the fields were under development. The maximum PSC term is 30 years: That includes up to 10 years exploration, split into two 5‐year phases, plus 20 years production for those areas converted to OMLs. The minimum financial commitments for the exploration phases must be secured by IOC financial guarantees. Those work programs are usually substantial amounting to US$100’s millions over the ten‐year exploration period. A management committee of 10 appointees (5 from NNPC including the chairman and 5 from contractor) approves budgets and work programmes.
Preliminary Report on Fiscal Designs for the Development of Alaska Natural Gas David Wood November 2008 64

Bonuses are negotiable. For prospective deepwater blocks signature bonuses have reached several hundred million dollars, only surpassed worldwide by those paid to Angola. Progressive production bonus schemes linked to cumulative revenue generated by a field also apply. The production bonus percentages get smaller as the cumulative production increases (e.g. 0.2% when cumulative production reaches 50 million barrels and 0.1% at 100 million barrels), but essentially amount to 100,000 barrels of oil (i.e. 0.2% x 50 million and 0.1% x 100 million). This production bonus scheme is progressive in that it yields big bonuses when oil prices are high and lower bonuses when oil prices are low. For oil prices of $50/barrel these bonuses are only about $5 million. At US$130/barrel they are US$13 million. Royalty rates (% of gross revenue, payable monthly) are 20% onshore and in offshore areas are graduated according to water depth. Cost‐oil allowance is 100% of gross revenue less royalty and is allocated to recover qualifying costs incurred in developing and producing oil from the OMLs derived from the PSC. There is an accounting and allocation procedure specified in the contract that governs cost recovery. Operating costs are expensed and capital costs are depreciated on a straight‐line basis at 20%/year. Ring‐fences: Operating and development costs are ring fenced at the OML level and exploration costs are ring‐fenced at the PSC level (i.e. eligible for recovery from any OML within the PSC). Bonuses are not cost recoverable, but are tax deductible. Tax credits and allowances: PSCs executed before July 1998 benefit from a flat rate 50% tax credit for qualifying capital expenditure for the accounting period in which the asset is first
Preliminary Report on Fiscal Designs for the Development of Alaska Natural Gas David Wood November 2008 65

used. PSCs executed from July 1998 benefit from a flat rate 50% tax allowance for qualifying capital expenditure for the accounting period in which the asset is first used. Petroleum profits tax (PPT) is applied to offshore PSCs at a flat rate of 50% but does not exempt the contractors from the payment of other taxes, duties or levies imposed by any federal, state or local government. Profit oil split: is defined as that oil remaining after tax‐oil and cost‐oil allocation. It is shared between NNPC and the contractor on a sliding scale governed by cumulative oil production: The magnitude of the first two tranches means that only giant fields will ever incur profit oil allocations of less than 65% to the contractor. The first tranche profit oil split was amended to 30% to NNPC and 70% to the contractor for those PSCs executed in 2002 to 2005. Government equity interests: The 1993 PSC had no provisions for NNPC equity interests, but the 2002 PSC granted NNPC up to 20% equity interest (carried through exploration expenditures and paying back development costs from production revenues). In the deepwater blocks offered for bidding in 2005 the Nigerian government applied harsher terms due to less risk being taken by the IOCs (high prospectivity in a proven play trend) and high oil prices and competition for acreage. The royalty rate was no longer reduced by water depth. Cost‐oil allocation was reduced to 80%, and a 10 % equity share was sought for Nigerian local companies in all the blocks on offer. Example of 2005 Deepwater Terms Equator, a listed London’s Alternative Investment Market (AIM) independent oil company, in their June 2006 corporate presentation published on the web outlined the work commitments
Preliminary Report on Fiscal Designs for the Development of Alaska Natural Gas David Wood November 2008 66

and fiscal terms for their 30% working interest awarded in blocks OPL321 and OPL323 signed in March 2006 with partners KNOC (S. Korea).
• The award involved a firm 4‐well commitment (30% share of financial guarantee of US$ 83 million).
• Signature bonus and commitment to buy existing 3D seismic (30% share US$171 million).
• Cost‐oil allocation, 64%. Royalty rate, 8%.
• Petroleum profits tax, 50%.
• Fiscal depreciation, 5 yrs (includes pre‐production capital expenditure).
• Investment tax allowance (ITA), 50%.
• Production bonuses of 0.2, 1 and 1 million barrels of oil after cumulative oil production of 1, 220 and 500 million barrels.
• Fiscal entitlements not utilized are carried forward without limitation.
• 7% cost carry for local companies; costs recoverable from local companies’ share of profit oil.
• Profit oil – linked to an R‐Factor: The PSCs signed in 2006 represent the first time Nigeria has applied profitability factors to establish profit sharing. Previous PSCs have used cumulative production. Once fields reach an R‐factor of 2.5 the government takes 75% of the profit oil. A new offshore bidding round is planned for late 2008 and early 2009 and will probably involve further amendments to the PSC fiscal design. Preliminary Report on Fiscal Designs for the Development of Alaska Natural Gas David Wood November 2008 67
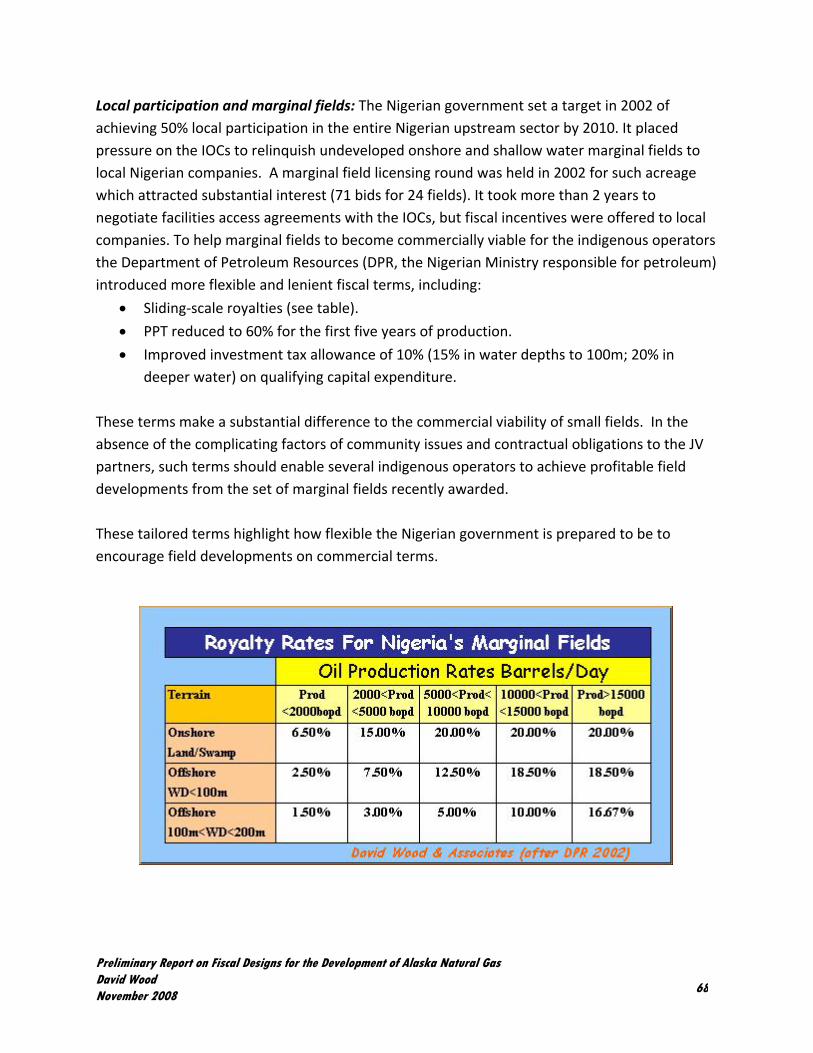
Local participation and marginal fields: The Nigerian government set a target in 2002 of achieving 50% local participation in the entire Nigerian upstream sector by 2010. It placed pressure on the IOCs to relinquish undeveloped onshore and shallow water marginal fields to local Nigerian companies. A marginal field licensing round was held in 2002 for such acreage which attracted substantial interest (71 bids for 24 fields). It took more than 2 years to negotiate facilities access agreements with the IOCs, but fiscal incentives were offered to local companies. To help marginal fields to become commercially viable for the indigenous operators the Department of Petroleum Resources (DPR, the Nigerian Ministry responsible for petroleum) introduced more flexible and lenient fiscal terms, including:
• Sliding‐scale royalties (see table).
• PPT reduced to 60% for the first five years of production.
• Improved investment tax allowance of 10% (15% in water depths to 100m; 20% in deeper water) on qualifying capital expenditure.
These terms make a substantial difference to the commercial viability of small fields. In the absence of the complicating factors of community issues and contractual obligations to the JV partners, such terms should enable several indigenous operators to achieve profitable field developments from the set of marginal fields recently awarded. These tailored terms highlight how flexible the Nigerian government is prepared to be to encourage field developments on commercial terms.
Preliminary Report on Fiscal Designs for the Development of Alaska Natural Gas David Wood November 2008 68

There are also significant incentives for natural gas under the marginal field initiative, which allow gas and NGL fields to be developed under the following fiscal design:
• Royalty on gas is waived.
• VAT & duty free.
• Corporate tax rate 30%.
• Condensate taxed (PPT) as oil at 60%.
• Tax holiday of 5 years for gas.
• 90% accelerated capital allowance.
• Investment tax allowance 15%. Nigeria’s Stated Objectives of its Marginal Field Program:
• Provide opportunity to gainfully engage the pool of high‐ level technically competent Nigerians in the oil & gas business.
• Expand the scope of participation in Nigeria’s oil and gas industry.
• Attract additional capital into the petroleum sector of the economy.
• Increase the oil and gas reserves base through aggressive exploration.
• Promote indigenous participation in the oil industry thereby fostering technology transfer.
A 2008 bill going through the legislature proposes that foreign‐owned companies must achieve a 95% reliance on Nigerian staff in all managerial, professional and supervisory positions. This is accompanied by a desire for 70% of all petroleum expenditures to be made with local Nigerian companies by 2010 (up from <40% in 2007). Natural gas exports (LNG): Nigeria is a major exporter of natural gas in the form of LNG (5th largest in the world) from the six operational trains of the Bonny LNG plant operated by Shell on behalf of partners Total, ENI and NNPC. There are several new projects to build onshore and floating liquefaction plants in Nigeria. With 11 countries as LNG customers Nigeria is the third most diversified LNG supplier (after Algeria and Trinidad). It is also one of the best located LNG suppliers to reach all three main gas markets (USA, Europe and East Asia) and is sending substantial LNG volumes to all three markets. Nigeria has grown its natural gas production from 0.5 bcf/day in 1998 to 3.4 bcf/day in 2007.
Preliminary Report on Fiscal Designs for the Development of Alaska Natural Gas David Wood November 2008 69

Nigeria’s LNG exports in 2007 are detailed in the following table:
Country LNG Exported (bcf) LNG Exported (bcm)
1 US 95.0 2.69
2 Mexico 19.8 0.56
3 France 133.5 3.78
4 Portugal 81.6 2.31
5 Spain 294.2 8.33
6 Turkey 50.2 1.42
7 China 2.8 0.08
8 India 22.6 0.64
9 Japan 31.1 0.88
10 South Korea 8.5 0.24
11 Taiwan 8.1 0.23
Total 747.3 21.16
Data: from BP Statistical Review June 2008 Natural Gas Strategy The Nigerian government recognizes the need for a coherent gas policy. A DPR presentation in February 2008 stated the reasons:
• Focus had been more on oil, and it is generally agreed that Nigeria has more gas than oil.
• Legislation (comprehensive in nature) exists for oil.
• The current laws on gas are generally reactive rather than proactive.
• Fiscal system solely for crude oil production.
• Fiscal terms in gas are project specific rather than being of general application e.g. NLNG decree.
• Incentives appear as after thought – Financial (miscellaneous taxation provisions) Decrees 18 of 1998 and 30 of 1999.
• Absence of a realistic pricing system and its negative effect on investment.
• Gas commercialization drive of government. Gas Flaring/Domestic Utilization: Nigeria spent a year in 2002/2003 reviewing options for a national gas strategy considering market issues, restructuring options and an implementation plan. It stated its intention to stop
Preliminary Report on Fiscal Designs for the Development of Alaska Natural Gas David Wood November 2008 70
gas flaring by 2008. Little has been achieved from a legislation perspective in the interim 5 years. Some 900 bcf of gas is still flared each year. A gas fiscal mechanism has not yet been established (negotiations ongoing in 2008), and the flaring issue remains unresolved. In spite of this Nigeria is managing to grow rapidly as a global LNG supplier. There is substantial associated gas with Nigeria’s producing oil field but little gas infrastructure and limited domestic markets to utilize that gas. IOCs will have to pay penalties for flaring gas, but without a commercial market, gas pricing mechanism or established fiscal terms it is difficult for IOCs to commit to large‐scale gas developments other than export liquefaction plants where gas is sold internationally under long‐term contracts. The government reconfirmed in 2008 that gas flaring will be eliminated, and companies are to be dissuaded from flaring by paying the economic value of any gas flared. The question for IOCs in 2008 is how will that economic value be determined and will it make future investments uncommercial? The gas reserves potential is substantial. According to estimates by the company IHS‐CERA and the U.S. Geological Survey, there is over 160 tcf of discovered gas yet to be recovered in Nigeria and the expectation of another 130 tcf or so yet to be discovered. The head of ExxonMobil in Nigeria was reported by a local newspaper in February 2003 to have highlighted what was required from that IOC’s perspective for Nigeria to attract the capital necessary to further develop its natural gas industry and to encourage ongoing investment in supply and infrastructure for the domestic natural gas sector. He said that investors need a combination of:
• Market‐based prices.
• Stable fiscal terms that allow attractive returns on investments.
• Off‐take security to ensure developed capacity will be utilized.
• Payment security to provide appropriate credit risk.
• Clear understanding of how projects will be funded.
• For deepwater gas resources to be developed, appropriate PSC gas terms must be put in place to provide developers the ability to recover their costs and share in any profits from their investments.
Many agree that it is only when these characteristics are appropriately implemented that a robust environment for natural gas industry development can materialize. Some would add third‐party access to gas pipelines and infrastructure that is installed should also be included. Domestic market obligation for gas in the future? Preliminary Report on Fiscal Designs for the Development of Alaska Natural Gas David Wood November 2008 71

An expectation in the industry is that gas producers will be required to provide a portion of their gas production as a domestic market obligation (e.g. 25%) at a discounted gas price. However, this can only work when there are gas‐fired power plants and fertilizer/methanol and other gas utilization plants available to take that gas. Re‐organization and reform of oil & gas sector under way in 2008: The Nigerian government elected last year is reforming the oil and gas sector because of conflicting roles by different agencies. The following far reaching reforms are so far announced:
• The DPR will be replaced by the Petroleum Inspectorate Commission, which will regulate the industry. It will focus on upstream operations and implementing the policies of the National Petroleum Directorate, which will replace the Ministry of Petroleum Resources.
• In its present form, Nigeria National Petroleum Corp. also regulates the oil sector, and changes in its structure would abolish this function so that it can focus solely on operations. Its new name will be National Oil Co. (NAPCON). The key change will be a switch from joint ventures to incorporated joint ventures where new companies with a separate board are established with its partners. This change would address funding problems, as NAPCON would be free to seek investment from the market.
• Pipelines & Products Marketing Co. Ltd. (PPMC) will no longer have a monopoly on the refining market.
• Gas monetization is a high priority, and the government's ambition is restated to realize gas revenues on par with the oil industry by 2010. Without a clear fiscal design for gas it is hard to see how this can be achieved in the short‐term.
Corruption and investigation of past license awards: Corruption continues to be a problem in Nigeria’s oil and gas sectors. Most recently, former President Olusegun Obasanjo struck lucrative exploration deals with various indigenous companies before leaving office in 2007 and was accused of awarding political sponsors. The Ministry in June 2008 announced an investigation that will examine an auction held in May 2007 shortly before Obasanjo departed. Despite extensive promotion of the auction to bring in multinationals and preferential bidding on certain blocks, many shunned it because of worries that a new government would change agreed terms. As part of the investigation Nigeria has suspended Tony Chukwueke from his role as head of the nation's oil industry regulator while it investigates.
Preliminary Report on Fiscal Designs for the Development of Alaska Natural Gas David Wood November 2008 72

Norway Tax rules are based on a mineral‐interest system with multiple taxation mechanisms, allowances and a substantial participation by the government, particularly in large projects. The two main tax components, corporation tax and a special tax, are based on the net petroleum profits received by the IOCs. The Norwegian petroleum tax system has a high marginal tax rate of 78%, but it includes some progressive elements and allowances. The amendments to the system introduced in 2005 are favorable for marginally profitable projects because the uplift allowance shelters profits from the special tax. In general, the system performs well with regard to net present value per dollar invested, break‐even prices and required probability of discovery, as all expenses are tax deductible. Bonuses: There are no signature bonuses, and all relevant expenses (exploration and development capital investment, operating costs, shut‐down and decommissioning costs, and research and development expenditures) for the activities on the NCS are tax deductible. Royalties: None. Royalty was phased out for the last two fields (Oseberg and Gullfaks) in 2005. From 2006 there is no royalty on the NCS. Ring‐fences: All IOC income and expenses from upstream activities are consolidated at the company level, and there is no ring‐fencing between licenses. There is a ring‐fence at the company level between petroleum extraction and other activities, such as other industrial activities or results from foreign investments. Tax‐base calculations (updated in 2006): Taxes are paid based upon rates applied to tax bases. Corporation tax base is calculated as: Operating income Less operating expenses Less linear depreciation for investments (6 years) Less exploration costs
Less royalty, CO2 tax, area fee
Less net financial costs (limited by the thin capitalization rule; minimum 20% equity required) Less losses from previous years This corporation tax base is taxed at a rate of 28%.
Preliminary Report on Fiscal Designs for the Development of Alaska Natural Gas David Wood November 2008 73

Special tax base is the corporation tax base: Less investment uplift of 7.5 % of investment for 4 years Less excess uplift from previous years (i.e. that not used to offset special tax) This special tax base is taxed at a rate of 50%. The tax rules enable projects with a nominal rate of return of less than about 15% to be sheltered from the special tax. Legislation: Petroleum Tax Act. [For updates in Norwegian see http://www.lovdata.no/all/hl‐19750613‐035.html] The state’s direct financial interest (SDFI): The Norwegian government (state) has a direct ownership interest in several oil and gas fields on the continental shelf. This arrangement means that it pays a share of all exploration, investment and operating costs that is equivalent to its ownership share. Like the other licensees, the state receives a corresponding share of the income from oil and gas production on the individual field. The effect of the SDFI for the companies is to reduce the available ownership share in licenses, but no cost or risk is transferred from the state to the companies (it is a heads‐up arrangement). The SDFI varies from license to license. The SDFI is managed by Petoro, which is registered as license holder for the state’s portions in some 93 licenses with production interests in some 36 fields and 16 pipelines and land‐based plants. The government’s portion of the total reserves on the Norwegian shelf in 2005 amounted to some 24% of the oil reserves and 41.6% of the natural gas reserves. This makes Petoro the largest license holder on the shelf. As of January 1 2006 the value of SDFI was NOK 850 billion. Typical SDFI interests in individual fields are around 30% (e.g. Snohvit), but can be above 50% (e.g. Troll 56%, Heidrun 58%). If an IOC finds a giant field, it should be expected that the state will eventually hold a substantial equity interest in the field’s development and production. The SDFI arrangement is a field‐specific instrument. The share is adapted to the profitability and resource potential of the individual production license at the time when licences are awarded. Fiscal stability: The government emphasizes the low‐risk nature of investments in Norway stating that IOCs can with a large degree of certainty regain a large part of their investments and other costs through the fiscal allowances such as, limited ring‐fencing, uplift and fast depreciation rules applied to capital. The government also wishes to portray the tax system as a “sleeping partner,” allowing IOCs to take a high participating interest, achieve technical
Preliminary Report on Fiscal Designs for the Development of Alaska Natural Gas David Wood November 2008 74

control of projects and take part in large investment projects. The fiscal design philosophy is for the government‐take system to be neutral on company decisions, whether those decisions relate to capital investments, operating costs and activities or field shut‐down and decommissioning. The government’s aim is that a decision that is economically viable before tax should remain so after tax and vice versa. The Norwegian government and the Norwegian Petroleum Directorate (NPD) do not state that taxation rates may not change in the future, but rather emphasize that an IOC’s assets will not be appropriated and projects not rendered uneconomic by fiscal changes and that the state maintains a strategy of projects being profitable for both Norway and the IOCs. The Norwegian policy has, since about 2003/2004, actually increased the number of small and large independent companies taking permits on smaller fields and prospects – it is due mainly to the uplift of capital costs tax incentive (leading to faster payback) plus the belief that the government will not introduce terms that will destroy commerciality in the future based upon stated policy. Some in the industry would prefer the state to further develop its fiscal regime so that it encourages more proactively the development of marginal projects. As major field production continues to decline, Norway’s fiscal design is likely to evolve in that direction. The norm price system: Taxable income from oil production is assessed on the basis of norm prices. The norm price is a tax reference price for Norwegian crudes. The principle for determining the norm price is that it should correspond to the price the petroleum could have been traded for between independent parties in a free market. The Norm Price Board determines the price. The board is comprised of four independent members, one member from the Ministry of Petroleum and Energy and one from the Ministry of Finance. The Norm Price Board forms its decision on a broad‐based evaluation of the market value of the Norwegian crude oil taking into account all relevant market information. Important information is reported sales from the companies operating on the Norwegian continental shelf as well as monthly average for dated Brent Blend as reported by acknowledged publications. The Norm Price Board meets quarterly to fix monthly norm prices for the previous quarter for each crude oil produced. These are presented to the companies in writing. The companies are invited to give their view at quarterly meetings with the board before the final norm prices are determined. The decision may be appealed to the Ministry of Petroleum and Energy within 30 days of the decision. When the Norm Price Board does not find it reasonable to determine a norm price, the sale price actually obtained is used as the basis for tax assessment. This has been the case for a few crudes, NGL and gas.
Preliminary Report on Fiscal Designs for the Development of Alaska Natural Gas David Wood November 2008 75

Advance rulings for gas sales between associated parties: Gas sales are taxed on the basis of the actual realized sales price, except where in cases of transactions between associated parties such price deviates from market conditions. In the latter situation the tax authorities may make adjustments in accordance with the arm's length principle. From 1 January 2006 a company may request the Oil Taxation Office to render an advance ruling on what price shall determine taxable income upon realization of natural gas transfers between associated parties. Depreciation: A linear depreciation schedule applies to production installations and pipelines. The annual depreciation rate is 16.67%, starting from the year the investment was made. For special tax, the company can also deduct an uplift of 30% of investments. Financial costs may be deducted against both the corporation tax and the special tax. Items regarded as net financial costs consist mainly of interest. If an IOC has activities both on the shelf and on land, the net financial costs will be divided on the basis of the tax depreciated value of investments in the two areas. To deduct all of the net financial costs, a company must have an equity‐to‐assets ratio of at least 20%. If less than 20% equity is involved, the financial costs allowable for tax purposes will be reduced toward a level corresponding to a 20% equity‐to‐assets ratio. Uplift of Capital Investment: The purpose of the uplift is to ensure that normal returns are not subject to special tax. From 2005, the uplift is 7.5% annually over four years (adding up to a total of 30%) of the cost price of depreciable business assets from the year the investment is made. Uplift is deducted when calculating the income eligible for special tax. If uplift exceeds the income subject to special tax, excess uplift may be deducted in subsequent years. Exploration costs may be charged as an expense and be deducted immediately. Alternatively, they may be capitalised. Exploration costs are not eligible for uplift. Research and development (R&D) costs that are related to activities on the Norwegian Continental Shelf (NCS) may be deducted in both the corporation tax base and the special tax base. Reimbursement of tax value of exploration expenses: Companies which, due to losses, are not in taxpaying position may each year claim reimbursement of the tax value of exploration expenses from the government. The assessment authorities will refund the amount in the tax assessment for the year in question. If a company has claimed reimbursement of exploration expenses, these expenses will be excluded from losses carried‐forward. This acts as an investment credit.
Preliminary Report on Fiscal Designs for the Development of Alaska Natural Gas David Wood November 2008 76
Losses may be carried forward without any time limits. Losses incurred from 2002 onwards are carried forward with an addition of interest. The relevant interest rate is calculated as a risk‐free interest plus a margin after deducting ordinary corporation tax (28%). If a company with accumulated losses is acquired by, or merged with another company, the right to deduct the losses is transferred to the new owner. If a company with accumulated losses ceases activities subject to petroleum taxation, the company may claim reimbursement of the tax value of these losses from the government. With these rules, the investor can regain the tax value of costs even if it fails to achieve sufficient taxable income. Other taxes CO2 tax: Burning of oil, diesel and gas ‐‐ mainly for power production and flaring on the installations ‐‐ is subject to a CO2 tax. The fee is currently NOK 0.79 per Sm3 gas or per liter of oil. [1US$ was approximately 6.95 NOK on November 27, 2008]. Note that a number of Western European countries have implemented taxes based on the carbon or energy content of a wide range of wholesale and retail energy products (e.g. Sweden, Norway, The Netherlands, Denmark, Finland, Austria, Germany and Italy). Area fee: After the initial production license period expires, the licensee must pay a fee calculated per square kilometer. The fee the first year is NOK 7,000 per km². It then rises by NOK 7,000 per km² per year until it reaches NOK 70,000 per km² per year. The fee then stays unchanged for the duration of the license. In the Barents Sea, the area fee is NOK 7,000 per km² per year for as long as it has to be paid. The system for the area fee is currently being revised. Both CO2 tax and area fee can be deducted in the corporation and special tax base. Assignments of interest and tax adjustments: A transfer of interest in a production license from one company to another requires approval by the Ministry of Petroleum and Energy and the Ministry of Finance. The Ministry of Finance approval will set conditions to neutralize tax effects from the transfer. If there is a net tax effect, the ministry may make adjustments to the tax positions of one or both companies involved in the transfer to ensure tax neutrality. The transaction price will normally be treated as a post‐tax amount, significantly reducing the capital required to buy a license.
Preliminary Report on Fiscal Designs for the Development of Alaska Natural Gas David Wood November 2008 77

Brief history of the evolution of fiscal design: Since the beginning of upstream activity in 1965, the fiscal system has been regularly adjusted to the circumstances of an evolving industry. 1969: 35% compulsory state participation on a carried interest basis on all new licenses was introduced. 1972: Royalties on oil (applicable to gross revenue from a field’s total production at the production point of shipment) changed from 10% to a range from 8% to 16%. Tax relief provisions in the offshore industry were abolished. 1974‐1975: Introduction of the special tax (an excess profits tax designed to capture a greater share of economic rent for the government from offshore petroleum activities). The special tax was set at 25% on the full income net of the corporate income tax of 50.8 per cent. Introduction of a straight‐line depreciation of capital costs over 6 years (effective after the beginning of production) for offset against the special tax. Capital investment also benefited from a capital investment uplift of 10% over 15 years. Only 50% of losses incurred from other activities in Norway were deductible from offshore income. Introduction of government‐set price for oil, the “norm price” defined as the real market price of the same type of crude over a given period as determined by independent traders on a free market. Ring‐fence provisions set around offshore activities at the corporate level. 1979‐1980: Special tax rate was raised to 35%. Capital investment and annual depreciation calculations had the number of years reduced. 1987: Special tax rate reduced to 30% and royalties lifted for new fields (response to low prices). Depreciation calculated under the special tax and for corporation tax initiated from the time the expenditure is incurred. Uplift on capital expenditure was removed in January 1987. 1992: Corporate income tax was reduced from 50.8% to 25%, and the special tax rate was raised to 50%. Deductibility of financing costs was applied to oil companies and not to individual prospects and was limited to 80% of external financing (debt). 5% additional depreciation allowance over 6 years was applied to special tax. 2005: From 1 January 2005, new amendments to the petroleum tax act were implemented. These amendments were aimed at increasing “fiscal certainty” (rather than guaranteeing fiscal stability) for new companies and improving the profitability of investments in i.e. tail‐end production and improved oil recovery to encourage investment in later field cycle IOR projects.
Preliminary Report on Fiscal Designs for the Development of Alaska Natural Gas David Wood November 2008 78

These changes have encouraged new investors, particularly large and medium sized independents, to enter licenses in Norway since 2005.
Preliminary Report on Fiscal Designs for the Development of Alaska Natural Gas David Wood November 2008 79
Papua New Guinea Papua New Guinea (PNG) has been a significant oil producer since the 1970s and has made several substantial oil and gas discoveries in remote, isolated locations far from oil and gas consuming markets. Challenges of operations and field developments in mountainous terrains for its onshore oil industry and isolated offshore gas discoveries have inhibited developments in many cases, particularly for gas due to low international prices and strong competition historically from other Asian LNG producers. The PNG government over the past decade has placed expanding the development of the state's petroleum resources amongst its highest priorities. In doing this the state has recognized the need to put in place the necessary policies, regulations, fiscal mechanisms and laws to help regulate and incentivize the petroleum sector in the country. In doing this the PNG government has strived to ensure that the fiscal design is internationally competitive and attractive enough to lure foreign investment, demonstrating that the risk investor, with exploration success can earn a reasonable rate of return on his investment, while at the same time maximizing benefits to PNG communities and citizens. The five known sedimentary basins in PNG include the Papuan, North New Guinea, Cape Vogel, Bougainville and New Ireland. The Papuan Basin is the basin that has undergone the highest level of petroleum exploration in the country, and is also the only basin in which commercial quantities of crude oil and gas have been discovered and are being produced. The Kutubu Development Project was the first successful attempt to produce commercial oil in Papua New Guinea. In 1992, it turned the country into an oil‐exporting nation. PNG’s first commercial oil discovery was made in 1986. Since mid‐1992, the petroleum industry has contributed an average of 10% per annum to gross domestic product (GDP) and 27% per annum to export earnings. However, in the absence of significant new oil discoveries in the depleted fields, only elevated global crude oil prices have mitigated the reduced contribution of oil production to the national economy. Oil production is limited by the need to deal with increasing volumes of associated natural gas that are being produced with the oil. If commercial evacuation of the gas were developed, oil production and recovery efficiency would be enhanced and extended. PNG has, in order of magnitude, more gas reserves than oil reserves in energy terms, making it likely that gas development and production will continue for considerably longer than oil production to date. Gas pipeline project stalled for many years: In 2005 plans were advancing for a PNG gas export pipeline to Queensland Australia, which was originally conceived in the 1990s. The project scope included developing new gas fields in Hides (Southern Highlands Province), converting existing oil fields to gas production, and developing a new gas conditioning facility at Kutubu (in
Preliminary Report on Fiscal Designs for the Development of Alaska Natural Gas David Wood November 2008 80

the same province), associated infrastructure, and a 192‐kilometer (km) onshore and 270 km offshore gas pipeline from the highlands up to the Australian border. The project aimed to produce around 616 million standard cubic feet per day (MMSCFD) of raw gas, treat and condition it, and then transport 529 MMSCFD, equivalent to 215 petajoules per annum (PJ/a) of specification sales gas. During treatment and conditioning, about 160 million barrels of gas condensates and some natural gas liquids were to be recovered and blended into the crude oil stream of an existing oil project pipeline. In addition, about 150 million barrels of crude oil would be produced and processed by the project. Following a FEED study (commenced October 2004) in September 2005, the PNG government formally requested the Asian Development Bank (ADB) to consider funding PNG’s equity participation in the project. In 2005 the gas pipeline project was estimated to require $2.2 billion to develop fields for gas production, establish treatment and conditioning facilities, and construct pipelines. Ancillary to the PNG component of the project was pipeline construction and associated compression facilities in Australia, costing some US$1.8 billion. In accordance with its established petroleum regime, and obligations under the gas pipeline agreement, the PNG government intended to participate with a direct stake in the project by exercising its option in the agreement to buy an interest in the existing assets at the Hides gas field. This would cover the acquisition costs of equity in the Hides gas field and a pro rata share of project development costs (including past costs), and include the capitalization of interest and funding of reserve accounts. This would have resulted in a net 11.2% interest in the overall project to PNG. The government would have required an estimated $328 million for its stake in the project. By 2030, gas pipeline project‐related income taxes were estimated to comprise 4%–5% of total public revenue (around $100 million per annum). PNG established in 1995 sophisticated pipeline laws that provide for the strategic designation of pipelines and the submission by the licensees of arrangements for third‐party access to optimize the use of installed infrastructure. LNG project commitments made in 2008: In April 2008 the PNG government signed a liquefied natural gas (LNG) deal worth about US$10 billion with an American‐Australian consortium led by ExxonMobil. The project replaces the gas pipeline project to Australia with higher‐paying customers in East Asia. The project could double PNG’s gross domestic product. Once operational, the venture will extract gas from six fields in the Highlands, a remote and undeveloped area. After treatment at a plant in the Southern Highlands, the gas will be piped 265 kilometres to a liquefaction and storage facility near the capital, Port Moresby, before being exported to Asian markets. More than 6 million tonnes of liquefied natural gas (LNG) will be exported annually. ExxonMobil holds a 41.6% in the venture. A number of Australian companies are partners, including Oil Search (34.1%), Santos (17.7%) and AGL Energy (3.6%).
Preliminary Report on Fiscal Designs for the Development of Alaska Natural Gas David Wood November 2008 81

The companies have signed a joint operating agreement (JOA), which covers the commercial aspects of the project, laying the basis for the deal to proceed to the engineering and design phase. The project is scheduled to begin production in 2014. The PNG government is predicted to obtain a net cash flow of US$25 billion to $30 billion over 30 years. The participating U.S. and Australian mining companies expect to reap larger sums, with accrued gas revenues over the life of the project estimated at $95 billion. This figure, however, could be as high as $123 billion if oil and gas prices remain high. Total costs, including capital investment and recurrent expenditure, are forecast to amount to $14.9 billion. The Papua New Guinea LNG project began an 18‐month front‐end engineering and design study in 2008, expected to cost about $400 million. An economic impact study has indicated that the project could double Papua New Guinea's gross domestic product and create more than 7,500 jobs during the initial construction phase, 20% of which would be for local workers. Also some 850 jobs are likely to be maintained during production operations and the majority of those would be held by Papua New Guinea nationals. As conceived the project plans that significant volumes of condensate will be stripped from the gas flows from the various fields in the project and piped down the existing oil pipeline to the Kumul terminal in the Gulf of Papua. However, the PNG government has agreed to the project participants liquefying and selling a high‐calorific wet gas, which includes a significant liquefied petroleum gas (LPG) component (which could be stripped out in PNG). The reasoning behind this strategy is that it increases the value of the LNG exported through the pricing mechanism, which is based on calorific value. Asian buyers are usually willing to pay premium prices for high‐calorific value gas. Other LNG projects planned: There are two other LNG projects progressing through the planning stages in PNG:
1. Liquid Niugini Gas is a joint venture project with three major shareholders: Canada's InterOil, broker Merrill Lynch, and finance company Clarion Finance. It selected Bechtel Corp. in March 2008 to carry out both FEED and EPC contracts its proposed LNG project in Papua New Guinea utilizing the ConocoPhillips' optimized cascade process technology. The planned liquefaction plant is to be built near InterOil's Napa refinery in Port Moresby, with 5 million tonnes/year of LNG capacity from a single processing train. There is an option to add a second train at a later date. Gas is to be sourced from InterOil's Elk‐Antelope field in the Eastern Highlands, which has current wide‐ranging, in‐situ contingent gas reserves of 3.5 tcf to 18.9 tcf of gas. InterOil plans to drill a third Elk appraisal well along with seismic analysis to better determine the reserves figure. A
Preliminary Report on Fiscal Designs for the Development of Alaska Natural Gas David Wood November 2008 82

2012 target for first LNG production will depend on final sanctioning of the project by the PNG government. Merrill Lynch has agreed to take the initial LNG production, thus providing Liquid Niugini with a guaranteed market to support financing. Total investment required is expected to be approximately US$4 to 6 billion.
2. Flex LNG and UK‐based small independent Rift Oil announced in mid‐June 2008 a smaller‐scale floating LNG production project to monetize stranded gas reserves onshore PNG. The gas reserves lie in Rift's petroleum prospecting licenses (PPLs 235 and 261) in western PNG. Gas produced would be piped to Flex’s floating LNG production vessel anchored offshore with some 1.5 million mt/year capacity and a first half of 2012 start‐up. Gas is to be sourced from the Douglas gas discovery in PPL 235, and Rift is drilling (June 2008) its Puk Puk prospect in PPL235. In 2007 Rift entered a non‐binding memorandum of understanding to explore the supply of approximately 40 billion cubic feet/year of gas from PPL 235 to the Gove alumina refinery in Australia's Northern Territory. By selecting a floating liquefaction solution, LNG production could start several years earlier compared to a traditional onshore liquefaction plant. Flex LNG has already placed orders with South Korean shipbuilder Samsung Heavy Industries, for four floating LNG production vessels each with a design capacity of 1.7 million mt/year. Each of the floating LNG production units is expected to cost about $458.5 million including gas loading system, topside supports, utilities and offloading and marine facilities.
PNG LNG project has required changes to fiscal system: PNG government has revived its additional profits tax (APT) to apply to Papua New Guinea LNG project. APT was originally cancelled from the fiscal mechanism in 2003. APT re‐instatement is intended to act as a windfall profits tax to help PNG benefit from increased project value should commodity and energy prices remain strong over the project life. Papua New Guinea's fiscal regime ratified for the LNG deal (2008) will apply the standard 30% income tax plus 7.5% APT when the project’s internal rate of return (IRR) exceeds 17.5% and another 10% when the project IRR exceeds 20%. Legal framework: The Oil & Gas Act of 1998 is administered by the Department of Petroleum and Energy. The Income Tax Act and the Environmental Act, administered by the Internal Revenue Commission and the Department of Environment and Conservation, respectively, play a complementary role in the regulation of the petroleum sector in PNG. PNG has operated a concessionary (mineral interest) petroleum regime since the 1970s. Oil and gas are owned by the state and oil companies are issued licenses to explore, develop,
Preliminary Report on Fiscal Designs for the Development of Alaska Natural Gas David Wood November 2008 83

process, transport and market petroleum products. The fiscal design involves a system of royalties and taxes, combined with State equity participation. State equity participation is up to 22.5% in any petroleum development project. Pre‐2002, Orogen Minerals Limited, a public listed company 51% owned by the state, had the option to acquire up to 20.5% interest in all petroleum projects in PNG, out of the state's 22.5% entitlement. The remaining 2% was allocated free to project area landowners impacted by the project. In the 2002 arrangement, the Orogen option was repealed, and the state holds and disposes of the balance of the equity however it desires. A 2% free equity is still allocated by the state to the landowners. The petroleum fiscal regime in PNG is currently categorized into three areas: 1) general petroleum fiscal terms, 2) gas fiscal terms and 3) frontier terms, which existed prior to 2000 but were repealed in the 2000 Taxation Review and then subsequently re‐introduced. There are five types of petroleum licenses issued and administered by the government through the Minister for Department of Petroleum and Energy. The licenses include Petroleum Prospecting License (PPL), Petroleum Retention License (PRL), Petroleum Development License (PDL), Petroleum Processing Facility License (PPFL) and Pipeline License (PL). In respect of new licenses, the powers of discretion rest with the minister acting on the advice of the Petroleum Advisory Board (PAB) to grant, or not to grant a petroleum prospecting license to an applicant. The advice of the PAB is based on an examination of the technical, financial and corporate strengths of the applicant and an assessment of the appropriateness of the applicant’s detailed proposals for exploration work and expenditure. Tax provisions were overhauled in 2001 and further amended in 2003 in the light of low global prices to improve incentives for the industry to invest. The fiscal design involved a number of elements: Royalties are payable by the licensees to the state at a rate of 2% of wellhead value and are treated as a tax credit if the licensees pay a 2% development levy (that is 2% of wellhead value of all petroleum produced in a project), which is a normal deduction. In the 2002 budget PNG government agreed to phase out the development levy over a four‐year period. Income tax for oil: 50% of taxable income for existing petroleum projects, defined according to ordinary concepts, but subject to ring‐fencing. For new projects it is 45%. Rate is 0% until target income reaches 25%/year of initial investment.
Preliminary Report on Fiscal Designs for the Development of Alaska Natural Gas David Wood November 2008 84
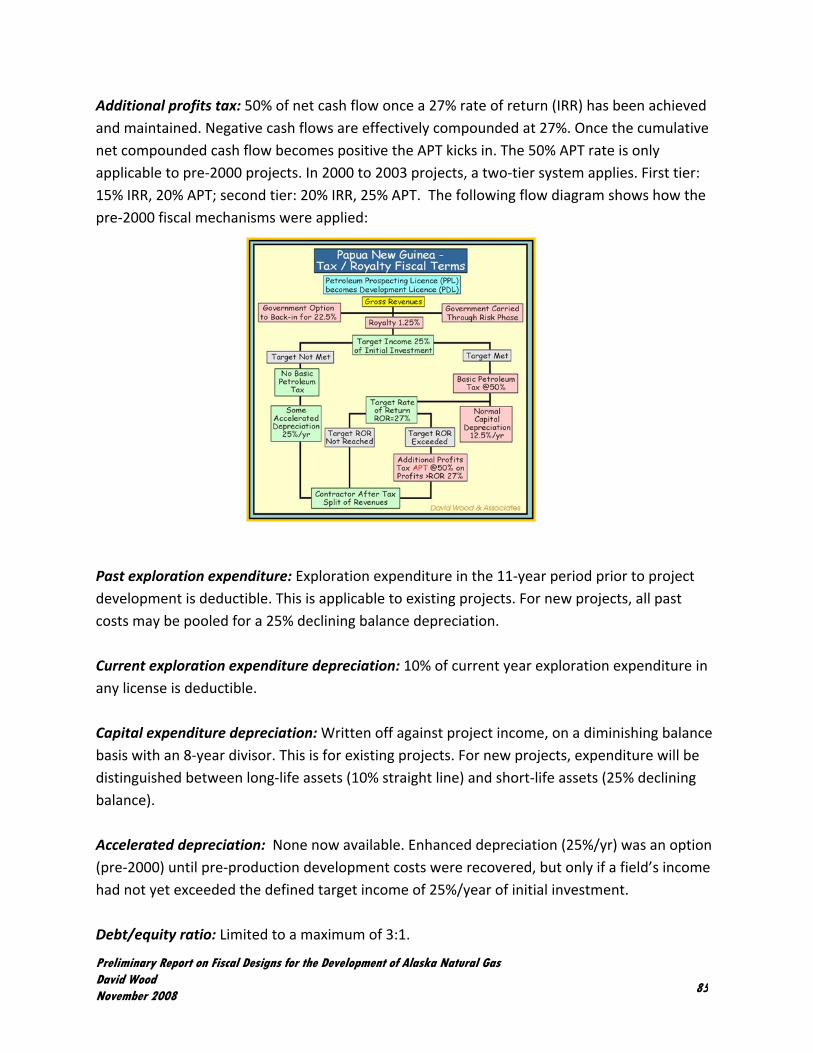
Additional profits tax: 50% of net cash flow once a 27% rate of return (IRR) has been achieved and maintained. Negative cash flows are effectively compounded at 27%. Once the cumulative net compounded cash flow becomes positive the APT kicks in. The 50% APT rate is only applicable to pre‐2000 projects. In 2000 to 2003 projects, a two‐tier system applies. First tier: 15% IRR, 20% APT; second tier: 20% IRR, 25% APT. The following flow diagram shows how the pre‐2000 fiscal mechanisms were applied: Past exploration expenditure: Exploration expenditure in the 11‐year period prior to project development is deductible. This is applicable to existing projects. For new projects, all past costs may be pooled for a 25% declining balance depreciation. Current exploration expenditure depreciation: 10% of current year exploration expenditure in any license is deductible. Capital expenditure depreciation: Written off against project income, on a diminishing balance basis with an 8‐year divisor. This is for existing projects. For new projects, expenditure will be distinguished between long‐life assets (10% straight line) and short‐life assets (25% declining balance). Accelerated depreciation: None now available. Enhanced depreciation (25%/yr) was an option (pre‐2000) until pre‐production development costs were recovered, but only if a field’s income had not yet exceeded the defined target income of 25%/year of initial investment. Debt/equity ratio: Limited to a maximum of 3:1.
Preliminary Report on Fiscal Designs for the Development of Alaska Natural Gas David Wood November 2008 85

Tax Losses Carried forward: 20 years. Specific fiscal terms for natural gas: In 1995, the government introduced new gas fiscal terms in a white paper on natural gas policy. These new gas terms were aimed to provide adequate incentives to potential investors in the upstream and downstream sectors to facilitate commercial development of PNG's gas reserves. These gas terms were incorporated in the Income Tax Act and applicable provisions in the Oil & Gas Act 1998. As a result of these new gas terms, the government received two separate gas development concepts: a proposal for a PNG‐to‐Queensland, Australia Gas Pipeline Project, and a LNG concept targeting the South East Asian markets. The former was promoted strongly by a joint venture led by Chevron Corporation and then (2000 to 2006) by ExxonMobil. Gas terms consist of: Income tax at 30%. Additional profits tax: Pre‐2001 this would have been applied at 30%, with a 20% rate of return (IRR) threshold, but no gas projects were developed on this basis. The 2001 terms applied a two‐tier APT system. First tier: 15% IRR, 20% APT. Second tier: 20% IRR, 25% APT. APT was removed in 2003, but re‐introduced in 2008 for the LNG schemes – First tier: 7.5% IRR, 17.5% APT. Second tier: 17.5% IRR, 20%. Past exploration expenditure: 20‐year carry‐forward. Capital expenditure depreciation: Written off against project income over 10 years on a straight‐line basis. Frontier areas fiscal terms were aimed pre‐2000 to encourage exploration in the upstream sector, particularly in areas perceived to offer high uncertainties and risks. These offered lower tax rates, but the terms were repealed in the taxation review of 2000. Incentive terms introduced In 2003 budget included 30% Income tax to apply to non‐gas discoveries converted to PDLs prior to 31 December 2017 in PPL licenses signed in the period 1 January 2003 to 31 December 2007. These were introduced due to concerns about the lack of exploration activity in Papua New Guinea, particularly in the drilling of exploration wells, and the projected steep decline in oil production from the existing Kutubu, Gobe and Moran oil fields over the period 2003‐2010, the government has introduced special fiscal terms that are
Preliminary Report on Fiscal Designs for the Development of Alaska Natural Gas David Wood November 2008 86

to provide an incentive to the industry to explore. For all non‐gas operations the first tier APT was also removed. In introducing these incentives in December 2002 the government stated, “We have just sixteen active Petroleum Prospecting Licenses (PPLs) at present, down from a peak of forty in 1990. Many of those licensees are finding it difficult to commit to high exploration expenditures and gain management approval to spend scarce exploration budgets in PNG. We also recognise that competition is plentiful around the world for investments in petroleum exploration. We wish to encourage the exploration managers of our current operators to renew their interest in PNG.”
Preliminary Report on Fiscal Designs for the Development of Alaska Natural Gas David Wood November 2008 87

Peru Oil and gas exploration and production activities are conducted under license or service contracts granted by the government. Under license contracts the IOC pays a royalty, while under service contracts the government pays the remuneration to the IOC. In both cases the IOC share (royalty/remuneration) is determined as a function of gross production according to a sliding‐scale based on an R‐factor calculation. The R‐factor is defined as cumulative revenues divided by cumulative costs on a cash basis. Oil and gas obtained under these contracts can be exported with no restrictions or export taxes. In 2003 Peru offered IOCs incentives to boost investment and exploration. These included alternative methods for calculating royalties, export production free of export taxes, free flow of capital, free sharing of technical information, reimbursement of sales taxes incurred during the exploration period, accelerated bidding procedures, fast‐track negotiations, fiscal stability, and large unexplored blocks with significant resource/reserve potential. New contract terms to attract investment are among the best in South America (5% to 25% sliding‐scale royalty, 30% tax). The result has been a noticeable revival of interest in upstream activities and many new IOCs entering licenses. After commercial discovery, operators have a transparent (free from negotiations) choice of royalty schemes to adopt prior to development. The innovative methods of royalty involve a 5% minimum rate accompanied by either a sliding‐scale based on production rates or economic results (R‐factor). The choice is made by the IOC at the moment of declaring commerciality. Method 1 based on total block production (more favorable in low‐cost fields): <5,000 boe/day the royalty is 5%; 5,000 to 100,000 boe/day the royalty is on a sliding scale 5% to 20%; >100,000 boe/day the royalty is 20%. Method 2 based on economic results (more favorable in high‐cost fields): minimum 5% royalty (fixed component) plus when R‐factor greater than 1.15 (i.e. 15% nominal return on investment) a sliding scale variable component up to a total maximum of 20%. The maximum fixed plus variable component is 25%. Profits derived from the IOC’s share of revenue are subject to a 30% income tax. Exploration and development expenditures as well as investments made by the contractor up to the date production begins, including the cost of wells and with respect to each contract, can
Preliminary Report on Fiscal Designs for the Development of Alaska Natural Gas David Wood November 2008 88

be amortized under the following accounting methods: i) unit of production; or ii) straight‐line, during a period not less than five years. Imports of goods during the exploration stage are not subject to import taxes. A customs duties temporary exemption may apply during the production stage. No government equity interest: The national oil company, PetroPeru, does not take an equity interest in the upstream sector. The government guarantees that exchange regulations and tax law in effect on the agreement date will remain unchanged during the contract term. These terms are a substantial improvement on previous terms (e.g. Camisea large gas condensate field development) where royalties were up to 40%.
Preliminary Report on Fiscal Designs for the Development of Alaska Natural Gas David Wood November 2008 89

Philippines The Philippines is not generally considered a highly prospective country with potential for large oil and gas discoveries. It produces a mere 25,000 barrels/day oil. With the exception of Shell’s Malampaya gas field discovered in the late 1990s and now onstream with some 2.5 tcf of gas reserves, exploration results have not identified trends of large fields. However, there are significant unexplored deepwater areas (e.g. NW and SW Palawan and Sulu Sea areas), and a number of poorly explored sedimentary basins with potential. There are two reasons for including Philippines in this analysis: 1) it includes an interesting fiscal element; 2) in June 2008 ExxonMobil farmed into the deepwater block SC56 (Sandakan basin for 50% interest to drill for partner Mitra Energy), confirming that there is enough interest and potential to attract major IOCs. Legal framework: Presidential Decree No. 87 (PD 87), or The Oil Exploration and Development Act of 1972, provides the legal framework for the Philippines Service Contract as the legal and fiscal regime for petroleum exploration and development in the country. It was later amended in 1983 by PD 1857, providing for better incentives to IOCs for offshore exploration and development. Service contract implications: It is a service contract because the contractors are paid monetary amounts from the proceeds of production. Contractors do not receive at any point production volumes. This is potentially an issue for some IOCs in booking reserves under such contracts. Under U.S. Securities and Exchange Commission rules, IOCs cannot book these proceeds as reserves. Some service contracts solve this reserve‐booking problem by giving the contractor the option to convert into a production volume the amount of compensation or service fee and then to sell that at market value to the government. The underlying mechanism is very similar to a simple production‐sharing contract except that all fiscal elements are focused on monetary proceeds from production not volumes. It is one in which IOCs agree to pay in full for exploration, development and production costs and thereby assume the project risk in that these costs will not be recovered by the company unless there is revenue from a field development to pay for the costs. Costs of exploration and production can be recovered from the project gross revenues once production commences. Capital costs are subject to depreciation rules. Royalty: None
Preliminary Report on Fiscal Designs for the Development of Alaska Natural Gas David Wood November 2008 90

Capital cost depreciation: For most oil and gas fields capital costs involved in development and production are recovered over a 10‐year period. Cost oil/gas allocation: The maximum level of costs which can be recovered in any year is equivalent to 70% of the gross proceeds from production. Any shortfall in the amount claimed can be carried forward to be claimed in subsequent years. Deepwater accelerated depreciation provisions: For deepwater developments (in which 85% of the development area is in water deeper than 200 meters), intangible exploration costs can be recovered in full. Tangible exploration costs and intangible and tangible capital costs incurred in field development and production can be recovered over a period of 5 years using straight‐line or double‐declining balance method of depreciation. More generous ring‐fence for deepwater contracts: Cross recovery of exploration costs in deepwater areas is allowable against revenues from other production contracts within the Philippines. This is an incentive for those with production to invest in exploration. Loan interest is an allowable cost (in part): Deductions up to two‐thirds of interest paid on loans to finance development and production operations are allowable. Loan interest to finance exploration activity is not deductible as a cost recovery item. Profit sharing: The net revenues (i.e. gross revenues less recoverable costs claimed in the period) are split 40% IOC/60% government. IOC’s revenue stream exempt from Philippines taxation: IOCs are exempt from all taxes and duties except income tax on the proceeds of production. However, IOCs are indemnified from paying income tax (32% rate) by the government, which pays it on the IOC’s behalf from the government’s profit share and provides IOCs with tax receipts to the contractor for taxes paid by the government on behalf of the IOC. This is favorable from an IOC’s perspective as under various tax treaties it means that its 40% profit share is considered as tax paid in its country of origin. It also provides IOCs with an undertaking of fiscal stability. Filipino participation incentive allowance (FPIA): When local companies (registered in Philippines with Filipino shareholders) participate in the service contracts with equity interests of at least 15% offshore and at least 30% onshore, the contractors (IOCs plus local companies) are eligible to receive the FPIA. The maximum level of the FPIA is 7.5% of the gross revenues. Encourages local industry and only paid once production is achieved. This innovative incentive
Preliminary Report on Fiscal Designs for the Development of Alaska Natural Gas David Wood November 2008 91

can be considered as a “negative royalty” paid in the cases of successful exploration with a significant local equity partner. This is a highly progressive fiscal instrument. Simplistic revenue split calculation for 100 units of revenue: 100.00 units (units = monetary units) as gross proceeds (revenue) from production 7.50 units less FPIA (to contractor) 70.00 units less cost recovery allowance available to contractor 22.50 units net proceeds (profits) 13.50 units 60% government share of profits 9.00 units 40% contractor's share of profits Contractor’s profit units are 9.00 + 7.50 (=16.50) shared between IOC and local company. If local company has 15% interest (e.g. minimum offshore for FPIA to apply), IOC takes some 14 units of profit. Note that this example would be typical of a period early in the cost‐recovery phase with plenty of costs incurred left to recover. Later in the field life significant unused cost‐recovery allowance would be carried over into the profit (net proceeds) and the government would get 60% of a higher number of net proceed units. 2004 First Philippine petroleum public contracting round (PCR‐1) Some additional details of terms offered in the 2004 license round are: Contract area: 2,000 sq km to 8,000 sq km. Contract term: 7 years exploration period + 3 years exploration period extension + 25 years production period + 15 years production period extension. Signature bonus: US$50,000 to US$250,000 (expected range). Production bonuses – oil: US$300,000 at start of production
US$500,000 at 25,000 BOPD US$1 million at 50,000 BOPD US$2 million at 75,000 BOPD
Preliminary Report on Fiscal Designs for the Development of Alaska Natural Gas David Wood November 2008 92

Production bonuses – gas: US$300,000 at start of production
US$500,000 at 130 MMSCFD US$1 million at 260 MMSCFD US$2 million at 400 MMSCFD
State equity participation: None Training allowance: US$20,000 per year during exploration period (cumulative)
US$50,000 per year during production period (cumulative)
Preliminary Report on Fiscal Designs for the Development of Alaska Natural Gas David Wood November 2008 93

Qatar Oil & gas production and reserves statistics: Qatar is an OPEC member, a significant oil producer and in 2006 surpassed Indonesia to become the largest exporter of LNG in the world. In 2007 Qatar produced 1.2 million barrels per day of total oil liquids, of which some 850,000 bbl/d was crude oil plus an estimated 300,000 bbl/d of natural gas liquids (NGLs) and some 50,000 bbl/d of condensate. During 2007, Qatar consumed about 95,000 barrels/day of oil. Qatar has about 15 billion barrels of proved oil reserves and more than 900 tcf of proved gas reserves. Most of Qatar's natural gas is located in offshore North Field –the largest gas field in world. Discovered in 1971, it covers some 6000 km2 and is located in 15 to 70 meters water depth. In 2007 Qatar produced 5.8 billion cubic feet/day on average (2.1 tcf in total), up 17.9% on the year and 4.5 fold since 1995. Qatar’s natural gas consumption was some 2 bcf/day (730 bcf in total) in 2007. Qatar exported LNG to 7 destination countries in 2007 totaling 1.36 tcf (38.5 bcm) including: Belgium, 97.1 bcf (2.75 bcm) Spain, 157 bcf (4.45 bcm) United Kingdom, 9.5 bcf (0.27 bcm) India, 292 bcf (8.27 bcm) Japan, 384 bcf (10.87 bcm) South Korea, 381 bcf (10.79 bcm) Taiwan, 20 bcf (0.57 bcm) When the Qatargas II LNG project comes onstream in late 2008/2009 more volumes will be exported to UK and the U.S. Qatar’s stated strategy is to be producing some 78 bcm of LNG per year by 2010. The table below highlights how that capacity will be constituted and its equity holding.
Preliminary Report on Fiscal Designs for the Development of Alaska Natural Gas David Wood November 2008 94

Government equity participation: A key factor in Qatar’s fiscal structure that is often overlooked when considering taxation and government takes is the dominant equity holding of the NOC Qatar Petroleum (QP) in all of the major gas monetization projects, not just the LNG ones listed in the table. Notice that when the Qatargas projects are reported in the U.S. media they are often referred to as if ExxonMobil has a dominant equity share rather than the 10% to 20% interest it actually holds. Qatar Petroleum holds 65% to 70% in all of these projects. Note that ExxonMobil and ConocoPhillips are key players in the LNG projects being developed in Qatar that plan to export at least part of their capacity to Gulf of Mexico LNG receiving terminals in the U.S. They clearly have not been put off by some two‐thirds of the equity being held by the NOC. Integrated upstream and midstream projects: The fiscal model applied in Qatar which has found it so much favor amongst the oil and gas majors is integration between upstream gas production and midstream liquefaction plant and in the LNG shipping and regasification facilities (in which QP also holds the majority equity in some cases). The key for the IOCs here is security of gas supply to the liquefaction plant and control of it, plus the additional revenue stream from condensate and NGLs which adds significantly to the economic returns achievable by the IOC. Gas projects that isolate upstream and midstream components pose many problems, both logistically and from a fiscal perspective. A Qatar LNG project usually comprises an upstream production‐sharing contract with gas delivered to the midstream subject to a modest feed gas price (in the range US$0.5 to US$1.5/mcf, escalated annually according to a consumer price inflation index). The midstream liquefaction plant is based on a joint venture in which QP has the dominant equity position. Liquids (oil, condensate and C5+ NGLs) have specific PSC terms. There is a substantial additional liquid revenue stream from LPG (propane and butane) but it is not public information how this is divided under PSC terms between QP and IOC. Cost oil and gas allocation: about 50% Profit‐oil split: This is based on an R‐factor (cumulative project revenues over cumulative project costs). The following R‐factor scale shows that as projects become profitable QP takes the major share of liquid profits: R<1.0 ‐ 65% to QP R= 0.65 to 1.25 ‐ 72%
Preliminary Report on Fiscal Designs for the Development of Alaska Natural Gas David Wood November 2008 95

R= 1.25 to 1.50 ‐ 80% R= 1.50 to 2.00 ‐ 87% R= 2.00 to 2.50 ‐ 89% R> 2.50 ‐ 90% Profit gas split: Because the upstream gas price is fixed, gas profit sharing is based upon volume rather than an R‐factor. As quoted by Van Meurs (2006) a typical sliding scale for sharing gas production is: < 130 million cubic feet per day (mmcfd) ‐ 65% to QP From 130 to 260 mmcfd – 70% From 260 to 390 mmcfd – 80% From 390 to 520 mmcfd – 85% >520 mmcfd – 90% These profit‐sharing terms are tough for the IOC and only achieve commerciality for large volumes of production and when combined with the much higher sales prices achieved by exporting LNG. Taxes paid by the government on behalf of IOC: The government pays corporate income tax and other taxes on the upstream on behalf of the contractor providing some fiscal stability. Midstream JVs are crucial to project profitability: The midstream JV consists typically of a heads‐up IOC 30%/QP70%. LNG netback profitability: LNG unit profitability is determined by the netback price of the LNG (LNG sales price less an LNG sales price of either FOB Ras Laffan or delivered ex‐ship – DES cargoes have to deduct transportation costs for netback value), less feed gas price, less liquefaction plant operating costs, less LNG storage costs, less port operations costs, less depreciation of liquefaction plant capital costs. Midstream taxes: The LNG revenues from the midstream component of the integrated projects are subject to a corporate income tax of 35%. Comparison with international fiscal terms for gas: It is unrealistic to compare government takes for upstream gas projects without taking into account the 70% QP equity share or the benefits provided by the midstream LNG (or other gas monetization joint venture).
Preliminary Report on Fiscal Designs for the Development of Alaska Natural Gas David Wood November 2008 96

Qatar pipeline exports: Qatar is the upstream gas supply for the Dolphin Project, which now connects the natural gas networks of Oman, the United Arab Emirates (UAE), and Qatar with the first cross‐border natural gas pipeline in the Gulf Arab region. It was developed by Dolphin Energy, a consortium owned by Mubadala Development Company on behalf of the Abu Dhabi government (51%), Total (24.5 %), and Occidental Petroleum (24.5 %). Full capacity for the pipeline was achieved at 2 Bcf/day in early 2008. Looking longer term, depending on gas reserves availability from the North Field, Dolphin may expand the send‐out capacity of the pipeline to 3.2 Bcf/day. Gas‐to‐liquids (GTL): Qatar is the world leader in developing GTL plants with the 34,000 b/day Oryx plant (QP/Sasol) onstream and the 140,000 b/d Pearl Plant (QP/Shell) under construction. These are being developed on a similar integrated project basis to the LNG projects. Source: David Wood (Oil & gas Journal, 2005). Combined GTL and LNG strategies are very effective from a government’s perspective for a country holding large gas reserves. GTL and LNG are selling their products in complementary markets in most cases – GTL into transportation fuels competing with refinery diesel and LNG into power generation (gas‐to‐power) markets. Being involved in both revenue streams reduces the risk of exposure to price collapse due to a fall in market demand in one or other market. Cost overrun risk for government: The opposite impact to fast cost recovery for the IOC is slow revenue streams for the government. This becomes critical for high capital, integrated LNG and GTL projects when cost overruns are involved. Qatar’s Pearl GTL project is an integrated project
Preliminary Report on Fiscal Designs for the Development of Alaska Natural Gas David Wood November 2008 97

incorporating an offshore field development component, a pipeline and a land‐based GTL facility. When the DPSA was originally negotiated (Qatar and Shell) in 2003/2004 the project had a budget of some $2 billion for offshore work and $4 billion for onshore work. By early 2007 when the final investment decision was made the project budget was announced as having escalated to between $14 billion and $20 billion. Under the fiscal mechanism initially envisaged the government suffers from this massive cost overrun as its revenue share becomes substantially delayed, whereas the IOC recovers the cost‐overrun from the high early cost‐recovery allocation. From the government perspective it is important to link forward‐weighted fiscal incentives with clear budget limits. If those limits are breached, then alternative cost recovery mechanisms (less favorable to the IOC) should apply. Such an arrangement can motivate IOCs to improve their cost control. IOCs revenue stream & importance of cost recovery: Rapid cost recovery and a front‐end loading to the profit‐gas/oil split caused by the R‐factor and production sliding scales help LNG and GTL projects in the time‐value sense make a fast return on investment for the IOC. Source: David Wood, Petroleum Review, April 2005
Preliminary Report on Fiscal Designs for the Development of Alaska Natural Gas David Wood November 2008 98

Russia – Sakhalin II The Sakhalin II project is being developed under one of Russia’s few PSA contracts by Sakhalin Energy Investment Company (SEIC), a consortium that up to 2007 consisted of Shell (55%), Mitsui (25%) and Mitsubishi (20%). Gazprom took a 51% position in SEIC in 2007. The distribution of revenues between the consortium and the Russian government is defined in the PSA signed in June 1994 by SEIC and the Russian Federation. Royalty rate: 6% ad valorem charge on gross revenues, paid in kind or in cash equivalent and paid when production of hydrocarbons commences. Profit tax and depreciation: Once SEIC begins to make a surplus in its profit‐and‐loss account, the taxable profit is taxed at a rate of 32%. For the purposes of taxing the profit, capital expenditures are depreciated over three years on a straight‐line basis. Initial losses incurred in the profit‐and‐loss account can be carried over to the next year for a maximum of 15 years. Cost recovery favors IOC: Cost‐recovery allowance is 100%. Although the IOCs undertook investment at their own risk under this PSA, because the oil and gas had already been discovered when the agreement was signed there was no exploration risk involved. Russia in 1994 did not have the technology, capital or offshore operating experience in 1994 to conduct the development. The structure of the PSA enabled the IOCs to shift (they believed) most of the risk of capital cost overruns and gas sales price risks on to the government through the cost‐recovery and rate of return mechanisms. The government only starts receiving its share of revenues once IOCs have recovered both their costs and a 17.5% real rate of return (FANCP mechanism). Once that threshold has been achieved the government then receives 10% of the revenues for two years, and then 50% until the IOC has achieved a 24% real rate of return. Once that second threshold has been achieved the government’s share of profits becomes 70%. Government take of profits is dependent on oil and gas prices and could vary from 60% to > 80% (higher takes for lower prices highlight the overall regressive nature of the contract). For high gas price scenarios the state take should approach 70% of profits. Because the PSA involves additional fiscal elements to the rate‐of‐return drivers (i.e. bonuses, repayment of sunk exploration costs, royalty, profit tax, contribution to the Sakhalin Development Fund), the adverse impact of the FANCP mechanism is to some degree offset by these additional payments. These regressive payments must be paid whatever the extent of cost overrun by the project.
Preliminary Report on Fiscal Designs for the Development of Alaska Natural Gas David Wood November 2008 99

Cost overrun concerns: A risk for the government in deals structured in this way is that the IOC, during the operational phase of the project, could choose to invest more capital, by expanding facilities and/or throughput capacity, and delay the rate of return thresholds being passed and thereby further delaying the government its share of revenues. The economic impact of any cost overrun under the terms of the Sakhalin II PSA results in a loss of income to the state, and a delay in their share of revenues, but not an ultimate a loss of profits to the IOCs. When costs escalated from $10 billion to $22 billion in the period 2004 to 2006 this cost overrun impact is what finally caused the deal to unravel from the terms of the PSA. With such high sunk capital costs the IOCs can only hope to make a significant profit if gas and oil prices remain high. Allowable costs: All costs incurred associated with the project are recoverable with no exclusions or annual limits. Contract term: The duration or term of the Sakhalin II PSA is effectively indeterminate as long as investment continues. The initial phase is set at 25 years, but with the proviso that should the IOCs consider further exploitation of the fields to be economically practicable they can renew the contract without any changes in the PSA terms for a further five years, followed by a further five years ad infinitum. Legislation “grandfathering” PSA terms: Sakhalin II and other PSAs signed in the early years of the post‐Soviet era conflicted with some laws governing the use of Russia’s sub‐soil resources, which is primarily conducted on mineral‐interest fiscal designs. The Russian Parliament passed a law in 1995 giving the PSAs a degree of legitimacy and which was subsequently amended in 1999. While generally supporting the use of PSAs in the Russian oil and gas sector at that time, the new PSA legislation included a number of clauses which conflicted with the Sakhalin II (and Sakhalin I) contracts. Nevertheless, the 1999 law (amending 1995) grandfathered the first two Sakhalin PSAs, in effect exempting them from any discrepancies with 1995 and 1999 legislation. PSAs fell out of favor with President Putin’s government in 2003, and no future ones are to be signed. The problems of delayed government takes from the Sakhalin II contract can in part be blamed for this policy reversal. Rate‐of‐return drivers: The PSA fiscal mechanism uses the defined FANCP and SANCP indices. FANCP means first level of accumulated net cash proceeds, and SANCP means second level of accumulated net cash proceeds. These are cumulative cash flow measures, with uplifted cost adjustments.
Preliminary Report on Fiscal Designs for the Development of Alaska Natural Gas David Wood November 2008 100
For any year FANCP is defined as FANCPt = FANCPt‐1 x (1.175 + r) + NCFt. Where t‐1 is the prior year, r = the current rate of inflation of U.S. industrial goods and NCFt means the net cash flow from the project in the current year. Logically, in the first year of the project FANCPt‐1 will be zero, so in that first year the formula reduces to FANCPt = 1 = NCFt = 1. In development years the NCF (and therefore the FANCP) will be negative as capital expenditures are made prior to oil and gas being produced. With the compounding forward of the negative NCF, the negative FANCP will become larger and larger until eventually the addition of sufficient positive NCF makes the FANCP positive also. At this point the FANCP formula changes back to: FANCPt = NCFt. FANCP methodology is a device whereby each year the SEIC’s target rate of profit (17.5%) is added to any negative cash flows and is compounded forward until sufficient positive cash flows have been added so that the rate of profit on the project to date (using the standard internal rate of return [IRR] calculation) reaches 17.5%. It reaches this IRR when the FANCP first becomes positive. The SANCP is calculated in the same way but with the factor 1.175 (+17.5%) replaced by 1.24 (+24%). The SANCP index remains negative once the FANCP has been initially reached. In the financial year following a year with the positive FANCP index and the negative SANCP index, which corresponds to the company’s rate of return of no less than 17.5%: 50% of the value of hydrocarbons produced goes to the government and 50% to the IOCs. Once the SANCP becomes positive also, the petroleum split becomes 70% to the Russian Party and 30% to the IOC. It is highly unlikely that the SANCP index will now ever become positive unless extremely high prices are sustained. In such a case the government would not receive 70% of the petroleum until the contract expires. Signature bonus for the signing of Phase One (oil development) of the project: This was $30 million paid out in installments in 1996, 1997 and 1998. A further bonus of $20 million was paid when Phase Two (LNG development) began. Repayment of past costs: The exploration costs incurred by the government prior to signing the PSA were repaid to the Russian Party in quarterly installments of $4 million, commencing in the fourth quarter of 1999 and continuing until $80 million has been disbursed. When the company has exceeded a 17.5% real return on its investment and the share of hydrocarbon revenues switches to 50/50, the disbursement of a further $80 million commences in the same manner.
Preliminary Report on Fiscal Designs for the Development of Alaska Natural Gas David Wood November 2008 101

Sakhalin Development Fund: IOCs pay to the Sakhalin Oblast a contribution to the Sakhalin Development Fund of $100 million spread over five years from the commencement of development activities (1997). Early cost overruns materialized in Phase One of the project: By 2003, SEIC expenditures on Phase One already involved a substantial overspend, with total expenditures reported to have reached US$1.6 billion– an overspend of more than US$800 million. A large part of the overrun was the result of additional contract work required to make the Molikpaq platform suitable for operations in the deeper waters and extremely adverse conditions of the Okhotsk Sea. Also SEIC realized that the geological structure of the PA deposit is more complex than was initially forecast. This had resulted in an early and dramatic decline in the oil flow from the PA field. A US$300 million secondary recovery investment was required to restore pressure in the reservoir. Costs were also adversely affected by the decline in the value of the U.S. dollar. The Russian Audit Chamber claimed that SEIC had generally overpaid non‐Russian suppliers and contractors. Gas pipeline re‐routing and environmental restoration costs have contributed to Phase Two cost overruns.
Preliminary Report on Fiscal Designs for the Development of Alaska Natural Gas David Wood November 2008 102

Trinidad & Tobago 58.5% of the LNG imported into the U.S. in 2007 came from Trinidad, making it of huge strategic significance to the U.S. for international gas imports in the futures. With exports to twelve countries it is also the second most diversified LNG exporter worldwide (after Algeria) and 7th largest by total volumes. This is largely due to the merchant model being adopted by operators BP and BG in trading certain LNG cargoes on short‐term contracts to the highest bidders. High prices received for these cargoes are ultimately netted back to the upstream fiscal mechanisms applied to the production licenses in the case of PSC terms. Trinidad has grown its gas production from 0.8 bcf/day in 1998 to 3.8 bcf/day in 2007, with 7% growth on the year from 2006. Trinidad’s LNG exports in 2007 are detailed in the following table:
Country LNG Exported (bcf) LNG Exported (bcm)
1 US 450.6 12.76
2 Mexico 21.9 0.62
3 Dominican Republic 12.7 0.36
4 Puerto Rico 26.1 0.74
5 Belgium 2.5 0.07
6 France 2.1 0.06
7 Spain 73.8 2.09
8 Turkey 2.1 0.06
9 United Kingdom 13.8 0.39
10 India 7.4 0.21
11 Japan 20.1 0.57
12 South Korea 7.8 0.22
Total 641 18.15
Data: from BP Statistical Review June 2008 The country has benefited from a large amount of foreign investment into the natural gas sector, with BP Trinidad and Tobago (BPTT) leading these efforts. Other important players in the natural gas sector include British Gas (BG) and Chevron. The Atlantic LNG Company, a consortium led by BP, BG, and Repsol‐YPF, operates four LNG trains at Point Fortin, on the southwestern coast of Trinidad. The first LNG train was completed in March 1999, with subsequent trains completed in August 2002, April 2003, and April 2006. The four trains have capacity to produce a combined 14.8 million metric tons (mtpa) of LNG per year (775 bcf of regasified natural gas). There has been discussions between Atlantic LNG and the government Preliminary Report on Fiscal Designs for the Development of Alaska Natural Gas David Wood November 2008 103

of Trinidad and Tobago over the construction of a fifth and sixth train, though there are no firm plans as of yet to pursue these projects. More gas reserves need to be proved up before further development will be sanctioned. A Ryder Scott audit of reserves commissioned by the government in 2006 established a natural gas reserves to production (Gas R/P) ratio of some 12 years. The country also has major methanol and fertilizer plants as further infrastructure to monetize its gas. There is a lot of emphasis on increasing exploration activity. In 2007 four rigs were active in exploratory drilling, and 16 wells are planned for the last quarter of 2007 and 2008. In 2007 B.P and EOG drilled a deep dry exploration well ‐ Ibis Deep to 19,000 feet at a cost of US$80 million. Exploration drilling from 2008 to 2010 is expected to consume some US$600 million of investment. Trinidad and Tobago also contains the majority of the Caribbean's oil production. In 2007, the country produced close to 200,000 barrels per day of total petroleum liquids production, of which about 150,000 barrels per day was crude oil, the remainder mostly consisting of natural gas liquids (NGLs). Trinidad and Tobago consumes about 30,000 barrels per day of oil, allowing it to export more than75% of its liquid production. The largest crude oil producers in Trinidad and Tobago include BHP Billiton and state‐owned Petrotrin, which each control around one‐quarter of the country’s crude oil production. Important producers of NGLs in Trinidad and Tobago include the Phoenix Park gas processing plant and the Atlantic LNG project, which together produced a about 50,000 bbl/d of NGLs in 2007. In recent years, the country’s liquid petroleum production has rebounded following many years of decline, mainly due to NGL’s associated with expanding LNG developments. Petroleum legislation: Petroleum exploration and production activities are governed by the Petroleum Act (No. 46) of December 1969, as amended, and regulations made under it. The Petroleum Act vests petroleum resources on public lands and submarine areas in the state and authorizes the Minister of Energy and Energy Industries to grant licenses to oil companies. The Petroleum (Amendment) Act 1974 gave the minister the additional power to award petroleum rights under production sharing contracts (PSCs). Fiscal mechanisms employed: The country operates an historic mineral‐interest concession system which applies to older licenses (onshore and offshore) awarded in the 1970s and 1980s (e.g. Amoco, now part of BP, established substantial reserves and production of oil, condensate and gas offshore southeast Trinidad under such concessions), which have a traditional royalty and tax fiscal mechanism. Most LNG produced in the first two trains of the Atlantic LNG plant come via BP from these concessions. In the past two decades Trinidad & Tobago have also
Preliminary Report on Fiscal Designs for the Development of Alaska Natural Gas David Wood November 2008 104

issued PSCs and much of the production of gas from BG and oil from BHP are produced under such contracts. PSCs provide the government with a greater share of the revenue stream, which has led to pressure from the government over a number of years on BP to modify its fiscal arrangements. There were two model PSCs contracts issued in 2001; one for standard onshore and offshore areas and the other for deepwater (>200 m) areas only. The fiscal mechanisms are somewhat unique in that oil and gas price thresholds determine the production sharing and special petroleum tax rates. There is also a significant difference between oil and natural gas fiscal terms in both mechanisms. Mineral Interest (Royalty/Tax) Fiscal Mechanism Royalty: The royalty rate is specified in each license and ranges from 10% to 12.5% of the field storage value, which gives a 9% refining and handling allowance. Royalty is payable quarterly. In later licenses the royalty rate is 12.5%. Effective November 1998 a separate royalty formula was applied to onshore production for the benefit of small‐scale production and reserves. The formula was based on the production per well and the price of oil. The rate was set a 0% rate for well production up to five barrels per day. A ceiling of 10% applied in the formula. Government pressure to regularize gas royalty rates: For natural gas pre‐2005 the royalty was fixed at US$0.02 per million btu (mmbtu). As part of the discussions with the industry, the government sought in 2005 to ensure that the levels of taxation were equitable across all the industry players. They “asked” the largest energy company, BP Trinidad and Tobago, to consider accelerating the onset of a 10% gas royalty that had been due to commence from 2017. BP agreed to a volume equivalent to 10% of gas sold for LNG to pay such a royalty. This royalty has been gradually implemented in a phased manner beginning in 2005 and in 2008 is fully effective. IOC wants to build more LNG capacity: BP also was “asked” in 2003 to “sell” some gas at preferential prices for use in power generation, to which it agreed. As part of the Train 4 negotiation BP agreed to supply the government with 100 mmcf/d of “free” gas that could be used to support a new gas‐fired power generation plant planned for La Brea in SW Trinidad ~12 km from Point Fortin. BP provides all of the 450 mmscf/d for ALNG Train 4. BP’s 2 Tcf Chachalaca discovery (2005) does not necessarily mean an Atlantic LNG Train 5 because the
Preliminary Report on Fiscal Designs for the Development of Alaska Natural Gas David Wood November 2008 105

government has several options on how to use the gas. BP will be squeezed on terms to get approvals for further LNG trains, possibly having to offer the government a higher equity share. Taxation instruments: There are three levels of taxation levied on the income from crude oil production. Income from oil production is taxed through a petroleum profits tax (PPT), a supplementary profits tax (SPT) and the Unemployment Levy. The PPT yields about 60% of the total tax levied and the SPT about 30 % of the total tax levied. Petroleum profits tax (PPT) is payable at 50% (progressively increased from 45% in November 1992). [Unified corporation and individual taxes are at a flat rate of 25%, down from 35% five years ago, but this does not apply to petroleum operating companies.] Unemployment levy is payable at 5% of chargeable income [effectively increases the PPT rate by 5%]. Green fund levy: 0.1% of gross income/receipts. The following are deductible in the calculation of PPT and unemployment levy:
• Royalty
• Supplemental petroleum tax
• Petroleum production levy
• Operating costs (including workover costs)
• Depreciation of capital expenditure
• Exploration and development‐dry holes and expensed components of side‐track costs
• Signature bonuses (amortized over five years)
• Production bonuses (expensed as incurred)
• Exploration costs from non‐producing licenses
• Heavy oil allowance Heavy oil allowance (uplift) has applied (since 1988 offshore) in respect of capital expenditure on offshore heavy oil projects (18° American Petroleum Institute (API) or lower). 150% of the project costs may be claimed, spread over six years, with 60% allowed in the first year and 18% annually over the remaining five years. In 1992 the offshore allowance was extended to onshore. Tangible development costs are capitalized and depreciated from the start of commercial production with an initial allowance of 20%, a first year allowance of 20% (i.e. effectively 40% in
Preliminary Report on Fiscal Designs for the Development of Alaska Natural Gas David Wood November 2008 106

Year 1 was removed in 2005 amendments), with the residue being depreciated over five years straight‐line (prior to 1992 depreciation was calculated on a declining balance basis). Exploration costs and intangible expenditure are written off from the start of commercial production either on a declining‐balance basis according to the following formula:
Residual expenditure x [annual output/(annual output + potential future output)]. Or, by one‐fifth of expenditure, whichever is faster. The alternative has been accelerated over the years. It was one‐eighth of expenditure before 1992 and one‐twentieth of expenditure before 1981. 2005 PPT allowance amendments: 1) removal of the first year allowance; 2) the shift to quarterly tax payments calculated on a current year basis; 3) non‐deferral of capital allowances and allowing decommissioning and abandonment costs only when they are incurred; and 4) limiting deductible management charges to 2 percent of expenditure. Ring‐fence for PPT: The only ring‐fence applied is a ring‐fence around all exploration and production activities in Trinidad and Tobago for PPT purposes. Thus unsuccessful exploration costs may be offset against income from any producing operation. In the 2007‐2008 annual budget statement, the government stated that during the six‐year period ending fiscal year 2007 the government collected revenues amounting to $162.7 billion, of which $69.7 billion was derived from the energy sector and $93 billion came from the rest of the economy. The high level of energy tax collections reflected buoyant oil and gas prices and the government’s successful efforts at oil and gas tax reform, which increased the country’s tax take from any windfall revenues received by the companies. Domestic supply obligation: There is a requirement in the regulations to supply local crude oil needs once output exceeds a specified level, but not at discount prices. Supplemental petroleum tax (SPT) is levied on gross income, less deductions derived from liquids production. In November 1992 the following sliding scale SPT was introduced, the rate dependent on the oil price and the award date of the exploration and production license. It was applied retrospectively to all licenses replacing a previous two‐tier SPT, which distinguished between base crude oil and additional (incremental) crude oil, which was relevant to field rehabilitation projects. Where a company has operations under licenses issued both before and after January
Preliminary Report on Fiscal Designs for the Development of Alaska Natural Gas David Wood November 2008 107

1988 it can elect (irrevocably) for the consolidation of gross income and expenditure from each licensed area, with SPT charged at the higher rates listed above for onshore and offshore. Pre‐2005 the tax base for the SPT was determined after deducting capital allowances which invariably included expenses in respect of both oil and gas exploration and development. Under the 2005 amendments SPT is computed on gross crude oil income with no allowances except for the royalty allowance, but at slightly lower rates. To compensate for the increase in the taxable base, the rate of tax was lowered slightly in 2005. The rate reduction is somewhat larger at oil prices below US$21 per barrel than at higher oil prices. The trigger price at which SPT becomes payable has also been increased slightly.
Preliminary Report on Fiscal Designs for the Development of Alaska Natural Gas David Wood November 2008 10
Since 2005 SPT payments are based on a weighted average price of crude calculated quarterly instead of annually.
8
Ring‐fence for SPT: There are separate ring‐fences around onshore and offshore exploration and production activities for SPT purposes. Petroleum production levy: An additional payment to a national fund is payable and is the lesser of 3% of total income or a portion of the total fund payable by the industry equivalent to the company's production as a proportion of total production in Trinidad. This is deductible from PPT but not from SPT. Midstream taxation (e.g. LNG and other gas processing facilities and pipelines): A special corporate income tax rate of 35% applies (higher than the standard rate of 25%). Withholding taxes (rates effective from January 2008): The rate is 10% on any distribution made, but it is 5% where such distribution is made to a parent company.= On any payment made to a person other than a company, the rate is 15%. On any payment made to a company, the rate is 15%, but where there is a double taxation agreement in force or where an order is made under Section 96 of the Income Tax Act, the withholding tax shall be such lesser rate as may be therein provided. There is no treaty with the U.S., but one exists with Canada. Production‐sharing contract (PSC) fiscal mechanism New IOC participation in the Trinidad and Tobago oil sector is now established through a model PSC. The critical biddable terms of such PSCs include the work programs, cost‐recovery percentages, profit splits for both crude oil and natural gas and production and signing bonuses. The balance of the model PSC terms is negotiated on a project‐by‐project basis and varies to some degree. Contract term: The PSC provides for an initial six‐year exploration period, typically divided into three phases, only the first of which is obligatory. In the event of a commercial discovery, the contract has a total duration of 25 years. Further five‐year extensions are available, subject to negotiation with the Ministry of Energy and Energy Industries. The entitlements of the IOCs include cost recovery and profit share. Cost recovery allocation: The PSC defines the maximum portion of production available for recovery of capital and operating expenses on an annual basis. If the portion of production available for recovery of costs is insufficient in any calendar year, the unrecovered costs are carried forward to the next year for the life of the contract. If the portion of production available exceeds that required for cost recovery, then the excess becomes part of the profit
Preliminary Report on Fiscal Designs for the Development of Alaska Natural Gas David Wood November 2008 109

share. Maximum cost recovery rates are negotiable/biddable and can be on a sliding scale linked to cumulative production – ceilings around 40% are typical. Different cost categories are depreciated following different rules: ∙ Exploration costs are expensed. ∙ Capital cost are depreciated over four years, commencing in the year in which such expenditure is incurred, with 40% recoverable in the first year and 20% recoverable in each of the next three years. ∙ Annual operating costs are written of in the year in which they are incurred. ∙ Annual administrative overhead costs up to a limit specified in accounting procedures may be written off the year incurred. IOCs taxation exemption and fiscal stability: The IOC's liability for petroleum profits tax, unemployment levy, and other taxes and impositions upon income or profits are met from the government’s share of profit oil or gas. Ring‐fence for cost recovery: This is around the contract area. Profit share: The portion of production left after cost recovery becomes the available profit share. A percentage of this pool is made available to the IOC as its profit oil or gas. The IOC’s percentage varies on a sliding scale basis: for oil, it is based on a combination of production rates and price; for natural gas the sliding scale is based on production rates only or in some cases also a combination of production rates and price. The IOC’s share of annual production therefore varies from year to year as a function of costs, price and production volumes.
Preliminary Report on Fiscal Designs for the Development of Alaska Natural Gas David Wood November 2008 110

Example sliding scales for PSC profit sharing: Pipeline options? In 2005 the government was considering a Canadian proposal to build a 4,500‐km subsea pipeline at a cost of $2 billion running from Trinidad to southern Florida. The cost in 2008 would be substantially higher, and there is probably not enough gas to justify it even if it could be done technically and at a viable cost.
Preliminary Report on Fiscal Designs for the Development of Alaska Natural Gas David Wood November 2008 111

Tunisia In 1999, the Tunisian government introduced the new hydrocarbon law, aimed at stimulating activity in the country. Law 99‐93 was published on 17 August 1999. The law is based upon the decree Law of 1985 (and subsequent amendments) but includes significant changes. The new legislation was designed to encourage foreign company participation in exploration by allowing more flexibility in licensing whilst also providing tax incentives. The new fiscal terms were automatically applied to new prospecting or exploration permits granted after 20 February 2000 (the effective date of the new law). The requirement for change to stimulate activity in Tunisia was precipitated by: 1) a decline in license awards; 2) a decline in exploration activity; 3) a lack of significant discoveries and the size of field developments; and 4) withdrawal of several major oil companies based on small‐scale reserves expectations. Key changes introduced in 1999:
• IOC has right to use associated or non‐associated gas for power generation (maximum capacity of 40mw).
• Provision for abandonment – A tax deductible (concessions) or cost‐recoverable (PSCs) provision to cover future abandonment costs may be built during the last five years (offshore fields) or three years (onshore fields) of production.
• IOC has the right to constitute a provision of up to 20% of the profit for investments in exploration activities.
• IOC has the right to consider the custom services royalty on hydrocarbon exports as a tax credit.
• Income tax is fixed at 50%, if ETAP (Tunisian NOC) elects to participate in a concession at a rate equal to or more than 40%.
• Minimum royalty rates are fixed at 10% for oil and 8% for gas increasing as a function of R‐factor if ETAP does not participate in a concession.
• Income tax is to be paid by ETAP on contractors’ behalf and is based on the value of contractors’ share of profit oil and/or profit gas.
• The gas price for local market sales is fixed by decree – gas price was indexed to 85% of the value of Mediterranean HSFO price. From 2000, the gas price was indexed to 80% of the value of Mediterranean LSFO.
• Authorization for long‐term production tests can be granted subject to an agreed program and a fixed royalty rate of 15%.
Impact of 1999 fiscal changes: The new terms were designed to provide encouragement for new entrants and to persuade existing players to remain in the country. The terms were Preliminary Report on Fiscal Designs for the Development of Alaska Natural Gas David Wood November 2008 112

particularly aimed at companies with undeveloped gas fields and gas‐prone acreage. The higher gas price was aimed at encouraging companies to develop small gas fields that were not previously economic under the old gas price, and incentivizing companies that are exploring in gas prone areas. The 1999 hydrocarbon law has proved more favorable for small independents and local companies, with increased value and more incentive to commercialize technical discoveries. However, the problem is attracting major companies because of the lack of large discoveries. Summary of 1985 Fiscal Terms There were no bonuses and both mineral‐interest and PSC contracts were used. Exploration and development costs were depreciated at 100%/year and 30%/year, respectively, in the year in which they were incurred or carried forward for recovery in future years. Exploration costs were uplifted by 30% for recovery. Royalty rate was on a sliding scale for contractor based upon a cumulative revenue/cumulative expenditure ratio – an R‐Factor: From 0 to 0.5 R‐Factor royalty was 2% (oil and gas) From 0.5 to 0.8 R‐Factor royalty was 5% oil (4% gas) From 0.8 to 1.1 R‐Factor royalty was 7% oil (6% gas) From 1.1 to 1.5 R‐Factor royalty was 10% oil (8% gas) From 1.5 to 2.0 R‐Factor royalty was 12% oil (9% gas) From 2.0 to 2.5 R‐Factor royalty was 14% oil (10% gas) From 2.0 to 2.5 R‐Factor royalty was 15% oil (11% gas) From 3.0 to 3.5 R‐Factor royalty was 15% oil (13% gas) Greater than 3.5 R‐Factor royalty was 15% oil (15% gas) The above rates assumed NOC participation. If NOC did not participate then the royalty rates paid by IOC up to R‐Factor of 1.5 were 10% for oil and 8% for gas. Income tax rate was also on a sliding scale for contractor based upon a cumulative revenue/cumulative expenditure ratio – an R‐Factor: From 0 to 1.5 R‐Factor income tax rate was 50% oil (50% gas) From 1.5 to 2.0 R‐Factor income tax rate was 55% oil (50% gas) From 2.0 to 2.5 R‐Factor income tax rate was 60% oil (50% gas) From 2.5 to 3.0 R‐Factor income tax rate was 65% oil (55% gas) From 3.0 to 3.5 R‐Factor income tax rate was 70% oil (60% gas) Greater than 3.5 R‐Factor income tax rate was 75% oil (65% gas)
Preliminary Report on Fiscal Designs for the Development of Alaska Natural Gas David Wood November 2008 113

Government had an option to back‐in up to 55% following a discovery. The government/NOC was fully carried through exploration and appraisal costs. In some contracts NOC equity participation increased according to the project R‐factor on a negotiable basis. For example, if R‐factor <1.5 the NOC equity share is 30%; if the R‐factor is 1.5 to 2.0 the NOC equity share is 40%, R factor > 2.0 NOC equity share 50%. NOC would then be carried through 30% of capital costs before production started. After production started, NOC participated 30% and repaid development expenditure share (past costs) from its production share. NOC participation in revenue, development capital costs and operating costs progressively increased to 40% and then to 50% triggered by the R‐Factor thresholds, but continued to be carried any exploration costs throughout the life of the license. The ring‐fence for exploration costs was the whole of Tunisia, meaning that unsuccessful exploration costs in one license could be offset against revenue from a discovery in another license. These terms resulted in a government take of profits of some 75% to 85% depending on NOC’s equity share in the field. Summary of 1999 Fiscal Terms Domestic market obligation (DMO) is applied to field oil production. 20% of field oil production is sold to the domestic market at 90% of realized oil price (or 10% discount to international prices).
Preliminary Report on Fiscal Designs for the Development of Alaska Natural Gas David Wood November 2008 114

Royalty is paid on sales revenues of oil, gas and NGLs after adjustment for DMO in the case of oil. The royalty rate is on a sliding scale, calculated annually, based on R‐Factor and NOC participation percentage.
Preliminary Report on Fiscal Designs for the Development of Alaska Natural Gas David Wood November 2008 11
Income tax rate is based on taxable revenue of liquids and gas, but may be calculated from different sliding scales for oil and gas depending upon R‐factor, or at a fixed 50% rate if NOC elects to participate in the field development.
5

Cost depreciation for income tax: Operating costs and any bonuses & fees paid are expensed. Exploration, intangible development and abandonment costs are expensed beginning from production startup. Tangible development costs are depreciated on a 4‐year straight‐line schedule from production startup. The depreciation rates are 30% for the first 3 years, and 10% in the fourth year. Depreciation schedules have to be calculated at the project level for R‐factor and at the IOC level for Income tax. Capital cost uplift: Exploration & development costs may qualify for uplift ranging from 10% ‐ 30% (negotiable), subject to approval from the minister. Losses can be carried forward for up to three years. Project R‐Factor is calculated from the following formula: R‐Factor revenue = Total (cumulative) project sales revenue less project royalty (previous year) less project income tax (previous year) plus project tariffs (negotiation may exclude these). Divided by: R‐Factor cost = Total (cumulative) project operating costs plus total (cumulative) project capital expenditure (excluding abandonment costs). Equity participation: Negotiable up to about 50%. This fiscal element has the most impact on IOC revenue and profit streams and significantly limits their potential upside. In large fields it is fair to assume that ETAP (NOC) will elect to exercise its option to participate up to a high percentage equity interest.
Preliminary Report on Fiscal Designs for the Development of Alaska Natural Gas David Wood November 2008 116
United Kingdom The United Kingdom (UK) has a history of fiscal instability and complexity in the petroleum sector, which has undoubtedly resulted in losing potential investments in the past decade. The problem with changing of fiscal terms in the UK is that recent tax increases (2002 and 2005) were made in the face of declining production, falling capital investment, and the country becoming a net importer of gas in recent years. By the end of the 1970s the UK had some of the toughest terms in the world, with a government take in excess of 90% in some cases. Over the course of the Margret Thatcher premiership and into the mid‐1990s terms were changed to respond to diminishing prospects of large new fields and declining exploration and development in a low oil‐price environment. By 1993 government take for new fields, with royalty and petroleum revenue tax (PRT) removed, was just the 33% from corporate income tax, which by the mid‐1990s had dropped to just 30%. With the exception of Ireland, such terms offered the lowest fiscal take in the world for new field developments. Government take for old legacy fields like Ninian and Forties is some 75% where PRT still applies (a tax on profits from production with a number of complex allowances, safeguards and uplifts applied), but royalty was finally removed in 2003. The UK’s North Sea fiscal regime has three tiers:
1. Ring‐fence corporation tax (RFCT), which is similar to the normal corporation tax regime but with 100% capital allowances on most capital expenditure, and an enhanced exploration supplement (EES). The EES provides an annual uplift of 6% in the value of unused capital allowances due to qualifying exploration and appraisal (E&A) expenditure that are carried forward each year for a maximum of 6 years. In addition, the regime is ring‐fenced, which prevents taxable profits from oil and gas extraction in the UK and the United Kingdom Continental Shelf (UKCS) from being reduced by losses from other activities.
2. 20% supplementary charge (SC) levied on oil and gas companies’ profits as computed for the ring‐fence corporation tax above, but without allowing a deduction for financing costs. This was introduced at a 10% rate in 2002 and extended to 20% from January 2006 in the 2005 budget.
3. Petroleum revenue tax (PRT), which is special field‐based tax currently levied at 50%. PRT does not apply to fields given development consent on or after 16 March 1993. PRT is deductible against RFCT and SC.
The elements result in a fiscal take for new field developments of slightly above 50%, which is still amongst the lowest in the world, but with no guarantees of fiscal stability for investors and
Preliminary Report on Fiscal Designs for the Development of Alaska Natural Gas David Wood November 2008 117

a lack of alignment between government’s fiscal aspirations and the requirements of a mature industry. IOCs control much of the UK oil and gas infrastructure: Key oil and gas pipelines to shore, gas processing facilities and oil storage and loading terminals. IOCs earn substantial revenues from third‐party tariffs paid for access to this infrastructure. Access to this infrastructure on reasonable terms has proved to be a major obstacle for some independent companies and has delayed the development of some projects. It has also raised fiscal issues for the government in terms of taxation allowances and what is included as upstream and midstream infrastructure. Lack of transparency in gas pricing mechanisms between affiliates: The UK does not operate a norm price system as in Norway, and the fiscal authorities have problems with the major IOCs in terms of establishing what are realistic market prices for short‐term and long‐term gas sales agreements, particularly where an upstream affiliate is selling gas to a midstream or downstream affiliate at lower than market prices to avoid higher upstream taxation. Clear rules and more transparent gas pricing would benefit the tax raising authorities. Few incentives offered to industry to commit to long‐term investments: The UK government was heavily criticised by the IOCs and UK service sector and industry representative groups for the introduction of the supplementary charge in 2002 and its increase to 20% from 2006. The criticism was based on the declining reserves and activity in the sector, which in the industry’s opinion required incentives and not fiscal penalties. It was also criticised for the lack of consultation involved prior to it being imposed. The UK now has a reputation for fiscal instability, which reportedly has deterred some majors from making investments. Problems associated with high‐cost environment in global terms: The North Sea is a high‐cost investment and operating area, and has been so since the 1970s. There is not sufficient competition in the specialist upstream service and construction sector, and many service providers and suppliers have charged premium rates for offering services and supplies to North Sea operations. IOC profitability and government fiscal take is negatively influenced to a significant degree by this situation. Fiscal measures that encouraged more competition would probably both increase reserves and increase fiscal take and project profitability on a US$/boe basis. Fiscal instability in their home countries has wider implications for IOCs: The UK government has been much criticized by the IOCs for its volatility in fiscal terms and its failure to provide the incentives needed to encourage more exploration and development activity. The fiscal changes targeted at the oil and gas sector in the UK (coupled with royalty increases and other fiscal
Preliminary Report on Fiscal Designs for the Development of Alaska Natural Gas David Wood November 2008 118
changes in US and Canada) in recent years are also cited by the IOCs as undermining their attempts to secure greater fiscal stability for their projects in developing countries. Third‐party access and use‐it or lose‐it rules Some strategic UK gas industry infrastructure (pipelines, storage facilities, gas processing plants, LNG receiving terminals) are controlled by a small number of major IOCs and gas utilities that have been granted full or partial exemption from third‐party access (TPA) in order to secure their commitments to invest in building that infrastructure. Such a situation has at various times restricted competition in the industry and restricted access for smaller producers and operators. Some suggest that policies and provisions for TPA should be more rigorously negotiated with investors and, if and when TPA exemptions are granted, then transparent and workable tariff schemes for third‐parties and use‐it or lose‐it rules/conditions should accompany any TPA exemption granted to infrastructure capacity and be more effectively applied.
Preliminary Report on Fiscal Designs for the Development of Alaska Natural Gas David Wood November 2008 119

United States of America (USA) The United States’ federal and state governments employ a mineral‐interest (concessionary or royalty/tax) fiscal regime applied to oil and gas production licenses for onshore and offshore properties, with individual states controlling and receiving much of the destination value revenues generated by the sale of oil and gas from their own fiscal regimes. The U.S. is a federal system, and that each of the three levels of government – federal, state and local – has the authority to tax within its sphere, subject only to restrictions placed on it at the next higher level. In most Lower 48 states a traditional mineral‐interest system applies, i.e. the leaseholder pays a royalty, based on the value of the recovered mineral resources, and one or more taxes, based on taxable income, as is the case for Alaska. One of the most recent compilations of government takes, which compares take values from several sources published over the past 15 years, is the U.S. Government Accountability Office (GAO) Report Ref: GAO‐07‐676R Oil and Gas Royalties May 2007, which is discussed in some detail in Section 2.4 of this report. That GAO study concluded that the federal government’s take from U.S. Offshore Continental Shelf (OCS) production is among the lowest government takes worldwide. That conclusion remains realistic, although for new leases awarded in 2008 royalty rates have increased to 18.75%. But the GAO conclusion ignores the significance of the bid bonuses in the U.S. fiscal design, which are among the highest in the world in terms of dollars/acre. The U.S. government has received over $65 billion in bonuses for OCS leases since 1953. Upfront bonus payments increase the government fiscal take of profits on a discounted basis substantially and act as a highly regressive fiscal instrument. In lease sales, leases are awarded to the highest bidders on the payment of an upfront bid bonus. The bid bonus is comparable to a signature bonus associated with many worldwide oil and gas upstream contracts. The main state and federal fiscal elements are therefore:
• Upfront (bid) bonus.
• Lease rental payments.
• Royalty (state, federal and private).
• State taxes including corporate income tax (SCIT), property taxes and severance or production taxes.
• Federal corporate income tax (FCIT). Offshore Leasing
Preliminary Report on Fiscal Designs for the Development of Alaska Natural Gas David Wood November 2008 120

The Department of Interior’s Minerals Management Service (MMS) grants offshore leases for exploration periods of 5, 8, or 10 years. Onshore it is the Bureau of Land Management (BLM) that fulfills that role. In August 2008 the president lifted the executive prohibitions on drilling on the OCS along the Atlantic and Pacific coasts and urged Congress to rescind its ban as well, which they have done. Congress agreed in late September and allowed the moratorium to expire; it had been in place since 1981. Since 2005 offshore wells not covered under the ban have supplied about 32% of total U.S. oil production. The OCS and oil‐shale leasing moratoriums expired on 1st October 2008, so more exploration activity is expected in both onshore and offshore regions of the Lower 48. Federal Tax Legislation The Congress this fall also passed legislation paying for the extension of renewable energy tax credits by imposing new taxes on the oil and gas industry. The provisions would raise $17 billion to help finance $42 billion in clean energy financial incentives by freezing the tax deduction for U.S. oil and gas companies' domestic activities, tightening rules by which oil and gas companies pay taxes on income earned overseas, and freeing money from the U.S. general fund by increasing payments into the oil spill liability trust fund as new drilling is considered. Fiscal Tightening Measures Gaining Support As various states (e.g. California and Alaska) continue to review their fiscal designs and consider tightening their fiscal regimes in the environment of sustained high oil and natural gas prices, the federal government has also revisited its position with respect to royalty rate increases, the possible introduction of a windfall profits tax and applying tougher limitations on foreign tax credits. The U.S. Senate Finance Committee in 2007 defeated a bill that proposed a raft of punitive fiscal measures, including a 13% excise tax on future Gulf of Mexico production. Those measures were forecast to raise some US$29 billion in additional fiscal revenues. However, in 2009, with a new president and new Congress, such measures can expected to be back on the agenda and, if prices remain high, they will probably have more chance of being adopted. Third‐Party Access (TPA) to infrastructure The MMS published in June 2008 a final open‐access rule for offshore oil and gas pipelines. The MMS regulations that implement the Outer Continental Shelf Lands Act require operators of pipelines to provide such access to owner and non‐owner shippers for every permit, license,
Preliminary Report on Fiscal Designs for the Development of Alaska Natural Gas David Wood November 2008 121
easement, or right‐of‐way issued to a pipeline for transportation of oil or gas on or across the OCS. TPA is a crucial issue to be included in a regulatory framework designed to promote natural gas upstream development and exports. This will have relevance to Alaska gas infrastructure and implementing measures to avoid major oil companies limiting access to third‐parties. Deepwater Royalty Relief In 2008 there are more than 7,000 leases in the GOM that account for 25% of the nation's domestically produced oil and 15% of the domestically produced natural gas. This is a testament to the high level of industry investment and the success of the prevailing fiscal system at creating a commercial and competitive investment environment. Fiscal design adjustments were introduced in the 1990s to encourage deepwater activity. Deepwater exploration and production was particularly stimulated by the introduction of royalty relief in the Gulf of Mexico. Prior to 1995 for water depths less than 400 m the royalty rate was one‐sixth (16.66%) and in excess of 400 m the royalty rate was one‐eighth (12.5%). At the time with high costs and risks of operating in deepwater producing companies perceived this difference as an inadequate incentive to encourage deepwater investments. In 1995 a more significant incentive scheme was introduced providing royalty relief based on sliding scales of cumulative production and water depth. For leases acquired between November 1995 and November 2000, the Outer Continental Shelf Deepwater Royalty Relief Act (DWRRA) provided economic incentives for operators to develop fields in water depths greater than 200 m (656 ft). The incentives suspended royalty payments on the initial: 17.5 million boe produced from a field in 200‐400 m (656‐1,312 ft) of water. 52.5 million boe for a field in 400‐800 m (1,312‐2,624 ft) of water. 87.5 million boe for a field in greater than 800 m (2,624 ft) of water. The DWRRA expired on November 28, 2000, but leases acquired during the time royalty relief was active retain the incentives until their expiration. In spite of some expensive legislation drafting omissions that failed to include limitations of the royalty relief when oil prices increased above US$30/barrel, they have broadly achieved their objective. Reduction of royalty payments was also made available through an application process for deepwater fields leased prior to the DWRRA but which had not yet gone on production. Provisions effective from 2001
Preliminary Report on Fiscal Designs for the Development of Alaska Natural Gas David Wood November 2008 122

are specified on a lease basis, and are subject to change with each lease sale and the government has the ability to alter them in line with prevailing market conditions. Royalty‐relief provisions were retained until recently and oil producers have aggressively invested under this regime. For example, Garden Banks Block 245, a small 5,000‐acre tract in greater than 400 meters of water in the 22nd August 2001 lease sale, drew a winning bid of more than US$8 million. Then, in the Central Gulf of Mexico Lease Sale 206 (March 2008), new and tougher fiscal terms were applied, and for the first time no deepwater royalty relief was issued with these leases. Indeed the royalty rate for blocks offered in all GOM water depths was increased to 18.75% from 16.67%. Yet record bids were placed by the industry. GOM provides a good example of how royalty relief can be used temporarily (e.g. over little more than a decade) to stimulate investment and risk taking by the oil producers. If that investment proves to be successful and new technologies emerge to meet the technical challenges, as has been the case in GOM, then risks for future investments become much reduced. This progress, together with evolving market conditions (e.g. demand and/or price increases), can result in rapid development of the industry. In such circumstances the fiscal incentives can be removed and, as can be seen fiscal instruments can even be toughened for the region, without necessarily dampening the industry’s appetite for investment and activity. March 2008 GOM Lease Sales Two federal sales of offshore oil and natural gas leases in the eastern and central planning areas of the Gulf of Mexico attracted a total of more than $3.7 billion in apparent high bids. Central Gulf Lease Sale 206 and Eastern Gulf Lease Sale 224, both conducted by the MMS, were held back to back on 19th March 2008 in New Orleans. Central Lease Sale 206, held first, attracted $3,677,688,245 in apparent high bids, setting a record in U.S. leasing history for high bids since area wide leasing began in 1983. In Lease Sale 206 the agency received 1,057 bids from 85 companies on 615 tracts. For Eastern Lease Sale 224, held second, MMS received 58 bids from 6 companies on 36 tracts resulting in $64,713,213 in apparent high bids. Central Sale 206 offered 5,569 tracts comprising about 29.8 million acres in federal areas off Louisiana, Mississippi, and Alabama. The acreage lies 3 to 230 miles offshore in 3 to 3,400 m of water. About 34% of the tracts receiving bids in Sale 206 were in ultra‐deep water, more than 1,600 m. The deepest tract to receive a bid was Lloyd Ridge Block 286, which lies in 3,076 m of
Preliminary Report on Fiscal Designs for the Development of Alaska Natural Gas David Wood November 2008 123

water. The highest bid received on a block was US$105,600,789 for Green Canyon Block 432. More Lease Sale Proceeds Made Available to States Lease Sale 224 was the first under the revenue‐sharing provisions of the Gulf of Mexico Energy Security Act of 2006 (GMESA 2006). The states of Alabama, Mississippi, Louisiana, and Texas will share in 37.5% of the high bids and future revenues generated (including from bid bonuses, rental payments, and royalties) from the acreage leased in the gulf's eastern planning area. Congress approved this revenue sharing to aid the Gulf states after the devastation of Hurricane Katrina in 2005. In addition, 12.5% of revenues from these two lease sales will be deposited into the Land and Water Conservation Fund for use by states to enhance parklands and for other conservation projects. Corporate Income Tax (CIT) The CIT burden in the Unites States is a combination of the federal and state taxes. The federal rate is 35%; however, this rate can be reduced to 31.85% under provisions of the American Jobs Preservation Act. State rates vary from 0% to 12%, with the average being about 6.54% (2008 data sourced from: www.taxfoundation.org/taxdata/show/23034.html). Since, unlike Canada, the state tax is deductible against the federal tax, the combined U.S. rate lies in the approximate range 35% to 42%. Alaska and U.S. CIT rates are compared with OECD CIT rates in Section 2.2 (see Figures 2.2.15 to 2.2.17). These relatively high CIT rates need to be taken into consideration when formulating the overall fiscal design as does the tax base on which the corporate tax rate is applied. CIT is a progressive fiscal element (i.e. the income has to be created before it can be taxed), but at high rates it leaves slightly less room for less progressive taxes on net and gross cash‐flow components without increasing the overall state take to levels that would unreasonably impact project commerciality. Fiscal Mechanisms of Onshore Lower 48 States The fiscal design in simplistic terms is royalty and tax, but in detail royalty rates vary and the recipient of that royalty varies. Moreover, taxes typically include production taxes (severance and ad valorem) and income taxes (state and federal) with localities often imposing property taxes. Substantial bid bonuses are also sometimes paid upfront by successful bidders in signing the leases. This leads to the total state take from all fiscal instruments generally amounting to between some 50% and 65%, which is below average on the current international scale. However, bid bonuses, royalty and production taxes are regressive in their mechanisms (because the production taxes typically do not allow deductions for such costs) and this can
Preliminary Report on Fiscal Designs for the Development of Alaska Natural Gas David Wood November 2008 124

have a significant impact on the commercial viability of marginal production in periods of low oil or gas price or high cost. Private and State Royalties There is much oil and gas activity on land owned by states, the federal government and private individuals. In contrast to other areas of the world, many private land owners in the U.S. hold the mineral rights and are therefore entitled to private royalty fees. Private royalty rates vary depending upon location and many other factors. If the land is located in a highly prospective exploration area, it will command premium royalty rates. The same applies to larger tracts of land (e.g. a large farm) in moderately prospective areas. The spectrum of private royalty rates negotiated varies from as low as 12.5% to as high as 33.33%, with many falling in the range 16.67% to 25%. As the royalty agreements are confidential contracts, information on exact rates for specific regions is anecdotal. In prolific producing areas like the Texas/Louisiana Gulf Coast, land owners seem to expect a private royalty of between 20% and 25%, with the large owners securing rates at the high end of that range. Texas state royalties (i.e. on state‐owned lands) are on a sliding scale starting at 20% and increasing to 25%, depending on when during the primary term a lease a well is drilled or the lease is unitized with an adjacent lease. This mechanism is designed to encourage the lease‐holders to drill as soon as possible and not sit on fallow acreage. For example, if a lease has a five‐year primary term, the royalty on production would only be 20% if the discovery well was drilled during the first two years of the lease term, but would increase to 22.5% if the well was drilled during years three and four, and increase further to 25% if the discovery well was not drilled until year five. This means that delays can be costly for the producers. Primary lease terms vary from 3 years to up to as much as 10 years for remote, lightly explored and some offshore areas. If oil or gas production is established during the primary term, then the lease is perpetuated by that production. This is referred to as "held by production"(HBP). If there is no initial production when the lease is signed, a well would have to be drilled during the primary lease term in order to establish production. If wells drilled in a lease are unsuccessful and no production is established from them or the existing wells in a lease at the end of primary term, then the lease would expire. In some states, e.g. Louisiana, where the state periodically offers land for competitive bidding, the state royalty may be a bidding variable, along with an upfront cash bonus and the length of the primary term of the lease. The higher bidder will win the lease and lock in the royalty rate with the award.
Preliminary Report on Fiscal Designs for the Development of Alaska Natural Gas David Wood November 2008 125

Royalties on Federal Lands Where the lands are federal lands, federal statutes require that the party producing the oil and gas pay the U.S. Department of the Interior royalties based on the value of the oil and gas actually produced. For onshore federal leases, the Minerals Lands Leasing Act prescribes the share or royalty rate as 12.5% (1/8th) the value of production; for offshore leases, the Outer Continental Shelf Lands Act prescribes the royalty rate as 16.67% (1/6th) the value of production. Offshore and in areas of greater exploration activity and prospectivity, federal royalty rates may be up to 18.75%, with bidding rules set by the Bureau of Land Management (BLM). On federal lands the royalty share of the value produced can be paid in dollars or in kind, at the election of the Department of the Interior’s MMS. Areas of U.S. Holding the Most Reserves The bulk of U.S. oil reserves are located in just four regions (including all lands within a region irrespective of ownership): Texas (23%), offshore (19%), Alaska (18%) and California (16%), according to the federal Energy Information Administration. Some the largest onshore fields discovered in recent years (e.g. Bakken shale play in the Williston Basin of western North Dakota and eastern Montana) are mostly not located on federal lands. Colorado, New Mexico, Utah and Wyoming together contain about 10% of the nation’s oil reserves and about 30% of natural gas reserves. About 90% of onshore federal drilling permits were issued in those four states during the 2007 fiscal year, according to federal public lands data. Many of those permits focused on deep, tight‐gas oil shale gas plays. The fiscal design of seven states: California, Colorado, Louisiana, New Mexico, Texas, Utah and Wyoming, are therefore of interest to compare with Alaska’s prevailing fiscal design. Production Taxes (including Severance and Ad Valorem) Most of these states levy a severance tax (on gross production), but the rates vary. Also owners of oil or gas production in some states are charged an ad valorem (property) tax which also varies, at least in part, according the volume of oil or gas produced. The two taxes are sometimes combined into a single aggregate rate. Some taxation information presented here
comes from the Interstate Oil and Gas Compact Commission (IOGCC) summary of statutes, rules and regulation (2007). The details of the taxation systems may have been amended since this
Preliminary Report on Fiscal Designs for the Development of Alaska Natural Gas David Wood November 2008 126
2007 information was compiled. However, in terms of comparison with Alaska, it is clear that property and production taxes in 2007 had combined effective rates in the six Lower 48 states reviewed below of between 5% and 11%, compared to some 37% in Alaska following the adoption of the state’s 2007 fiscal reforms. The IOGCC data used for the following comparison provides very limited explanations of how individual taxes are calculated or what deductions for those taxes are allowed. In some cases it is unclear what is being taxed at the rates given. Hence, only superficial comparisons with Alaska can be made based upon such data. California (IOGCC, 2007) [Note: IOGCC data does not indicate the tax base to which these rates are applied or whether they are all on the same base.] There is no statewide severance tax on oil and gas production in California. There are ad valorem (property) taxes in California, administered by each county. There is a small statewide assessment on oil and gas produced, which goes to support the California Department of Conservation’s Division of Oil, Gas, and Geothermal Resources (Division). The assessment rate is established in June of each year, and is based on the division’s estimated budget for the ensuing fiscal year and the total amount of assessable oil and gas produced during the prior calendar year. This oil and gas assessment tax rate is then imposed on each barrel of oil and each 10,000 cubic feet of natural gas produced. The assessment rate for fiscal year 2008/2009 is $0.0790758 (for 2007/2008 it was $0.061889, for 2005/2006 it was $0.0538953). Minimum royalty rate is 16.67% and rises on a sliding scale. A vote to initiate an oil and gas severance tax in 2006 was defeated. Colorado (IOGCC, 2007) [Note: IOGCC data does not indicate the tax base to which these rates are applied or whether they are all on the same base.] Energy producers in Colorado pay property taxes to local counties and school districts on the value of their production and their equipment. They also pay severance taxes to the state on the value of the resources that are irretrievably taken from the state during extraction, and pay royalties to the federal government on production occurring on federally owned lands, a portion of which is returned to state coffers. Producers also operate on state‐owned lands and pay royalties that are deposited in the Public School Fund, a perpetual public trust for the support of state public schools. Some information is taken from (State of Colorado Office Of State Planning And Budgeting Fact Sheet, Nov, 2007)
Preliminary Report on Fiscal Designs for the Development of Alaska Natural Gas David Wood November 2008 127

Gas severance tax = 2.0% to 5.0%, depending on amount of gross income. Gas ad valorem tax = 4.0% to 10.0%, depending on county. Total gas tax burden = 5.0% to 10.0%. Oil severance tax = 2.0% to 5.0%, depending on amount of gross income. Oil ad valorem tax = 4.0% to 10.0%, depending on county. Total oil tax burden = 5.0% to 10.0%. Severance tax on oil and gas: Gross Oil and Gas Income Colorado Severance Tax Rate Under $25,000 2% of gross income $25,000 and under $100,000 $500 plus 3% of the excess over $24,999 $100,000 and under $300,000 $2,750 plus 4% of the excess over $99,999 $300,000 and over $10,750 plus 5% of the excess over $299,999 Ad valorem rates vary from county to county ranging from 4% to 10%. Ad valorem taxes are paid by the producer to the local governments (cities and counties). 87.5% of ad valorem taxes are allowed as a credit against severance tax. Depending on the applicable severance and ad valorem tax rates, working or royalty‐interest owners can receive a full refund of severance taxes. As a result, the total production taxes paid can be limited to the ad valorem tax rate. Ad valorem taxes paid on production from stripper wells (on which no severance tax was withheld) are not included in the deduction. The severance tax rate on oil and gas is nominally 5.0% for most producers in Colorado. Comparatively, the nominal severance tax rate is 6.0% in Wyoming, 3.75% in New Mexico, 5.0% in Utah, 8.0% in Kansas, 3.0% in Nebraska and 7.0% in Oklahoma. However, because of deductions and offsets against ad valorem tax, Colorado has an effective tax rate (i.e. all revenue coming from severance, property, income and sales tax [IOGCC data do not explain how sales tax is applied]) of some 5.7 % for oil and natural gas producers. This compares with the reported effective rate of its neighboring states: New Mexico (9.4%), Oklahoma (7%) and Wyoming (11.2%). Tax and Royalty Revenue from Oil and Gas Production in Colorado ($ millions) Fiscal Year Local Property Taxes Severance Taxes Federal Mineral Lease Revenue 2001‐02 $105.3 $57.5 $45.1 2002‐03 $129.9 $32.6 $49.5 2003‐04 $105.5 $125.1 $79.4 2004‐05 $180.3 $152.0 $101.0
Preliminary Report on Fiscal Designs for the Development of Alaska Natural Gas David Wood November 2008 128

2005‐06 $224.5 $234.3 $143.4 2006‐07 $328.8 $145.1 $123.0 Source: State of Colorado Office of State Planning and Budgeting, Fact Sheet November 2007. To place these values for Colorado in perspective relative to Alaska the most productive single well in Alaska generated substantially in excess of $100 million of revenue. Louisiana (IOGCC, 2007) [Note: IOGCC data does not indicate the tax base to which these rates are applied or whether they are all on the same base.] Gas severance tax, full rate = 26.9 cents per mcf Incapable oil well gas rate = 3 cents per mcf Incapable gas well gas rate = 1.3 cents per mcf Total gas tax burden = 1.3 cents up to 25.2 per mcf Oil severance tax, full rate = 12.50% of value Oil severance tax, incapable rate = 6.25% of value Oil stripper well rate = 3.125**% Total oil tax burden = 3.125% to 12.50% **Exempt if the gross taxable value is less than $20 barrel Crude oil and condensate is taxed at a full rate of 12.50% and crude oil only at an incapable rate of 6.25% of value. There is a stripper well rate of 3.125% of value for crude oil only. Gas is taxed at a full rate of 26.9 cents per mcf, and the rate is redetermined July 1 of each year. The incapable rates are as follows: (a) oil well gas – 3 cents per mcf (b) gas well gas – 1.3 cents per mcf New Mexico (IOGCC, 2007) [Note: IOGCC data does not indicate the tax base to which these rates are applied or whether they are all on the same base.] Gas severance tax = 3.75% Gas ad valorem production tax = varies due to county derived rate Gas school tax = 4.0% Gas conservation tax = 0.19% gas ad valorem equipment tax = county derived rate Total gas tax burden = approximately 9.14% Oil severance tax = 3.75%
Preliminary Report on Fiscal Designs for the Development of Alaska Natural Gas David Wood November 2008 129

Oil ad valorem tax = varies due to county derived rate Oil school tax = 3.15% Oil conservation tax = .19% Oil ad valorem equipment tax = county derived rate Total oil tax burden = approximately 8.29% Historical tax incentives: (a) Well‐workover projects ‐ 2.45% severance tax on the excess of the production projection for both oil and natural gas. (b) Production restoration projects ‐ zero severance tax rate for ten years on natural gas and oil. (c) Indian intergovernmental tax credit ‐ 75% of the lesser of: (1) The aggregate amount of severance‐type taxes imposed by the Indian nation, or (2) The aggregate amount of severance‐type taxes imposed by the state. (d) Qualified enhanced oil recovery projects ‐ 1.875% severance tax rate on oil. (e) Stripper well properties ‐ incentive rates apply both to severance tax and school tax. Note: In 2005 all incentive programs for oil were sunset based upon high oil prices. Texas (IOGCC, 2007) [Note: IOGCC data does not indicate the tax base to which these rates are applied or whether they are all on the same base.] (a) Severance taxes:
Crude oil/condensate, 4.6% of value. Natural gas, 7.5% of value.
(b) Regulatory tax: crude oil 3/16ths of 1 cent per barrel. (c) Oil field cleanup regulatory fee:
Crude oil/condensate, 5/8th of 1 cent per barrel. Natural gas, 1/15th of 1 cent per mcf.
(d) Oil spill fee: crude oil/condensate 2 cents/bbl for each barrel transferred through a marine terminal in Texas coastal waters. Exemption or reduction of severance tax as follows:
Preliminary Report on Fiscal Designs for the Development of Alaska Natural Gas David Wood November 2008 130
(a) Gas from high‐cost gas wells is entitled to a reduction in tax for the first 120 months. Total reduction in the tax cannot exceed 50% of drilling and completion costs of the well bore (incentive became permanent as of September 1, 2003). (b) Crude oil from some enhanced oil recovery projects (reduction of tax) and an additional reduction for crude oil produced from enhanced recovery using anthropogenic carbon dioxide. (c) Crude oil/gas well gas/casing head gas produced from wells that are certified by February 28, 2010, as inactive two years (exemption). (d) Incremental oil/casing head gas from oil leases with minimal oil production in 1996 that improved production between September 1, 1997 and December 31, 1998 (reduction of tax). (e) Marketed casing head gas previously vented or flared (exemption from tax). Utah (IOGCC, 2007) [Note: IOGCC data does not indicate the tax base to which these rates are applied or whether they are all on the same base.] Severance tax: (a) Effective January 1, 2004, the severance tax rate for natural gas is as follows: (1) 3.0% of the value up to and including the first $1.50 per mcf for gas. (2) 5.0% of the value from $1.51 and above per mcf for gas. (b) Effective January 1, 2004, the severance tax rate for oil is as follows: (1) 3.0% of the value up to and including the first $13 per barrel for oil. (2) 5.0% of the value from $13.01 and above per barrel for oil. (c) Effective January 1, 2004, the severance tax for natural gas liquids is 4% of the taxable value for natural gas liquids. Conservation tax: A 2‐mill fee is levied and assessed on the value at the well of oil or gas produced, saved, and sold or transported from the premises where the oil or gas is produced. Ad valorem property tax: For the taxable year beginning January 1, 1992, the taxable value of the underground oil and gas rights shall be determined by discounting future net revenues to their present value as of
Preliminary Report on Fiscal Designs for the Development of Alaska Natural Gas David Wood November 2008 131

the lien date of the assessment year and then subtracting the value of applicable exempt federal, state and Indian royalty interests. The value of the production equipment shall be considered in the value of the oil and gas reserves. Other tangible property shall be separately valued at fair market value. Exemption or exceptions: (a) Severance tax: No tax is imposed upon:
(1) The first $50,000 annually in gross value of each well or wells. (2) Stripper wells, unless the exemption prevents the severance tax from being treated
as a deduction for federal tax purposes. (3) The first 12 months of production for wildcat wells started after January 1, 1990. (4) The first six months of production for development wells started after January 1,
1990. (5) Governmental interests (royalties). (6) Oil or gas used in drilling or completion operations for recycling or repressuring
purposes. (b) Conservation tax: No tax is imposed upon:(1) Governmental interests (royalties).
(2) Oil or gas used in drilling or completion operations or for recycling or repressuring purposes. (c) Ad valorem property tax: No tax is imposed upon exempt federal, state and Indian royalty interests. (d) Recompletion or workover tax credit: Working interest owners participating in the expenses of recompletions or workovers are entitled to a severance tax credit equal to 20% of the amount paid for the recompletion or workover. The tax credit is limited to $30,000 per well during each calendar year. (e) Incremental production incentive: A 50% reduction in the severance tax rate is imposed upon the incremental production achieved from an enhanced recovery project initially approved by the board as a new or expanded enhanced recovery project on or after January 1, 1996. Wyoming (IOGCC, 2007) [Note: IOGCC data does not indicate the tax base to which these rates are applied or whether they are all on the same base.] Gas severance tax = 6.0% Gas ad valorem tax = 5.9% to 7.7%
Preliminary Report on Fiscal Designs for the Development of Alaska Natural Gas David Wood November 2008 132

Total gas tax burden = 11.9% to 13.7% Oil severance tax = 6.0% Oil stripper well tax = 4.0% Oil ad valorem tax = 5.9% to 7.7% Total oil tax burden = 9.9% to 13.7% Severance tax ‐ 6.0% for oil and gas and 4.0% for oil stripper wells. Administration of stripper well now allows an operator to count the injection wells and producing wells in determining daily lease totals. Ad valorem tax ‐ an average of 5.9 to 7.7%, depending on the school district where the production is located. Conservation tax ‐ a maximum of .0008 of a mill. The 2007 conservation tax mill levy was .0002 of a mill. Exemptions or exceptions: (a) Oil produced from wells that have been shut in for two years will have severance tax reduced to 1.5% for 5 years. This became effective January 1, 1995 with no sunset. (b) Natural gas which is vented or flared under the authority of the Wyoming Oil and Gas Conservation Commission and natural gas which is consumed or reinjected prior to sale for the purpose of maintaining, stimulating, processing, transporting or producing crude oil or natural gas on the same lease or unit from which it was produced has no value and is exempt from taxation.
Preliminary Report on Fiscal Designs for the Development of Alaska Natural Gas David Wood November 2008 133