preliminary results 2007 1 annual results 27 th june 2007
TRANSCRIPT
1 Preliminary Results 2007
Annual ResultsAnnual Results2727thth June 2007 June 2007
2 Preliminary Results 2007
Definitions Like-for-like refers to the comparison of businesses and individual
operating units that have been part of the Group throughout the whole of the most recent financial year and the immediately preceding financial year.
Operating profit for a particular business unit or division within the Group refers to profit before net finance income/charges, taxation, intangible asset expenses, exceptional items and restructuring costs.
Operating margin for a particular business unit or division within the Group means operating profit as a percentage of revenue.
Exceptional items means items which individually or, if of a similar type, in aggregate need to be disclosed by virtue of their nature, size or incidence in order to allow a proper understanding of the underlying financial performance of the Group.
3 Preliminary Results 2007
Robert SpeirsRobert Speirs
ChairmanChairman
4 Preliminary Results 2007
Highlights
Good underlying revenue growth in all core divisions
63 pence per ordinary share returned to shareholders in May/June 2007
Full year dividend of 4.1p, up 10.8%
Further strong growth in profit
Adjusted earnings per ordinary share up 10.4%
Strong start to new South Western rail franchise
New franchise wins: East Midlands, Manchester Metrolink

5 Preliminary Results 2007
Martin GriffithsMartin Griffiths
Finance DirectorFinance Director
6 Preliminary Results 2007
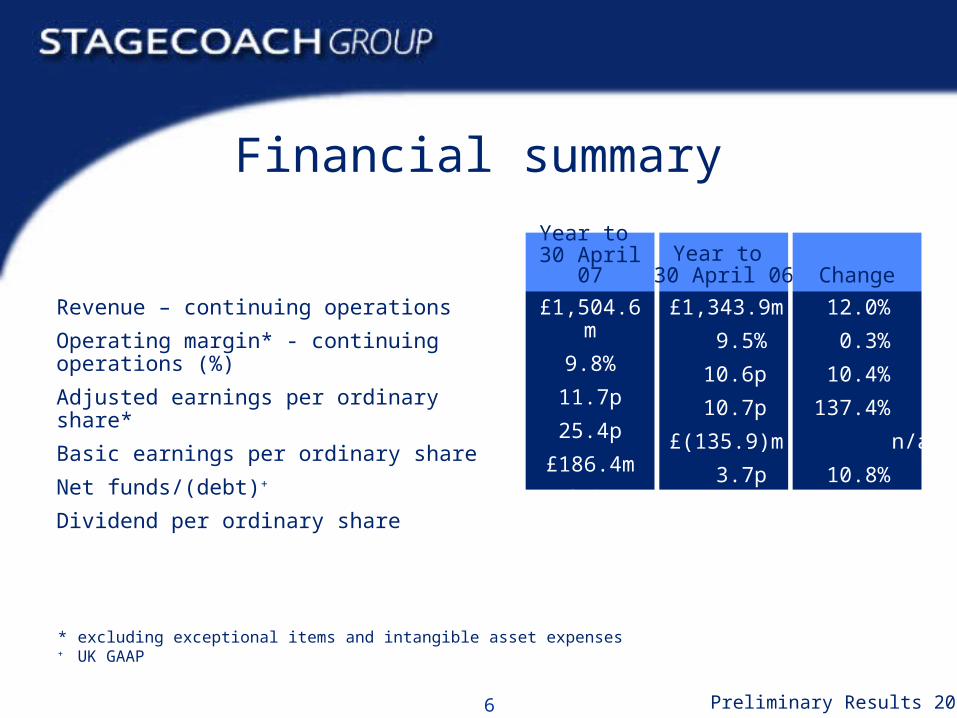
Financial summary
* excluding exceptional items and intangible asset expenses+ UK GAAP
Revenue – continuing operations
Operating margin* - continuing operations (%)
Adjusted earnings per ordinary share*
Basic earnings per ordinary share
Net funds/(debt)+
Dividend per ordinary share
Year to 30 April 07
Year to 30 April 06
£1,504.6m
9.8%
11.7p
25.4p
£186.4m
4.1p
£1,343.9m
9.5%
10.6p
10.7p
£(135.9)m
3.7p
Change
12.0%
0.3%
10.4%
137.4%
n/a
10.8%
7 Preliminary Results 2007
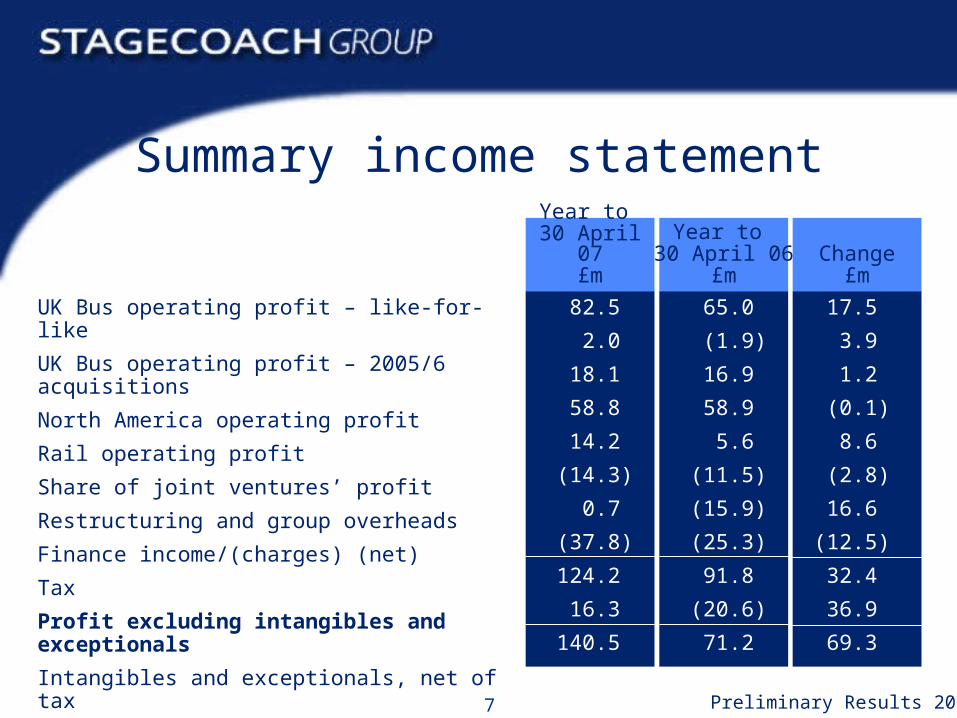
Summary income statement
UK Bus operating profit – like-for-like
UK Bus operating profit – 2005/6 acquisitions
North America operating profit
Rail operating profit
Share of joint ventures’ profit
Restructuring and group overheads
Finance income/(charges) (net)
Tax
Profit excluding intangibles and exceptionals
Intangibles and exceptionals, net of tax
Reported profit from continuing operations
Year to 30 April 07
£m
Year to 30 April 06
£m
82.5
2.0
18.1
58.8
14.2
(14.3)
0.7
(37.8)
124.2
16.3
140.5
65.0
(1.9)
16.9
58.9
5.6
(11.5)
(15.9)
(25.3)
91.8
(20.6)
71.2
Change£m
17.5
3.9
1.2
(0.1)
8.6
(2.8)
16.6
(12.5)
32.4
36.9
69.3

8 Preliminary Results 2007
Development of UK Bus
Operating profit increased
and £267.8m collected from London sale!
Operating profit:
Like-for-like
2005/06 acquisitions
London
Year to 30 April 07
£m
Year to 30 April 06
£m
82.5
2.0
5.2
89.7
65.0
(1.9)
23.6
86.7
Change£m
17.5
3.9
(18.4)
3.0
9 Preliminary Results 2007
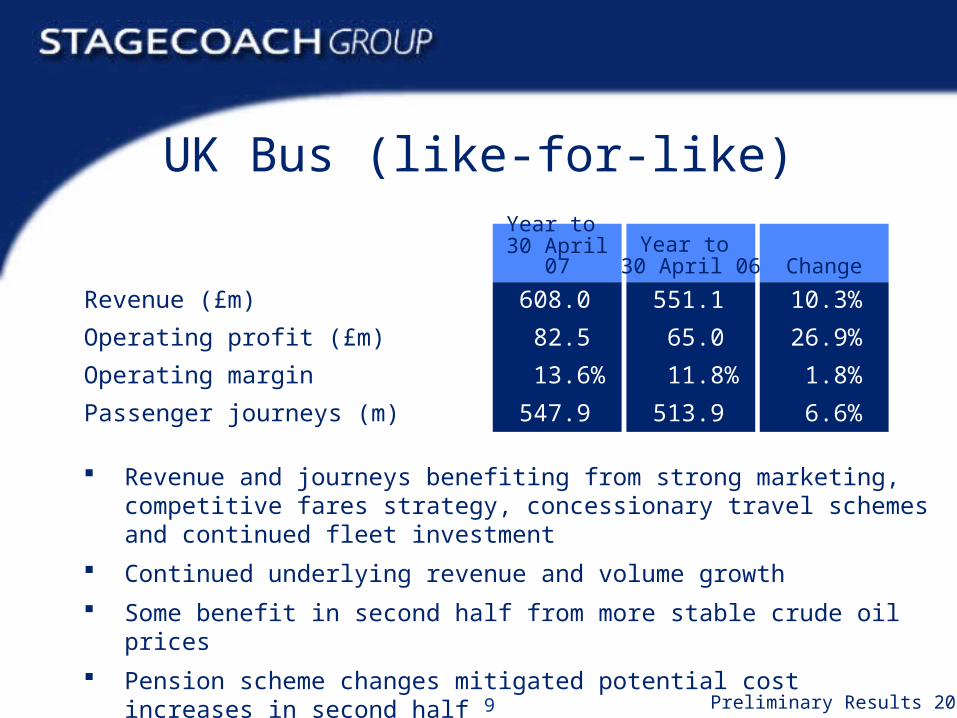
UK Bus (like-for-like)
Revenue and journeys benefiting from strong marketing, competitive fares strategy, concessionary travel schemes and continued fleet investment
Continued underlying revenue and volume growth
Some benefit in second half from more stable crude oil prices
Pension scheme changes mitigated potential cost increases in second half
Stable insurance & claims costs
Revenue (£m)
Operating profit (£m)
Operating margin
Passenger journeys (m)
Year to 30 April 07
Year to 30 April 06
608.0
82.5
13.6%
547.9
551.1
65.0
11.8%
513.9
Change
10.3%
26.9%
1.8%
6.6%
10 Preliminary Results 2007
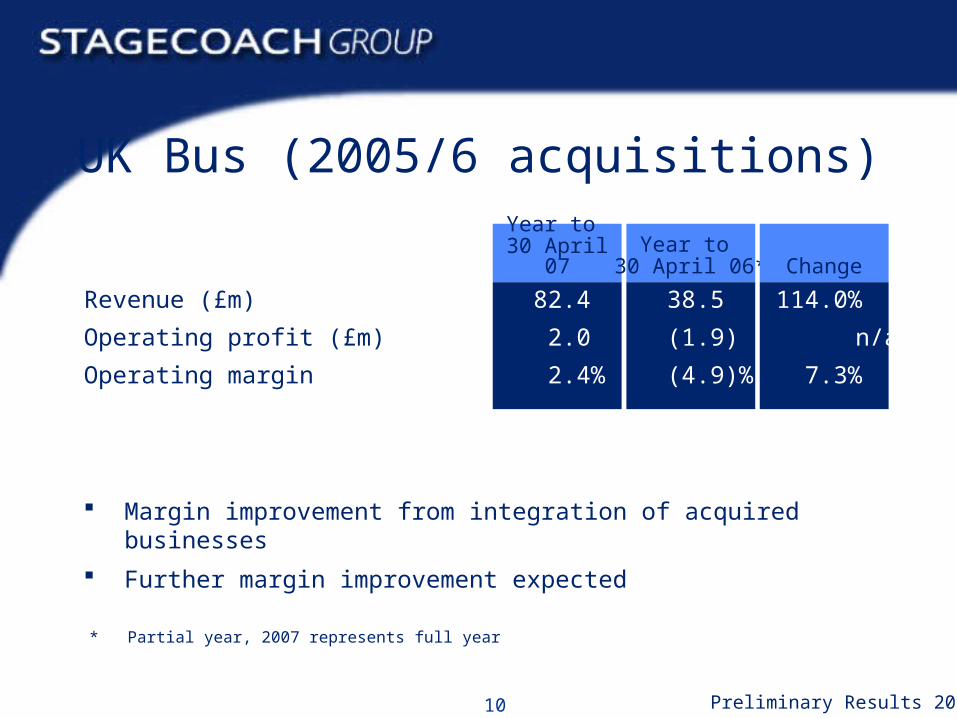
UK Bus (2005/6 acquisitions)
Margin improvement from integration of acquired businesses
Further margin improvement expected
Revenue (£m)
Operating profit (£m)
Operating margin
Year to 30 April 07
Year to 30 April 06*
82.4
2.0
2.4%
38.5
(1.9)
(4.9)%
Change
114.0%
n/a
7.3%
* Partial year, 2007 represents full year

11 Preliminary Results 2007
North America
Further margin improvement from optimising asset deployment
Double digit margin targeted by 30 April 2009
Excellent response in the US to Megabus
Launch of Splash Tours in New York
Revenue (US$m)
Like-for-like revenue (US$m)*
Operating profit (US$m)
Operating margin
Year to 30 April 07
Year to 30 April 06
463.6
455.6
34.6
7.5%
439.5
417.6
30.0
6.8%
Change
5.5%
9.1%
15.3%
0.7%
* Adjusted to exclude revenue from businesses sold or closed during the two years and to include revenue from Canada on a constant currency basis
12 Preliminary Results 2007
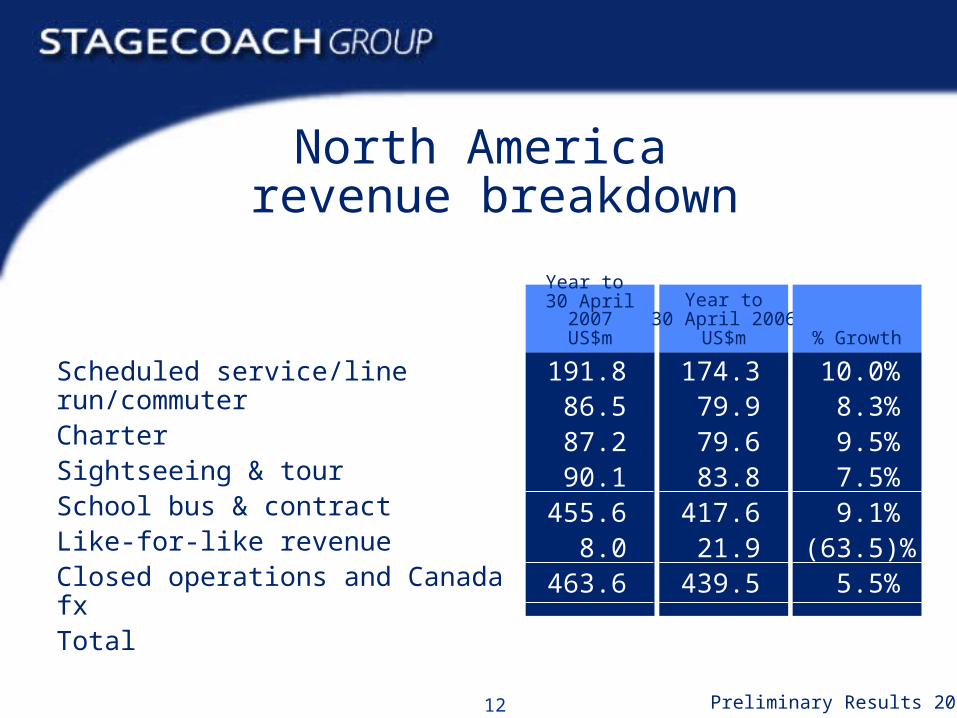
Scheduled service/line run/commuterCharterSightseeing & tourSchool bus & contractLike-for-like revenueClosed operations and Canada fxTotal
Year to 30 April
2007US$m
Year to30 April 2006
US$m
191.886.587.290.1
455.68.0
463.6
174.379.979.683.8
417.621.9
439.5
% Growth
10.0%8.3%9.5%7.5%9.1%
(63.5)%5.5%
North America revenue breakdown

13 Preliminary Results 2007
Rail (wholly-owned)
Strong start to new South Western franchise
Challenging but deliverable revenue and cost targets
Manchester Metrolink from July 2007
East Midlands from November 2007
Sheffield Supertram record passenger volumes
Revenue (£m)
Operating profit (£m)
Operating margin
Passenger miles (000’s)
Year to 30 April 07
Year to 30 April 06
571.5
58.8
10.3%
3,051.6
506.7
58.9
11.6%
2,802.1
Change
12.8%
(0.2)%
(1.3)%
8.9%
14 Preliminary Results 2007
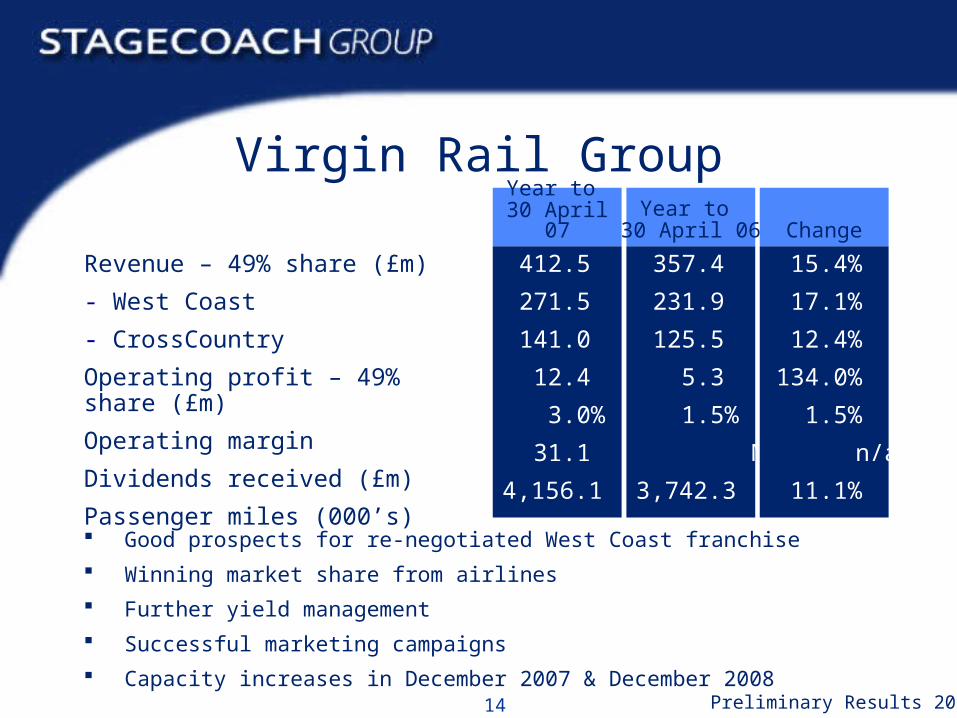
Virgin Rail Group
Good prospects for re-negotiated West Coast franchise
Winning market share from airlines
Further yield management
Successful marketing campaigns
Capacity increases in December 2007 & December 2008
Revenue – 49% share (£m)
- West Coast
- CrossCountry
Operating profit – 49% share (£m)
Operating margin
Dividends received (£m)
Passenger miles (000’s)
Year to 30 April 07
Year to 30 April 06
412.5
271.5
141.0
12.4
3.0%
31.1
4,156.1
357.4
231.9
125.5
5.3
1.5%
Nil
3,742.3
Change
15.4%
17.1%
12.4%
134.0%
1.5%
n/a
11.1%
15 Preliminary Results 2007
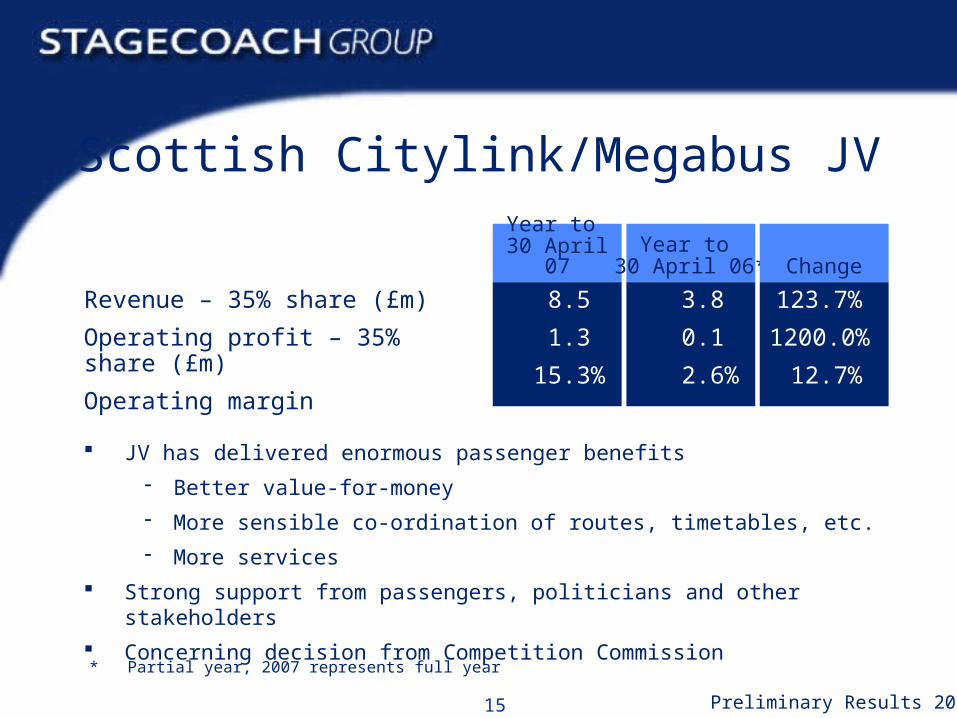
Scottish Citylink/Megabus JV
JV has delivered enormous passenger benefits
Better value-for-money
More sensible co-ordination of routes, timetables, etc.
More services
Strong support from passengers, politicians and other stakeholders
Concerning decision from Competition Commission
Revenue – 35% share (£m)
Operating profit – 35% share (£m)
Operating margin
Year to 30 April 07
Year to 30 April 06*
8.5
1.3
15.3%
3.8
0.1
2.6%
Change
123.7%
1200.0%
12.7%
* Partial year, 2007 represents full year

16 Preliminary Results 2007
Miscellaneous income statement items
Exceptional gains include sale of London Bus and restructuring of main Group pension scheme
£4.3m further gain in second half from London Bus completion accounts and tax finalisation
Further pension credit in second half of £6.1m
Intangible asset expenses (£m)
Group overheads (£m)
Restructuring costs (£m)
Pre-tax exceptional items (£m)
Year to 30 April 07
Year to 30 April 06
(14.7)
(11.1)
(3.2)
169.6
(20.5)
(10.0)
(1.5)
17.4
Change
28.3%
(11.0)%
(113.3)%
874.7%

17 Preliminary Results 2007
Finance income/(charges) and credit ratios
Net finance income/(charges) (£m)
EBITDA from continuing operations and joint ventures excl exceptional items (£m)
Year-end net funds/(debt) (£m)
Net Debt/EBITDA
- Net funds increased by £726m for Return of Value & special pension contributions
Year to 30 April 07
Year to 30 April 06
0.7
229.6
186.4
n/a
2.3
(15.9)
194.0
(135.9)
0.7
0.7
Change
16.6
35.6
322.3
n/a
1.6
18 Preliminary Results 2007
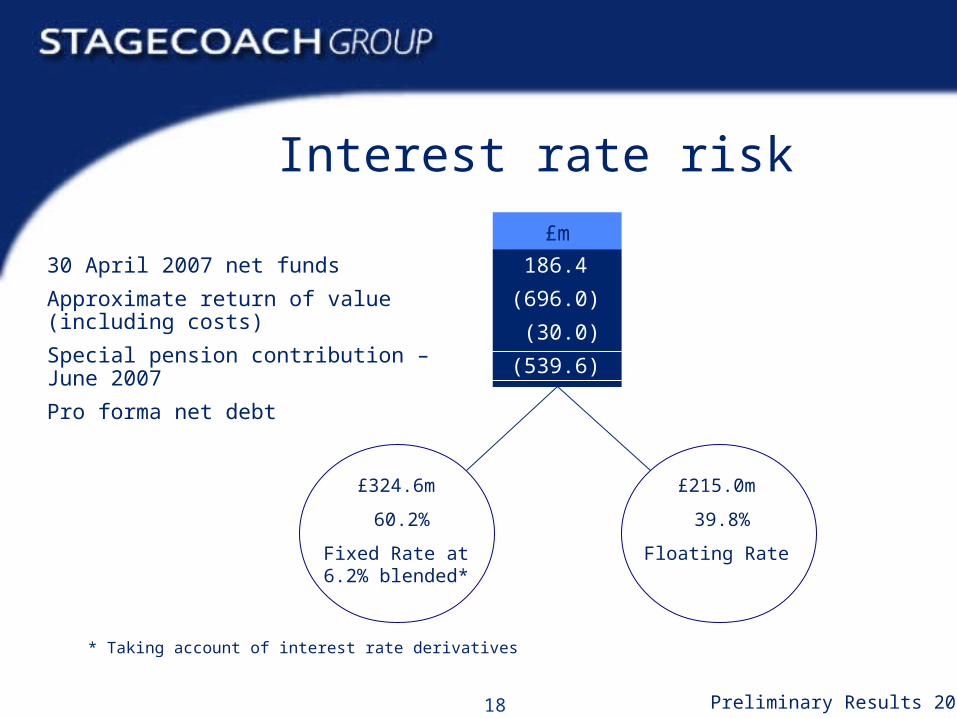
Interest rate risk
30 April 2007 net funds
Approximate return of value (including costs)
Special pension contribution – June 2007
Pro forma net debt
£m
186.4
(696.0)
(30.0)
(539.6)
£324.6m
60.2%
Fixed Rate at 6.2% blended*
£215.0m
39.8%
Floating Rate
* Taking account of interest rate derivatives
19 Preliminary Results 2007
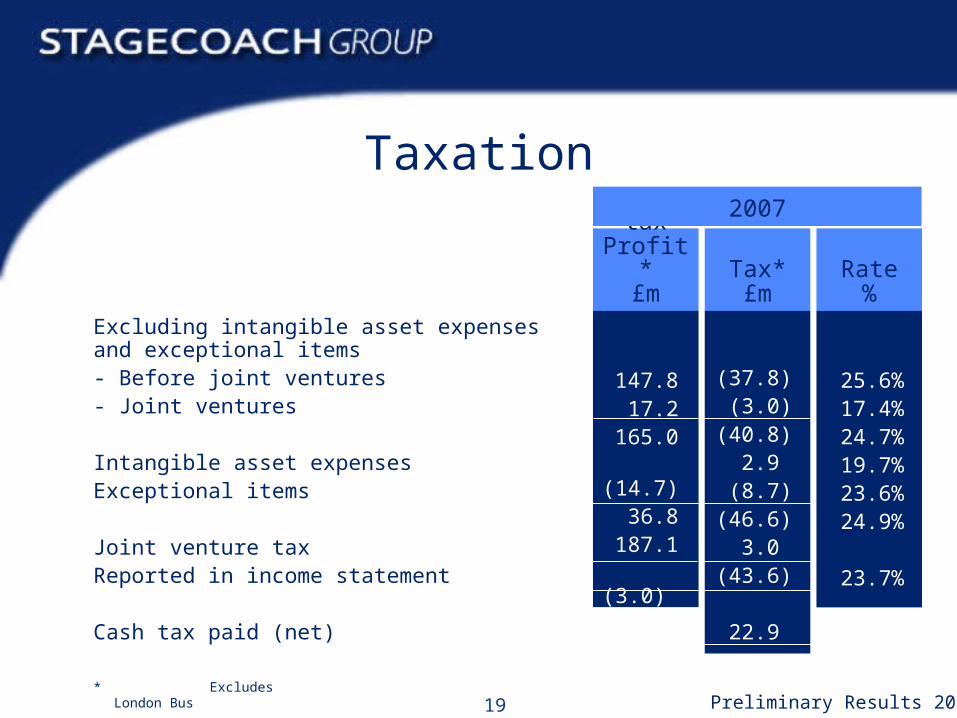
Taxation
Excluding intangible asset expenses and exceptional items- Before joint ventures- Joint ventures
Intangible asset expensesExceptional items
Joint venture taxReported in income statement
Cash tax paid (net)
Pre-taxProfit*
£mTax*£m
147.817.2
165.0(14.7)36.8
187.1(3.0)
184.1
(37.8)(3.0)
(40.8)2.9
(8.7)(46.6)
3.0(43.6)
22.9
Rate%
25.6%17.4%24.7%19.7%23.6%24.9%
23.7%
2007
* Excludes London Bus

20 Preliminary Results 2007
Capital structure
c.£700m return of value completed
Reflects robust business model
Quantum determined with reference to credit ratios, including Net Debt/EBITDA and Debt Service Cover
Ordinary shares currently in issue 707.9m
2007/08 pro forma average Ordinary shares in issue 724.3m
21 Preliminary Results 2007
Pensions
£21.7m* total pension costs (2006: £33.4m)
£18.1m* (2006: £27.1m) continuing operations
IAS 19 pre-tax deficit of £36.2m (2006: £222.2m) for Group
c.£107m of additional contributions to reduce deficit
£77m paid by 30 April 2007
£30m paid in June 2007 further deficit reduction
Rail pension schemes: under IFRS, only the part of the deficit that we expect to fund during the relevant franchise is recognised
Positive changes to schemes* excluding past service adjustment
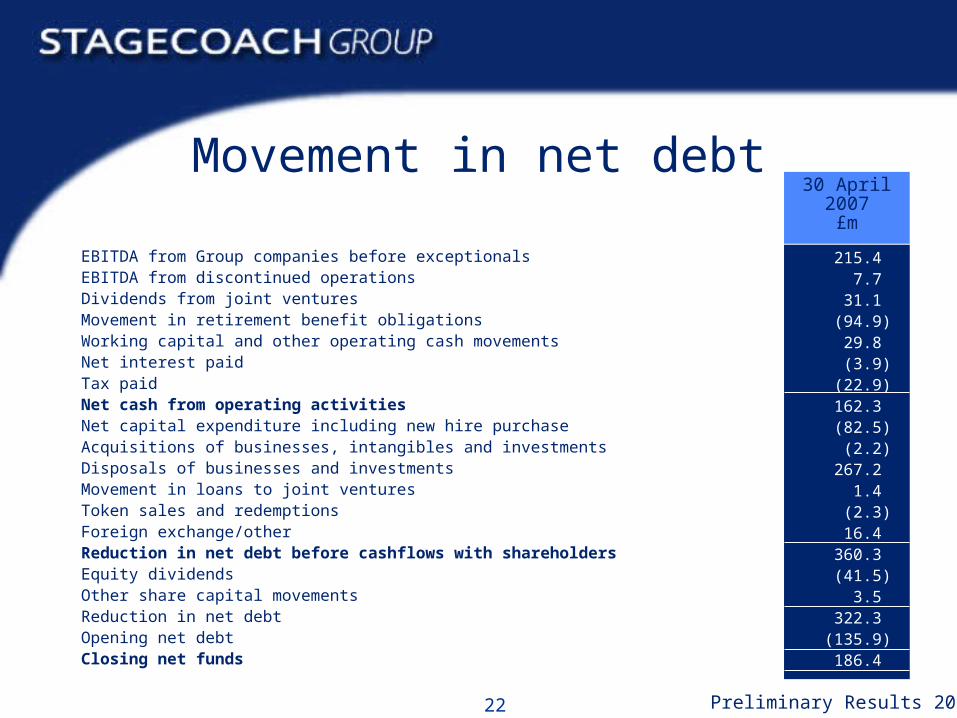
22 Preliminary Results 2007
EBITDA from Group companies before exceptionals EBITDA from discontinued operationsDividends from joint venturesMovement in retirement benefit obligationsWorking capital and other operating cash movementsNet interest paidTax paidNet cash from operating activitiesNet capital expenditure including new hire purchaseAcquisitions of businesses, intangibles and investmentsDisposals of businesses and investmentsMovement in loans to joint venturesToken sales and redemptionsForeign exchange/otherReduction in net debt before cashflows with shareholdersEquity dividendsOther share capital movementsReduction in net debtOpening net debtClosing net funds
30 April2007£m
215.47.7
31.1(94.9)29.8(3.9)
(22.9)162.3(82.5)
(2.2)267.2
1.4(2.3)16.4
360.3(41.5)
3.5322.3
(135.9)186.4
Movement in net debt

23 Preliminary Results 2007
49.0 Nil Nil
49.0
68.121.4
4.093.5
(8.2)(2.8)
Nil(11.0)
59.918.6
4.082.5
19.121.4
4.044.5
Capital expenditure
UK BusNorth AmericaRail
Capex on new hire purchase
£m
Impact ofcapex onnet debt
£m
Disposalproceeds**
£mNet£m
Cash spent on capex*
£m
* Excludes capitalised intangible assets of £13.3m (2006: £0.6m)
** Excludes proceeds from selling businesses
Note: Vehicles with a capital value of £12.1m were acquired by UK Bus during the year on operating leases (2006: £Nil )
24 Preliminary Results 2007
Brian SouterBrian Souter
Chief ExecutiveChief Executive
25 Preliminary Results 2007
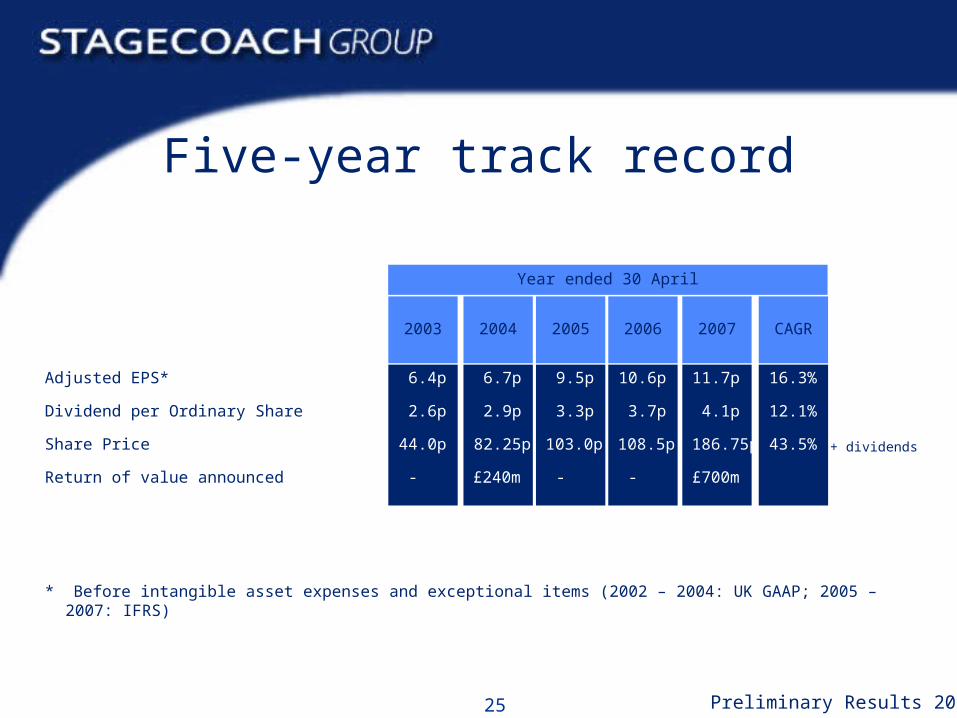
Five-year track record
Adjusted EPS*
Dividend per Ordinary Share
Share Price
Return of value announced
6.4p
2.6p
44.0p
-
6.7p
2.9p
82.25p
£240m
9.5p
3.3p
103.0p
-
10.6p
3.7p
108.5p
-
11.7p
4.1p
186.75p
£700m
16.3%
12.1%
43.5%
2003 2004 2005 2006 2007 CAGR
Year ended 30 April
* Before intangible asset expenses and exceptional items (2002 – 2004: UK GAAP; 2005 – 2007: IFRS)
+ dividends
26 Preliminary Results 2007
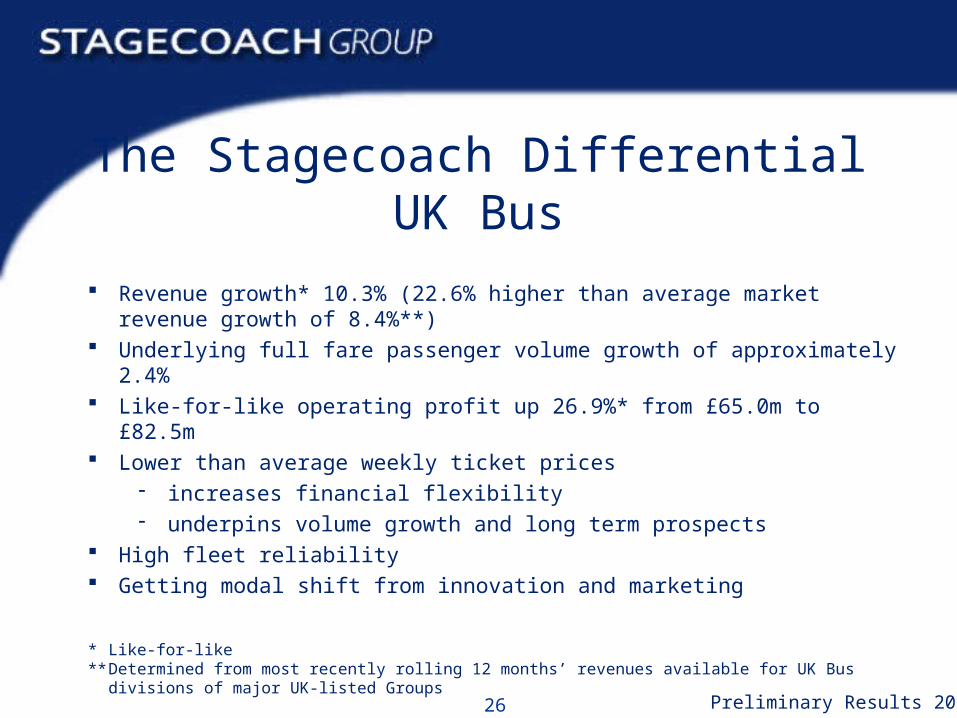
The Stagecoach DifferentialUK Bus
Revenue growth* 10.3% (22.6% higher than average market revenue growth of 8.4%**)
Underlying full fare passenger volume growth of approximately 2.4% Like-for-like operating profit up 26.9%* from £65.0m to £82.5m Lower than average weekly ticket prices
increases financial flexibility underpins volume growth and long term prospects
High fleet reliability Getting modal shift from innovation and marketing
* Like-for-like** Determined from most recently rolling 12 months’ revenues available for UK Bus divisions of major UK-listed
Groups
27 Preliminary Results 2007
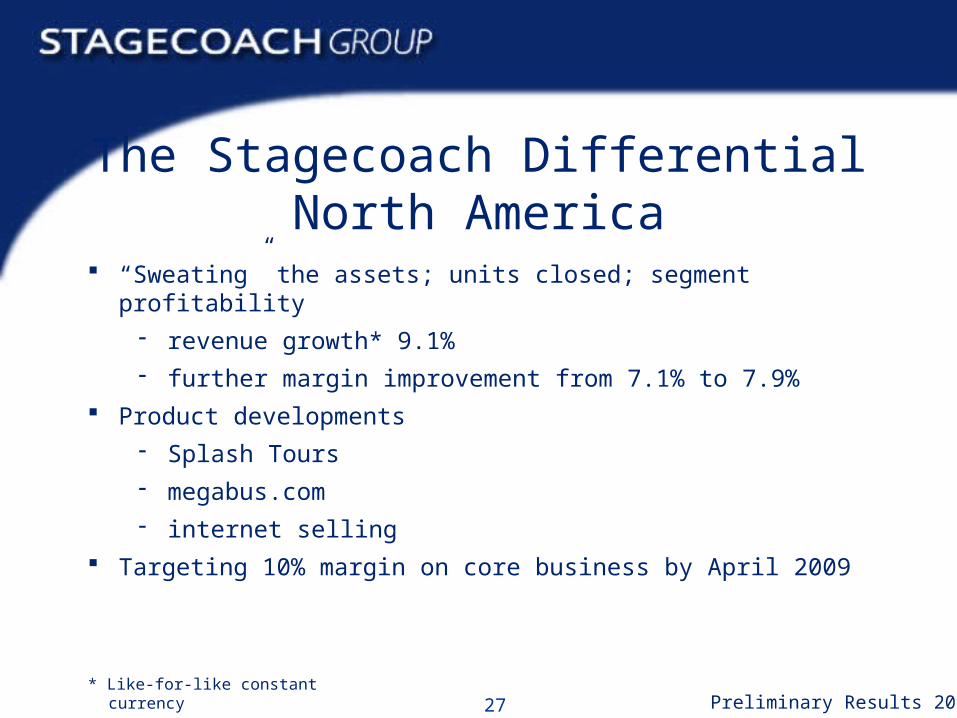
The Stagecoach DifferentialNorth America
“Sweating” the assets; units closed; segment profitability
revenue growth* 9.1%
further margin improvement from 7.1% to 7.9%
Product developments
Splash Tours
megabus.com
internet selling
Targeting 10% margin on core business by April 2009
* Like-for-like constant currency
28 Preliminary Results 2007
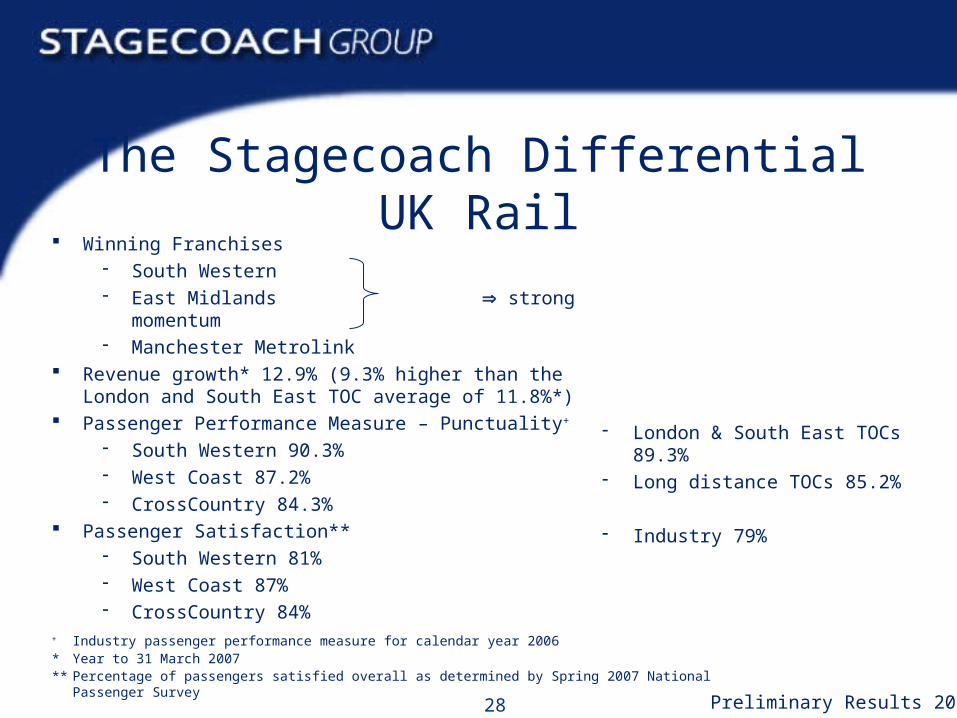
The Stagecoach DifferentialUK Rail
Winning Franchises South Western East Midlands strong
momentum Manchester Metrolink
Revenue growth* 12.9% (9.3% higher than the London and South East TOC average of 11.8%*)
Passenger Performance Measure – Punctuality+
South Western 90.3% West Coast 87.2% CrossCountry 84.3%
Passenger Satisfaction** South Western 81% West Coast 87% CrossCountry 84%
+ Industry passenger performance measure for calendar year 2006* Year to 31 March 2007** Percentage of passengers satisfied overall as determined by Spring 2007 National Passenger Survey
London & South East TOCs 89.3% Long distance TOCs 85.2%
Industry 79%
29 Preliminary Results 2007
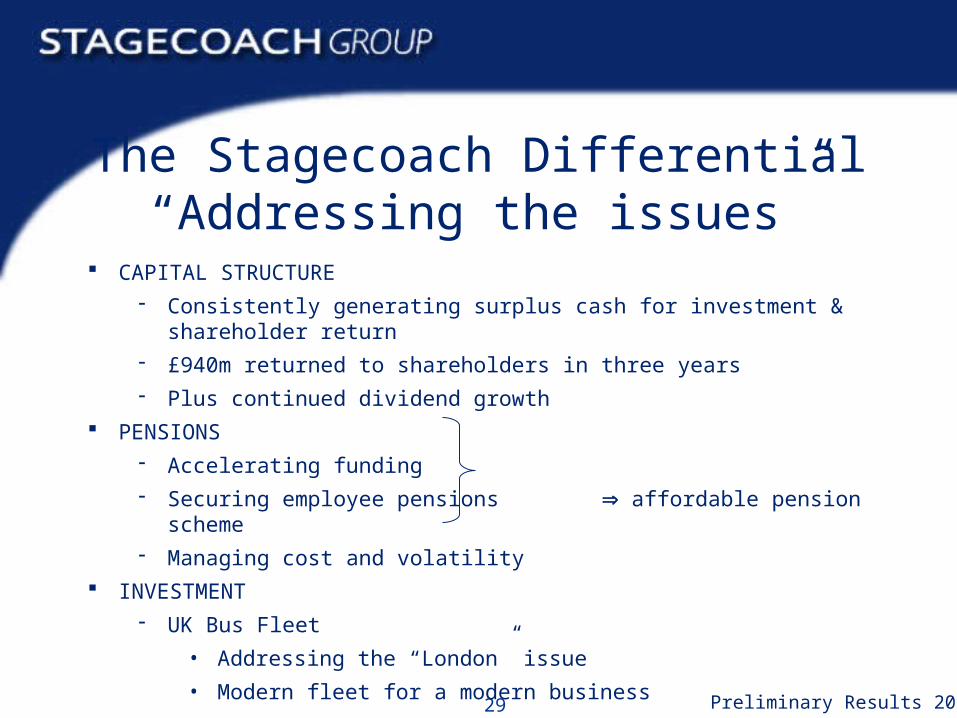
The Stagecoach Differential“Addressing the issues”
CAPITAL STRUCTURE
Consistently generating surplus cash for investment & shareholder return
£940m returned to shareholders in three years
Plus continued dividend growth
PENSIONS
Accelerating funding
Securing employee pensions affordable pension scheme
Managing cost and volatility
INVESTMENT
UK Bus Fleet
• Addressing the “London” issue
• Modern fleet for a modern business
30 Preliminary Results 2007
Current trading and outlook
Strong start to new financial year Current trading in line with our expectations Continued focus on organic growth and bolt-on
acquisitions Good potential for further growth
31 Preliminary Results 2007
Annual ResultsAnnual Results2727thth June 2007 June 2007
32 Preliminary Results 2007
Appendices
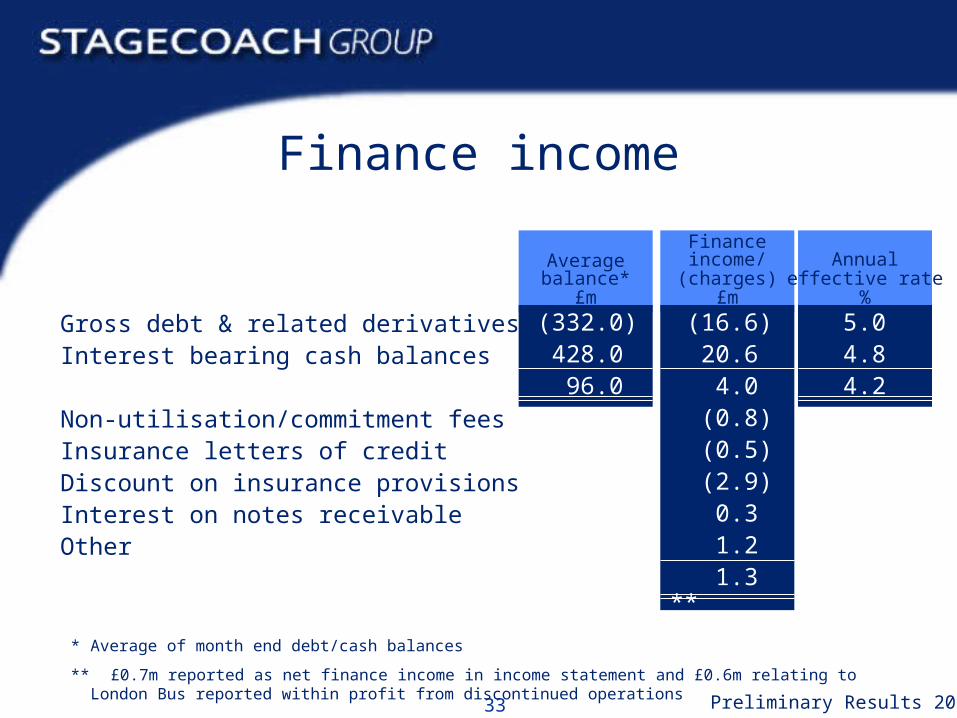
33 Preliminary Results 2007
Gross debt & related derivativesInterest bearing cash balances
Non-utilisation/commitment feesInsurance letters of creditDiscount on insurance provisionsInterest on notes receivableOther
Finance income/
(charges)£m
Annualeffective rate
%
(16.6)20.6
4.0(0.8)(0.5)(2.9)0.31.21.3 **
5.04.84.2
Finance income
Average balance*
£m
(332.0)428.096.0
* Average of month end debt/cash balances
** £0.7m reported as net finance income in income statement and £0.6m relating to London Bus reported within profit from discontinued operations

34 Preliminary Results 2007
Fuel hedging
% of Group fuel hedged - fixed
- cap/floor
Average hedge price (crude price US$/barrel) - fixed
- cap/floor
Forecast2007/08
37%
51%
$59
US$59/US$28
• Continuing Bus divisions use 1.6m barrels of fuel a year• Each US$10 per barrel movement in crude oil price impacts variable fuel costs by approximately
US$16m if no hedging in place• 2006/07 year-on-year increase of £21m in fuel costs of continuing operations
Forecast2008/09
Nil
44%
n/a
US$89/US$58
Forecast2009/10
Nil
Nil
n/a
n/a
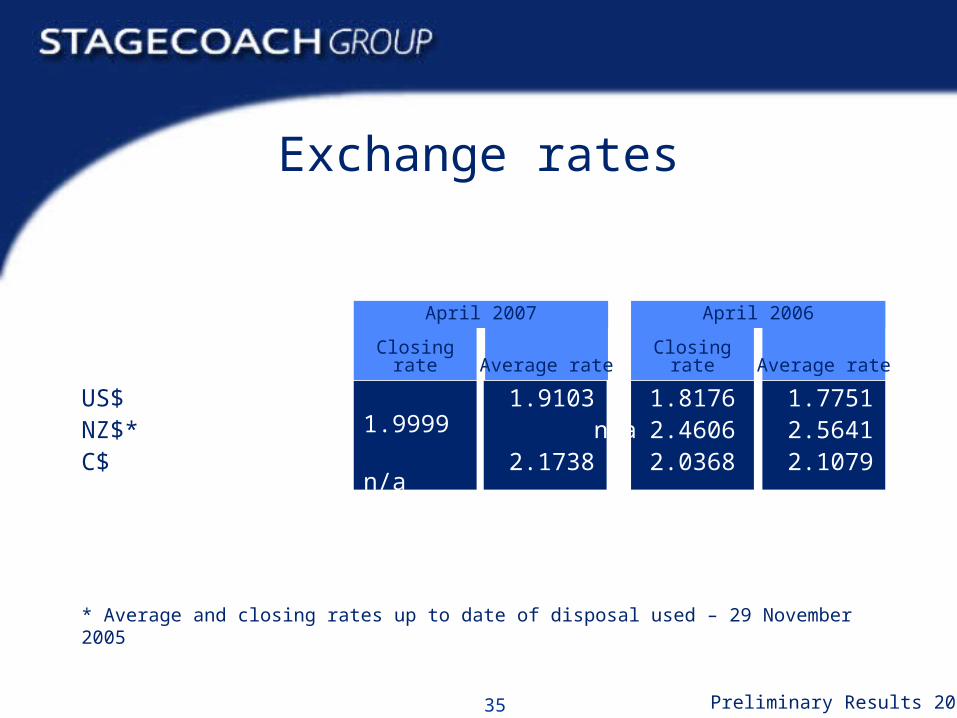
35 Preliminary Results 2007
Exchange rates
US$NZ$*C$
Closing rate Average rate
1.81762.46062.0368
1.77512.56412.1079
April 2006
Closing rate Average rate
1.9999 n/a
2.2102
1.9103 n/a
2.1738
April 2007
* Average and closing rates up to date of disposal used – 29 November 2005
36 Preliminary Results 2007
Annual ResultsAnnual Results2727thth June 2007 June 2007