preliminary results - hibernia reit/media/files/h/hibernia-reit/2016 news items... · preliminary...
TRANSCRIPT

Preliminary Results
May 2016

2
Disclaimer
This presentation (hereinafter "this document") has been prepared by Hibernia REIT plc (the "Company“ or “Group”) for
information purposes only.
This document has been prepared in good faith but the information contained in it has not been independently verified and does
not purport to be comprehensive. This document is neither a prospectus nor an offer nor an invitation to apply for securities. No
representation or warranty, express or implied, is given by or on behalf of the Company, its group companies, or any of their
respective shareholders, directors, officers, employees, advisers, agents or any other persons as to the accuracy, completeness,
fairness or sufficiency of the information, projections, forecasts or opinions contained in this presentation. In particular, the
market data in this document has been sourced from third parties. Save in the case of fraud, no liability is accepted for any errors,
omissions or inaccuracies in any of the information or opinions in this document.
Certain information contained herein may constitute "forward-looking statements“. Due to various risks and uncertainties, actual
events or results or actual performance of the Company may differ materially from those reflected or contemplated in such
forward-looking statements. No representation or warranty is made as to the achievement or reasonableness of, and no reliance
should be placed on, such forward-looking statements. There is no guarantee that the Company will generate a particular rate of
return.

3
Market update
Acquisitions and developments
Portfolio management
Conclusion and outlook
Highlights
Financial results
Agenda

Highlights
4
• Excellent financial performance
– EPRA NAV per share +17% to 130.8c in year to March 2016
– Net income of €136.8m incl. revaluation gain of €125.1m
– Final dividend of 0.8c per share, bringing total for year to 1.5c per share
• Selective acquisitions enhancing portfolio
– Rental growth plays: e.g. Central Quay, Hardwicke and Montague
– Additions to development pipeline: e.g. Marine House, Earlsfort Terrace
• Development programme progressing well
– 3 completed schemes delivered profit on cost in excess of 30%
– 4 committed schemes delivering 354k(1) sq. ft. of office space in the next 24 months
– Longer term pipeline expanded to 6 schemes
• Letting activity growing rent roll substantially
– Over 157k sq. ft. of office lettings(2) in year
– Contracted rent roll now €39.0m, +72% on March 2015
• Management team and funding in place
(1) Office areas only (e.g excl. basement areas etc.). 345k sq. ft. includes: Cumberland House (127k sq. ft.), 1WML (50% share equating to 61k sq. ft.), 1 SJRQ (110k sq. ft.) and Guild House (56k of 72k is committed refurbishment). As at 31st of March, the entire of Guild House was part of the in-place office portfolio, not committed schemes. Conversely, 30k sq. ft. of 1DLC and the entire 11k sq. ft. of SOBO Works were committed developments at 31st March but have now completed and are considered in-place office. See slide 25 for more details
(2) Incl. storage spaces

In-place office portfolio*764k sq. ft.
Committed developments*340k sq. ft. (pre-let 105k sq. ft.)
Longer term development pipeline**371k sq. ft.
5
Portfolio overview as at 31 March 2016
Portfolio by sector (by value) Office and development portfolio (by net lettable area)
Office IFSC25%
Office South Docks19%Office Traditional Core
26%
CBD Office Development / Refurb
17%
Industrial1%
Residential12%
Total: €928m
• Portfolio of 25 properties (17 completed office(1) properties)
• Portfolio total passing rent of €30.0m(2) and total contracted rent of €39.0m(2,3)
• In-place office (excl. refurbishments and developments) average contracted rent of €33psf with an average ERV of €44psf(4)
• In-place office WAULT to rent review of 2.0yrs(5) and 4.3yrs to earlier of break or lease expiry
• In-place office vacancy rate of 6%
Total: 1.5m sq. ft.
Notes to the office development portfolio:*Office areas only (e.g. excl. basement areas etc.). This is the position as at 31st of March and included: Cumberland House (127k sq. ft.), 1WML (61k sq. ft. representing the 50% share), 1SJRQ (110k sq. ft.), 1DLC (30k sq. ft. of total 73.9k sq. ft. was still under refurbishment), SOBO Works (11k sq. ft.). Post 31st March 1DLC and SOBO Works completed and are now in-place office assets. Conversely, Guild House was classified as an in-place asset as at 31st of March but 56k of 72k is now committed refurbishment (see slide 25 for details)**Includes incremental additional sq. ft. from Harcourt Square, Hanover Building, Marine House & Earlsfort Terrace. It also includes the potential new offices at Gateway (c.115k sq. ft.) and the front site at Cumberland House. Note that there is also development potential at Gateway for a further c.130k sq. ft. of offices (see slide 29 for details)
(1) Includes Camden Street(2) Includes net rental income from residential(3) Includes pre-let refurbishments(4) All ERVs are CBRE assessments except for Harcourt Square which is an internal assessment(5) Earlier of review or expiry

6
Further opportunity
• Favourable market conditions
• Hibernia’s committed development schemes completing in next 24 months: longer term pipeline gives optionality
• In-place office portfolio has asset management angles and is heavily reversionary
• Selective recycling likely
• Further acquisition opportunities expected and flexible funding in place to exploit these

7
Agenda
Market update
Acquisitions and developments
Portfolio management
Conclusion and outlook
Highlights
Financial results

12 months to
31-Mar-16
12 months to
31-Mar-15 % change
Property income (1) 30,289 18,044 68%
Revaluation gain (2) 125,056 90,868 38%
Net income 136,797 92,232 48%
EPRA earnings 10,024 3,961 153%
EPRA EPS 1.5c 0.8c 88%
Dividend per share 1.5c 0.8c 88%
31-Mar-16 31-Mar-15 % change
Portfol io va lue 927,656 641,296 45%
Net debt/(cash) 52,918 (139,048) n/a
Loan to va lue 5.7% n/a n/a
Net assets 896,574 753,134 19%
EPRA NAV per share (cent) 130.8c 111.8c 17%
8
Financial highlights
(€’000)
96.4c
104.7c
111.8c
122.1c
130.8c
90c
95c
100c
105c
110c
115c
120c
125c
130c
135c
Mar-14 Sep-14 Mar-15 Sep-15 Mar-16
EPR
A N
AV
per
sh
are
(cen
t)
+9%
+7%
+9%
+36%
Valuation uplifts and income driving strong increases in NAV
(1) Includes receipt of €4.9m (FBD surrender) in 2016 and €2.4m (Commerzbank surrender) in 2015(2) Prior year figure includes €10m gain on conveyance of Block 3 which has been reclassified from ‘Other Gains’
Balance sheet EPRA NAV per share progression
Income statement
+7%
(€’000)

111.8
130.80.51.5
(1.2)
0.04
103
108
113
118
123
128
133
Mar-15 Investmentproperties reval.
Developmentproperties reval.
Non-core sales EPRA EPS Dividends paid Other Mar-16
EPR
A N
AV
cen
t p
er s
har
e
+17%
EPRA NAV per share movement since 31 March 15
EPRA NAV per share movement since 31 Mar 15
Traditional Core
IFSC
South Docks
Other
Cumberland House
1WML
1SJRQ
10.0
8.2
Valuation uplift: 18.2c
9

Impact of internalisation on financial statements
10
31-Mar-16 30-Mar-15
Revenue 32,786 18,769
Direct property costs (2,497) (725)
Property Income 30,289 18,044
IM base fee - (4,690)
IM performance fee (6,069) (5,772)
Adminis trative expenses (8,696) (1,584)
Net finance expense (4,087) (1,575)
Net rental profit 11,437 4,423
Revaluation & Other ga ins/(losses ):
Investment properties 125,056 90,868
Other losses (171) (2,368)
Tax credit / (expense) 475 (691)
Total revaluation/other losses: 125,360 87,809
Net income for the period 136,797 92,232
Diluted IFRS EPS (cents) 20.1 18.3
EPRA Earnings 10,024 3,961
Diluted EPRA EPS (cents) 1.5 0.8
(1) IM base fee
• Internalisation took effect from 1 April 2015 and consequently no base fees were paid in the year
(2) IM performance fee
• Existing arrangements remain in place until expiry of Investment Management Agreement in November 2018
(3) Administrative expenses
• Costs of Investment Manager of c.€2.6m per annum (mainly staff and office costs) now included
• Charge of €1.8m from amortisation of prepaid remuneration asset relating to €14.2m paid for base fee buyout. €11.6m remains to be amortised over period to November 2018 (c.€4.5m per annum)
• Non internalisation-related administrative expenses increased substantially over prior year due in particular to increased professional advisers fees and a change in general overhead VAT recovery rate
(1)
(2)
(3)
Internalisation expected to be earnings neutral over remaining life of IMA
Summary income statement

Net cash invested€711m
IPO€372m
Co
mm
itte
d c
apex
€1
04
m
P+OO€286m
RCF€400m
Remaining investment capacity€265m
1WML facility€22m
€0m €200m €400m €600m €800m €1000m €1200m
Uses of funds
Sources of funds
11
Substantial financial capacity in place
Current LTV of 5.7%: if current facilities fully invested, LTV would be 32.5%
Hedged€100m(1)
Hedged€22m(2)
(1) €50m hedged from May 16 to Nov 16 and €100m hedged from Nov 16 to Nov 20. Hedging instruments are a combination of interest rate caps and swaptions with strike rates of 1% (reference rate is 3M Euribor)(2) Facility fully hedged per expected drawing schedule using interest rate caps with a 1% strike rate (reference rate its 3M Euribor)

One Dockland Central€4m
Cumberland House€16m
1WML€14m
1WML€5m
1SJRQ€24m
1SJRQ€23m
1SJRQ€6m
Two Dockland Central€6m
Two Dockland Central€6m
€0m
€10m
€20m
€30m
€40m
€50m
€60m
€70m
Y/E March 2017 Y/E March 2018 Y/E March 2019
Project
Capex/Est. total
capex
€m
Spent at Mar-16
€m
Left to spend
€m
One Dockland Central(1) €10m €6m €4m
1WML(3) €26m €6m €20m
Cumberland House €27m €11m €16m
Two Dockland Central €12m - €12m
1SJRQ €55m €2m €53m
Total committed €130m €25m €104m
12
Forecast capital expenditure for committed development schemes
Forecast capital expenditure by financial year – committed developments
(1) 1DLC completed post 31st March 2016(2) €7.9m net of dilapidations received(3) 50% interest(4) Differences are due to rounding
(2)
(4)

€1.3m
€5.3m
€0.4m
€5.9m
€1.6m
€3.0m
€1.9m
€15m
€20m
€25m
€30m
€35m
€40m
€45m
€50m
€55m
€60m
€65m
Contracted in-place rent roll at31 Mar 16
Let To let Proforma
Purchases since Sep 15
One Dockland Central(1)
Cumberland House
€32.0m
One Dockland Central
1WML(2)
SOBO Works(1)
Cumberland House
1SJRQ
€51.4m
+€19.4m+61%
Total contracted rent: €39.0m
13
Potential incremental rent roll from committed development schemes
(1) Post 31st March: classified as in-place office(2) Commercial units only/based on 50% interest(3) At valuers’ ERV 31 Mar 16(4) Excl. additional basement and reception
Based on CBRE estimated rental values, Mar 16
Average office ERVs as per CBRE Mar 16:• One Dockland Central: €50.15psf• Cumberland House: €51.40psf(4)
• Windmill Lane: €47.00psf
• SJRQ €50.50psf• SOBO Works: €36.00psf
Committed schemes expected to add c.€19m to rent roll by mid 2018 of which €7m is already let
In-place office reversionary potential(3)
Potential incremental rent roll @ valuers’ ERV

14
Key financial messages
• Excellent financial results
– Investment portfolio and development schemes both contributing to NAV uplift
– Significant earnings growth even without €4.9m surrender premium allowing dividend of 1.5c for the year, up 88% up on prior year
– More to come from further lettings and completion of committed development schemes
• Substantial financial capacity in place
– Cash and undrawn facilities of €369m, €265m including committed spend
– Current LTV of 5.7%: target through cycle of 20%-30%
• Hedging strategy being implemented
– Intend to hedge at least 50% of all interest rate exposure on drawn debt facilities
– Hedged €100m of RCF to November 2020 at 1% Euribor strike rate(1)
– Hedged €22.1m Windmill Lane facility using interest rate caps with 1% Euribor strike rate
• Internalisation effective from 1 April 2015
– Expected to be earnings neutral to November 2018
(1) €50m hedged from May 16 to Nov 16 and €100m hedged from Nov 16 to Nov 20. Hedging instruments are a combination of interest rate caps and swaptions with strike rates of 1% (reference rate is 3M Euribor)

15
Market update
Acquisitions and developments
Portfolio management
Conclusion and outlook
Highlights
Financial results
Agenda

TMT23%
Financial services25%Professional
services24%
Other13%
Public sector15%
(10)k
(5)k
-
5k
10k
15k
20k
(15)k
(10)k
(5)k
-
5k
10k
15k
20k
25k
30k
20
10Q
1
20
10Q
2
20
10Q
3
20
10Q
4
20
11Q
1
20
11Q
2
20
11Q
3
20
11Q
4
20
12Q
1
20
12Q
2
20
12Q
3
20
12Q
4
20
13Q
1
20
13Q
2
20
13Q
3
20
13Q
4
20
14Q
1
20
14Q
2
20
14Q
3
20
14Q
4
20
15Q
1
20
15Q
2
20
15Q
3
20
15Q
4
Dublin Midlands** South East South West Border State (RHS)
16
Economic outlook
Dublin driving population* growth
Source: CSO, Goodbody *over 15yrs of age; **Midland, Mid-West & Mid-East (as per CSO)
Source: CSO, Q4 2010 = 100
Dublin office based employment making strong contribution to overall employment growth
Dublin office employment is broad based
Source: CSO @ Q4 2015
2013 2014 2015 2016F 2017F
Consumption (0.3%) 2.0% 3.5% 4.0% 3.2%
Government 1.4% 4.6% -0.8% 2.6% 2.0%
Investment (6.6%) 14.3% 28.2% 2.9% 9.4%
Domestic Demand (1.5%) 5.2% 8.6% 3.5% 4.7%
Core Domestic Demand* 2.4% 4.7% 4.3% 5.0% 4.4%
Exports 2.5% 12.1% 13.8% 7.6% 4.4%
Source: CSO, Goodbody*Core domestic demand = domestic demand excl. R&D and aircraft leasing
Core domestic demand is expected to remain robust in the coming years
95
100
105
110
115
120
20
10Q
4
20
11Q
1
20
11Q
2
20
11Q
3
20
11Q
4
20
12Q
1
20
12Q
2
20
12Q
3
20
12Q
4
20
13Q
1
20
13Q
2
20
13Q
3
20
13Q
4
20
14Q
1
20
14Q
2
20
14Q
3
20
14Q
4
20
15Q
1
20
15Q
2
20
15Q
3
20
15Q
4
Ind
ex le
vel (
Q4
20
10
= 1
00
)
Dublin office jobs Total Irish employment (less Dublin office jobs)
Q3 2007 peak Dublin office jobs

0%
2%
4%
6%
8%
10%
12%
14%
16%
Dublin1/3/7
Dublin 2/4Dublin 6/8 IFSC CityCentre
SouthSuburbs
NorthSuburbs
WestSuburbs
Overall vacancy rate Grade A vacancy rate
0%
10%
20%
30%
40%
50%
60%
70%
80%
90%
100%
2011 2012 2013 2014 2015 2016 YTD
<5k sq. ft. 5k-10k sq. ft. 10k-20k sq. ft.
20k-50k sq. ft. 50k-100k sq. ft. >100k sq. ft.
0.0
0.5
1.0
1.5
2.0
2.5
3.0
19
95
19
96
19
97
19
98
19
99
20
00
20
01
20
02
20
03
20
04
20
05
20
06
20
07
20
08
20
09
20
10
20
11
20
12
20
13
20
14
20
15
Q1
201
6
Mill
ion
s Sq
Ft
Annual Dublin Office Take Up 10 Year Average
17
Rental market: Dublin office dynamics
Broad based demand with little supply is driving vacancy rates down
Dublin office take-up reached 2.7m sq. ft. in 2015 and 0.6m sq. ft. in Q1 2016
Overall Dublin vacancy rate is 7.7% with the grade A vacancy rate down to 1.5% in D2/4 (core CBD location)
Source: CBRE
Source: CBRE Source: CBRE
Source: CBRE @ 31 Mar 16
Broad mix of occupier take-up in the Dublin office marketc.75% of take-up in Dublin is for space less than 50k sq. ft.
Other21%
Professional services
3%
TMT38%
Financial services
16%
Public sector
7%
Industry15%
2011 to 20142015 to
2016 YTD
Other29%
Professional services
5%TMT29%
Financial services
18%
Public sector
7%
Industry12%
18
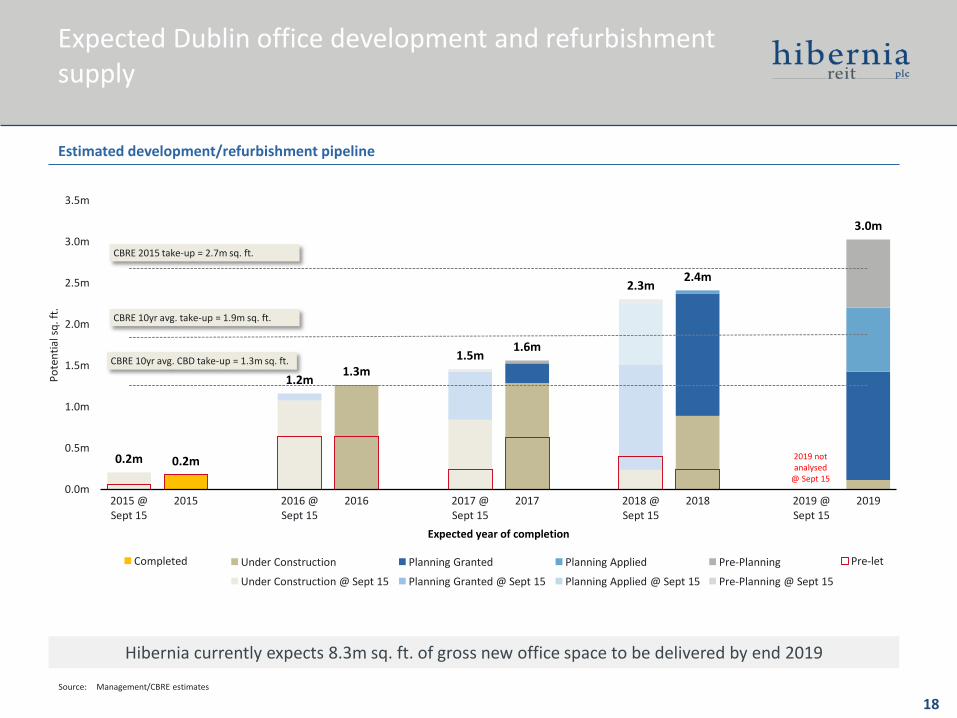
Hibernia currently expects 8.3m sq. ft. of gross new office space to be delivered by end 2019
Source: Management/CBRE estimates
Estimated development/refurbishment pipeline
Under Construction @ Sept 15 Planning Granted @ Sept 15 Planning Applied @ Sept 15 Pre-Planning @ Sept 15
Expected Dublin office development and refurbishment supply
0.2m
1.2m
1.5m
2.3m
0.2m
1.3m
1.6m
2.4m
3.0m
0.0m
0.5m
1.0m
1.5m
2.0m
2.5m
3.0m
3.5m
2015 @Sept 15
2015 2016 @Sept 15
2016 2017 @Sept 15
2017 2018 @Sept 15
2018 2019 @Sept 15
2019
Po
ten
tial
sq
. ft.
Expected year of completion
Under Construction Planning Granted Planning Applied Pre-PlanningCompleted Pre-let
CBRE 10yr avg. CBD take-up = 1.3m sq. ft.
CBRE 2015 take-up = 2.7m sq. ft.
CBRE 10yr avg. take-up = 1.9m sq. ft.
2019 not analysed
@ Sept 15

Investment sourcing
19(1) Was €9.6bn as at 30 Sept 2015 which included Project Jewel (c. €1.8bn) and Project Arrow (c. €0.8bn) which were sold in Q4 2015
NAMA
Private equity funds
Other
• >€7bn of loans still on balance sheet(1)
• 73% (€22.1bn) of NAMA’s original senior bonds redeemed at Q4 2015. Targeting redemption of all senior bonds before end of 2018 (i.e. additional €8bn to redeem before end 2018)
• Interesting Dublin CBD office (loan) assets remain within NAMA
• >€35bn invested in last 4 years
• Looking to dispose of certain assets to crystallise gains: funds may be coming to end of lives
• Hibernia has built a reputation with PE funds for offering execution certainty:
− Central Quay purchased from Blackstone
− Harcourt Square & Windmill Lane purchased from Starwood
• Certain assets held by PE owners fit Hibernia’s skill set and value-add strategy more than passive/income focused buyers
• Private investors & syndicates: looking for liquidity and deal certainty
• Forward funding opportunities: Speculative development finance remains scarce; owners of prime development sites may look to unlock developments through forward funding
• Loan acquisitions: Hibernia has proven its ability to purchase debt and resolve potentially complex loan transactions
Opportunities for selective acquisitions to enhance our existing portfolio

20
Agenda
Market update
Acquisitions and developments
Portfolio management
Conclusion and outlook
Highlights
Financial results

21
Summary of acquisitions since March 2015
Asset name SectorPurchase
datePurchase
price NIY (%)Avg. rent
€psf
WAULTyrs
SourceOn/offmarket
Direct/Loan
Break/expiry
Review/expiry
Dundrum View Residential Jun-2015 €28.1m(€350k per
unit)
4.7% €1,500 pertwo bed per
month
n/a n/a Private Off-market Direct
Hardwicke &Montague House
CBD Dublin Office
Jan-2016 €41.8m(1)
(€680psf)(2)
4.2% €30psf 7yrs 2yrs Private Off-market Direct
Central Quay CBD Dublin Office
Feb-2016 €51.3m(€890psf)
4.5% €47psf(3) 6yrs 3yrs Private equity
Off-market Direct
Marine House CBD Dublin Office
Mar-2016 €26.5m(€640psf)
4.3% €23psf 3yrs 2yrs Private Off-market Direct
One EarlsfortTerrace
CBD Dublin Office
Mar-2016 €19.2m(€880psf)
5.3%(4) €45psf(4) 10yrs <1yrs Private On-market Direct
Smaller ‘bolt-on’ acquisitions(5)
Various Various €4.8m - - - - Private Various Direct
€171.7m(6)
(1) Total consideration for the asset (incl. loan purchased) is €60m excl. costs(2) €725psf after all costs(3) €58psf after Indeed surrender and letting to Daqri on 1st floor (11k sq. ft.) post acquisition(4) After Sept-16 rent review which is agreed at €45psf(5) Lime Street (Residential) €1.4m, Camden Street (Dublin CBD Office) €1.6m, 39 Harcourt Street (Dublin CBD Office) €1.8m(6) €179m incl. costs
22
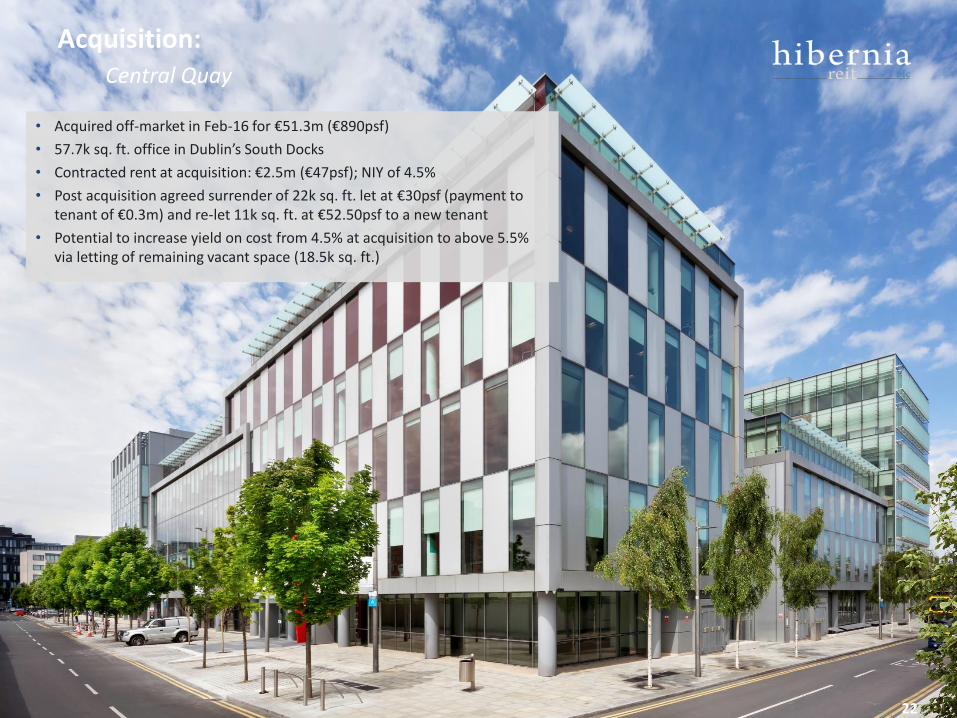
• Acquired off-market in Feb-16 for €51.3m (€890psf)
• 57.7k sq. ft. office in Dublin’s South Docks
• Contracted rent at acquisition: €2.5m (€47psf); NIY of 4.5%
• Post acquisition agreed surrender of 22k sq. ft. let at €30psf (payment to tenant of €0.3m) and re-let 11k sq. ft. at €52.50psf to a new tenant
• Potential to increase yield on cost from 4.5% at acquisition to above 5.5% via letting of remaining vacant space (18.5k sq. ft.)
Acquisition: Central Quay

• Acquired off-market in Mar-16 for €26.5m (€640psf)
• 1970’s office building located in the traditional core of Dublin facing onto the Grand Canal
• Forms part of Clanwilliam Court which consists of 7 separate blocks (6 office, 1 residential)
• Marine House comprises c.41k sq. ft. of office space
• Current rent is €1.2m (€23psf); NIY of 4.3%
• Adds to longer term pipeline of development assets
Acquisition: Marine House
23
Source: Google maps
Marine HouseClanwilliam Court

24
• Acquired in Mar-16 for €19.2m (€880psf)
• Located in Dublin’s traditional core less than 250m from St Stephen’s Green and opposite the National Concert Hall
• 21.7k sq. ft. of offices fully let to international law firm Eversheds on a lease to 2026
• The current rent is €0.6m p.a. (€26psf)
• Rent review in Sept-16 has been agreed at €1.0m p.a. (€45psf) which implies a yield on cost of 5.3%
Acquisition: One Earlsfort Terrace

Summary of committed development schemes
SectorTotal NIA post
completion (sq. ft.)Full purchase
priceCapex/Est.
capexEst. total cost
(incl. land) €psf ERV(1)
Office ERV psf(1) Expected PC Date
Completed schemes (post 31st March 2016)
One Dockland Central
Office 74k(2) €46m €10m(3) €736psf(4) €3.9m €50.15psf Completed after year end delivering profit on cost in
excess of 30%
SOBO Works Office 11k €2m €1.3m €275psf €0.4m €36.00psf Completed after year end delivering profit on cost in
excess of 50%
Total completed 85k €48m €11.3m €4.3m
Committed schemes
Cumberland House
Office 127k(5) €51m €27m €605psf €7.2m €51.40psf Q4 2016
Two Dockland Central (formerlyGuild House)
Office 72k(6) €46m €12m €790psf(4) €3.9m €50.50psf Q3 2017
Windmill Lane(7) Office 61k office3k retail
7.5 resi. Units
€4m €26m €420psf(8) €3.0m(9) €47.00psf late 2017
1SJRQ Office 110k office6k retail
€18m €55m €643psf(8) €5.9m €50.50psf mid 2018
Total committed 370k office(10)
9k retail7.5 units
€119m €120m €20m
CONCEPT IMAGE
CONCEPT IMAGE
CONCEPT IMAGE
CONCEPT IMAGE
CONCEPT IMAGE
(7) 50% interest; includes extensions to 4th & 5th floors (2.3k sq. ft.) planning granted in May 16(8) Office only(9) Commercial only(10) At 31st March: committed developments totaled 340k sq. ft. of office area. This was composed of: 1DLC (30k sq. ft.), SOBO
Works (11k sq. ft.), Cumberland House (127k sq. ft.), 1WML (61k sq. ft. for 50% share) and 1SJRQ (110k sq. ft.)Post 31st March: 1DLC and SOBO Works are completed schemes and in-place office assets. There are now 4 committed schemes which will deliver c.354k sq. ft. as follows: Cumberland House (127k sq. ft.), Guild House (2DLC; 56k sq. ft.), 1WML (61k sq. ft.) and 1 SJRQ (110k sq. ft.)
(1) Per CBRE valuation at 31 Mar 16(2) 30k sq. ft. was committed development/refurbishment at 31 Mar 16(3) €7.9m net of dilapidation charge received(4) Est. total cost psf is net of dilaps(5) Excl. additional basement areas (8k sq. ft.) and potential new block (c.50k sq. ft.)
but incl. new reception (1k sq. ft.), additional ground floor (5k sq. ft.) and design efficiencies of existing building (9k sq. ft.)
(6) 56k sq. ft. of entire 72k is committed refurbishment25

• Refurbishment works (budget of €27m) on schedule for completion in Q4 2016
• Twitter originally signed a lease for €4.6m but contracted rent increased to €5.3m via:
− €0.5m: extension space of c.14k sq. ft.
− €0.2m: design efficiencies of existing Twitter space in building of c.2.5k sq. ft.
• Total building will be c.135k sq. ft. (incl. the new additional areas)
• In discussions with potential tenants regarding the remaining 33k sq. ft. available on the top two floors
• Potential to add a new c.50k sq. ft. NIA office block at the front of the site subject to planning (see diagram)
Potential building
Existing building
Committed development: Cumberland House
26

• Situated within the SOBO (South of Beckett and O’Casey bridges) District of Dublin’s South Docks
• 1WML and 1SJRQ progressing well and on schedule:
− 1WML due to complete by late 2017
− 1SJRQ by mid 2018
• The spec for 1SJRQ has been finalized and 83% of the packages have now been agreed. The total budget for the project has been set at €55m
• Marketing campaign for both began in April 2016
• Multi-lets likely in which case pre-letting unlikely until 6-9 months prior to PC
Committed developments:1WML & 1SJRQ
Pictured: Site clearance of 1SJRQ Pictured: Construction works at 1WML 27
1WML
1SJRQ
1SJRQ 1WML

• Extensive refurbishment works at One Dockland Central (formerly Commerzbank House) completed after year end generating profit on cost in excess of 30%
• Agreed pre-let to HubSpot of 27.5k sq. ft. at a rent of €45 psf.
• In detailed discussion to let the remainder (30k sq. ft.) of available space
• Committed to carry out similar refurbishment works at Guild House which is to complete in late 2017 (and will be renamed Two Dockland Central)
Completed/committed developments:
One Dockland Central & Two Dockland Central
28Concept image
Pictured: final works to staircase in 1DLC
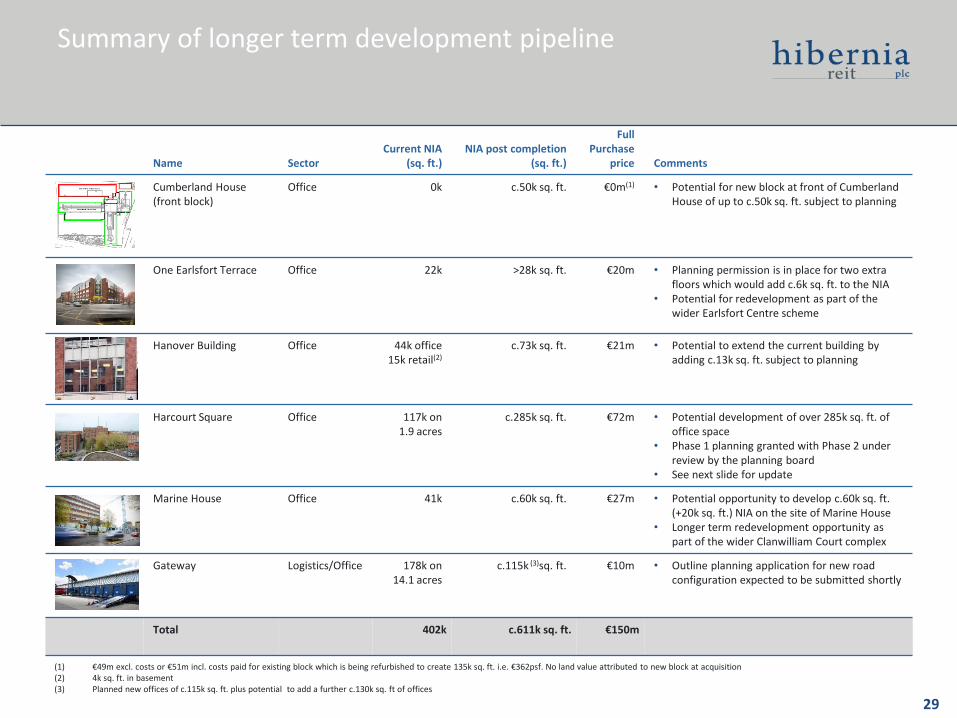
Summary of longer term development pipeline
Name SectorCurrent NIA
(sq. ft.)NIA post completion
(sq. ft.)
Full Purchase
price Comments
Cumberland House (front block)
Office 0k c.50k sq. ft. €0m(1) • Potential for new block at front of Cumberland House of up to c.50k sq. ft. subject to planning
One Earlsfort Terrace Office 22k >28k sq. ft. €20m • Planning permission is in place for two extra floors which would add c.6k sq. ft. to the NIA
• Potential for redevelopment as part of the wider Earlsfort Centre scheme
Hanover Building Office 44k office15k retail(2)
c.73k sq. ft. €21m • Potential to extend the current building by adding c.13k sq. ft. subject to planning
Harcourt Square Office 117k on 1.9 acres
c.285k sq. ft. €72m • Potential development of over 285k sq. ft. of office space
• Phase 1 planning granted with Phase 2 under review by the planning board
• See next slide for update
Marine House Office 41k c.60k sq. ft. €27m • Potential opportunity to develop c.60k sq. ft. (+20k sq. ft.) NIA on the site of Marine House
• Longer term redevelopment opportunity as part of the wider Clanwilliam Court complex
Gateway Logistics/Office 178k on14.1 acres
c.115k (3)sq. ft. €10m • Outline planning application for new road configuration expected to be submitted shortly
Total 402k c.611k sq. ft. €150m
(1) €49m excl. costs or €51m incl. costs paid for existing block which is being refurbished to create 135k sq. ft. i.e. €362psf. No land value attributed to new block at acquisition(2) 4k sq. ft. in basement(3) Planned new offices of c.115k sq. ft. plus potential to add a further c.130k sq. ft of offices
29
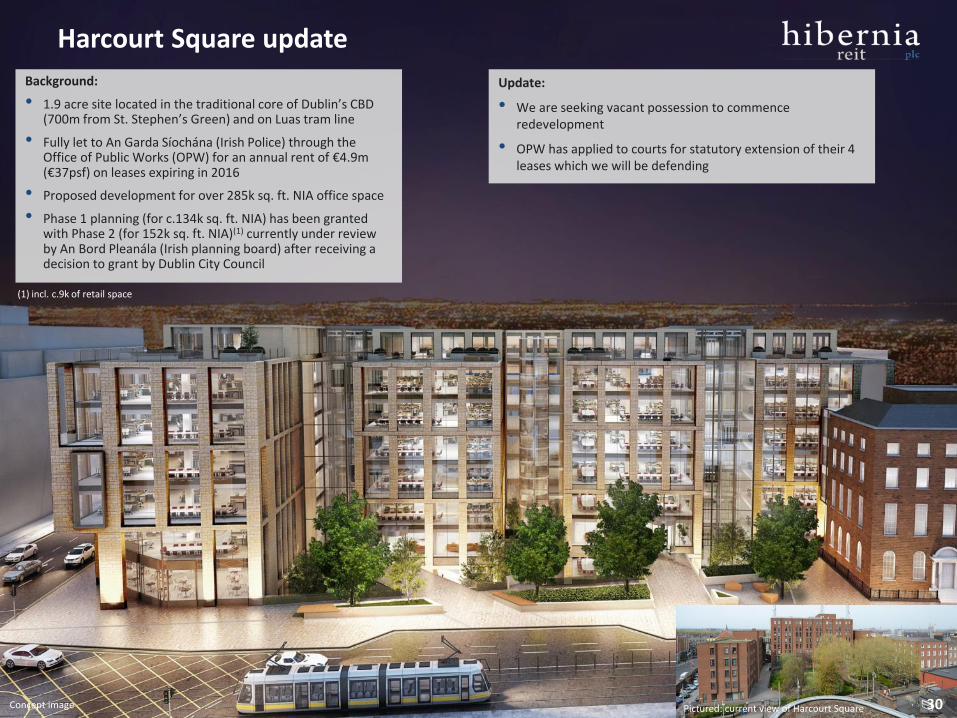
Harcourt Square update
Concept image
Background:
• 1.9 acre site located in the traditional core of Dublin’s CBD (700m from St. Stephen’s Green) and on Luas tram line
• Fully let to An Garda Síochána (Irish Police) through the Office of Public Works (OPW) for an annual rent of €4.9m (€37psf) on leases expiring in 2016
• Proposed development for over 285k sq. ft. NIA office space
• Phase 1 planning (for c.134k sq. ft. NIA) has been granted with Phase 2 (for 152k sq. ft. NIA)(1) currently under review by An Bord Pleanála (Irish planning board) after receiving a decision to grant by Dublin City Council
30Pictured: current view of Harcourt Square
Update:
• We are seeking vacant possession to commence redevelopment
• OPW has applied to courts for statutory extension of their 4 leases which we will be defending
(1) incl. c.9k of retail space
31
Agenda
Market update
Acquisitions and developments
Portfolio management
Conclusion and outlook
Highlights
Financial results

% of
portfolio Initial Equivalent Reversionary
1. Dublin CBD Offices
Traditional Core €237m 25.6% 4.4% 2.9% 16.6% 3.2%² 5.2%² 5.6%² €10.4m
IFSC €237m 25.5% 6.4% 6.4% 29.7% 3.1% 5.2% 5.4% €8.0m
South Docks €173m 18.6% 6.0% 4.4% 28.8% 2.7% 5.4% 5.7% €5.7m
Total Dublin CBD Offices €647m 69.7% 5.6% 4.5% 24.4% 3.0% 5.2% 5.6% €24.1m
2. Dublin CBD Office
Development/Refurbishment€155m 16.7% 24.4% 24.4% 69.0% – – – –
3. Dublin Residential €113m 12.2% 2.3% 2.3% 20.4% 4.6% 4.6% 4.6% €5.4m
4. Industrial €12m 1.3% 15.6% 15.6% 19.3% 3.9% 7.4% 7.9% €0.5m
Total Investment Properties
(incl. offices)€928m 100.0% 8.3% 7.2% 29.5% 3.3% 5.2% 5.4% €30.0m
Passing rent
(€m)
Value as at
Mar 16
(all assets)
Yield on value (%)
% uplift since
acquisition (all assets)
incl. costs(1)
% uplift since
Sep 15
incl. new acqusition
% uplift since
Sep 15
excl. new acqusition
32
Portfolio summary
Valuation uplift supported by letting activity and progress on development assets
(4)
(1) Includes capex(2) excludes Harcourt Square as this is valued by CBRE on a residual/development appraisal basis; excludes 39 Harcourt Street and Camden Street; includes One Dockland Central, of which c.77% is currently under
refurbishment and is therefore not income producing(3) Excl. Harcourt Square and all Dublin CBD Office Development/Refurbishment(4) South Docks excludes the value of space occupied by Hibernia in South Dock House
(2) (2) (2)
(3) (3) (3)

Banking & capital markets
40%
Government 20%
Insurance & reinsurance
5%
TMT10%
Other 13%
Professional services
12%
€27.3m
20%
11%
10%
8%5%4%
4%
4%
3%
2%
29%
Remainder
€27.3m
In-place office portfolio statistics
33
Industry split of in-place tenants Top 10 tenants of in-place portfolio (by contracted rent)
(1) Excl. the c.30k sq. ft. of 1DLC and entire 11k sq. ft. SOBO Works that were committed developments as at 31 Mar 2016 (1DLC valued at c.€25m and SOBO Works valued at c.€6m). 1DLC and SOBO Works were completed shortly after year end
(2) As per CBRE Mar 2016 except for Harcourt Square which is an internal estimate as it is valued on a development/residual basis(3) Weighted by contracted rent
• In-place office portfolio – i.e. portfolio excluding assets under development or refurbishment – has the following characteristics:
– Value at 31 Mar: €616m(1)
– Passing rent of €24.1m; contracted rent of €27.3m
– Average rent of €33psf vs ERV(2) of €44psf
– Average 2.0yrs to earlier of rent review or lease expiry
– 45% of leases(3) with break or expiry beyond 2019

34
Office leasing activity during the year and future lettings
Office leasing activity this year
Tenant Building Type
Contracted rent€m
Contracted rent €psf
% of Group
rent
Term
NotesTo expiry To break
Cumberland House
Office €5.3m €50psf(1) 14% 20yrs 12yrs • Lease which starts in Q4 2016 extended by a total of 16.5k sq. ft. through additional areas & design efficienciesgenerating additional rent of €0.7m
One DocklandCentral
Office €1.3m €45psf 3% 20yrs 10.5yrs • Lease commenced in February 2016 (6 month rent free)
SOBO Works Office €0.4m €35psf(2) 1% 13yrs(3) 6yrs • Lease commenced in April 2016 (10 month rent free)(4)
Central Quay Office €0.6m €52.50psf 2% 10yrs 3yrs • Lease commenced in April 2016
Various CBD offices €0.2m €32.85psf <1% N/A N/A • Flexible short term leases signed on Hanover St. East and rent review agreed with Morgan Stanley in Observatory Building
Total €7.8mFuture lettings
Building TypeOffice NIA
sq. ft. Available from Notes
1DLC Office 30k sq. ft. Immediately • In advanced discussions with potential tenant regarding the entire remaining space
Central Quay Office 18k sq. ft. Immediately • In discussions with potential occupiers
Cumberland House Office 33k sq. ft. Q4 2016 • In discussions with potential occupiers
1WML Office 122k sq. ft.(5) Late 2017 • Marketing commenced
1SJRQ Office 110k sq. ft. Mid 2018 • Marketing commenced
Total 313k sq. ft.
(5) Hibernia owns 50%(1) Office area only i.e. excl. additional basement(2) Stepped rent for 4yrs. €35psf is average over period(3) Weighted average. Main lease is for 15yrs(4) 6 months rent free plus an additional 4 months rent free in lieu of landlord credit

€0m
€1.0m
€2.0m
€3.0m
€4.0m
€5.0m
€6.0m
€7.0m
€8.0m
Sep-16 Mar-17 Sep-17 Mar-18 Sep-18 Mar-19 Sep-19 Mar-20 Sep-20 Mar-21
Co
ntr
acte
d R
ent
Six months ended
Valuers' ERV at 31 Mar 16
35
Schedule of rent reviews(1) for in-place office tenants
To earlier of rent review or lease expiry
(1) To earlier of rent review or lease expiry. Excludes various parking licenses, retail space in office buildings and Parkrite in the Forum(2) Harcourt Square ERV is internal assessment excl. redevelopment. All other ERVs are per CBRE as at 31 Mar 2016
Weighted average period to rent review or lease expiry of 2.0 years
Current in-place office contracted rent: €27.3m
Avg. rent: €26psf
Avg. rent: €46psf
Avg. rent: €50psf
Avg. rent: €30psf
Avg. rent: €48psf
Avg. rent: €24psf
Avg. rent: €36psf
Avg. rent: €26psfAvg. rent: €36psf
Avg. rent: €33psf
(2)

Remainder of non-core assets Units Carrying value
Residential assets 15 3,569
Total 15 3,569
Sale agreed at year end Units Carrying value Price agreed Expected profit(1)
Residential assets 1 354 460 106
Total 1 354 460 106
36
Progress on sale of non-core assets
Progress on sale of non-core assets in y/e Mar 16
Since period end the sale of the agreed unit has formally closed and the sale of a further 7 units (from the remainder) has also been agreed with a gross sale value of €1.8m
Sold or contracted in year Units Carrying value Sales price Profit
Residential assets 46 12,168 13,134 966
Commercial assets 3 2,410 3,580 1,170
Total 49 14,578 16,714 2,136
(€ in thousands)
(€ in thousands)
(€ in thousands)
(1) Excl. tax payable on net profits arising on disposal
37
Agenda
Market update
Acquisitions and developments
Portfolio management
Conclusion and outlook
Highlights
Financial results

38
Company delivering on strategy
Portfolio rich in development and asset management opportunities
Supportive property market and Irish economic backdrop
Hibernia well positioned to exploit further opportunities
Conclusion and outlook
Creating value through active management

39
Appendix

Location of portfolio
40
(1) property assets > €5m in value as at 31 March 2016 Key: Office Residential Industrial Office developmentSource: Google Maps, Visit Dublin, Jones Lang LaSalle
Croke ParkFairview Park
River Liffey
Kings Inns
St. Stephens
Green
9
8 7
6
212
13
14
4
5
11
10
15
Central Dublin portfolio(1)
1 Wyckham Point
2 New Century House
3 Gateway Site
4 Montague House
5 Hardwicke House
6 Chancery Building and Chancery Apartments
7 Hanover Building
8 1WML
9 Observatory
10 Guild House (Two Dockland Central)
11 One Dockland Central
12 The Forum
13 1SJRQ
14 Cumberland House
15 Harcourt Square
16 Dundrum View
17 Central Quay
18 One Earlsfort Terrace
19 Marine House
3
M1
M50
M50
N3/M3
N2/M2
M50
Dublin
N81
Howth
Clontarf
DublinAirport
North BullIsland
Portmarnock
Blanchardstown
Clondalkin
Tallaght
Blackrock
Ballsbridge
Rathfarnham
Phibsborough
DrumcondraCastleknock
Sutton
NorthernCross
Beaumont
Ballymun
The Ward
NorthwestBusiness Park
Glenageary
Dundrum
Palmerstown
Kimmage
N11
Ballymount
N4/M4
N7/M7
1 Wyckham Place
3 Gateway Site
16 Dundrum View
1 &16
3
Dublin Overview(1)
17
18
19
CBD
1 &16
Herbert Park

12 mths to
31-Mar-16
12 mths to
31-Mar-15
Revenue 32,786 18,769
Direct property costs (2,497) (725)
Property Income 30,289 18,044
IM base fee - (4,690)
IM performance fee accrual (6,069) (5,772)
Adminis trative expenses (8,696) (1,584)
Net finance income / (costs ) (4,087) (1,575)
Net rental profit 11,437 4,423
Revaluation/other ga ins :
Investment properties (2) 125,056 90,868
Other ga ins and losses(3) (171) (2,368)
Taxation 475 (691)
Total revaluation/other gains: 125,360 87,809
Net income for the period 136,797 92,232
Diluted IFRS EPS (cents) 20.1 18.3
EPRA Earnings 10,024 3,961
Diluted EPRA EPS (cents) 1.5 0.80
31-Mar-16 31-Mar-15
Investment Properties (1) 927,656 641,296
Assets held for sa le 3,921 18,499
Other non current assets 14,977 152
Cash and cash equiva lents 23,187 139,048
Trade and other receivables 18,880 9,046
Gross assets 988,621 808,041
Current l iabi l i ties (19,323) (54,907)
Financia l l iabi l i ties (72,724) -
Net assets 896,574 753,134
Equity share capita l 672,398 657,987
Reta ined earnings 226,161 91,388
Dividends pa id (8,121) (2,013)
Other reserves 6,136 5,772
Total equity 896,574 753,134
IFRS NAV per share (cents) 131.6 112.4
Diluted IFRS NAV per share (cents) 130.7 111.6
EPRA NAV per share (cents) 130.8 111.8
41
Summary financial statements
Balance sheet highlights Summary income statement
(€ in thousands)(€ in thousands)
(1) Incl. 50% interest in Windmill Lane(2) 12 months to March 2015 includes €10m gain from Block 3, Wyckham Point classified as ‘other gains’ in income statement (3) Profits arising on disposal of non-core properties offset by amortisation of base fee paid to “non-restricted” vendors

42
Further statistics
Contributions to Irish GDP growth
Source: CSO, Goodbody, Hibernia
Source: CBRE
Vacancies reducing and continued limited supply
-10%
-5%
0%
5%
10%
20
03
20
04
20
05
20
06
20
07
20
08
20
09
20
10
20
11
20
12
20
13
20
14
20
15
20
16
f
20
17
f
Consumption Government expenditure Investment Net exports
GDP growth
80
90
100
110
120
130
140
150
20
10Q
1
20
10Q
2
20
10Q
3
20
10Q
4
20
11Q
1
20
11Q
2
20
11Q
3
20
11Q
4
20
12Q
1
20
12Q
2
20
12Q
3
20
12Q
4
20
13Q
1
20
13Q
2
20
13Q
3
20
13Q
4
20
14Q
1
20
14Q
2
20
14Q
3
20
14Q
4
20
15Q
1
20
15Q
2
20
15Q
3
20
15Q
4
Dublin public transport trips Dublin port tonnage Dublin airport arrivals
Source: Dublin Economic Monitor
4 6 9 6
11 7 55
3 43
45
21
14 17
0
10
20
30
40
50
60
70
<5k sq. ft. 5k-10k sq. ft. 10k-20k sq. ft. 20k-50k sq. ft. 50k-100k sq. ft. >100k sq. ft.
No
of
Pro
per
ties
Dublin 1/3/7 Dublin 2/4 Dublin 6/8 IFSC Suburbs
Location of Grade A vacancies in Dublin CBD concentrated in suburbs
0
1
2
3
4
0
5
10
15
202530
35
40
45
50
Q4
04
Q4
05
Q4
06
Q4
07
Q4
08
Q4
09
Q4
10
Q4
11
Q4
12
Q4
13
Q4
14
Q4
15
Q1
16
Millio
ns Sq
FtMill
ion
s Sq
Ft
Occupied Stock Vacant Stock Completions (RHS)
Source: CBRE @ 31st March 2016
Dublin airport arrivals, port tonnage and public transport trips

43