preliminary results of simple durability tests on mixes
TRANSCRIPT

1
Preliminary Results of Simple Durability Tests on Mixes from the FHWA ALF Experiment

2
Evaluation of Simple Mix Tests to Assess Cracking Resistance
Task 37 of FHWA-NCAT Cooperative Agreement Original plan was to get materials from WesTrack FHWA ALF mix samples obtained by MeadWestvaco The objective is to determine if results of selected tests
correlate with observed cracking performance using 10 mixtures from the 2013 FHWA ALF experiment.

Facility Overview

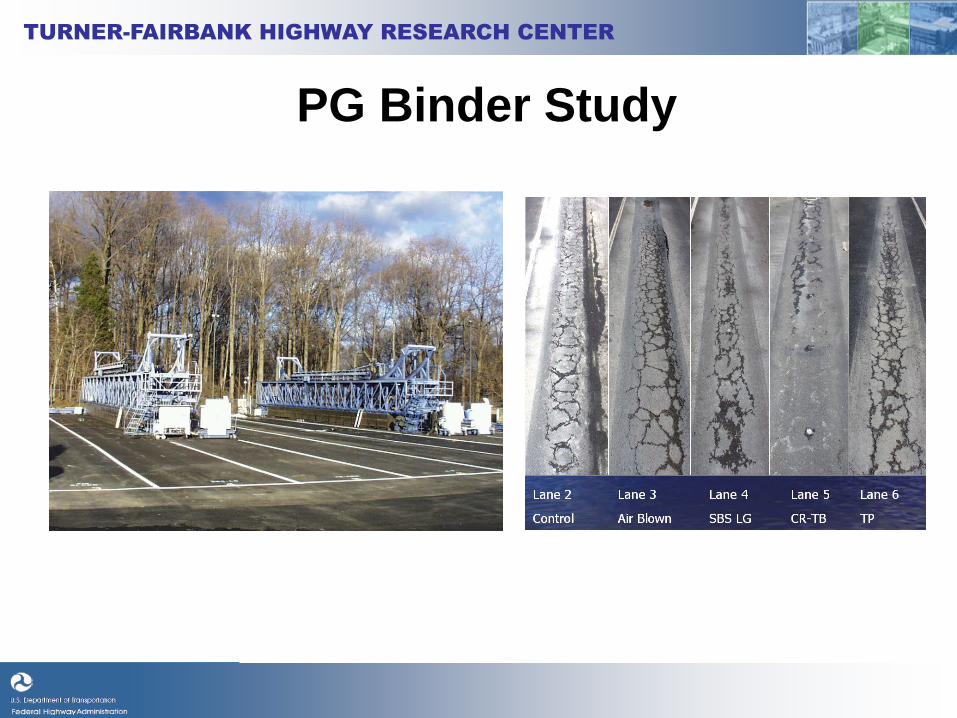
PG Binder Study

PG Binder Study

300oF - 320oF 240oF - 270oF
- Foam Chem.
0% - -
20% ABR RAP ≈ 23% by weight
20% ABR RAS ≈ 6% Shingle by
weight
40% ABR RAP ≈ 44% by weight
PG58-28 PG58-28 PG58-28
PG64-22
PG64-22
PG64-22 PG64-22
PG58-28
PG64-22
PG64-22
ALF Experimental Design

8
Mixes from FHWA ALF Experiment
All lanes were built to a total of 4 inches of asphalt mix. Testing of the lanes began in Fall 2013 and is expected to be completed in Fall 2015.
Lane WMA Type
RAP BR (%) RAS BR (%) Virgin
Binder PG Prod.
Temp. (F) 1 n/a 0 0 64-22 285 2 foam 40 0 58-28 240 3 n/a 0 5 64-22 285 4 chem. 20 0 64-22 240 5 n/a 40 0 64-22 285 6 n/a 20 0 64-22 285 7 n/a 0 5 64-22 240 8 n/a 40 0 58-28 285 9 foam 20 0 64-22 240
11 chem. 40 0 58-28 240

9
Tests Conducted Test Method Cantabro ASTM D7064-08 SCB LTRC modified by Zhou IDT Work NCAT Overlay Tester Tex-248-F modified by Ma
• Test specimens were made from SGC samples compacted to Ndesign (65 gyrations)
• Using Ndesign specimens provides the quickest and simplest path to implementation for any of these durability “performance” tests.
• Sealed buckets of mix were reheated for 2 hours for HMA and 4 hours for WMA mixtures, samples for each test were weighed out and brought back to the compaction temperature before SGC compaction.

10
Cantabro Test
Primarily used for OGFC mixes One compacted specimen placed in
LA Abrasion drum at a time No Steel Balls 300 drum revolutions Calculate mass loss Studies by Doyle and Howard

11
Cantabro Results 0.0% 2.0% 4.0% 6.0% 8.0% 10.0% 12.0% 14.0%
40%RAP HMA 64-22 285
5%RAS HMA 64-22 285
40%RAP HMA 58-28 285
5%RAS None 64-22 240
40%RAP Foam 58-28 240
20%RAP HMA 64-22 285
20%RAP Chem 64-22 240
20%RAP Foam 64-22 240
No RAP or RAS 64-22 285
40%RAP Chem 58-28 240
53
87
26
49
111
Avg. Cantabro Loss (%)
A
A
A
A
A
A
B
B
B
B
B
B
B
C
C
C
C
C
C
Tukey Statistical Groupings
Average COV = 19%

12
Modified Overlay Test
Method modified by NCAT Displacement = 0.381 mm Cycle = 1 Hz Failure = peak of normalized load
x cycle Conducted in AMPT @ 25°C
Triplicates

13
0 2,000 4,000 6,000 8,000 10,000 12,000 14,000
20%RAP Foam 64-22 240
20%RAP Chem 64-22 240
40%RAP HMA 58-28 285
40%RAP Chem 58-28 240
20%RAP HMA 64-22 285
40%RAP Foam 58-28 240
No RAP or RAS 64-22 285
40%RAP HMA 64-22 285
5%RAS HMA 64-22 285
5%RAS None 64-22 240
94
811
62
15
37
Overlay Test Cycles to Failure
Overlay Test Results
A
A
A
A
A
A
B
B
B
B
B
B
B
Average COV = 32%
Tukey Statistical Groupings
B
B
A
A
Lane 9 Results 3,880 3,893 8,094
13,687

14
IDT Fracture Energy
50 mm thick specimens Ram rate = 50 mm/min. Temp. = 25°C Triplicates
0.0
2.0
4.0
6.0
8.0
10.0
12.0
14.0
0.0 2.0 4.0 6.0 8.0 10.0 12.0
Load
(kN
)
Displacement (mm)

15
0.0 1.0 2.0 3.0 4.0 5.0 6.0 7.0 8.0 9.0
5%RAS HMA 64-22 285
20%RAP Foam 64-22 240
40%RAP Foam 58-28 240
40%RAP Chem 58-28 240
20%RAP HMA 64-22 285
5%RAS None 64-22 240
No RAP or RAS 64-22 285
20%RAP Chem 64-22 240
40%RAP HMA 58-28 285
40%RAP HMA 64-22 285
39
211
67
14
85
Fracture Energy (J)
IDT Fracture Energy Results
A
A
A
A
A
A
Tukey Statistical Groupings
Average COV = 19%
A
A
A A

16
Semi-Circular Bend Test
50 mm thick specimens Ram rate = 0.5 mm/min. Notch depths of 38.1, 31.8, 25.4 mm Triplicates
y = -0.0388x + 1.9336 R² = 0.70
0.0
0.2
0.4
0.6
0.8
1.0
1.2
1.4
15 20 25 30 35 40 45
Area
to P
eak
Load
(kN
-mm
)
Specimen Notch Length (mm)

17
SCB Results
A
A
A
A
A
A
B
B
B
B
B
B
B
Average COV for Area to Peak Load = 27%
B
B
A
A
0.0 0.1 0.2 0.3 0.4 0.5 0.6 0.7 0.8 0.9
20%RAP Foam 64-22 240
40%RAP Chem 58-28 240
40%RAP Foam 58-28 240
20%RAP HMA 64-22 285
40%RAP HMA 64-22 285
No RAP or RAS 64-22 285
5%RAS None 64-22 240
5%RAS HMA 64-22 285
20%RAP Chem 64-22 240
40%RAP HMA 58-28 285
911
26
51
73
48
Jc (kJ/m2)

18
Preliminary Observations Only the Cantabro was able to statistically differentiate the
virgin mix from any other experimental mix. Statistical analysis of SCB data has not been finalized.

19
Remaining Work Statistical analysis of SCB work vs notch depth slopes Get cracking performance of ALF lanes and conduct
correlation analyses between lab and field results Explore other parameters from tests conducted Prepare final report

20
Any Questions?