preliminary soil ph map of australia - geoscience australia · preliminary soil ph map of australia...
TRANSCRIPT
issue 97 Mar 2010
Preliminary Soil pH map of Australia www.ga.gov.au/ausgeonews | 1
Preliminary Soil pH map of Australia New dataset will support resource evaluation and environmental monitoringPatrice de Caritat, Michelle Cooper, Gary Burton1, Roger Fidler2, Geoff Green3, Emily House4, Colin Strickland5, Joseph Tang6 and Andrew Wygralak7
Data gathered in the fi eld during the sample collection phase of the
National Geochemical Survey of Australia (NGSA) has been used to
compile the Preliminary Soil pH map of Australia. The map, which
was completed in late 2009, offers a fi rst-order estimate of where
acid or alkaline soil conditions are likely to be expected. It provides
fundamental datasets that can be used for mineral exploration and
resource potential evaluation, environmental monitoring, landuse
policy development, and geomedical studies into the health of
humans, animals and plants.
Background
Since their inception in the 1960s, regional geochemical surveys have
proven to be a reliable tool for mineral exploration, particularly as a
complement to other regional, national or continental-scale geological
and geophysical datasets. However, until now there has been no
geochemical coverage for the whole of Australia.
The National Geochemical Survey of Australia (NGSA) project
was initiated in late 2006 as part of Geoscience Australia’s Onshore
Energy Security Program (Johnson 2006). The Program provides
pre-competitive data and knowledge to support exploration for energy
resources in Australia. As a spin-off, the NGSA will also establish a
baseline geochemical database and atlas, which will fi nd applications
in various disciplines. The NGSA is carried out in collaboration with
each of the state and Northern Territory geoscience agencies.
sampling strategy
Catchment outlet sediments, which are similar to fl oodplain
sediments in most cases, were the target sampling material for
the NGSA. This sampling medium has been widely used in
overseas geochemical surveys because it is representative of the
average regolith composition in a catchment (Ottesen et al 1989).
Catchments are sampled as close as possible to their lowest point
(usually their outlet). Small coastal catchments and small islands
were not included in the survey.
For the NGSA, catchment
outlet sediments were sampled at
two depths. Firstly a Top Outlet
Sediment (TOS) sample is taken
between zero and 10 centimetres
below the surface or root zone
if applicable. Then a Bottom
Outlet Sediment (BOS) sample,
representing an interval of about
20 centimetres is taken from a
depth between around 60 and 80
centimetres (on average). Both
types of samples are composites
homogenised from a shallow
soil pit (TOS) or a minimum
of three hand-augered holes
(BOS). Samples were taken
from a total of 1192 catchments
covering about six million
square kilometres or over 80 per
cent of the area of continental
1Geological Survey of New South Wales. 2Primary Industries and Resources South Australia. 3Mineral Resources Tasmania. 4GeoScience Victoria. 5Geological Survey of Western Australia. 6Geological Survey of Queensland. 7Northern Territory Geological Survey.
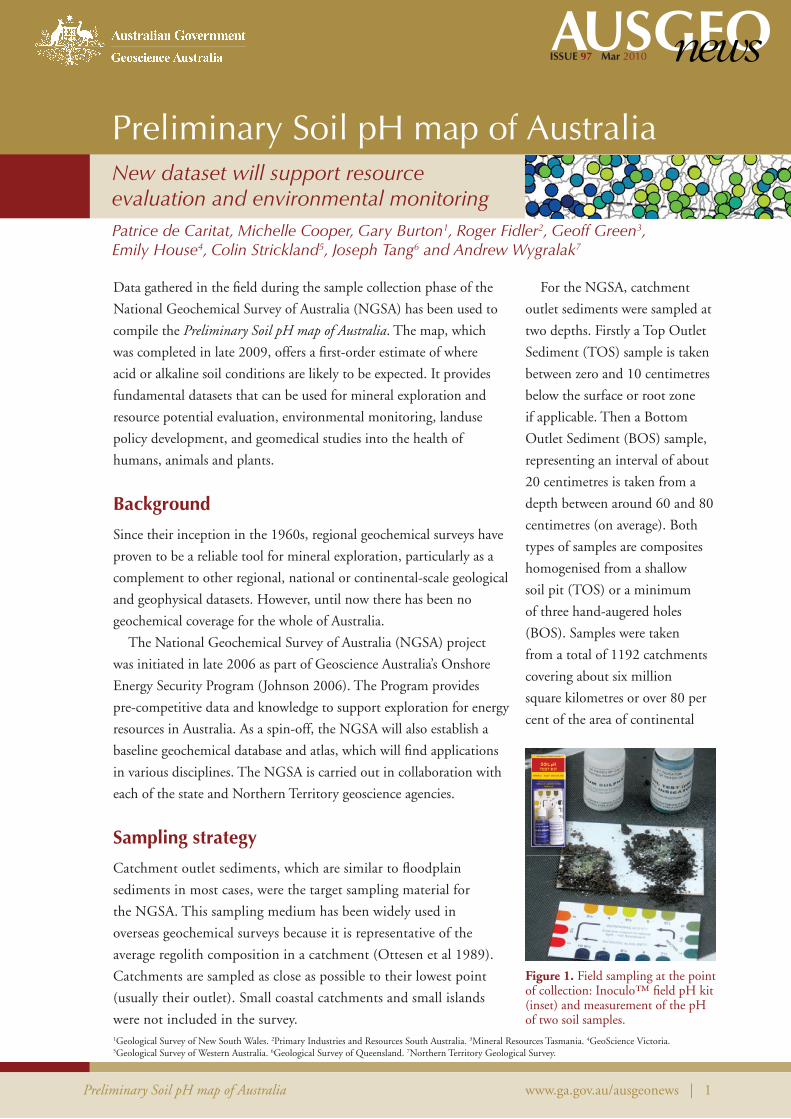
Figure 1. Field sampling at the point of collection: Inoculo™ fi eld pH kit (inset) and measurement of the pH of two soil samples.
issue 97 Mar 2010
Preliminary Soil pH map of Australia www.ga.gov.au/ausgeonews | 2
Australia across all states and territories. The average sampling density
for the area sampled is approximately one sample every 5500 square
kilometres. Sample collection and preparation were carried out in
accordance with a Field Manual (Lech et al 2007) and a Sample
Preparation Manual (Caritat et al 2009) compiled for the survey.
Determining the soil pH
The field pH, which forms the basis of the Preliminary Soil pH map of Australia, was determined in the field by the saturated paste method using Inoculo™ field pH kits developed by CSIRO (figure 1). The field pH method entails:
• saturating a small amount of soil (about one cubic centimetre) with a universal indicator
• mixing soil and indicator to form a paste
• lightly dusting the saturated paste with white barium sulfate powder
• waiting one minute for the indicator to react with the soil
• matching the colour of the powder to a chart with half pH unit increments.
To some extent this empirical method depends on the user’s ability to match colours and on lighting conditions; it also only has a resolution of one half of a pH unit and hence is a relatively ‘coarse’ measurement. Therefore, results should be considered a ‘first pass’ only. Preliminary comparisons with (a) pH values determined in the lab using solutions with a ratio of one unit soil to five units water, and (b) with pH estimates derived from visible near-infrared spectroscopy, however, suggest general correlation and overall robustness of the field pH data. The data is based on one site per catchment and cannot, therefore, inform on intra-catchment pH heterogeneity.
Results
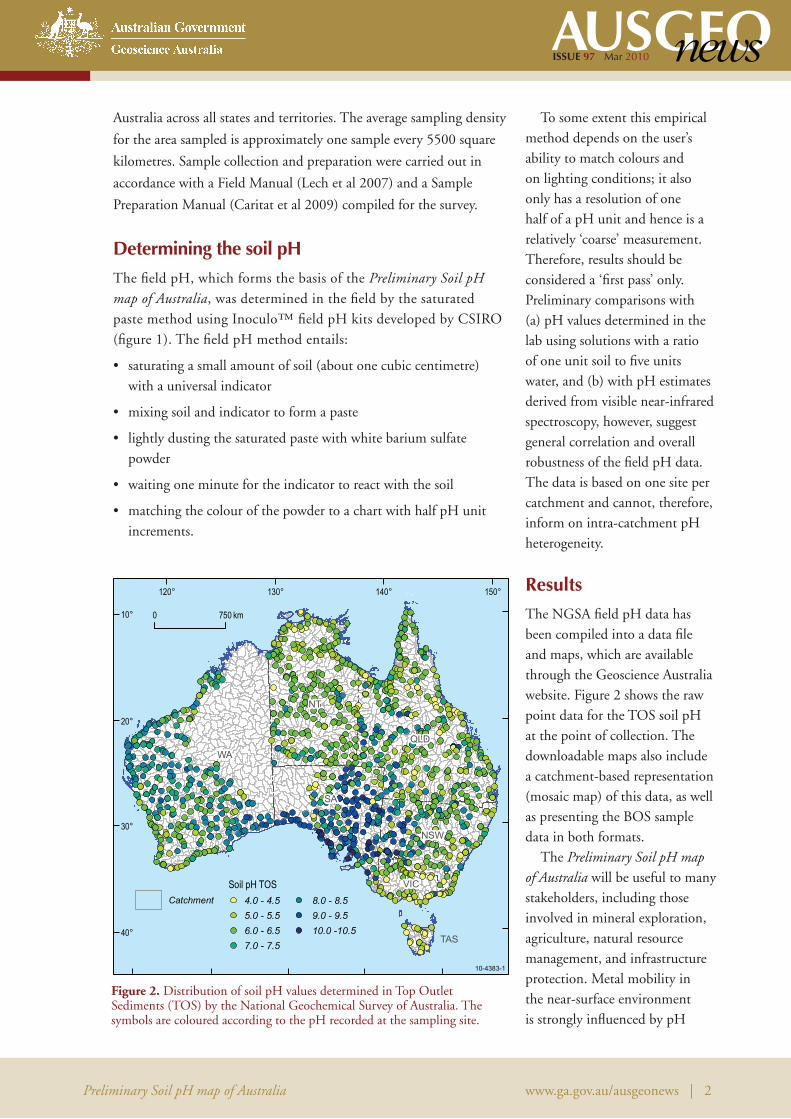
The NGSA field pH data has been compiled into a data file and maps, which are available through the Geoscience Australia website. Figure 2 shows the raw point data for the TOS soil pH at the point of collection. The downloadable maps also include a catchment-based representation (mosaic map) of this data, as well as presenting the BOS sample data in both formats.
The Preliminary Soil pH map of Australia will be useful to many stakeholders, including those involved in mineral exploration, agriculture, natural resource management, and infrastructure protection. Metal mobility in the near-surface environment is strongly influenced by pH
NT
WA
SA
QLD
NSW
VIC
TAS
150°140°130°120°
10°
20°
30°
40°
10-4383-1
0 750 km
Catchment 4.0 - 4.55.0 - 5.56.0 - 6.57.0 - 7.5
8.0 - 8.59.0 - 9.510.0 -10.5
Soil pH TOS
Figure 2. Distribution of soil pH values determined in Top Outlet Sediments (TOS) by the National Geochemical Survey of Australia. The symbols are coloured according to the pH recorded at the sampling site.
issue 97 Mar 2010
Preliminary Soil pH map of Australia www.ga.gov.au/ausgeonews | 3
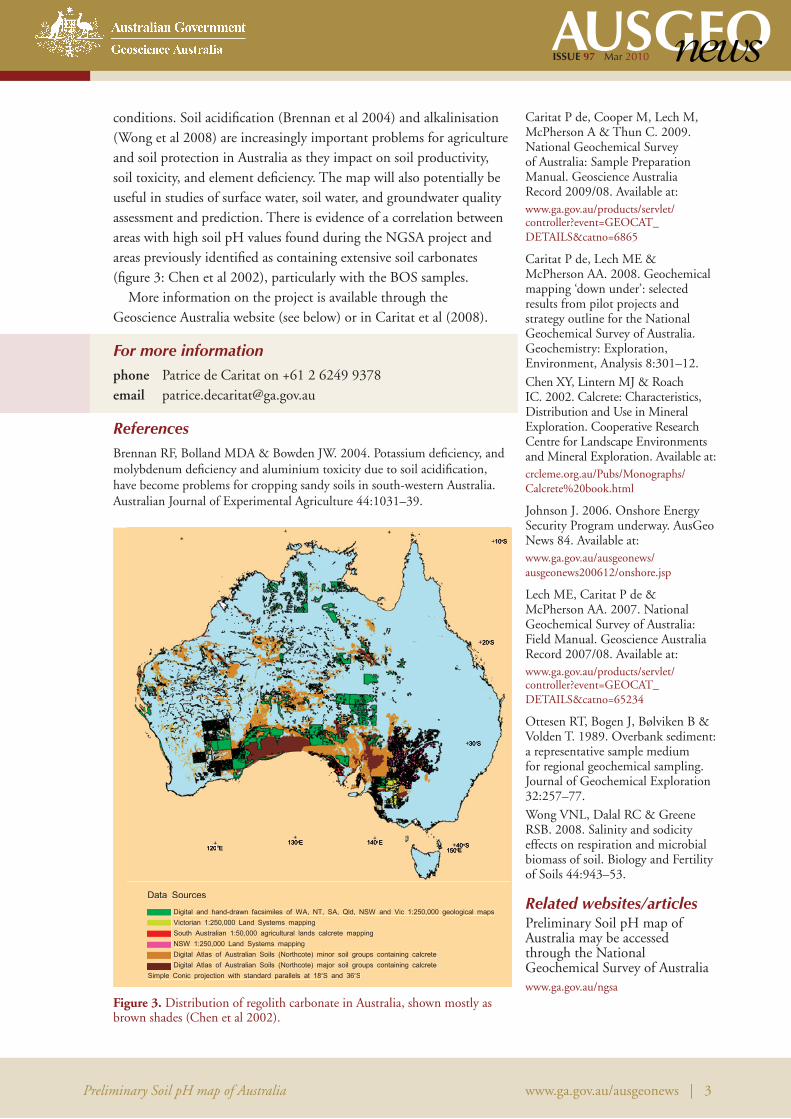
conditions. Soil acidifi cation (Brennan et al 2004) and alkalinisation (Wong et al 2008) are increasingly important problems for agriculture and soil protection in Australia as they impact on soil productivity, soil toxicity, and element defi ciency. The map will also potentially be useful in studies of surface water, soil water, and groundwater quality assessment and prediction. There is evidence of a correlation between areas with high soil pH values found during the NGSA project and areas previously identifi ed as containing extensive soil carbonates (fi gure 3: Chen et al 2002), particularly with the BOS samples.
More information on the project is available through the Geoscience Australia website (see below) or in Caritat et al (2008).
For more informationphone Patrice de Caritat on +61 2 6249 9378email [email protected]
ReferencesBrennan RF, Bolland MDA & Bowden JW. 2004. Potassium defi ciency, and molybdenum defi ciency and aluminium toxicity due to soil acidifi cation, have become problems for cropping sandy soils in south-western Australia. Australian Journal of Experimental Agriculture 44:1031–39.
Caritat P de, Cooper M, Lech M, McPherson A & Thun C. 2009. National Geochemical Survey of Australia: Sample Preparation Manual. Geoscience Australia Record 2009/08. Available at:www.ga.gov.au/products/servlet/controller?event=GEOCAT_DETAILS&catno=6865
Caritat P de, Lech ME & McPherson AA. 2008. Geochemical mapping ‘down under’: selected results from pilot projects and strategy outline for the National Geochemical Survey of Australia. Geochemistry: Exploration, Environment, Analysis 8:301–12.
Chen XY, Lintern MJ & Roach IC. 2002. Calcrete: Characteristics, Distribution and Use in Mineral Exploration. Cooperative Research Centre for Landscape Environments and Mineral Exploration. Available at: crcleme.org.au/Pubs/Monographs/Calcrete%20book.html
Johnson J. 2006. Onshore Energy Security Program underway. AusGeo News 84. Available at: www.ga.gov.au/ausgeonews/ausgeonews200612/onshore.jsp
Lech ME, Caritat P de & McPherson AA. 2007. National Geochemical Survey of Australia: Field Manual. Geoscience Australia Record 2007/08. Available at:www.ga.gov.au/products/servlet/controller?event=GEOCAT_DETAILS&catno=65234
Ottesen RT, Bogen J, Bølviken B & Volden T. 1989. Overbank sediment: a representative sample medium for regional geochemical sampling. Journal of Geochemical Exploration 32:257–77.
Wong VNL, Dalal RC & Greene RSB. 2008. Salinity and sodicity effects on respiration and microbial biomass of soil. Biology and Fertility of Soils 44:943–53.
Related websites/articlesPreliminary Soil pH map of Australia may be accessed through the National Geochemical Survey of Australiawww.ga.gov.au/ngsa
�������� ���� ����������� �������� �� ��� �� ���� ��� ����� ���� ���� ���� ���������� ��� ����� ����
���������� ���������� ����� ������� ������
������ ���������� ��������� � ����������� ������ ������� ������
���� ���������� ����� ������� ������
�� ����� ����� ��� ���������� ������ ����������� ������ ����� ������ ��������� � ������
�� ����� ����� ��� ���������� ������ ����������� ������ ����� ������ ��������� � ������
������ ������ ���������� ����� ��������� ��������� ��� ����� ���� ����
����� ����� �
����
����
����
�����
����� ����� ���������
Figure 3. Distribution of regolith carbonate in Australia, shown mostly as brown shades (Chen et al 2002).