preliminary study of the adsorption kinetic of sb(v) on … · preliminary study of the adsorption...
TRANSCRIPT
2013
International Summer Water Resources Research School Dept. of Water Resources Engineering, Lund University
Preliminary study of the adsorption kinetic of Sb(V) on Zn/Cr layered double hydroxides
By
Sarha Rodin Holst

Sarha Rodin Holst VVRF05 2013-07-19
1
Abstract Pollution of heavy metals due to industrial activities and other anthropogenic sources is a constantly growing problem. In order to reduce the obvious threat from these anthropogenic sources it is necessary to establish systematic and thoroughgoing wastewater treatment. One important contaminating chemical in industrial wastewaters today is antimony. Higher demand on plastic, textiles and cars due to increased material standard throughout the world will increase the use of antimony and hence the anthropogenic emissions and pollution of this chemical. There are not many known and developed methods for the removal of antimony in industrial wastewaters. Layered double hydroxides, LDHs, are a group of inorganic clays which have proved to be an effective anion adsorbent. Thus, the use of LDHs could be a potential method for removal of antimonite. LDHs are economically beneficial and may be synthesized from heavy metals recovered from plating wastewaters. The aim of this study is to investigate the optimal adsorption of antimony on Zn/Cr LDHs depending on temperature and reaction time. The kinetics of antimony adsorption on Zn/Cr LDHs will also be investigated further. The results indicates that Zn/Cr LDH of ratio 3:1used in the experiments has potential to be utilized in larger scale wastewater treatment plants, since the adsorption reaches approximately 130 mg adsorbed antimony per g LDH at reaction equilibrium at room temperature. The result of the adsorption capacity is superior at a reaction temperature around 323 K. The rate of antimony adsorption on Zn/Cr LDH increases with increasing temperature. Hence the experiments show that the highest rate of adsorption is reached at 323 K. After applying the six different kinetic models to the data of different experimental temperatures, the second-order model appears to have the best fit. However, the adsorption capacity of different temperatures is in need of further study in order to draw further conclusions. Keywords: Antimony, adsorption kinetics, Zn/Cr LDH, atomic fluorescence spectrometry.

Sarha Rodin Holst VVRF05 2013-07-19
2
Table of Contents Abstract ....................................................................................................................................................... 1
Table of Contents ........................................................................................................................................ 2
1. Introduction ........................................................................................................................................ 3
1.1 Pollution of heavy metals .................................................................................................................. 3
1.2 Antimony ........................................................................................................................................... 3
1.3 Aim .................................................................................................................................................... 4
2. Theory ................................................................................................................................................. 4
2.1 Layered double hydroxides ......................................................................................................... 4
2.1.1 Structure ..................................................................................................................................... 4
2.1.2 Synthesis ..................................................................................................................................... 5
3. Experiments ........................................................................................................................................ 6
3.1 Materials ........................................................................................................................................... 6
3.1.1 Chemicals ................................................................................................................................... 6
3.3.2 Instruments ................................................................................................................................ 6
3.2 Method .............................................................................................................................................. 6
3.2.1 Standard curve fitting ................................................................................................................. 6
3.2.2 Parameters of the atomic fluorescence spectroscopy ................................................................ 7
3.2.3 Preparation of test samples ........................................................................................................ 7
3.2.4 Kinetic models ............................................................................................................................ 8
4. Results and discussion ......................................................................................................................... 9
4.1 Standard curve fitting ........................................................................................................................ 9
4.2 Adsorption capacity on LDH .............................................................................................................. 9
4.3 Intra-particle diffusion ..................................................................................................................... 10
4.4 Kinetic models ................................................................................................................................. 12
5. Conclusion ......................................................................................................................................... 14
6. Acknowledgements ........................................................................................................................... 15
7. References ......................................................................................................................................... 15
8. Appendix ........................................................................................................................................... 16
8.1 Standard curve ................................................................................................................................ 16
8.2 Calculations of Sb concentration and adsorption ............................................................................ 16

Sarha Rodin Holst VVRF05 2013-07-19
3
1. Introduction
1.1 Pollution of heavy metals
Pollution of heavy metals due to industrial activities and other anthropogenic sources is a constantly growing problem. Industrial activities such as mine and ore processing, electroplating and metal finishing give rise to several types of undesirable and toxic effects. In order to reduce the obvious threat from these anthropogenic sources it is necessary to establish systematic and thoroughgoing wastewater treatment. The present methods for removal of hazardous substances from wastewater require a lot of water recourses and produce large amounts of toxic sludge [1]. This results in large amounts of water and sludge that is in need of further treatment. Hence, it is necessary to develop new and up-to-date methods for water treatment in order to reduce the currently growing dilemma of enriched toxic substances in the world.
1.2 Antimony
Antimony is a naturally occurring element, a metalloid which belongs to group 15 in the Periodic Table. The chemical properties of antimony are considered to be similar to that of arsenic but the environmental and solubility behavior and control techniques are scarcely known. Antimony has many applications. The most common use is as alloying material for lead and tin. Antimony alloyed lead and tin improves the properties of the alloys used in for example solders, bullets and brake linings in transport vehicles. Compounds of antimony are also commonly used as a flame retarding additive on textiles and plastic, and have had an emerging appliance in microelectronics in the past few years [2]. Due to mining of antimony and smelting processes, large amounts of antimony have been released causing severe contamination of the local environments surrounding these mentioned industrial sites [2]. Antimony pollution also occurs due to combustion of coal and metal sulfide ores. During combustion the antimony is partly released to the atmosphere and partly partitioned into the solid remains. Hence the antimony is polluting the soils and geochemistry as well as the atmosphere, distributing antimony over large land scales due to precipitation [2]. Higher demand on plastic, textiles and cars due to increased material standard throughout the world will increase the use of antimony and hence the anthropogenic emissions and pollution. The metalloid is considered to be hazardous to human health and various studies claim that the chemical is carcinogenic [2]. In unpolluted systems, the typical concentration of antimony is less than 1 µg/L [3]. The World Health Organization considers the maximum levels for safe drinking water to be 20 µg/L [4]. The acceptable limit for safe drinking water is set to 5 µg/L in China. However, this limit has been exceeded in several districts in China where antimony is geogenically enriched due to anthropogenic pollution [2]. Hence it is of major importance to investigate the properties of antimony and chart the use of chemicals in today’s industries. There are not many known and developed methods for the removal of antimony in industrial wastewaters. Since the chemical properties of antimony traditionally have been compared with those of arsenic, several methods for reducing arsenic have been tried out on antimony as well. Some of these methods include precipitation and coagulation of antimony ions with ferric or aluminum salts which have shown to be somewhat effective. Unfortunately these methods are too costly to be sustainable in small scale treatment plants [5]. Other methods for removal are sorption on activated alumina and layered double hydroxides of different compositions [6]. It

Sarha Rodin Holst VVRF05 2013-07-19
4
has become more interesting to use layered double hydroxides in water treatment because they are economically beneficial. The hydroxides may consist of natural occurring and abundant minerals, which in some instances can be recovered from plating wastewaters [7].
1.3 Aim
The aim of this study is to investigate the optimal adsorption of antimony on Zn/Cr layered double hydroxides depending on temperature and reaction time. The adsorption will be examined for four different temperatures. An atomic fluorescence spectroscopy will be used to investigate the amount of adsorbed antimony in prepared samples. The purpose is also to study the adsorption kinetics according to six models presented further in the report.
2. Theory
2.1 Layered double hydroxides
2.1.1 Structure
Layered double hydroxides are a class of nanostructure anionic clays. They exist as naturally occurring minerals although they are relatively easy and inexpensive to synthesize. Layered double hydroxides, LDH, can be illustrated as countless positive charged sheets consisting of octahedral units stacked on top of each other. These sheets are held together by hydrogen bonding and balanced by negatively charged interlayers. This interlayer regions are often occupied by hydrogen bonded water molecules and other anions like chloride and sulfide. The anions that are located in the LDH can be replaced by other organic or inorganic anions that occur in a solution, for example antimony [8]. This property makes LDH a commonly used material for adsorption of unwanted anions in for example wastewater.
Figure 1. Structure of layered double hydroxides
[8].

Sarha Rodin Holst VVRF05 2013-07-19
5
Generally, LDH is described by following formula [8],
(1)
Where represents divalent cations whilst represents trivalent cations. In this study Zn/Cr LDH was used and hence corresponds to while corresponds to . The value of is equal to the molar ratio of and is the interlayer anion of valence . There are many possible configurations of LDH since the character of , and can vary to a vast extent. The most common interlayer anion is carbonate, but anions such as halides, oxyanions and organic anions may also be accommodated [8].
2.1.2 Synthesis
Natural occurring layered double hydroxides is composed of the mineral hydrotalcite with formula (Mg6Al2(OH)16CO3 * 4H2O) [8]. However, LDHs are also relatively simple to synthesize and there are several developed techniques for this. The plainest and most commonly used method is co-precipitation [9]. This method is carried out by making an aqueous solution containing M2+, M3+ and the anion A in equation (1), precipitate during supersaturation. The precipitation is followed by a process of thermal treatment and aging in order to increase the yield and the crystallinity of the final LDH material. Another procedure is the ion exchange method where the present interlayer anions are exchanged to
the desired interlayer anion, A in equation (1) [8]. One way of replacing the present interlayer anions is
with the “memory effect”. This method removes water, anions and hydroxyl groups in the interlayer
region by calcinations of the LDHs. This results in mixed metal oxides with the ability to regenerate the
LDH-structure when exposed to water and anions. The anions do not need to be the same ones that
were incorporated before the calcinations and hence it is an important method to synthesize LDHs with
desired anions to fulfill specific required applications [8].
Since the hydroxides in LDH may consist of naturally occurring minerals it is possible to synthesize elements such as zinc and chrome from plating wastewaters in order to produce Zn/Cr LDH that will be used in this study. This procedure makes it possible to reduce hazardous anion pollutants in wastewater simultaneously [7].

Sarha Rodin Holst VVRF05 2013-07-19
6
3. Experiments
3.1 Materials
3.1.1 Chemicals Table 1. Chemicals used during the experiments.
Name Formula
Antimony solution K2H2Sb2O7 4H2O
Standard solution of antimony
Ascorbic acid C6H8O6
Thiourea SC(NH2)2
Hydrochloric acid HCl
Sodium nitrate NaNO3
Zn/Cr LDH Zn/Cr(SO42-)-LDH
3.3.2 Instruments Table 2. Equipment used during the experiments.
Instrument Model
Magnetic stirring Chijiu SH23-2
Water pump Diaphagagm GFP-24700 (3/8)
Heater HWCL-5
Scale Denver Instrument
Spectrometer AFS-8220
3.2 Method
3.2.1 Standard curve fitting
A standard curve for the Sb solution was made in order to be able to compare the results of the adsorption of antimony on the LDH at different temperatures and time intervals. Standard solution of antimony, with a concentration of 10 mg/L, was added to colorimetric tubes; 0, 0.05, 0.1, 0.2, 0.3, 0.4 and 0.5 mL. A reduction solution made by 5 g of ascorbic acid and 5 g thiourea, diluted to 100 mL with distilled water was added in 5 mL to each tube. Then 2.5 mL of concentrated HCl was added to each tube. After 20 minutes the content of the tubes were mixed and each sample tested in the atomic fluorescence spectroscopy. A standard curve could hence be drawn by plotting the intensity of emitted light as a function of known antimony concentration. The reduction solution was added to the standard solution of antimony in order to reduce occurring Sb(IV) to Sb(III) molecules. Hence the reduction solution and added HCl makes all antimony ions become SbH3 molecules. In the spectroscopy Sb(III) is turned into antimony atoms which are able to emit light and consequently results in a standard curve showing the emitted light depending on the concentration of antimony in each sample.

Sarha Rodin Holst VVRF05 2013-07-19
7
3.2.2 Parameters of the atomic fluorescence spectroscopy
The parameters of the spectroscopy were arranged as shown in table 3. Table 3. Parameters of the atomic fluorescence spectroscopy.
Performance parameter of AFS Values
Analyzed sample Sb
Negative high voltage 250 V
Current 40 mA
Flow rate of carrier gas, N2 300 mL/min
Flow rate of shielding gas, N2 800 mL/min
Volume of injected sample 0.5 mL
3.2.3 Preparation of test samples
The adsorption of antimony on LDH was examined at four different temperatures; 285 K, 298 K, 308 K, and 323 K. Hence the same apparatuses and procedure were carried out for all of the four temperatures. A double layered glass beaker with a cap was placed on top of a magnetic inductor. The solution of interest was poured into the glass beaker together with a magnetic stirrer, whilst water was placed in the outside layer of the beaker. The beaker was connected to a water pump, pumping the water in the outside layer from the top of the beaker into a heater/cooler. From the heater/cooler water was pumped to the bottom of the outside layer of the beaker. This creates a cycle of heated/cooled water surrounding the solution of interest, keeping the solution at the desired temperature mentioned above.
Figure 2. Model of the continuously stirred batch reactor used in the experiments.
For each temperature; 800 mL of sodium nitrate, 1 g of Zn/Cr LDH and 10 mL of Sb solution of unknown concentration were added to the double layered glass beaker. The Zn/Cr LDH had a ratio of 3:1 which is considered most appropriate for antimony adsorption according to former experiments. The Sb solution was developed to have the same characterization as wastewater from a mining industry contaminated with antimony.
Sarha Rodin Holst VVRF05 2013-07-19
8
From the double layered glass beaker 2 mL of solution was withdrawn, filtered and added to small tubes according to following times for sampling after adding the Sb solution to the beaker: 30s, 1min, 2.5min, 5min, 10min, 15min, 30min, 1h, 2h, 4h, 6h, 12h, 20h, 28h, 36h, 48h, 60h and 72h. To prepare the samples for the atomic fluorescence spectroscopy 0.02 mL was extracted from the small tubes between the time interval 30 s – 30 min, 0.04 mL from time interval 1 h – 4 h, 0.06 mL from time interval 6 h – 72 h and added to colorimetric tubes. To each colorimetric tube 5 mL of the reduction solution i.e. thiourea and ascorbic acid and 2.5 mL of HCl were added and each sample diluted with distilled water to 50 mL. After 20 minutes the samples were tested in the atomic fluorescence spectroscopy. A new standard curve was made for each sample series in order to standardize the atomic fluorescence spectroscopy before testing the samples. The emitted light and known concentration of the standard curve were used to create a graph and make a linear regression. The equation of the linear regression was hence used to calculate the concentrations of remaining antimony in each sample depending on corresponding intensity of emitted light.
3.2.4 Kinetic models
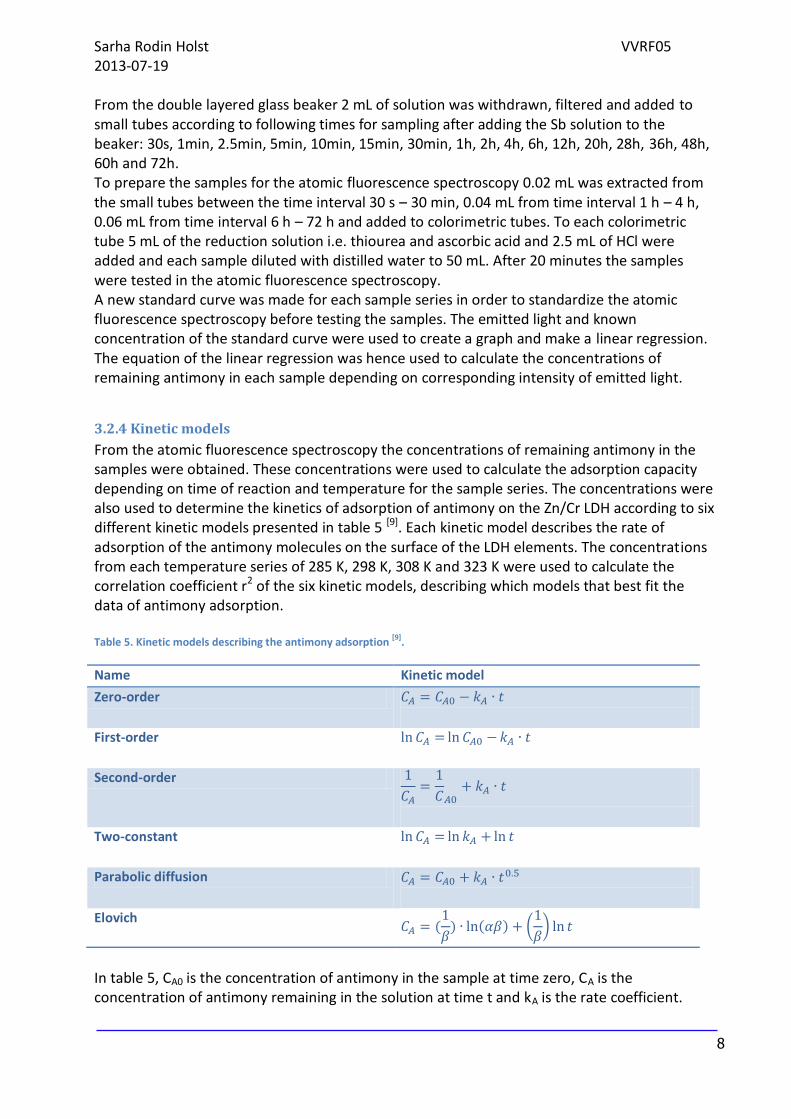
From the atomic fluorescence spectroscopy the concentrations of remaining antimony in the samples were obtained. These concentrations were used to calculate the adsorption capacity depending on time of reaction and temperature for the sample series. The concentrations were also used to determine the kinetics of adsorption of antimony on the Zn/Cr LDH according to six different kinetic models presented in table 5 [9]. Each kinetic model describes the rate of adsorption of the antimony molecules on the surface of the LDH elements. The concentrations from each temperature series of 285 K, 298 K, 308 K and 323 K were used to calculate the correlation coefficient r2 of the six kinetic models, describing which models that best fit the data of antimony adsorption. Table 5. Kinetic models describing the antimony adsorption
[9].
Name Kinetic model
Zero-order
First-order
Second-order
Two-constant
Parabolic diffusion
Elovich
In table 5, CA0 is the concentration of antimony in the sample at time zero, CA is the concentration of antimony remaining in the solution at time t and kA is the rate coefficient.
Sarha Rodin Holst VVRF05 2013-07-19
9
The reaction of antimony adsorption was divided in two stages. The fast stage of the reaction was described by a time interval of 0-360 minutes; this is when antimony is quickly adsorbed to the LDH surface. The slow stage was set between 360-4320 minutes, when the adsorption of antimony is slower. When plotting the fast respectively the slow reaction intervals according to the kinetic models in table 5, a correlation coefficient, r2, could be identified for each model. The correlation coefficient was obtained by making a linear regression of the data from the sample series, deleting one or two values of the concentration that was simply bad data.
4. Results and discussion
4.1 Standard curve fitting
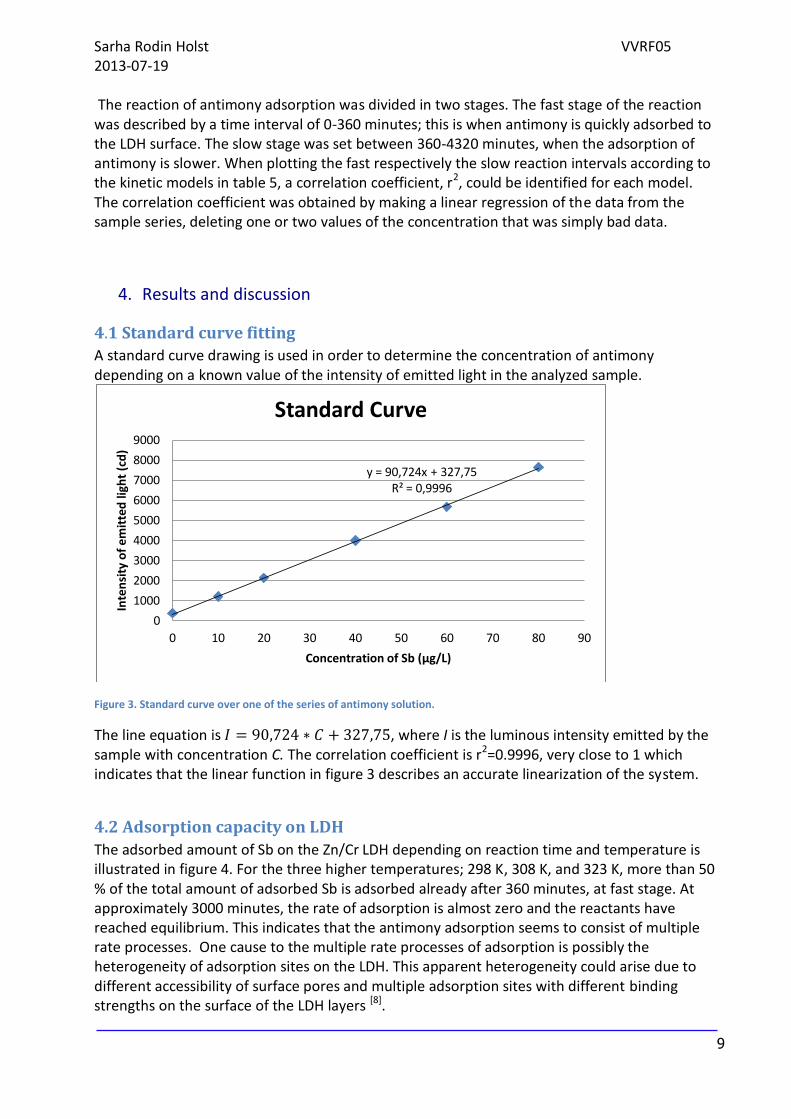
A standard curve drawing is used in order to determine the concentration of antimony depending on a known value of the intensity of emitted light in the analyzed sample.
Figure 3. Standard curve over one of the series of antimony solution.
The line equation is , where I is the luminous intensity emitted by the sample with concentration C. The correlation coefficient is r2=0.9996, very close to 1 which indicates that the linear function in figure 3 describes an accurate linearization of the system.
4.2 Adsorption capacity on LDH
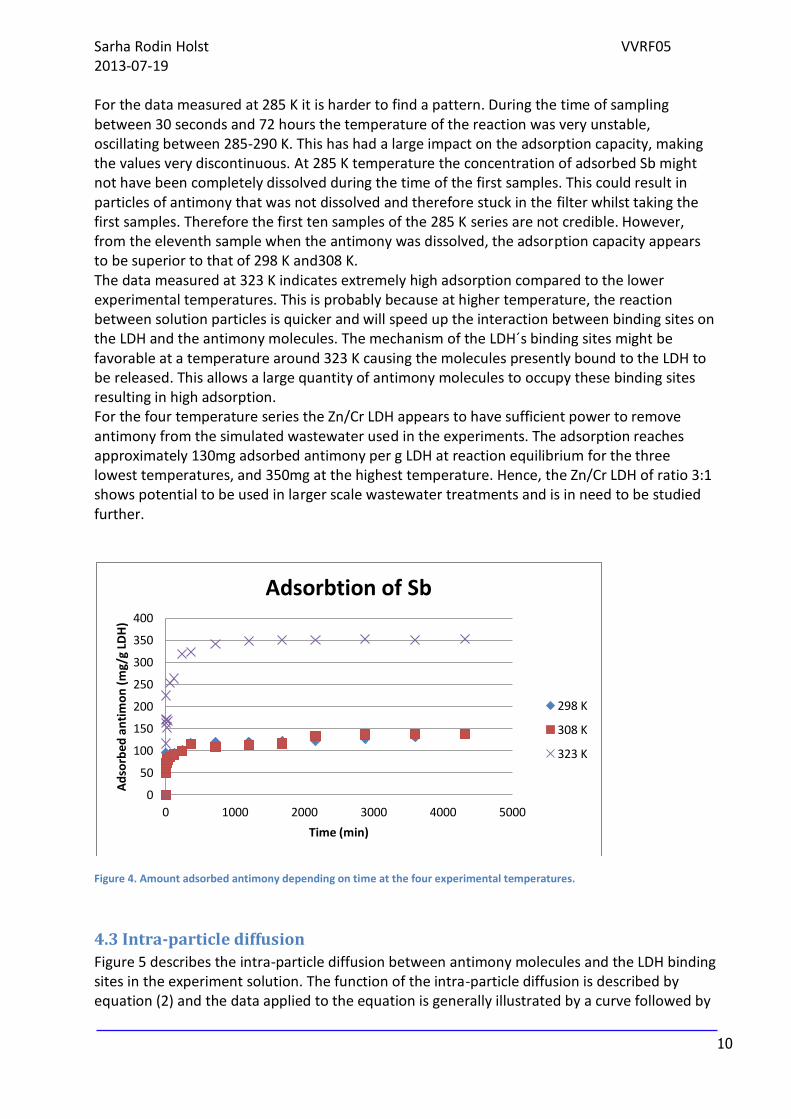
The adsorbed amount of Sb on the Zn/Cr LDH depending on reaction time and temperature is illustrated in figure 4. For the three higher temperatures; 298 K, 308 K, and 323 K, more than 50 % of the total amount of adsorbed Sb is adsorbed already after 360 minutes, at fast stage. At approximately 3000 minutes, the rate of adsorption is almost zero and the reactants have reached equilibrium. This indicates that the antimony adsorption seems to consist of multiple rate processes. One cause to the multiple rate processes of adsorption is possibly the heterogeneity of adsorption sites on the LDH. This apparent heterogeneity could arise due to different accessibility of surface pores and multiple adsorption sites with different binding strengths on the surface of the LDH layers [8].
y = 90,724x + 327,75 R² = 0,9996
0
1000
2000
3000
4000
5000
6000
7000
8000
9000
0 10 20 30 40 50 60 70 80 90
Inte
nsi
ty o
f em
itte
d li
ght
(cd
)
Concentration of Sb (µg/L)
Standard Curve
Sarha Rodin Holst VVRF05 2013-07-19
10
For the data measured at 285 K it is harder to find a pattern. During the time of sampling between 30 seconds and 72 hours the temperature of the reaction was very unstable, oscillating between 285-290 K. This has had a large impact on the adsorption capacity, making the values very discontinuous. At 285 K temperature the concentration of adsorbed Sb might not have been completely dissolved during the time of the first samples. This could result in particles of antimony that was not dissolved and therefore stuck in the filter whilst taking the first samples. Therefore the first ten samples of the 285 K series are not credible. However, from the eleventh sample when the antimony was dissolved, the adsorption capacity appears to be superior to that of 298 K and308 K. The data measured at 323 K indicates extremely high adsorption compared to the lower experimental temperatures. This is probably because at higher temperature, the reaction between solution particles is quicker and will speed up the interaction between binding sites on the LDH and the antimony molecules. The mechanism of the LDH´s binding sites might be favorable at a temperature around 323 K causing the molecules presently bound to the LDH to be released. This allows a large quantity of antimony molecules to occupy these binding sites resulting in high adsorption. For the four temperature series the Zn/Cr LDH appears to have sufficient power to remove antimony from the simulated wastewater used in the experiments. The adsorption reaches approximately 130mg adsorbed antimony per g LDH at reaction equilibrium for the three lowest temperatures, and 350mg at the highest temperature. Hence, the Zn/Cr LDH of ratio 3:1 shows potential to be used in larger scale wastewater treatments and is in need to be studied further.
Figure 4. Amount adsorbed antimony depending on time at the four experimental temperatures.
4.3 Intra-particle diffusion
Figure 5 describes the intra-particle diffusion between antimony molecules and the LDH binding sites in the experiment solution. The function of the intra-particle diffusion is described by equation (2) and the data applied to the equation is generally illustrated by a curve followed by
0
50
100
150
200
250
300
350
400
0 1000 2000 3000 4000 5000
Ad
sorb
ed a
nti
mo
n (
mg/
g LD
H)
Time (min)
Adsorbtion of Sb
298 K
308 K
323 K

Sarha Rodin Holst VVRF05 2013-07-19
11
a linear part and ending in a plateau [10].
(2)
By making a linear regression of the linear part of the function, figure 6, one is able to investigate the character of diffusion between reactants in the solution. A longer linear line indicates that it takes longer time for the antimony molecules and the binding sites of the LDH to reach equilibrium. In turn a shorter line indicates a faster time for the reactants to reach equilibrium.
Figure 5. Illustration of the intra-particle diffusion.
Figure 6. Illustration of the linear part of the intra-particle diffusion.
0
50
100
150
200
250
300
350
400
0 10 20 30 40 50 60 70
Ad
sorp
tio
n o
f Sb
(m
g/g)
Time, t^0.5 (min)
Intra-particle diffusion
298 K
308 K
323 K
0
50
100
150
200
250
300
350
400
0 5 10 15 20
Ad
sorp
tio
n o
f Sb
(m
g/g)
Time, t^0.5 (min)
Linear part of intra-particle diffusion
298 K
308 K
323 K
Sarha Rodin Holst VVRF05 2013-07-19
12
The time to reach equilibrium is slightly shorter for the reaction at 308 K than for 298 K and for the reaction at 323 K than for 308 K. At higher temperature, the reactants in the solution will move faster and hence speed up the interaction and intra-particle diffusion causing the involved particles to reach equilibrium in less time. The result of 285 K is not taken into consideration since the samples of that series were not credible. From the slope of the linear regression, figure 6, one is also able to investigate the rate of adsorption for the reactions. A steeper slope indicates a higher rate of adsorption and thus a more plane slope signifies a lower adsorption rate of antimony on the LDH. As illustrated in figure 6, the rate of antimony adsorption on Zn/Cr LDH increases with increasing temperature since the line of the linear regression grows steeper from the experiments at 298 K to 323 K. At 323 K the rate of adsorption is significantly higher than for the two lower temperatures. Hence one can speculate that a reaction temperature of approximately 323 K is preferential before room temperature when utilizing Zn/Cr LDH of ratio 3:1 for antimony adsorption. However, it is necessary to investigate the adsorption capacity of antimony on Zn/Cr LDH further in order to make any additional discussion about the result of the intra-particle diffusion.
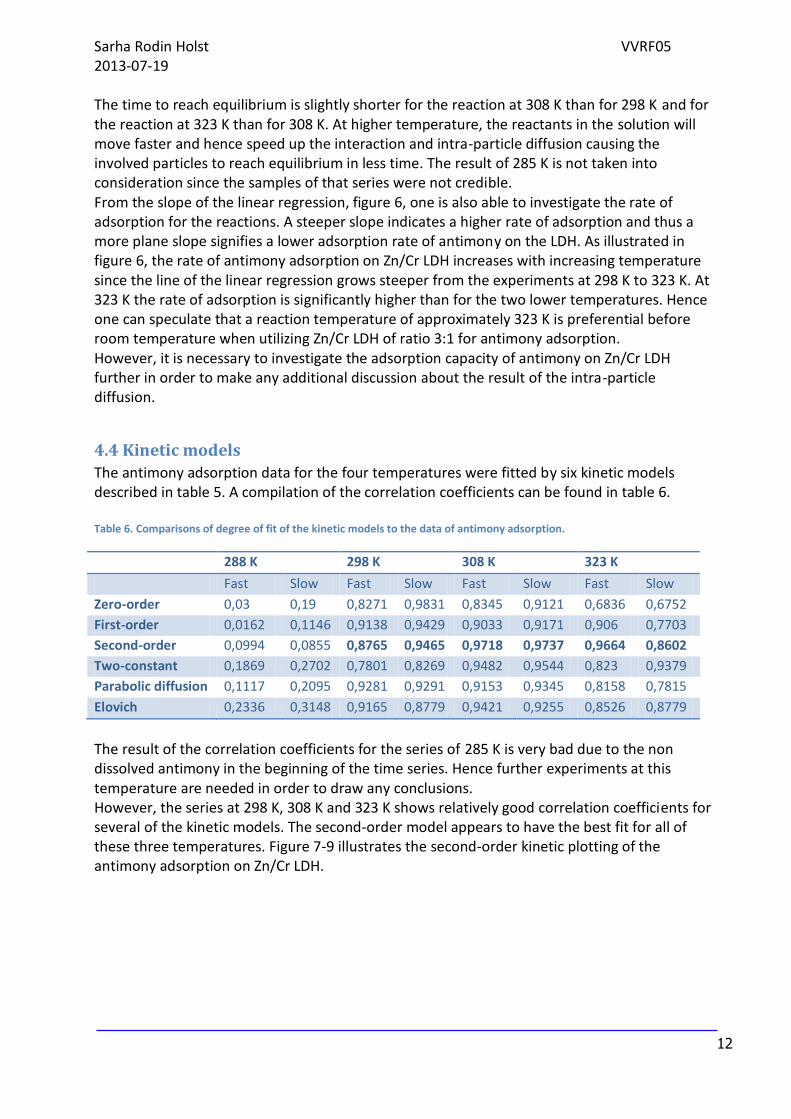
4.4 Kinetic models
The antimony adsorption data for the four temperatures were fitted by six kinetic models described in table 5. A compilation of the correlation coefficients can be found in table 6. Table 6. Comparisons of degree of fit of the kinetic models to the data of antimony adsorption.
288 K 298 K 308 K 323 K
Fast Slow Fast Slow Fast Slow Fast Slow
Zero-order 0,03 0,19 0,8271 0,9831 0,8345 0,9121 0,6836 0,6752
First-order 0,0162 0,1146 0,9138 0,9429 0,9033 0,9171 0,906 0,7703
Second-order 0,0994 0,0855 0,8765 0,9465 0,9718 0,9737 0,9664 0,8602
Two-constant 0,1869 0,2702 0,7801 0,8269 0,9482 0,9544 0,823 0,9379
Parabolic diffusion 0,1117 0,2095 0,9281 0,9291 0,9153 0,9345 0,8158 0,7815
Elovich 0,2336 0,3148 0,9165 0,8779 0,9421 0,9255 0,8526 0,8779
The result of the correlation coefficients for the series of 285 K is very bad due to the non dissolved antimony in the beginning of the time series. Hence further experiments at this temperature are needed in order to draw any conclusions. However, the series at 298 K, 308 K and 323 K shows relatively good correlation coefficients for several of the kinetic models. The second-order model appears to have the best fit for all of these three temperatures. Figure 7-9 illustrates the second-order kinetic plotting of the antimony adsorption on Zn/Cr LDH.

Sarha Rodin Holst VVRF05 2013-07-19
13
Figure 7. Second-order kinetic plotting of antimony adsorption on Zn/Cr LDH at 298 K.
Figure 8. Second-order kinetic plotting of antimony adsorption on Zn/Cr LDH at 308 K.
Figure 9. Second-order kinetic plotting of antimony adsorption on Zn/Cr LDH at 323 K.
y = 7E-05x + 0,0133 R² = 0,8765
y = 1E-05x + 0,0357 R² = 0,9465
0
0,02
0,04
0,06
0,08
0,1
0 1000 2000 3000 4000
1/Sb
co
nc.
Time (min)
298 K
Fast
Slow
y = 7E-05x + 0,0131 R² = 0,9718
y = 8E-05x - 0,0103 R² = 0,9737
0
0,1
0,2
0,3
0,4
0 1000 2000 3000 4000 5000
1/ S
b c
on
c.
Time (min)
308 K
Fast
Slow
y = 6E-05x + 0,004 R² = 0,9664
y = 2E-05x + 0,0278 R² = 0,8602
0
0,02
0,04
0,06
0,08
0,1
0,12
0,14
0 2000 4000 6000
1/Sb
co
nc.
Time (min)
323 K
Fast
Slow
Sarha Rodin Holst VVRF05 2013-07-19
14
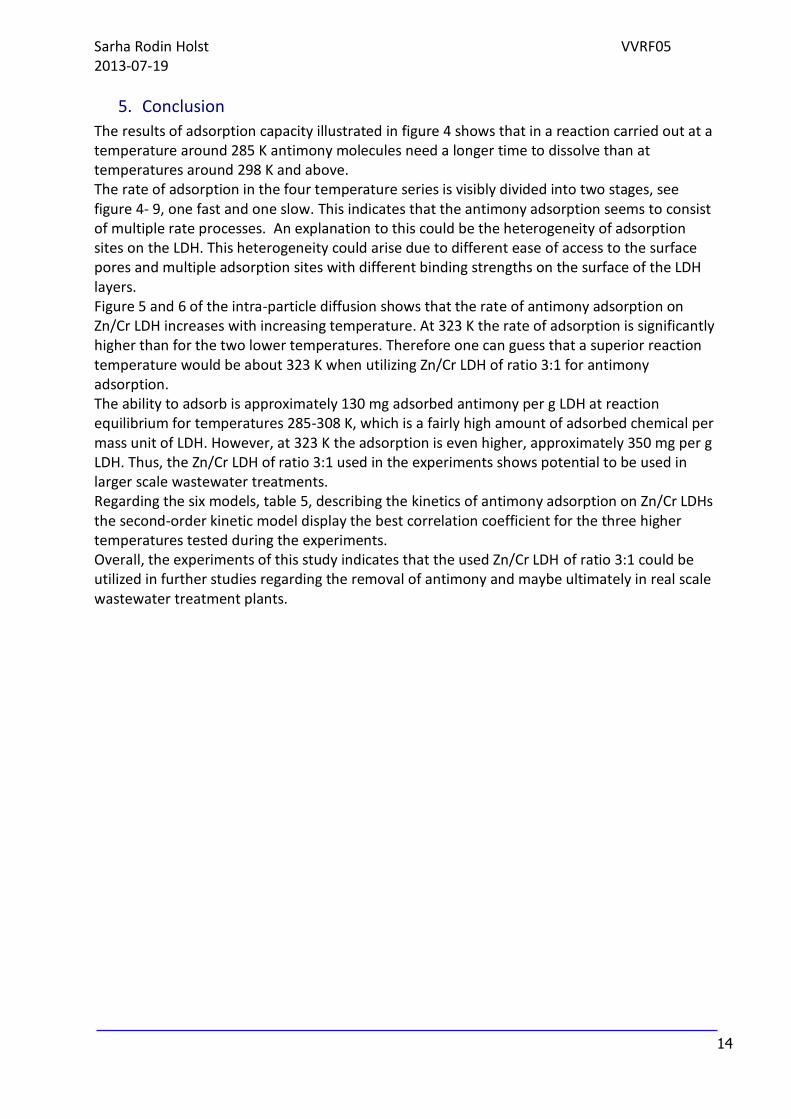
5. Conclusion
The results of adsorption capacity illustrated in figure 4 shows that in a reaction carried out at a temperature around 285 K antimony molecules need a longer time to dissolve than at temperatures around 298 K and above. The rate of adsorption in the four temperature series is visibly divided into two stages, see figure 4- 9, one fast and one slow. This indicates that the antimony adsorption seems to consist of multiple rate processes. An explanation to this could be the heterogeneity of adsorption sites on the LDH. This heterogeneity could arise due to different ease of access to the surface pores and multiple adsorption sites with different binding strengths on the surface of the LDH layers. Figure 5 and 6 of the intra-particle diffusion shows that the rate of antimony adsorption on Zn/Cr LDH increases with increasing temperature. At 323 K the rate of adsorption is significantly higher than for the two lower temperatures. Therefore one can guess that a superior reaction temperature would be about 323 K when utilizing Zn/Cr LDH of ratio 3:1 for antimony adsorption. The ability to adsorb is approximately 130 mg adsorbed antimony per g LDH at reaction equilibrium for temperatures 285-308 K, which is a fairly high amount of adsorbed chemical per mass unit of LDH. However, at 323 K the adsorption is even higher, approximately 350 mg per g LDH. Thus, the Zn/Cr LDH of ratio 3:1 used in the experiments shows potential to be used in larger scale wastewater treatments. Regarding the six models, table 5, describing the kinetics of antimony adsorption on Zn/Cr LDHs the second-order kinetic model display the best correlation coefficient for the three higher temperatures tested during the experiments. Overall, the experiments of this study indicates that the used Zn/Cr LDH of ratio 3:1 could be utilized in further studies regarding the removal of antimony and maybe ultimately in real scale wastewater treatment plants.
Sarha Rodin Holst VVRF05 2013-07-19
15
6. Acknowledgements
The author would like to thank the project supervisor Dr Tong Ouyang, assistant Jiajie Wang and coworker students Shiqiang Sun and TingFeng Lee for their guidance and patience. This project has been financially supported by Sweco.
7. References 1. Kazi, T.G., Jamali, M.K., Kazi, G.H., Arain, M.B., Afridi, H.I. and Siddiqui, A., Evaluating the
mobility of toxic metals in untreated industrial wastewater sludge using BCR sequential
extraction procedure and leaching test. Springer-Verlag, 2005. Page: 1-2.
2. Mengchang, H., Xiangqin, W., Fengchang, W., Zhiyou, F., Antimony pollution in China, Science of
the Total Environment, 2011. Page: 1-4.
3. Montserrat, F., Nelson, B., Yu-Wei, C., Antimony in the environment: a review focused on natural
waters. II. Relevant solution chemistry. Earth-Science Reviews 59, page: 265-266, Elsevier, 2002.
4. WHO. Guidelines for drinking-water quality: volume 2. Health criteria and other supporting
information, 2nd ed. Geneva: World Health Organization; 1996. Page: 937.
5. Guo, X., Wu, Z., and He, M., Removal of antimony (V) and antimony (III) from drinking water by
coagulation-flocculation-sedimentation (CGS), Water research 43, page: 4327-4329, Elsevier,
2009.
6. Kolbe, F.,Weiss, H., Morgenstern, P., Wennrich, R., Lorenz, W., Schurk, K., Stanjek, H., Daus, B.,
Sorption of aqueous antimony and arsenic species on akaganeite, Journal of Colloid and
Interface Science 357, page: 460-462, Elsevier, 2011.
7. Ouyang, T., Qv, M., Lin, H., Huang, S., Wu, H. and Ouyang, L., Removal of arsenate and
antimonate with synthetic Zn/Cr layered double hydroxide recovered from plating wastewaters,
2012. Page: 1-2.
8. Goh, K.H., Lim, T.T., and Dong, Z., Application of layered double hydroxides for removal of
oxyanions: A review, Water research 42, page: 1343-1346, Elsevier, 2008.
9. Liu, Y.T., Chen, T.Y., Wang, M.K., Huang, P.M., Chiang, P.N. and Lee, J.F., Mechanistic study of
arsenate adsorption on lithium/aluminum layered double hydroxid, Applied clay science 48,
page: 487-489, Elsevier, 2010.
10. Chen, S. S., Study of arsenic adsorption mechanism on hydrous ceric oxide in geothermal water.
Xiamen; Xiamen University, 2013. Page32.
11. Xu, H. Y., Research of Antimony-removal from aqueous solutions by Homemade Zn/Cr Layered
double hydroxides. Xiamen; Xiamen University, 2013.

Sarha Rodin Holst VVRF05 2013-07-19
16
8. Appendix
8.1 Standard curve Table 7. Data for the standard curve presented in figure 3.
Concentration of Sb µg/L
0 10 20 40 60 80
Intencity of emitted light (cd)
368,27
1208,5
2126,87
3991,75
5677,91
7645,32
8.2 Calculations of Sb concentration and adsorption Table 8. Data for measurements at 285 K.
Time of sample min
Intensity of emitted light cd
Diluted concentration µg/L
Dilution µg/L
Real concentration mg/L
Adsorbed Sb mg/g LDH
0 3950,94 54,034 25 140,725 0 0,5 1219,43 14,72937079 20 36,82342697 103,9016 1 400,41 0,322433112 20 0,806082781 139,9189 2,5 437,94 0,982603036 20 2,45650759 138,2685 5 474,26 1,621488505 20 4,053721262 136,6713 10 515,59 2,348502172 20 5,871255431 134,8537 15 474,03 1,617442699 20 4,043606748 136,6814 30 574,34 3,381941635 20 8,454854087 132,2701 60 624,78 4,269204384 40 5,336505479 135,3885 120 1356,45 17,13961547 40 21,42451934 119,3005 240 956,69 10,10765361 40 12,63456701 128,0904 360 1043,63 11,63696811 60 9,697434634 131,0276 720 882,86 8,808950026 60 7,340762325 133,3842 1200 804,88 7,437246038 60 6,197680241 134,5273 1680 579,14 3,466375838 60 2,888634977 137,8364 2160 746,98 6,418758465 60 5,348943992 135,3761 2880 909,08 9,270171859 60 7,725112315 132,9999 3600 885 8,846593608 60 7,372131851 133,3529 4320 857,24 8,358282468 60 6,965207529 133,7598

Sarha Rodin Holst VVRF05 2013-07-19
17
Table 9. Data for measurements at 298 K.
Time of sample min
Intensity of emitted light cd
Diluted concentration µg/L
Dilution µg/L
Real concentration mg/L
Adsorbed Sb mg/g LDH
0 3950,94 54,034 25 140,725 0 0,5 2342,23 32,39710666 20 80,99277 59,73223335 1 2131,75 29,27087201 20 73,17718 67,54781997 2,5 1384,51 18,17220432 20 45,43051 95,29448921 5 1966,64 26,81851263 20 67,04628 73,67871842 10 1811,32 24,51156297 20 61,27891 79,44609258 15 1810,03 24,49240275 20 61,23101 79,49399312 30 1635,45 21,89938658 20 54,74847 85,97653356 60 2980,63 41,87918666 40 52,34898 88,37601668 120 2677,76 37,38069422 40 46,72587 93,99913222 240 2323,35 32,11668424 40 40,14586 100,5791447 360 2875,7 28,08463031 60 23,40376 117,321235 720 2719,19 26,35950796 60 21,96617 118,7588312 1200 2568,21 24,69533971 60 20,57937 120,1456326 1680 2392,91 22,76310568 60 18,96918 121,7558211 2160 2240,01 21,07777435 60 17,56474 123,1602583 2880 1794,42 16,16628456 60 13,47185 127,2531501 3600 1402,79 11,84956572 60 9,874599 130,8504014 4320 60
Table 10. Data for measurements at 308 K.
Time of sample min
Intensity of emitted light cd
Diluted concentration µg/L
Dilution µg/L
Real concentration mg/L
Adsorbed Sb mg/g LDH
0 3950,94 54,034 25 140,725 0 0,5 2636,61 35,90751191 20 89,76878 50,9562202 1 2407,9 32,55522169 20 81,38805 59,3369458 2,5 2388,95 32,27746427 20 80,69366 60,0313393 5 2198,22 29,48186149 20 73,70465 67,0203463 10 2060,74 27,46676438 20 68,66691 72,058089 15 1806,2 23,73587395 20 59,33968 81,3853151 30 1868,64 24,65108098 20 61,6277 79,0972975 60 3201,97 44,19421033 40 55,24276 85,4822371 120 2870,35 39,33352877 40 49,16691 91,558089 240 2416,2 32,67687798 40 40,8461 99,8789025 360 2287,94 30,79692195 60 25,664 115,061001 720 2787,63 38,12106999 60 31,76743 108,957569 1200 2437,5 32,98908025 60 27,49079 113,23421 1680 2171 29,0828875 60 24,23564 116,489357 2160 1128,52 8,826440633 60 7,355338 133,369662 2880 799,92 5,204466293 60 4,337038 136,387962 3600 690,78 4,001477007 60 3,334551 137,390449 4320 665,2 3,719522949 60 3,09959 137,62541

Sarha Rodin Holst VVRF05 2013-07-19
18
Table 11. Data for measurements at 323 K.
Time of sample min
Intensity of emitted light cd
Diluted concentration µg/L
Dilution µg/L
Real concentration mg/L
Adsorbed Sb mg/g LDH
0 1976,63 29,14814815 5 364,35 0 0,5 1900,41 27,93657606 10 139,6828803 224,6671197 1 3260,93 49,56302655 10 247,8151327 116,5348673 2,5 2678,21 40,30027023 10 201,5013511 162,8486489 5 2592,43 38,93673502 10 194,6836751 169,6663249 10 2568,98 38,56398029 10 192,8199014 171,5300986 15 2805,76 42,32776983 10 211,6388491 152,7111509 30 2632 39,56572882 10 197,8286441 166,5213559 60 2954,51 44,69225878 20 111,730647 252,619353 120 2680,65 40,33905579 20 100,8476395 263,5023605 240 1292,01 18,26561755 20 45,66404387 318,6859561 360 1168,98 16,30996662 20 40,77491655 323,5750835 720 1001,45 13,64695597 30 22,7449721 341,6050279 1200 744,5 9,562549674 30 15,93761467 348,4123853 1680 685,46 8,624066126 30 14,37347229 349,9765277 2160 662,53 8,259577174 30 13,76598949 350,5840105 2880 609,1 7,410268638 30 12,35047243 351,9995276 3600 658,25 8,191543475 30 13,65259976 350,6974002 4320 565,68 6,720076299 30 11,20014957 353,1498504