preliminary study on feasibility of basaltic glass as
TRANSCRIPT
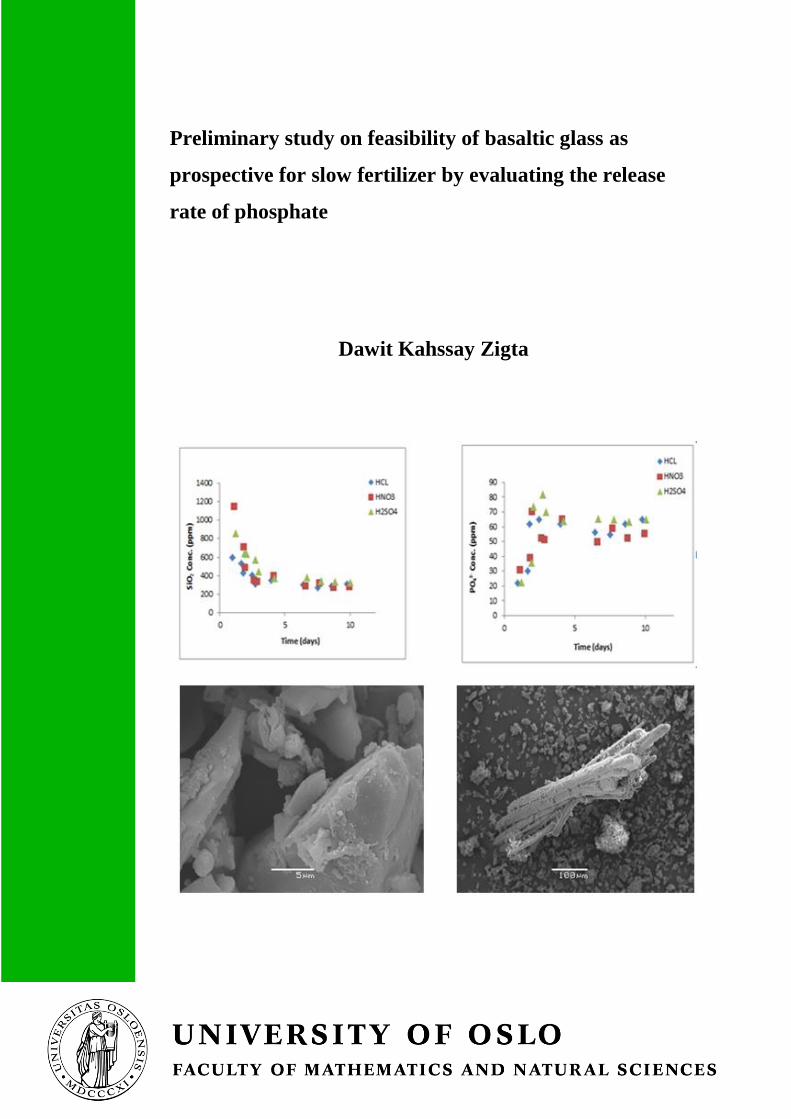
Preliminary study on feasibility of basaltic glass as
prospective for slow fertilizer by evaluating the release
rate of phosphate
Dawit Kahssay Zigta
Preliminary study on feasibility of basaltic glass as prospective
for slow fertilizer by evaluating the release rate of phosphate
Dawit Kahssay Zigta
Master Thesis in Geosciences
Discipline: Environmental geology and Geohazard
Department of Geosciences
Faculty of Mathematics and Natural Sciences
University of Oslo
31.03.2014

© "[Dawit Kahsay Zigta]", 2014
This work is published digitally through DUO – Digitale Utgivelser ved UiO
http://www.duo.uio.no
It is also catalogued in BIBSYS (http://www.bibsys.no/english)
All rights reserved. No part of this publication may be reproduced or transmitted, in any form or by any
means, without permission.

i Dawit KZ
ACKNOWLEDGEMENT
First and most I would like to express my gratitude to my advisor Helge Hellevange, researcher at
UiO, for his Supervision, encouragements and useful suggestions. His moral support, guidance and
constructive comments were tremendous throughout the development of my thesis to the final stage.
Dear Helge, I am thankful not only for the academic quality but also the dynamic and positive spirit
you have.
I am also highly thankful to Beyene Girma Hailu, researcher at the University of Oslo, for his valuable
support, constructive suggestions and brotherly advices. Beyene you were my courage, which this
thesis wouldn’t have reached here without your support.
Special thanks to Bezawit Temesgen for editing, helpful suggestions and invaluable friendly support.
I would like to express my thanks to Chemistry lab and analytical lab stuffs, Mufak Naoroz, Marteen
Aerta and Berit Løken for their cooperation during my lab work.
I am indebted to thank my friends Libargachew Demlie, Teame Kiros, Shewit Kalayou as well as
Minyahil Muluneh with their families. Dear friends you made my stay in Oslo pleasant without you it
could have been difficult to cope with challenges of new weather and Norwegian life. I am also
thankful to my friends Tewelde Tesfay and Mahamed Lamine Manga for your good friendship and
valuable comments.
Mostly, I would like to give heart full thank to University of Oslo and Norwegian state educational
fund (Lånekassen) for giving me this golden opportunity to carry out my study and conduct this thesis.
The last but not the least, I am highly grateful to thank my wife Hilina Debesay and my family for
their invaluable support throughout my study. I would like to dedicate this work to my beloved mother
Kiros Abrha. Mom I hope the heavens have all good things that I demand for you.
ii Dawit KZ
ABSTRACT
Improving soil fertility has been the main goal for increasing crop production in order to feed the
increasing world population. Phosphorus is one of the major chemical elements commercially
produced as phosphate to increase the fertility of the soil. Phosphate rock is considered the main raw
material to produce phosphate type fertilizer. Looking for other viable sources of phosphorus, however,
is an indispensable task in order to maximize food productivity by improving soil fertility for the
increasing world population.
Hence, this study examined the potential of basaltic glass to be used as a fertilizer mainly serving as a
source of phosphorus. In order to evaluate the potential of basaltic glass, the dissolution rate of basaltic
glass that was obtained from Stapafell Mountain, Iceland was studied using mixed flow through
reactor. The dissolution rate of basaltic glass was calculated by measuring the amount of phosphate
and silica species released in the bulk solution. Ion Chromatography (IC2000) was used to determine
cations and anions in the reacted bulk solution while Auto analyzer was used for measuring aqueous
silica and phosphate. The solid samples, before and after reaction, were examined using Scanning
Electron Microscopy (SEM). The unreacted basaltic glass and reacted basaltic glass products were also
inspected using X-ray Powder Diffraction (XRD).
Matlab software program was used to simulate how the dissolution of particles of basaltic glass with
different grain size distribution changes the specific surface area and hence the release rate of essential
chemical species into the solution. Different values of specific kinetic rate constants, particle size
distribution and time were used to simulate the optimum possible condition for dissolution of basaltic
glass. The result from the first experiment shows that, the rate of dissolution of micronized basaltic
glass at neutral pH and 800C was 1.2*10
-9 mol.m
-2.s
-1. This dissolution rate of natural glass is too slow
to release the expected amount of phosphorus (28 kg Phosphorus per hectare required for one harvest
season) needed to fertilize the soil.
Hence, another experiment was performed to explore the full potential of basaltic glass. In this
experiment, basaltic glass was reacted with HCl, HNO3 and H2SO4.The complete dissolution of
basaltic glass in acidic medium was observed. This confirms that the complete release of phosphate ion
into the bulk solution from the basaltic glass structure. Treating basaltic glass with acidic solution,
therefore, maximizes the release of phosphate and its feasibility to be used as a fertilizer source rock.
Pure amorphous silica was also formed as a byproduct as a result of the complete digestion of basaltic
glass in acidic media as solid phase. This may open the possibility of using basaltic glass for dual
purpose (fertilizer and silica source). This study shows the potential of basaltic glass as a fertilizer
when it goes to complete dissolution, however additional studies should be performed in large scale to
promote the use of the basaltic glass as fertilizer.

iii Dawit KZ
Table of Contents
Contents
ACKNOWLEDGEMENT ....................................................................................................................................... i
ABSTRACT ............................................................................................................................................................ ii
Table of Contents ................................................................................................................................................... iii
Lists of Figures ....................................................................................................................................................... v
List of acronyms and abbreviations ....................................................................................................................... vii
1. INTRODUCTION .............................................................................................................................................. 1
1.1 Background of the Study .............................................................................................................................. 1
1.2 Statement of Problem .................................................................................................................................... 2
1.2.1 Phosphate Rock Reserves ...................................................................................................................... 3
1.2.2 Distribution of Phosphate Rock Reserves .............................................................................................. 3
1.2.3 Phosphate Rock Production ................................................................................................................... 4
1.2.4 Current and Future Demand ................................................................................................................... 5
1.3 Over Fertilization and Environmental Impact........................................................................................... 6
1.4 Slow Fertilizers ......................................................................................................................................... 6
1.3 Objectives ..................................................................................................................................................... 7
1.3.1 Main Objective ....................................................................................................................................... 7
1.3.2 Specific Objectives ................................................................................................................................. 7
1.4 Limitation of the study .................................................................................................................................. 7
1.5 Outline of the Study ...................................................................................................................................... 8
2. THEORETICAL BACKGROUND .................................................................................................................... 9
2.1 Occurrence and abundance of Basaltic glass ................................................................................................ 9
2.2 Basaltic glass dissolution and controlling factors ......................................................................................... 9
2.2.1 Surface area and grain size ................................................................................................................... 10
2.2.2 Time ..................................................................................................................................................... 10
2.2.3 Fluoride and environment .................................................................................................................... 11
2.3 Occurrence of Phosphorus .......................................................................................................................... 12
2.4 Chemistry of phosphorus in aqueous solution ............................................................................................ 12
2.5 Why basaltic glass and why phosphorus..................................................................................................... 13
3. EXPERIMENTAL SYSTEM ........................................................................................................................... 15
3.1 Introduction ................................................................................................................................................. 15
3.2 Characterization of initial material ............................................................................................................. 15

iv Dawit KZ
3.3 Experimental Procedures ............................................................................................................................ 17
3.3.1 Method for Experiment One ................................................................................................................ 17
3.3.2 Method for Experiment Two................................................................................................................ 22
3.4 Analytical Methods ..................................................................................................................................... 23
3.4.1 Ion Chromatography (IC) .................................................................................................................... 23
3.4.2 Colorimetric (CM) ............................................................................................................................... 23
3.5 Statistical and Graphical Methods .............................................................................................................. 23
4. RESULTS OF RATE EXPERIMENTS ........................................................................................................... 24
4.1 Result Part One ........................................................................................................................................... 24
4.2 Mat lab simulation results of HCB ............................................................................................................. 31
4.2.1 Model 1 ................................................................................................................................................ 31
4.2.2 Model 2 ................................................................................................................................................ 33
4.2.3 Model 3 ................................................................................................................................................ 35
4.3 Mat Lab Simulation Results of MiB ........................................................................................................... 36
4.3.1 simulation 1 .......................................................................................................................................... 36
4.3.2 Simulation 2 ......................................................................................................................................... 37
4.3.3 Simulation 3 ......................................................................................................................................... 37
4.4 Mat lab simulation results of Synthetic Material (SB) ............................................................................... 38
4.4.1 Model 1SB ........................................................................................................................................... 38
Table 4.5. Grain size data and differential volume percent used in the simulation of the synthetic sample. 38
4.4.2 Model 2 SB .......................................................................................................................................... 39
4.5 RESULT PART TWO ................................................................................................................................ 41
5 DISCUSSIONS .................................................................................................................................................. 47
5.1 DISCUSSION PART ONE ......................................................................................................................... 47
5.2 DISCUSSION PART TWO ........................................................................................................................ 49
6. CHAPTER SIX ................................................................................................................................................. 51
6.1 CONCLUSION ........................................................................................................................................... 51
6.2 RECOMMENDATION .............................................................................................................................. 52
REFERENCES ..................................................................................................................................................... 53
APPENDIX I: Results and procedures used for the flow through experiment ..................................................... 57
APPENDIX II: Mass calculation .......................................................................................................................... 64
APPENDIX III: Procedure of preparing solutions for second experiment ........................................................... 65
APPENDIX IV: Results from the basalt acid base treatment ............................................................................... 66
APPENDIX V: Phreeqc Simulation data block .................................................................................................... 68

v Dawit KZ
Lists of Figures Figure 1. Shows history of world source of phosphorus fertilizer 1800 -2000. . . . . . . . . . . . . . . . . . . . . . . . . . . . . . . . . . . . . . . . . . . . . . 3
Figure 2. World phosphate rock production in 1994 –2010 (USBM/USGS Mineral Commodities Summary,
1996–2011), . . . . . . . . . . . . . . . . . . . . . . . . . . . . . . . . . . . . . . . . . . . . . . . . . . . . . . . . . . . . . . . . . . . . . . . . . . . . . . . . . . . . . . . . . . . . . . . . . . . . . . . . . . . . . . . . . . . . . . . . . . . . . . . . . . . . . . . . . . . . . . . . . . . 4
Figure 3. Developing, developed countries and world total phosphate fertilizer consumption . . . . . . . . . . . . . . . . . . . 4
Figure 4. Illustrates the coherence of the World phosphate consumption until 2014 from and Global
phosphorus production estimation and peak production cu rve . . . . . . . . . . . . . . . . . . . . . . . . . . . . . . . . . . . . . . . . . . . . . . . . . . . . . . . . . . . . . . . . 5
Figure 5. Computed activity of Aluminum as a function of total fluoride concentration at pH 4 and 250C
for a total Al concentration of 10-6
mol/kg (Wolff-Boenisch et al., 2004a) . . . . . . . . . . . . . . . . . . . . . . . . . . . . . . . . . . . . . . . . 11
Figure 6. Speciation of phosphate as function of pH . . . . . . . . . . . . . . . . . . . . . . . . . . . . . . . . . . . . . . . . . . . . . . . . . . . . . . . . . . . . . . . . . . . . . . . . . . . . . . . . . . . . . 13
Figure 7. XRD analysis spectrum of unreacted basaltic glass . . . . . . . . . . . . . . . . . . . . . . . . . . . . . . . . . . . . . . . . . . . . . . . . . . . . . . . . . . . . . . . . . . . . . . . 15
Figure 8. SEM analysis of unreacted basaltic glass . . . . . . . . . . . . . . . . . . . . . . . . . . . . . . . . . . . . . . . . . . . . . . . . . . . . . . . . . . . . . . . . . . . . . . . . . . . . . . . . . . . . . . . . 16
Figure 9. SEM/EDS analysis of unreacted basaltic glass . . . . . . . . . . . . . . . . . . . . . . . . . . . . . . . . . . . . . . . . . . . . . . . . . . . . . . . . . . . . . . . . . . . . . . . . . . . . . . . 18
Figure 11. Expression of the variation in Experimental cumulative and differential surface area (%)with
grain size for HCB. . . . . . . . . . . . . . . . . . . . . . . . . . . . . . . . . . . . . . . . . . . . . . . . . . . . . . . . . . . . . . . . . . . . . . . . . . . . . . . . . . . . . . . . . . . . . . . . . . . . . . . . . . . . . . . . . . . . . . . . . . . . . . . . . . . . . . 18
Figure 12. Illustrates the change in specific surface area (m2.g
-1) and differential volume (%) with
particle size, HCB.. . . . . . . . . . . . . . . . . . . . . . . . . . . . . . . . . . . . . . . . . . . . . . . . . . . . . . . . . . . . . . . . . . . . . . . . . . . . . . . . . . . . . . . . . . . . . . . . . . . . . . . . . . . . . . . . . . . . . . . . . . . . . . . . . . . . . . 19
Figure 13. Experimental result showing change in the Differential and Cumulative volume (%) with
respect to grain size (µm), MiB. . . . . . . . . . . . . . . . . . . . . . . . . . . . . . . . . . . . . . . . . . . . . . . . . . . . . . . . . . . . . . . . . . . . . . . . . . . . . . . . . . . . . . . . . . . . . . . . . . . . . . . . . . . . . . . . 19
Figure 14. Expression of the variation in Experimental cumulative and differential surface area (%)with
grain size for MiB. . . . . . . . . . . . . . . . . . . . . . . . . . . . . . . . . . . . . . . . . . . . . . . . . . . . . . . . . . . . . . . . . . . . . . . . . . . . . . . . . . . . . . . . . . . . . . . . . . . . . . . . . . . . . . . . . . . . . . . . . . . . . . . . . . . . . . . 20
Figure 15. Illustrates the change in the calculated specific surface area and differential volume % with
particle size, MiB. . . . . . . . . . . . . . . . . . . . . . . . . . . . . . . . . . . . . . . . . . . . . . . . . . . . . . . . . . . . . . . . . . . . . . . . . . . . . . . . . . . . . . . . . . . . . . . . . . . . . . . . . . . . . . . . . . . . . . . . . . . . . . . . . . . . . . . . 20
Figure 16. Characterization of rate of release as function of pH . . . . . . . . . . . . . . . . . . . . . . . . . . . . . . . . . . . . . . . . . . . . . . . . . . . . . . . . . . . . . . . . . . 21
Figure 17. Concentration evolution for fluorine ion as function of time for both samples . . . . . . . . . . . . . . . . . . . . . . . 25
Figure 18. Concentration evolution for Sulphate ion as function of time for both samples . . . . . . . . . . . . . . . . . . . . . . 26
Figure 19. Concentration evolution for phosphate as function of time . . . . . . . . . . . . . . . . . . . . . . . . . . . . . . . . . . . . . . . . . . . . . . . . . . . . . . . . 26
Figure 20. Concentration evolution for Potassium ion as fu nction of time. . . . . . . . . . . . . . . . . . . . . . . . . . . . . . . . . . . . . . . . . . . . . . . . . 27
Figure 21. Change in concentration of Calcium ion as functi on of time . . . . . . . . . . . . . . . . . . . . . . . . . . . . . . . . . . . . . . . . . . . . . . . . . . . . . . 27
Figure 22. Change in concentration of Magnesium ion as function of time. . . . . . . . . . . . . . . . . . . . . . . . . . . . . . . . . . . . . . . . . . . . . . . . 28
Figure 23. Silica released as function of time . . . . . . . . . . . . . . . . . . . . . . . . . . . . . . . . . . . . . . . . . . . . . . . . . . . . . . . . . . . . . . . . . . . . . . . . . . . . . . . . . . . . . . . . . . . . . . . . . 28
Figure 24. Logarithmic evolution of dissolution rate of basaltic glass based on the mole of Si during the
flow through experiment performed at 800C and pH 7 as function of time . . . . . . . . . . . . . . . . . . . . . . . . . . . . . . . . . . . . . . . . . 29
Figure 25. Illustrates simulation of basaltic glass dissolution rate for 30 days at 800C and pH 8 . . . . . . . . . . . 32
Figure 26. Demonstrates simulation of dissolution rate of basaltic glass for 30 days at 800C and pH 4 . 33
Figure 27. Basaltic glass dis solution rate simulation for 6 months at 500C and pH 4 . . . . . . . . . . . . . . . . . . . . . . . . . . . . . . . . 34
Figure 28. Illustrates simulation of Basaltic glass dissolution rate for a year at 250C and pH 8. . . . . . . . . . . . . 35
Figure 29. Illustrates simulation of basaltic glass dissolution rate for 30 days at 800C and pH of 8. . . . . . . 36
Figure 30. Basaltic glass dissolution rate simulation for 6 months at 500C and pH 4 . . . . . . . . . . . . . . . . . . . . . . . . . . . . . . . . 37
Figure 31. Basaltic glass dissolution rate simulation for one year at 250C and pH of 8. . . . . . . . . . . . . . . . . . . . . . . . . . . . 38

vi Dawit KZ
Figure 32. Simulation of dissolution rate of synthetic basaltic glass for 30 days at 800C and pH 8. . . . . . . . 39
Figure 33. Simulation of dissolution rate of synthetic basaltic glass for one year at 250C and pH 8. . . . . . 40
Figure 34. Change in concentration of Silica (a) and phosphate ion (b) as function of time . . . . . . . . . . . . . . . . . . . . 41
Figure 35. Change in concentration of cations Na+ (a), K
+ (b), Mg
2 + (c) and Ca
2 + (d) with time. . . . . . . . . . . . . 41
Figure 36. SEM analysis images of silica from dried solid samples of basaltic glass reacted with HCl
(a) HNO3 (b) and H2SO4 (c). . . . . . . . . . . . . . . . . . . . . . . . . . . . . . . . . . . . . . . . . . . . . . . . . . . . . . . . . . . . . . . . . . . . . . . . . . . . . . . . . . . . . . . . . . . . . . . . . . . . . . . . . . . . . . . . . . . . . . 42
Figure 37 . Illustrates random selection of grains for elemental analysis . . . . . . . . . . . . . . . . . . . . . . . . . . . . . . . . . . . . . . . . . . . . . . 43
Figure 38. Calcium sulphate precipitated from the dissolved calcium and available sulfur (from sulfuric
acid).. . . . . . . . . . . . . . . . . . . . . . . . . . . . . . . . . . . . . . . . . . . . . . . . . . . . . . . . . . . . . . . . . . . . . . . . . . . . . . . . . . . . . . . . . . . . . . . . . . . . . . . . . . . . . . . . . . . . . . . . . . . . . . . . . . . . . . . . . . . . . . . . . . . . . . . . . . . . 43
Figure 39. Illustrates contrast between XRD analysis spectrums of . . . . . . . . . . . . . . . . . . . . . . . . . . . . . . . . . . . . . . . . . . . . . . . . . . . . . . . . . . . . . 44
Figure 40. Saturation state of Hydroxylapatite, Fluorapatite and Brucite as a function of reaction
progress . . . . . . . . . . . . . . . . . . . . . . . . . . . . . . . . . . . . . . . . . . . . . . . . . . . . . . . . . . . . . . . . . . . . . . . . . . . . . . . . . . . . . . . . . . . . . . . . . . . . . . . . . . . . . . . . . . . . . . . . . . . . . . . . . . . . . . . . . . . . . . . . . . . . . . . . 45
Figure 41. Change in pH as function of reaction progress between pre -reacted aqueous solution of HCl,
H2SO4 and HNO3 at 900C (a), 25
0C (b). . . . . . . . . . . . . . . . . . . . . . . . . . . . . . . . . . . . . . . . . . . . . . . . . . . . . . . . . . . . . . . . . . . . . . . . . . . . . . . . . . . . . . . . . . . . . . . . . . . . 46

vii Dawit KZ
List of acronyms and abbreviations
ALM – Aqueous Liquid Model
BSE – Back Scattered Electrons
CL – Cathode Luminescence
EDS – Energy Dispersive Spectroscopy
GA – Ganapathy-Anders Model
HCB – Hand crushed basaltic glass
IFA – International fertilizer industry association
IFDC – International food and agricultural development center
LS-PSA – Laser light Source Particle Size Analyzer
MiB – Micronized basaltic glass
Mt/yr – Million tons per year
P- Phosphorus
PIDS – Polarization Intensity Differential Scattering
rBET – rate of dissolution based on BET surface area
SB – Synthetic basaltic glass
SE – Secondary Electrons
SEM – Scanning Electron microscope
USGS – United States Geological survey
XRD – X-ray diffraction

1 Dawit KZ
1. INTRODUCTION
1.1 Background of the Study
The preference of plants to grow on the weathered topsoil of volcanic terrains could imply their
enrichment with nutrients that enhance their growth and production. Naturally Soil may or may not be
rich in the essential nutrients for plant growth and health. Feeding the highly increasing world
population had become difficult with time, though soil fertility had been treated with natural fertilizers.
Therefore, increasing the agricultural production by enhancing the soil nutrition using chemical
fertilizers made the modern agriculture approach paramount. This has vastly increased the use of
chemical fertilizers as the main inputs to improve the crop yield from time to time (Dawson and Hilton,
2011). Hence, the current world agricultural system has become highly dependent on the availability
and continued supply of different chemical fertilizers.
Phosphate, Nitrate, Potassium and sulfur are the main constituents of the modern chemical fertilizers.
Relatively, the recent agricultural approach demands high use of modern chemical fertilizers than
animal manure. But lack of continued supply and depletion in some of the nutrients could be the major
current and future problems of the modern agricultural system (Gilbert, 2009). This can immensely
increase the population suffering from lack of fertile agricultural soil, as it happened in 1850 when 1.5
billion population was threatened by lack of supply of fertilizers (Dawson and Hilton, 2011). With
population estimated to increase to 9.2 billion by 2050 (Dawson and Hilton, 2011), serious
consequences can be envisaged if no systems are devised to continue supply of important fertilizers.
There are no more fear of depletion for Potassium (K) and Sulfur (S) as they are sufficiently available
and relatively less used as compared to Nitrogen (N) and Phosphorus (P). Hence, Nitrogen and
phosphorus have been the main concerns for the last 19th
and 20th
centuries before the possibility of
manufacturing ammonia was realized in the 1909 by Haber Bosch (Dawson and Hilton, 2011).
Therefore, the main concern lays now days in the achievement of the demand for phosphorus fertilizer.
Phosphate fertilizers have been continuous inputs to the current farming motive and their source rocks
have been mined for years in different part of the world. In 1981 the U.S has mined about 143 Mt of
phosphate which was more than the world’s production of salt and lime in that time (Sheldon, 1982).
Sheldon has also added the consumption of phosphate was increasing at rate of 6.3% per year.
Since the use of phosphate continues increasing, it is now becoming the world’s concern that the
limited resource at some point will be exhausted. Numbers of studies come out with suggestion that
the resource could be depleted in coming 50-100 years (Cooper et al., 2011; Cordell et al., 2009).

2 Dawit KZ
Limited phosphate rock resources, uncontrolled use of the fertilizer and not recycling the phosphorus
rich wastes were defined as main reasons for the depletion.
Irrespective of these time limits, the world has understood that something has to be done to bring an
alternative supply to this nutrient that could continue to be used in the agricultural environments so
that hunger can be tackled. Could working on the geologically available phosphorus containing
resources on earth be one way of sustaining the nutrient longer?
This preliminary study will focus on possible ways of enriching phosphorus from phosphate bearing
inorganic reserves, such as basaltic glass. The release rate of basaltic glass was estimated using two-
step experimental analyses. The first experiment assesses the natural dissolution rate of basaltic glass
from which the second experiment is raised. The second experiment was on how to improve the slow
dissolution of basaltic glass. Both experiments were conducted on two samples, hand crushed (HCB)
and micronized (MiB). Correspondently, the result and discussion are presented in two parts. Chapter
four presents results from the flow through experiment and Matlab simulation (part one) and result part
two from the acid- base treatment of the basaltic glass (part two). Both results are discussed in chapter
five respectively.
1.2 Statement of Problem
Soil nutrition improvement program is indisputably vital for food yields increase as well as the
eradication of hunger and poverty. Yes fertilizers can improve productivity. Which fertilizer suits for
which type of soil and environment, how much of which fertilizer should be used at a time,
consumption rate of different fertilizers and depletion concerns have been generally discussed by some
of the papers and journals referenced in this paper. Though the consumption of phosphate fertilizer has
raised concern about depletion of the resource for the future use, there was no experimental work done
to provide possible alternative source rocks for inorganic phosphorus. Thinking prospective for the
solution, this paper focuses on slow release of phosphate fertilizers from basaltic glass that can be
practiced in the current agricultural approach.
Moreover, uncontrolled application of the current phosphate fertilizers has brought environmental risks.
Hence, selecting this topic was also to possibly define slow fertilizers that could be environment
friendly. Therefore, utilization of natural inorganic fertilizers and their slow release not only enhance
the yield but also could keep the environment less polluted. Depletion of the existing reserve, effect of
high production rate, current and future demand of phosphorus was reviewed below to emphasis the
concern and revel why alternative sources have to be taken into account.

3 Dawit KZ
1.2.1 Phosphate Rock Reserves
In the 17th
and 18th
centuries use of animal manure and human excreta were familiar way of upgrading
the soil fertility. However, that was not sufficient to produce enough crops that could feed the
continuously increasing world population, and mining of Guano was started in the mid-19th
century
(Cordell et al., 2009) . But this phosphate sources, Guano, were limited and at the end of 19th
century
phosphate rocks were discovered as unlimited resources of concentrated phosphorus (Cordell et al.,
2009). Since then the demand for the phosphate fertilizer has been immensely increased and phosphate
rocks are major source of phosphorus fertilizer up to now (Fig.1).
Analysis that apply the GA models has revealed that the earth contains 11*1021
to 13 *1021
Kg of
Phosphorus from the nebular condensation (Smith, 1981). According to the USGS the phosphate rock
reserves are economically viable to be mined with sufficient phosphate content relative to deposition
environment such as Continental shelves, sea mounts that are economically inaccessible to be mined
with the current technology (Cooper et al., 2011).
1.2.2 Distribution of Phosphate Rock Reserves
The geographical occurrence of phosphate is limited with respect to temporal and spatial conditions.
77% of the global reserve is in Morocco followed by China and Algeria (Cooper et al., 2011). The US,
largest consuming country, on the other hand is the seventh world reserve where its domestic reserves
are left only with 25 years. The IFA and FAO report in 2006 set African as the largest exporter of high
quality phosphate fertilizer and also continent with largest food shortage (IFA, 2006). This could be
linked to the current price as well as global production of the phosphate fertilizer. Nevertheless, the
Figure 1. Shows history of world source of phosphorus fertilizer 1800 -2000. Phosphate rocks
were the major sources of phosphorus fertilizers. Image taken from (Cordell et al., 2009) .

4 Dawit KZ
mining from the Western Sahara was censured by the Norwegian Support committee for Western
Sahara in 2007 as it was against the international law (Cordell et al., 2009).
1.2.3 Phosphate Rock Production
The recent significant growth in agricultural yield could be linked to the rapidly increasing phosphate
production. Since 1900 about 7000Mt of phosphate was produced leading to agricultural yield increase
in 3.7% per year (Cooper et al., 2011). Studies and IFA reports stated annual production highly
increased since 2010 and will continue to rise (Heffer and Prud'homme, 2012; Ryan et al., 2012).
Figure 2. World phosphate rock production in 1994–2010 (USBM/USGS Mineral Commodities Summary,
1996–2011), (Ryan et al., 2012)
It seems that the geographically concentrated occurrences of the phosphate rocks give uncertainty in
securing future phosphate supply. Consumption of the developed countries has raised the rate of
phosphate production.
Figure 3. Developing, developed countries and world total phosphate fertilizer consumption (Tg P yr-1) from
1961–2008 (IFADATA, 2011 recalculated from original data), (Ryan et al., 2012)
Phosphorus was actively mined at 160 Mt/yr and no significant practical exploit was done to reduce
the deficiency. Reducing rate of mining was stated as one possible way to slow the depletion (Dawson
and Hilton, 2011; Suh and Yee, 2011). But this did not practiced since it couldn’t provide solution to
the development of food production.

5 Dawit KZ
The trade-wind belt-phosphates formed by the upwelling cold nutrient rich water depositing Apatite
pellets, Organic rich Mud, Diatomite along the continental shelves and Equatorial group phosphate
similarly formed by the east-west running trade wind were also predicted to be the future phosphate
sources (Sheldon, 1982). But that did not become feasible until know.
1.2.4 Current and Future Demand
The nutrient deficient soils like that of Sub-Saharan Africa still need more application of chemical
fertilizers (Figure 3). In addition, the IFDC in 2006 specified that 30% of the population in Sub-
Saharan Africa applies very low fertilizer while 75% of the soil is nutrient deficient (Cordell et al.,
2009). This emphasis that unlike the developed countries who have overused phosphate fertilizers,
there is still very high demand for fertilizer in the developing country. The IFA indicated world
phosphorus demand will show 43Mt growth in 2016 from what was in 2011(Heffer and Prud'homme,
2012) and indicated the increased by 2.9% between 2010 and 2014. Estimation of Phosphorus based
on the remaining world’s reserve shows, the production will decline after it reaches peak in the 2035
(Figure 4).
Figure 4. Illustrates the coherence of the World phosphate consumption until 2014 (right) from (Heffer and
Prud’homme, 2010) and Global phosphorus production estimation and peak production curve (left)
from(Cordell et al., 2009)
The current decline in phosphate reserves could cause further exploration and exploitation from
available low grade reserves which defined to lack consideration of the finiteness of the resource,
limited accessibility to the poor farmers and environmental contaminations (Cordell et al., 2009).
Unlike that of Nitrogen, can be obtained from the air biologically and potassium, which has larger
sources, phosphorus remains bottleneck for the future agricultural productivity (Hendrix, 2012).

6 Dawit KZ
1.3 Over Fertilization and Environmental Impact
The demand for extra production in advance by the developed countries, made the current world to
apply excess phosphorus to the soil. Application of phosphorus varies from continent to continent.
Europe has applied 25kg P while Africa has used 3kg P per hectare in the year 2005 (Hendrix, 2012).
The application of fertilizers more than the soil retaining capacity and the crop requirement increase
flow of the nutrient in to fresh water causing fast growth of plants and reduction in dissolved oxygen
(Hendrix, 2012). Moreover, soil availability of phosphorus depends on the type of phosphate fertilizer
applied (McDowell et al., 2003).
Mining and processing phosphorus causes adverse environmental impact in the vicinity of the mine
(Hendrix, 2012) and its production from phosphate rocks involves high emission of Carbon,
Radioactive elements and Heavy metal pollutants (Cordell et al., 2009).
Fluorine increased in soil threatened with phosphorus for extended period can cause fluorosis in
grazing animals and drinking water (Loganathan et al., 2001). In New Zealand over-application of Cd
contain phosphate affected grazing animals with kidney disease following the higher concentration of
Cd in the grassland (Loganathan and Hedley, 1997).
The phosphorus concentration in runoff was high in area where the soil retaining capacity is very low.
For instance, the application of the water-soluble phosphorus has cause eutrophication in the water
bodies of Florida (Yang et al., 2012). This reveals that the currently applied phosphorus is not only
depleting but also becoming environmentally a threat. Hence, it could be wise for the current
agriculture to find a new type of phosphorus that could agriculturally effective and environment
friendly.
1.4 Slow Fertilizers
Slow fertilizers have environmental and economic advantageous. These occurs as result of increase in
pH and exchange of the Ca & Mg in the soil where the fertilizer rock is added (Yang et al., 2012).
Many studies have been conducted on describing possible slow fertilizers.
The consistency of Phosphorus, Potassium, Calcium and Magnesium nutrients make Apatite-Biotite-
Carbonatite rock more favorite to use as slow fertilizer component (Heim et al., 2012). But applying
this material as fertilizer delivers the toxic elements Ba and Sr to plants as chemical weathering of the
rock powder.

7 Dawit KZ
Dolomite phosphate rocks are also being used as slow fertilizer in areas like Florida but should be used
in adjacent with commonly used Phosphorus because the phosphorus release from these rocks alone
was insufficient (Chen et al., 2006).
Natural Zeolite provides mixing of Alumino-silicates with the rock phosphate, increases the
dissolution due to effect of the ions exchange as well as H+ generation through nitrification and
increases plants up take of Phosphorus (Pickering et al., 2002).
Therefore, unconventional strategies such as slow release of Phosphorus have to be applied to
minimize the amount of phosphorus joining the running water and partly solve the problem of water
pollution. Use of slow fertilizers like Basaltic glass as source of phosphate fertilizers not only gives a
handful solution to the scarcity concern of the phosphate fertilizer but also be an environmental
friendly approach.
1.3 Objectives
1.3.1 Main Objective
To evaluate the feasibility of basaltic glass to be used as source rock of inorganic phosphorus
fertilizer
1.3.2 Specific Objectives
To evaluate dissolution release rate of phosphate from basaltic glass
To develop optimal use of naturally available resources and possibly reduce future costs of
chemical fertilizers
To assess the possibility of complete digestion of basaltic glass in acidic media to explore its
potential as a fertilizer
To determine the solid mineral phase that may be form during acid digestion of basaltic glass
1.4 Limitation of the study
The limitations here could be technical, like the accuracy of the computations resulted from assumptions
regarding the real natural system. The impractical to use the ICP-MS equipment after long waiting resulted
shortage of time and may present impact on the quality of the output data. Concentration of Aluminum was not
measured due to safety reason for the analytical equipment. In the natural environment, weathering of the rocks
could be controlled by physical and chemical processes. It is clear experimental analysis have made the complex
nature simple and understandable. However, dissolution rate parameters used in this study are approximations of
their true field situations. Such as geometric surface area of grains were calculated assuming all particles

8 Dawit KZ
spherical. It also was stated actual geometric surface area might be orders of magnitude less than estimated
physical surface area (Rowe Jr and Brantley, 1993). Hence, interpretations have to be based on their
assumptions and consideration of the numerous processes (such as geological and hydrogeological interactions).
Combined evaluation of the effects of change in particle distribution, prevailing temperature, pH and
hydrological character of the different soil types as well as late formed secondary layers might provide better
result.
1.5 Outline of the Study
The thesis has six chapters. Short outline of each chapter follows:
1. Introduction: introduces the general background of the thesis, the statement of the problem, main
and specific objectives and outline of the thesis. The fertilization and status of phosphate fertilizer,
problem the thesis addresses and purpose of the study were dealt in this chapter.
2. Theoretical background: this chapter reviews the previous works on the occurrence and
dissolution rate of basaltic glass. It also presents occurrence of phosphate, speciation of phosphate with
pH as well as why basaltic glass was chosen as possible source rock of phosphorus.
3. Experimental system: this chapter is concerned about laboratory experiments and analytical
methods used to collect data. Procedures followed to conduct the mixed flow experiment and analyze
the aqueous and solid samples were discussed. Softwares used for modeling were also described.
4. Results: results from both experiments and Matlab and Preeqc simulations output are presented in
this part. Rate of dissolution for the basaltic glass, released rate of ions as function of time, complete
extraction of phosphorus as result of acid treatment and mass of basaltic glass required to convey the
recommended amount of phosphorus per hectare are determined.
5. Discussion: in this part of the thesis the experimental and simulation results are discussed briefly.
Feasibility of basaltic glass as source rock is clarified.
6. Conclusion and recommendation: Presents the conclusion reached through the study and finally
future researches are recommended.
References: presents list of bibliographies and authorities used in this research.
Appendixes: this part contains brief details of mass calculation, tabulated results and derivation of
formulas used to set experimental procedure as well as in the result and discussions.

9 Dawit KZ
2. THEORETICAL BACKGROUND
2.1 Occurrence and abundance of Basaltic glass
A study by (Morgan and Spera, 2001) stated rapid cooling of magma on the earth produces about one
billion km3 glass, which most of it is basaltic glass. Volcanic glass was rated as the third abundant
rock on the continental crust covering about 12% of the surface (Nesbitt and Young, 1984). Potential
deposits of basaltic glass were stated to occur along Oceanic islands, Island arcs (of Hawaii, southern
and Western Samoa), active divergent plate tectonics (African rift valley) and the 70, 000km glob-
encircling ridge such as volcanic province of Pacific Ocean (Morgan and Spera, 2001; Smith et al.,
1978).
2.2 Basaltic glass dissolution and controlling factors
In addition to its abundance, the fast reactivity of basaltic glass was said to contribute numerous metal
oxides, silicate and phosphorus oxide to nearby environment. Moreover, low alteration temperature in
the seafloor and higher hydraulic conductivity in the glassy surface were other specified reasons for
the high degree of weathering in addition to the non-crystalize structure (Gislason and Oelkers, 2003).
Another study stated Stoichiometric dissolution of basaltic glass take longer time not only in the
neutral condition but also last several hours in acidic and alkaline condition (Guy and Schott, 1989).
The reason was that the destruction of the tetrahedral coordinated inner layer composed of Si, Al and
Fe (III) is durable.
Similarly, (Oelkers and Gislason, 2001) have stated far from equilibrium dissolution of basaltic glass is
dependent to the concentration of aqueous aluminum in both basic and acidic conditions. The
collective emphasis by these studies would imply removal of adjacent aqueous Al could enhance the
breaking of the bond and reduce Si replacement in the glass structure and possible sorption.
Oelkers and Gislason added the dissolution of basaltic glass is proportional to the concentration of
partially detached silicon tetrahedral at the surface of grains (Oelkers and Gislason, 2001).
Experimental study on behavior of trace elements Li and Cs, during the dissolution of basalt indicates
the destruction of the host silicates will convincingly move the trace elements in to the solution or the
solid phases (Berger et al., 1988). It shows the separating of Li and Cs in to hydrothermal minerals,
chlorites and smectite as well as preferential leaching of Cs and stoichiometric release of Li with
respect to silica.

10 Dawit KZ
A study by (Harley and Gilkes, 2000) explain their doubt in the feasibility and effectiveness of the
different silicate source rock prospects for inorganic fertilizer. The low solubility of silicate rocks,
distribution and solubility of nutrients in the rock as well as mineral weathering rates were identified
factors that cause time bound infeasibility of using the different inorganic fertilizers source rocks.
2.2.1 Surface area and grain size
The specific surface area is determined by the distribution of the grain sizes, which indirectly means
the grain size distribution controls the kinetics of the dissolution of the basalt glass.
Basaltic glass dissolution was studied as function of its composition where the effect of BET and
Geometric surface area on the rate was compared(Wolff-Boenisch et al., 2004b). They found that the
rBET was smaller due to coating on the surface of grains. As atoms are detached from the surface of the
grains the rate is proportional to the aqueous surface area.
Berger et al. studied dissolution of basaltic glass at 2000C in sea water to verify whether the surface
area or later developed coating layers control the reaction (Berger et al., 1987). They found selective
removal of species, which implies formation of diffusion prohibiting surfaces (e.g. smectite) control
the alteration but not surface reaction.
Another study on far from equilibrium dissolution rate at 250C temperature and pH < 11 indicated the
dissolution rate is pH and Surface area dependent at lower pH but at higher pH it becomes pH
independent (Helgeson et al., 1984)
2.2.2 Time
Chemical reactions and rate of removal of elements/ions in nature take place as function of time. The
unit of the rate depends on the definition of the reaction and could be mol.m2.s
-1 or mol.s
-1 (Appelo and
Postma, 2005). Generally rate is expressed by the change in concentration with time.
------------------------------------------------- 2.1
The negative sign implies the rate is a decreasing rate. Field weathering rate of minerals with
difference in relative strength was stated by Samuel Goldich in 1938. Though recent advance in
laboratory rate measurements allowed prediction of natural weathering rates, discrepancies may occur
as they represent different time duration and actual physical conditions. It looks why (White and
Brantley, 2003) produced a general rate expression for decreasing silicate weathering with time at
ambient temperature ( ; a is intercept and b the slope of regression line).

11 Dawit KZ
2.2.3 Fluoride and environment
Aqueous Fluoride has a positive effect in enhancing the dissolution of basalt glass. The formation of
aqueous aluminum fluoride complexes limits the activity of Al+3
which is a limiting factor in
calculating the far from equilibrium rate of glass dissolution (Wolff-Boenisch et al., 2004a).
……………………………………………………. 2.2
Where k is specific rate constant, n stoichiometric constant and a activity of the subscript species.
Figure 5 shows speciation of aluminum in acidic aqueous medium as a function of fluoride ion. At
fixed pH 4 and temperature of 25 0C, the activity of aluminum ion decreases due to the affinity of
Aluminum to form complexes with fluoride ion following the increase in fluoride concentration.
Figure 5. Computed activity of Aluminum as a function of total fluoride concentration at pH 4 and 250C for a
total Al concentration of 10-6
mol/kg (Wolff-Boenisch et al., 2004a)
Similarly, another study showed that solubility of Fluorine is higher at acidic due to forming
complexes with Al (Mezghani et al., 2005). It also added displacement of F- by OH
- might increases
fluorine release at alkaline pH.
Though phosphate rocks are the main source of Fluorine in pastoral soils, the concentration of fluorine
in Phosphate rocks especially in fluorapatite was defined very low (Loganathan et al., 2008). In
addition, recent recommended application of phosphate fertilizers to moderate acidic soil made it
unlikely to increase the Al-F complex to cause photo-toxicity (Manoharan et al., 2007). But
environment health and safety guideline report has identified HF, SiF4 which are the byproduct of
current phosphate fertilizer manufacturing system should be determined for environmental purpose
(EHS, 2007). This also provides possible implication that use of slow release fertilizers would reduce
the concern much better than the current sedimentary derived phosphate fertilizers.

12 Dawit KZ
2.3 Occurrence of Phosphorus
By nature some elements are inert while some are highly reactive and are only found in compounds.
Phosphorus is reactive element that does not occur as free element in the earth and apatite seems the
principal storage major storage. Microprobe analysis on tholeiitic basalt from the upper mantle
revealed the Apatite contains 18 wt% of P (Smith, 1981). Smith added, Phosphorus ranked as the
eleventh abundant element in the earth crust occurred 95% as Apatite and the earth’s crust accounts an
average of 8*10 8 million tons of phosphorus.
2.4 Chemistry of phosphorus in aqueous solution
Inherently soils are deficient in phosphorus content to enhance crop production that enables feeding
the continuously growing population. Hence, application of P fertilizer has become the ultimate choice.
A study defines that fertilizer application increases total inorganic phosphorus in the upper 15 cm soil
decreases with depth (Takahashi and Anwar, 2007).
Experiment on crop responses to applied phosphorus concentration has revealed for groundnut 20 kg P
and wheat 40kg P per hectare is adequate (Aulakh et al., 2003). A similar study determined
recommended phosphorus concentration to be 23-28kg P per hectare (Ross H., 2013).
Another study on plant available P expresses it is difficult to exactly determine the concentration of
plant available P in different soils because of different mechanisms that affect the environmental
availability of phosphorus (Devau et al., 2009).
Phosphorus occurs in different forms such as in mineral, particulate and dissolved form in the earth.
Orthophosphates or p (-III) compounds are the most know plant available forms of phosphates
(Hanrahan et al., 2005). However, the distribution of phosphorus compounds in the environment
significantly affects the bioavailability of these species to plants.
13 Dawit KZ
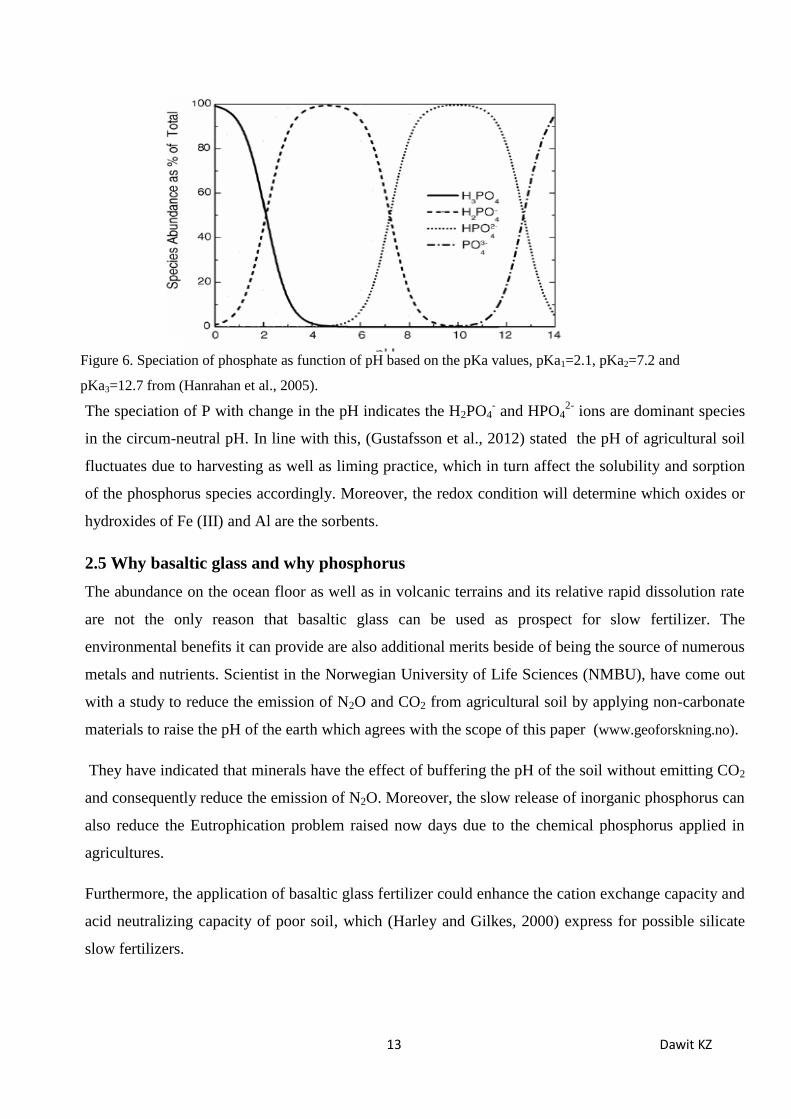
The speciation of P with change in the pH indicates the H2PO4- and HPO4
2- ions are dominant species
in the circum-neutral pH. In line with this, (Gustafsson et al., 2012) stated the pH of agricultural soil
fluctuates due to harvesting as well as liming practice, which in turn affect the solubility and sorption
of the phosphorus species accordingly. Moreover, the redox condition will determine which oxides or
hydroxides of Fe (III) and Al are the sorbents.
2.5 Why basaltic glass and why phosphorus
The abundance on the ocean floor as well as in volcanic terrains and its relative rapid dissolution rate
are not the only reason that basaltic glass can be used as prospect for slow fertilizer. The
environmental benefits it can provide are also additional merits beside of being the source of numerous
metals and nutrients. Scientist in the Norwegian University of Life Sciences (NMBU), have come out
with a study to reduce the emission of N2O and CO2 from agricultural soil by applying non-carbonate
materials to raise the pH of the earth which agrees with the scope of this paper (www.geoforskning.no).
They have indicated that minerals have the effect of buffering the pH of the soil without emitting CO2
and consequently reduce the emission of N2O. Moreover, the slow release of inorganic phosphorus can
also reduce the Eutrophication problem raised now days due to the chemical phosphorus applied in
agricultures.
Furthermore, the application of basaltic glass fertilizer could enhance the cation exchange capacity and
acid neutralizing capacity of poor soil, which (Harley and Gilkes, 2000) express for possible silicate
slow fertilizers.
Figure 6. Speciation of phosphate as function of pH based on the pKa values, pKa1=2.1, pKa2=7.2 and
pKa3=12.7 from (Hanrahan et al., 2005).

14 Dawit KZ
High P content of Mantle silicate was studied partitioning in to phosphorus distribution between
clinopyroxene, olivine and glass where glass has 0.75 -1.3 wt % Phosphorus. That is higher
phosphorus content than Olivine 0.07 – 0.15 wt%, Amphibole 0.035 – 0.07 wt% and Clinopyroxene
0.015 – 0. 06 wt% (Brunet and Chazot, 2001).
The over-application of P emphasis its agronomic efficiency is greater than N and K Particularly with
plants growth. The fertilizer dependency of the current agricultural practice, the intensive application
of Phosphate fertilizers and depletion of the resources are the motives in addition to the environmental
disruption (eutrophication).

15 Dawit KZ
3. EXPERIMENTAL SYSTEM
3.1 Introduction
Mixed flow experiment was conducted on Basaltic glass collected from Stapafell Mountain, Iceland.
Collected fluid samples were chemically analyzed. The basaltic glass chemical formula,
SiAl0.365Fe0.191Mn0.003Mg0.294Ca0.263Na0.081K0.008Ti0.025P0.004O3.405, was obtained from Stockmann.
(Stockmann et al., 2011).
3.2 Characterization of initial material
Prior to flow through experiments, initial sample material was characterized using XRD and SEM.
XRD spectrometry explains 85% of the sample was non-crystalline/glass and the remaining 15%
crystalline. The crystalline minerals found in this sample are mainly Forsterite and some Quartz
Figure 7. XRD analysis spectrum of unreacted basaltic glass
Thin gold coated representative grains of HCB and MiB were analyzed using low voltage SEM. Rough
grain size distribution estimation; surficial impurities and detail surficial structures were studied using
same EM image with different magnification (Fig. 8).

16 Dawit KZ
Figure 8. SEM analysis of unreacted basaltic glass A) bimodal 90% fine grained HCB B) Three size
families HCB with 75% fine grained, C) HCB used for grain surface Impurity check , D) Micronized
sample, BMI
Figure 9. SEM/EDS analysis of unreacted basaltic glass A. spots at which grains were selected for elemental
analysis and grains size measurement B. spectrum showing Elemental composition of the different grains
analyzed under SEM/ EDS. The Au in the spectrum is from the coating

17 Dawit KZ
3.3 Experimental Procedures
Descriptions of the procedures are presented in two parts. The first experiment includes crushing,
particle size analysis and flow through experiment. The second part was started after completion of
experiment one and in this phase basaltic glass was treated with acid and base.
3.3.1 Method for Experiment One
3.3.1.1 Crushing
49.8g of basaltic glass (labeled HCB) was manually crushed using agate mortar and pestle and 52.3g
of the basaltic glass (labeled MiB) was pulverized to a grain size of <0.2mm electronically using
micronize machine. For SEM, PSA and dissolution rate experiments the whole 49.8g of the HCB and
50.3g of the MiB were used. The remaining 2g of the MiB was used for XRD analysis. Ethanol was
added to the glass to minimize loss of grains during crushing and make crushing easier.
3.3.1.2 Particle size distribution Analysis
Grain size distribution analysis was carried out using the Beckman coulter LS 13 320 Particle Size
Analyzer (LS-PSA). A sonic stirrer was used to mix, separate the solution and pick representative
sample. 532 mg of sample was taken from each of the samples and diluted with Sodium Meta-
phosphate (NaO3P) to disperse the grains. Result is displayed (Table 2, Appendix I) as volume % in
discrete size classes. Geometrical specific surface area (sGeo in m2.g
-1) was calculated using eq. 3.1
based on the data obtained from LS- PSA (detail steps Appendix I, C).
∑
………………………….... (3.1)
Where Xi is volume fraction of basaltic glass, i discrete size classes, ρ density of basaltic glass
(2.9g/cm3) and r radius of grains respectively. The calculation of the surface area from the grain size
considers all grains as spherical. The surface area used throughout this study was geometric surface
area. Illustration of the particle size analysis is given below. Range of particle size distribution for the
hand crushed (HCB) & micronized (MiB), differential and cumulative volume % as well as computed
( ) and analytical (differential &Cumulative) surface areas are demonstrated from figure 10 –15.

18 Dawit KZ
Figure 10. Change in the differential and cumulative volume (%) with respect to grain size (µm) for HCB ; the
high volume of particle size range is between 100µm -200µm that is 10 time larger than micronized.
Figure 11. Expression of the variation in Experimental cumulative and differential surface area (%)with grain
size for HCB. the analithical statistics also revels particle sizes <7.776µm make 80% of the surface area(%).

19 Dawit KZ
Figure 12. Illustrates the change in specific surface area (m2.g
-1) and differential volume (%) with particle size,
HCB. The calculation of the Surface area from the grain size considers all grains as spherical.
Figure 13. Experimental result showing change in the Differential and Cumulative volume (%) with respect to
grain size (µm), MiB; the high volume of particle size range is 10 µm -20µm which is 10 times lower than hand
crushed sample.

20 Dawit KZ
Figure 14. Expression of the variation in Experimental cumulative and differential surface area (%)with grain
size for MiB . the analithical statistics also shows particle sizes <4.6µm make 80% of the surface area(%).
Figure 15. Illustrates the change in the calculated specific surface area and differential volume % with particle
size, MiB.
The above illustrations showed the change in differential surface area (analytical output) and
calculated geometrical surface area as a function of the particle size for both samples were similar.
Mixed flow experiment was chosen because of its flexibility and closer analogous to weathering in a
natural regoliths (allow infiltrating water progressive reaction with a continuum of mineral phases).
Non-stirred 250 ml polypropylene reactors were placed in a shaker bath at a temperature of 80°C and
pH 7. Two reservoirs were filled each with 800 ml distilled water, 20g HCB and 10g MiB basaltic
glass were added respectively to the two reactors. A peristaltic pump was used to flow water in the

21 Dawit KZ
reservoirs to the reactors through tubes and drive aqueous solutions from the reactors. The discharge
through the tubes was collected in to bottles three times a day (Appendix I, A) and chemically
analyzed using Ion chromatography and Colorimeter. The dried solid samples were analyzed under
SEM to determine surface coating and secondary minerals formation. The rate of dissolution (r) was
calculated by;
…………………………………………………3.2
Where Q is flow rate (g.s-1
), Δci is difference between individual inlet and outlet concentrations (mol.g-
1), S is the surface area of reaction (m
2) and ni is stoichiometric coefficient of element i in the glass.
Before starting the experiment a literature review of glass dissolution rate was done. The rate as
function of pH was recalculated according to (Gudbrandsson et al., 2008) as shown in figure 16. These
rates were used to adjust the flow rates (Q) that possibly prevent precipitation of silica (amorphous or
microcrystalline). Calculation details can be found in Appendix I, B.
Figure 16. Characterization of rate of release as function of pH at 250C (green), 50
0C (red) and 75
0C (blue);
activation energy was used from (Gudbrandsson et al., 2008)
The mole of basaltic glass required to dissolve the Concentration of Phosphorus per hectare per year
was calculated using e.q.3.3.
……………………………………………..3.3
Where nb is moles of basalt, Cp is amount of phosphorus per hectare per year, Xp is fractions of
phosphorus in 1 mole of basaltic glass (g), k is specific rate constant (mol.m-2
.s-1
), s is specific area

22 Dawit KZ
(m2.g
-1) and t is time (sec). Consequently, the mass of basaltic glass was also calculated based on the
result from eq. 3.3 (calculation details Appendix II).
3.3.2 Method for Experiment Two
As will be presented in the result part one of chapter 4, the result from the first experiment showed the
rate at which silica and phosphorus released was very slow. This raised query of separating
Phosphorus from the framework of the glass. Hence, pretreating the basaltic glass with acid and /or
base might generate a material with more phosphorus and high reactivity.
Therefore, in this second experiment the basaltic glass was pretreated separately with HCl, HNO3 and
H2SO4 acids. 5g of basaltic glass was diluted with respective concentration of each of the acids at pH
zero and placed in a heating bath (JB Aqua 26 plus) at 900C for 15 days. The same procedure was used
to prepare the solution for each of the acids as the procedure for sulfuric acid, given below.
5g of basaltic glass was diluted with 0.5M (1N) of concentrated sulfuric acid. The final volume of the
solution was 300 ml for all three reactors. The volume of sulfuric acid to be diluted was calculated for
1N (equivalent for 1mole of H+), which is 0.5M of H2SO4, for comparison with the other two acids. Eq.
3.4 was used to calculate the volume of each of the acids needed to prepare the total solution.
M1*V1 = M2* V2 ………………………… 3.4
M1 and M2 represent initial and final molarity (mol.l-1
), V1 and V2 stands for initial and final volume
(ml) used to prepare 1N solution of the acids respectively. Accordingly, the volume of sulfuric acid
required to produce 300ml of reactor is 8.4ml. HCl was chosen to favor non-oxidizing acid and weak
reducing property while HNO3 is an oxidizing acid. 1 M was used separately for both of these acids.
The volume required to prepare the 300ml solution was 24.7ml of HCl and 20.92 ml of HNO3. The pH
of solution measured after the distilled water and the acids were mixed was 0.19, 0.13 and 0.11 for
H2SO4, HCl and HNO3 respectively.
Total of 10 liquid samples were collected including the bulk solution sample in 15 days. The solid
material was placed on a filter paper in a sucking pump and rinsed using distilled water.
Basaltic glass of 20.5 g was reacted with NaOH at 90 0C and pH 12.5 in another experiment to
compare with digestion reactions of basaltic glass in acidic media. This will be presented in chapter
five part two.

23 Dawit KZ
3.4 Analytical Methods
3.4.1 Ion Chromatography (IC)
10 sample tubes for each of the HCB and MiB containing 6ml of liquid samples were loaded on the
automated sampler. The ICS 1000 and ICS 2000 were used to measure cation and anion concentration
respectively. Ion Pac CS16 column separates cations sequentially based on their charge and mass size
while the anions were separated based on Ion exchange (in accordance to their interaction with the
exchange sites) using Ion Pac AS18 column. A chromatogram is produced from the detected electric
conductance of each ion measured by the detector. The peak heights were quantified by chromeleon
and converted to concentrations in relative to the standard.
3.4.2 Colorimetric (CM)
The concentration of Silica and PO4-3
in the sampled solution was determined using the AA3 (Auto
analyzer) colorimeter. Standard solutions were prepared for every analysis conducted. Aqueous
standard was prepared using 15g Ascorbic acid, 2g Sodium dodecyl sulfate and 4.4g potassium
dihydrogen phosphate each diluted by 1000ml DI water. AA3 method number G-103-93 was used to
determine the concentration of phosphate as the orthophosphate reacts with molybdate and ascorbic
acid. Aqueous standard solution for the silica analysis was prepared from 6.82g ammonium molybdate,
59.3g Oxalic acid, 1g sodium dodecyl sulphate and 4.73g of sodium metasilicate nonahydrate each
separately diluted in 1000ml Di water. The AA3 method applied was G-147-95.
3.5 Statistical and Graphical Methods
The likelihood of super saturating some of the phosphate minerals as a function of reaction progress
was simulated using Phreeqc. NaOH were reacted with aqueous solutions that contain the metal
cations and orthophosphate ions to neutralize the acid and super saturate phosphate minerals at 25 0C,
90 0C and pH 1. Concentrations from analytical results were used to define the composition of the
initial solution in Phreeqc. Input concentrations were in ppm. The key word REACTION was used to
define reaction steps and stoichiometric formula of Sodium hydroxide (reactant). Data files were
produced using the Keyword SELECTED_OUTPUT data block.
Matlab was used to explore how preferential dissolution of fine particles affected the specific surface
area and release rate. The different values of specific rate constants, particles diameter and durations
were simulated using a specific model developed by Helge Hellevang in matlab program. Graphs were
customized using Photoshop and Microsoft Excel. Excel spreadsheet was used to create table for the
experimental and calculation data.

24 Dawit KZ
4. RESULTS OF RATE EXPERIMENTS
The results from the study are presented in two parts. Results presented in part one defines the
outcomes of the first flow through experiment as well as results from Matlab simulation and result in
part two refers to the results of the second experiment on both micronized and hand crushed samples.
4.1 Result Part One
The flow through experiment was conducted at pH 7 and 800C and liquid samples were collected for
both hand crushed (HCB) and micronized (MiB). Analytical results are given in Table 4.1 and 4.2. The
values of nitrate and phosphate ions for some samples labeled as n.a. (no analytical result) are due to
their lower concentrations compared to the detection limit of the IC.
Table 4.1 Concentrations of ions in the reacted bulk solution for the reacted hand crushed basaltic
glass
Sample Amount in mmol.l-1
Sampling
time
name F NO3 SO4 PO4 K Mg Ca Si days
R4 1 0,013 0,007 0,037 0,0041 0,059 0,077 0,115 0,187 0,21
R4 2 0,003 n.a. 0,004 n.a. 0,007 0,022 0,034 0,044 0,84
R4 3 0,004 n.a. 0,004 n.a. 0,009 0,039 0,059 0,087 0,99
R4 4 0,009 n.a. 0,004 n.a. 0,014 0,041 0,064 0,094 1,15
R4 5 0,005 n.a. 0,005 0,0042 0,013 0,065 0,123 0,199 1,83
R4 6 0,005 0,006 0,004 0,0040 0,010 0,037 0,077 0,105 2,02
R4 7 0,004 n.a. 0,004 0,0041 0,008 0,039 0,090 0,117 2,16
R4 8 0,004 n.a. 0,004 n.a. 0,008 0,030 0,065 0,083 2,92
R4 9 0,004 n.a. 0,004 n.a. 0,007 0,029 0,062 0,089 3,11

25 Dawit KZ
Table 4.2 concentrations of ions in the reacted bulk solution for the reacted micronized basaltic glass
Sample
name
Amount in mmol.l-1 Sampling
time
F NO3 SO4 PO4 K Mg Ca Si days
R5 1 0,013 0,007 0,031 0,004 0,016 0,066 0,101 0,474 0,21
R5 2 0,005 0,007 0,008 0,004 0,012 0,050 0,098 0,340 0,88
R5 3 0,004 n.a. 0,004 n.a. 0,009 0,047 0,092 0,274 1,05
R5 4 0,004 n.a. 0,004 n.a. 0,008 0,046 0,090 0,248 1,22
R5 5 0,004 n.a. 0,003 n.a. 0,007 0,036 0,075 0,178 1,89
R5 6 0,005 n.a. 0,004 0,004 0,009 0,041 0,092 0,197 2,06
R5 7 0,004 n.a. 0,003 0,004 0,008 0,034 0,070 0,182 2,23
R5 8 0,004 n.a. 0,005 0,005 0,013 0,034 0,182 0,358 2,99
R5 9 0,003 0,006 0,005 0,004 0,008 0,025 0,103 0,151 3,18
Figures 17 to 23 illustrate the change in released concentration of ions as a function of time in
consensus to equation 2.3. This temporal evaluation of release rate of each ion suggested that a steady
state was attained between first and second days.
Figure 17. Concentration evolution for fluorine ion as function of time for both samples
Decreasing release rate of fluorine reaches to a steady release rate at day one (Fig. 17).

26 Dawit KZ
Figure 18. Concentration evolution for Sulphate ion as function of time for both samples
Release of sulphate from both samples display a sharp drop and reach steady release after day one. The
release rate of sulphate ion is consistent for both samples relative to other anions.
The release of Phosphate from both samples looks steady except the increase from micronized sample
to 0.051 mmol.l-1
at third day. There is missing data in the plot from 0.5 to 2nd
day that displays the
concentration below standard.
Figure 19. Concentration evolution for phosphate as function of time
The release rate of cations from HCB in general showed gradually decreasing release rate with time
(Figures 20 - 23). Relatively K+ showed consistent release from both samples and it looks that steady
state release was attained after day one.
27 Dawit KZ
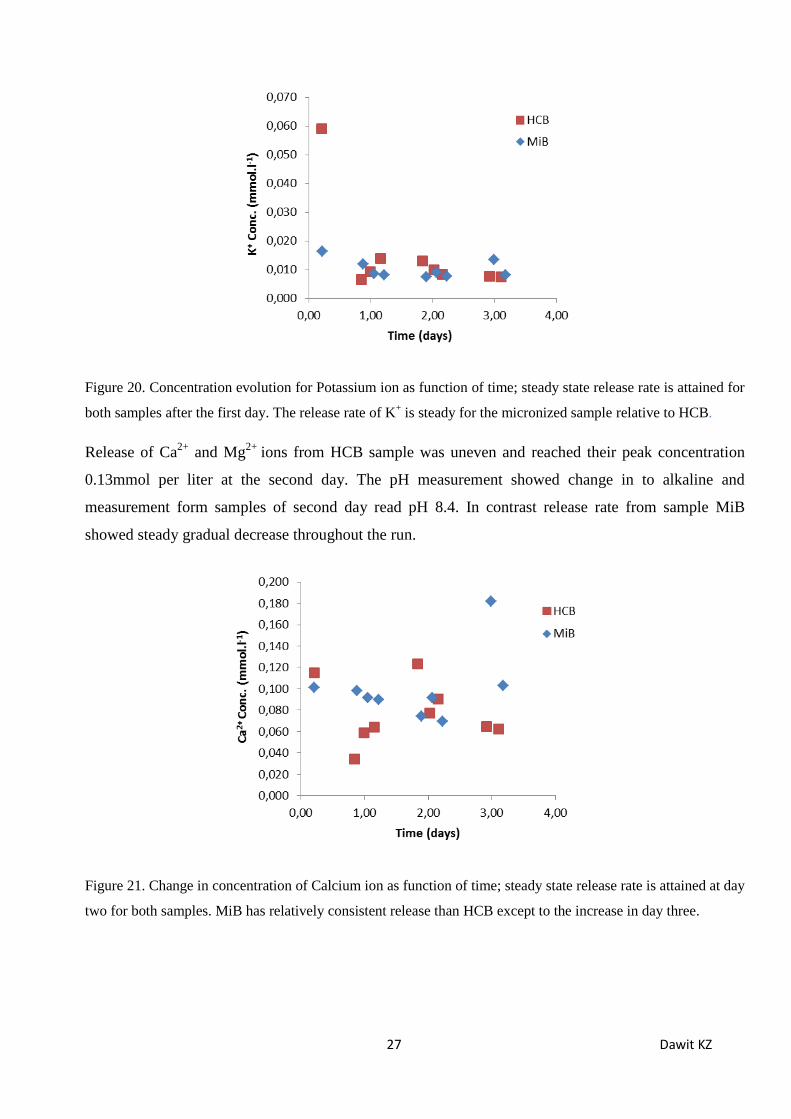
Figure 20. Concentration evolution for Potassium ion as function of time; steady state release rate is attained for
both samples after the first day. The release rate of K+ is steady for the micronized sample relative to HCB.
Release of Ca2+
and Mg2+
ions from HCB sample was uneven and reached their peak concentration
0.13mmol per liter at the second day. The pH measurement showed change in to alkaline and
measurement form samples of second day read pH 8.4. In contrast release rate from sample MiB
showed steady gradual decrease throughout the run.
Figure 21. Change in concentration of Calcium ion as function of time; steady state release rate is attained at day
two for both samples. MiB has relatively consistent release than HCB except to the increase in day three.

28 Dawit KZ
Figure 22. Change in concentration of Magnesium ion as function of time; Mg+2
releases from the MiB show
steadily decreasing release rate with time relative to the HCB.
Silica has initial higher release that declines throughout the time log for both samples other than to the
increase at slightly alkaline pH 7. 8.
Figure 23. Silica released as function of time; for both samples steady state release rate attained after two days.
The release rate is relatively consistent for the MiB in the first day.
The dissolution rate of basaltic glass at 80 0C and neutral pH shows initial decreasing phase and steady
secondary phase in general for both samples. The relatively unclear separation between the phases and
the inconsistent release of the ions in HCB may depict the effects of uneven grain size range and
particle fractioning. The uneven particle distribution of sample HCB might exhibit the particle

29 Dawit KZ
distribution of natural weathering process and provide comparison with the pulverized sample to
observe effect of reactive surface area on dissolution rate as function of time.
Figure 24. Logarithmic evolution of dissolution rate of basaltic glass based on the mole of Si during the flow
through experiment performed at 800C and pH 7 as function of time for both hand crushed and micronized
samples. The rate was calculated assuming the specific surface area remains constant.
The rate decreases initially and looks to attain steady state after the second day. The dissolution of the
plant nutrients PO43-
, K+ and in general the ions are higher for the micronized sample than the hand
crushed. There is slight increase in release of K+ from the HCB first to second day and this was the
case for most of the cations. This could be due to pH favor as pH measurement on the samples taken
on the first and second day showed 7.5 – 8.4. Generally all graphs have shown a decreasing release
rate with time.
Steady state rate of dissolution of basaltic glass for the first experiment was calculated according to
equation 3.2 at pH 7 and 800C (Table 4.3).
Table 4.3 rate of dissolution for both hand crushed and micronized samples in mol Si.m-2
.s-1
calculated
using equation 3.2
sample mass(g) Specific Surface
area (m2.g
-1)
Surface Area
(m2)
Flow rate
(g.s-1)
dCsi (mol.g-1
) Rate (mol Si.m-2
.s-1
)
BDK 20 0,16 3,2 0,0316 8,55E-08 8,44E-10
BMI 10 0,52 5,2 0,0321 1,85E-07 1,15E-09

30 Dawit KZ
Table 4.3 shows that the dissolution rate of basaltic glass is higher for the micronized than the hand
crushed. The difference in the rate of dissolution between hand crushed and micronized samples
revealed that the higher surface area (depicted by the micronized sample) enhances the dissolution of
basaltic glass.
Determining the phosphorus concentration associated to basaltic glass as fertilizer doesn’t only define
the amount of basalt required to obtain optimum P but can reduces eutrophication. Considering the
basalt will completely dissolve, mass and percentage of phosphorus and other species element were
calculated (Table 4.7) from the molecular formula given by (Stockmann et al., 2011) in chapter two.
Table 4.4 Elemental statistics of the basaltic glass used for this study. Mass and percentage of elements
as well as molecular mass of the basaltic glass were computed.
Species moles Molar Mass (g/mol) Mass Basalt (g) in %
Si 1 28,086 28,086 22,57
0,962
7,915
8,572
0,132
5,742
8,476
1,497
0,251
0,0996
43,782
Ti 0,025 47,867 1,196675
Al 0,365 26,982 9,84843
Fe 0,191 55,845 10,666395
Mn 0,003 54,94 0,16482
Mg 0,294 24,3 7,1442
Ca 0,263 40,1 10,5463
Na 0,081 22,99 1,86219
K 0,008 39,098 0,312784
p 0,004 30,97 0,12388
O 3,405 15,999 54,476595
Molecular Mass 124,428269
The approximated amount of the plant nutrients phosphorus and potassium according to above
calculation is 0.1% and 0.25% respectively. Assuming constant specific surface area the moles of
basaltic glass that could dissolve in a year from the initial 10g MiB was computed using;
nb= n0 –n0exp-(k*s*m*t)
……………………………………..…………. 4.1
Accordingly, 0.073 moles of glass dissolve in a year, which is equivalent to 9.04g glass. Consequently,
the amount of phosphorus and potassium that could be obtained from the 10g glass was 9.02*10-3
g and
0.02g per year respectively.

31 Dawit KZ
Having all the above observations from the chemical analysis the tying question that should finally be
addressed was, can basaltic glass be used as slow fertilizer? Modeling has been done in Matlab to
emphasis the effect of change in specific surface area with time, temperature and pH in the dissolution
of basaltic glass before answering this basic question. Moreover, the simulations will be compared to
the experiment done at 80 0C and find out explanation for the decline in rate of release in the
experimental results in relation to particle size distribution.
Analytical data such as particle size from LS-PSA, calculated specific rate constant and the specific
surface area (cm3) were used to simulate the dissolution rate of the hand crushed (BDK), micronized
(BMI) and synthetic samples at different temperature and pH (Fig. 25 to 36). The simulation period
was thirty days, 6 months and one year separately for each of the samples. The range of particle sizes
for BDK and BMI are given in the method section (Fig.11&14) and temperature, rate constants as well
as the pH used for the simulations are specified under each model.
4.2 Mat lab simulation results of HCB
The hand crushed sample was simulated for 30 days (model 1), six months (model 2) and one year
(model 3) at temperatures 800C, 50
0C, 25
0C and pH of 8 as well as 4.
4.2.1 Model 1
Model one simulates dissolution of basaltic glass for 30 days at 800C and pH 8. The specific rate
constant used in this simulation was 3.29*10-9
mol.m-2
.s-1
.
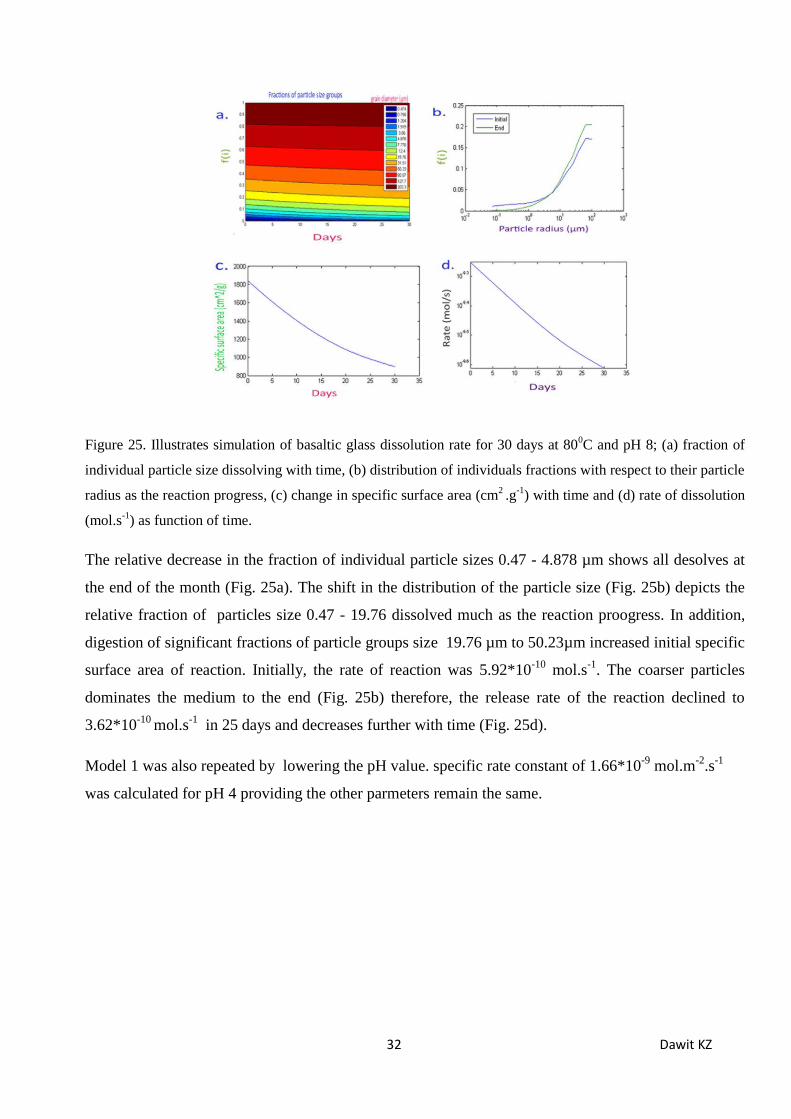
32 Dawit KZ
Figure 25. Illustrates simulation of basaltic glass dissolution rate for 30 days at 800C and pH 8; (a) fraction of
individual particle size dissolving with time, (b) distribution of individuals fractions with respect to their particle
radius as the reaction progress, (c) change in specific surface area (cm2 .g
-1) with time and (d) rate of dissolution
(mol.s-1
) as function of time.
The relative decrease in the fraction of individual particle sizes 0.47 - 4.878 µm shows all desolves at
the end of the month (Fig. 25a). The shift in the distribution of the particle size (Fig. 25b) depicts the
relative fraction of particles size 0.47 - 19.76 dissolved much as the reaction proogress. In addition,
digestion of significant fractions of particle groups size 19.76 µm to 50.23µm increased initial specific
surface area of reaction. Initially, the rate of reaction was 5.92*10-10
mol.s-1
. The coarser particles
dominates the medium to the end (Fig. 25b) therefore, the release rate of the reaction declined to
3.62*10-10
mol.s-1
in 25 days and decreases further with time (Fig. 25d).
Model 1 was also repeated by lowering the pH value. specific rate constant of 1.66*10-9
mol.m-2
.s-1
was calculated for pH 4 providing the other parmeters remain the same.

33 Dawit KZ
Figure 26. Demonstrates simulation of dissolution rate of basaltic glass for 30 days at 800C and pH 4; (a)
fraction of individual particle size dissolving with time (b) distribution of individuals fractions with respect to
their particle radius as the reaction progress, (c) change in specific surface area (cm2.g
-1) with time and (d) rate
of dissolution (mol.s-1
) as function of time
The initial rate in this model was 2.9*10-10
mol.s-1
, which is half of the initial rate of the alkaline pH,
5.9*10-10
mol.s-1
. The initial specific surface area, 1800 cm3.g
-1 was reduced to 1300cm
3.g
-1 and 900
cm2.g
-1 at acidic and alkaline medium respectively. Hence, it infers for the same time period and
temperature the dissolution rate was relatively high at pH 8 than pH 4. This might be due to the effect
of temperature was high at alkaline pH.
4.2.2 Model 2
Specific rate constant of 5.27*10-10
mol.m-2
.s-1
, temprature 500C and pH 4 were considered to simulate
the rate of disolution for Six months. Out put follows;

34 Dawit KZ
Figure 27. Basaltic glass dissolution rate simulation for 6 months at 500C and pH 4; (a) fraction of individual
particle size as function of time, (b) fractions of particle size distribution as the reaction progress (c) change in
specific surface area with time and (d) the rate of dissolution (mol.s-1
) as function of time
The initial rate is 1.06*10-10
mol.s-1
. At the beginning the reactive surface area about 1800cm2.g
-1
looks mainly to be contributed by the fine particles 0.474 to 7.776µm and reduces with time as these
finer particle digested. The decline in surface area explains digestion of more fine particles, explained
by the reduction in fractions of fine particles size to the end of the reaction (Fig. 27a). Moreover, the
crossing of the green line in figure 27b also emphasis the dominancy of coarser particles at the end and
the reduction of the rate by half in five months. At the 30th
day and pH 4 the rate in this model is about
8.4*10-11
mol.s-1
, which is five time less than the rate in model 1 at pH 4 and 30 days. This could
mainly be due to the high temperature used in model 1.

35 Dawit KZ
4.2.3 Model 3
In this model the simulation time was extended to one year at temperature of 250C, pH 8 and specific
rate constant, 2.61*10-10
mol.m-2
.s-1
.
Figure 28. Illustrates simulation of Basaltic glass dissolution rate for a year at 250C and pH 8; (a) fraction of
individual particle size dissolving with time, (b) distribution of individuals fractions with respect to their particle
radius, (c) change in specific surface area (cm2.g
-1) with time and (d) rate of dissolution (mol.s
-1) as function of
time.
The digestion of the fraction of individual particle sizes 0.47 – 3.06µm took seven months (Fig. 28a).
The particles size 4.878 – 19.76µm were digested to great extent in the given condition (Fig. 28a).
Figure 28b indicates relative increase in coarser particles to the end of the reaction. Consequently, the
specific surface area reduces by half in a year to 1000 cm3 (Fig. 28c). As a result, the initial rate,
4.7*10-10
mol.s-1
declines by half, to 2.35*10-11
mol.s-1
at the end of the year.

36 Dawit KZ
4.3 Mat Lab Simulation Results of MiB
The micronized sample was also simulated similarly for thirty days (Simulation1), six months
(Simulation 2) and one year (Simulation 3) at different temperaure and pH values.
4.3.1 simulation 1
The dissociation rate (mol/s) for the micronized basaltic glass was simulated for 30 days at 800C, pH 8
and specific rate constant of 3.29*10-9
mol.m-2
.s-1
.
Figure 29. Illustrates simulation of basaltic glass dissolution rate for 30 days at 800C and pH of 8; (a) dissolving
fractions of individual particle groups as function of time, (b distribution of fractions of particle with respect to
their particle radius), (c) change in surface area of reaction with time (d) the rate of dissolution as function of
time.
Particle sizes 0.474 -3.06 µm were completely dissolved and significant portion of particles radius of
4.878µm – 19.76µm dissolved in 30 days. Initially surface area was 5400cm3 and provides initial rate
1.78*10-9
mol.s-1
. As the fractions of fine partilce size groups reduced to the end of the reaction the
surface area decresed by 2500 cm2.g
-1 and hence the rate to 9.54*10
-10 mol.s
-1 . Provided the same
temperature, pH and time the rate is high in this simulation due to high fractions of finer particle size
groups relative to model 1 of HCB.
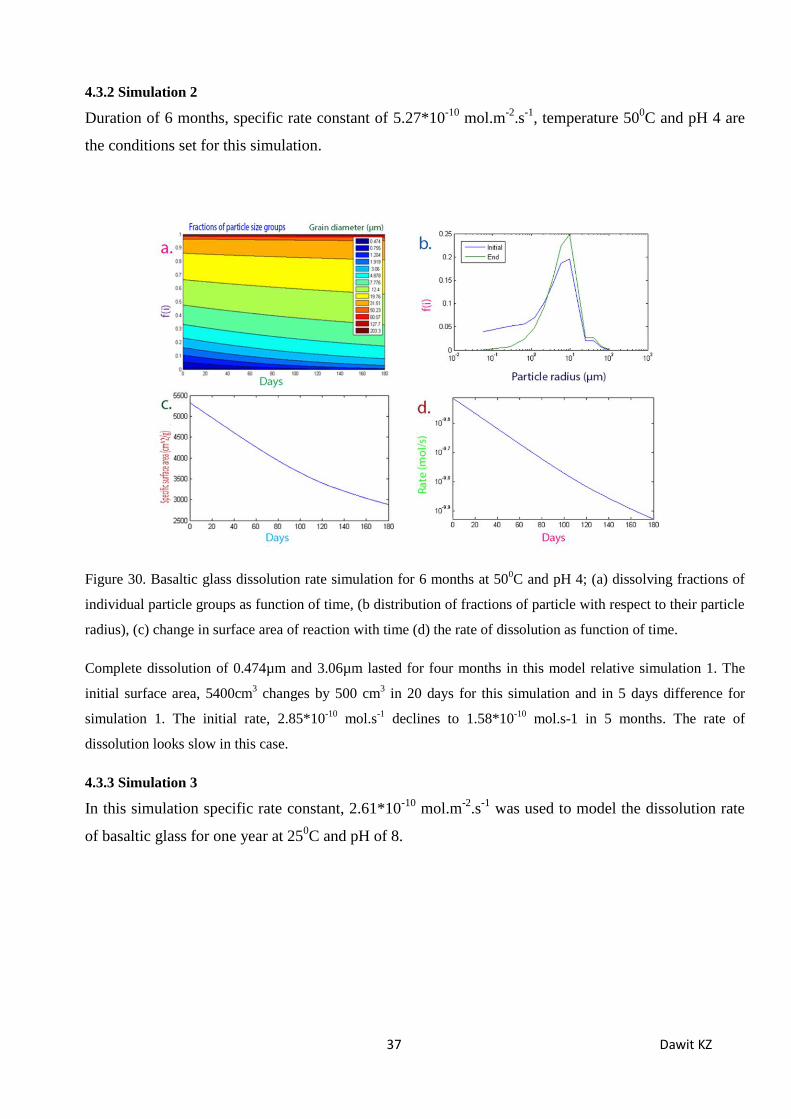
37 Dawit KZ
4.3.2 Simulation 2
Duration of 6 months, specific rate constant of 5.27*10-10
mol.m-2
.s-1
, temperature 500C and pH 4 are
the conditions set for this simulation.
Figure 30. Basaltic glass dissolution rate simulation for 6 months at 500C and pH 4; (a) dissolving fractions of
individual particle groups as function of time, (b distribution of fractions of particle with respect to their particle
radius), (c) change in surface area of reaction with time (d) the rate of dissolution as function of time.
Complete dissolution of 0.474µm and 3.06µm lasted for four months in this model relative simulation 1. The
initial surface area, 5400cm3 changes by 500 cm
3 in 20 days for this simulation and in 5 days difference for
simulation 1. The initial rate, 2.85*10-10
mol.s-1
declines to 1.58*10-10
mol.s-1 in 5 months. The rate of
dissolution looks slow in this case.
4.3.3 Simulation 3
In this simulation specific rate constant, 2.61*10-10
mol.m-2
.s-1
was used to model the dissolution rate
of basaltic glass for one year at 250C and pH of 8.

38 Dawit KZ
Figure 31. Basaltic glass dissolution rate simulation for one year at 250C and pH of 8; (a) dissolving fractions of
individual particle groups as function of time, (b distribution of fractions of particle with respect to their particle
radius), (c) change in surface area of reaction with time (d) the rate of dissolution as function of time.
In this model, fractions of particle sizes 1.204 µm to 1.919µm retained longer, less fractions of particle
groups size 3.06µm to 19.76µm were dissolved in a year (Fig. 31a & c) relative to simulation 1 that
has the same pH. Moreover, the specific surface area changes by 250cm3 that is 10 times less than
2400cm3 the change for simulation 1 in 30 days. Hence, the rate of dissolution is low as result of less
dissolved surface are due to effect of low temperature. The removal of the fine particles reduced the
surface area from 5400cm3 to 3000cm
3 in a year. Subsequently, the dissolution rate looks steady at 7.8
* 10-11
mol.s-1
.
4.4 Mat lab simulation results of Synthetic Material (SB)
To estimate optimum possible particles size range that could digest fast and provide nutrients due to
extended time, synthetic material of size ranges 0.390µm to 12.4µm were considered for one month
and a year. The temperature, pH and rate constant were similar to model one of both hand crushed and
micronized samples.
4.4.1 Model 1SB
Table 4.5. Grain size data and differential volume percent used in the simulation of the synthetic
sample.
Grain diameter(µm) 0,39 0,575 0,843 1,504 2,019 4,106 5,878 7,776 12,4
Diif. Vol% 2,01 4,95 5,2 7,09 8,38 9,2 10,01 14,03 2,17
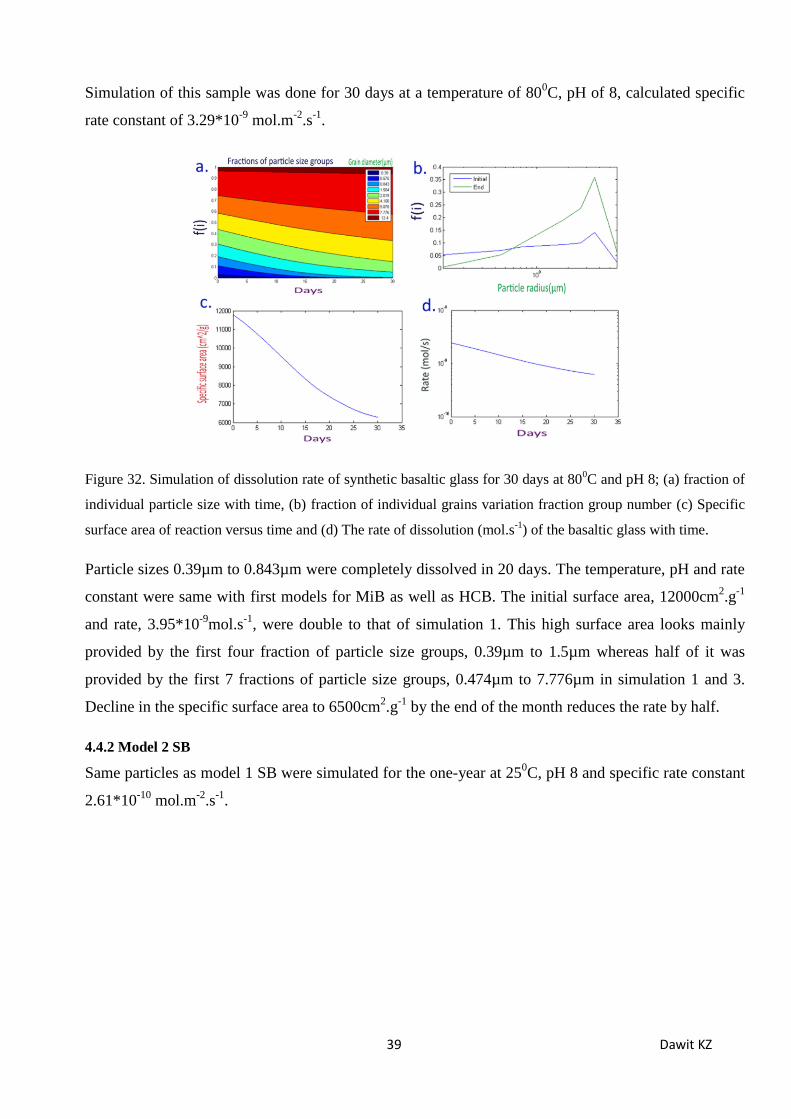
39 Dawit KZ
Simulation of this sample was done for 30 days at a temperature of 800C, pH of 8, calculated specific
rate constant of 3.29*10-9
mol.m-2
.s-1
.
Figure 32. Simulation of dissolution rate of synthetic basaltic glass for 30 days at 800C and pH 8; (a) fraction of
individual particle size with time, (b) fraction of individual grains variation fraction group number (c) Specific
surface area of reaction versus time and (d) The rate of dissolution (mol.s-1
) of the basaltic glass with time.
Particle sizes 0.39µm to 0.843µm were completely dissolved in 20 days. The temperature, pH and rate
constant were same with first models for MiB as well as HCB. The initial surface area, 12000cm2.g
-1
and rate, 3.95*10-9
mol.s-1
, were double to that of simulation 1. This high surface area looks mainly
provided by the first four fraction of particle size groups, 0.39µm to 1.5µm whereas half of it was
provided by the first 7 fractions of particle size groups, 0.474µm to 7.776µm in simulation 1 and 3.
Decline in the specific surface area to 6500cm2.g
-1 by the end of the month reduces the rate by half.
4.4.2 Model 2 SB
Same particles as model 1 SB were simulated for the one-year at 250C, pH 8 and specific rate constant
2.61*10-10
mol.m-2
.s-1
.
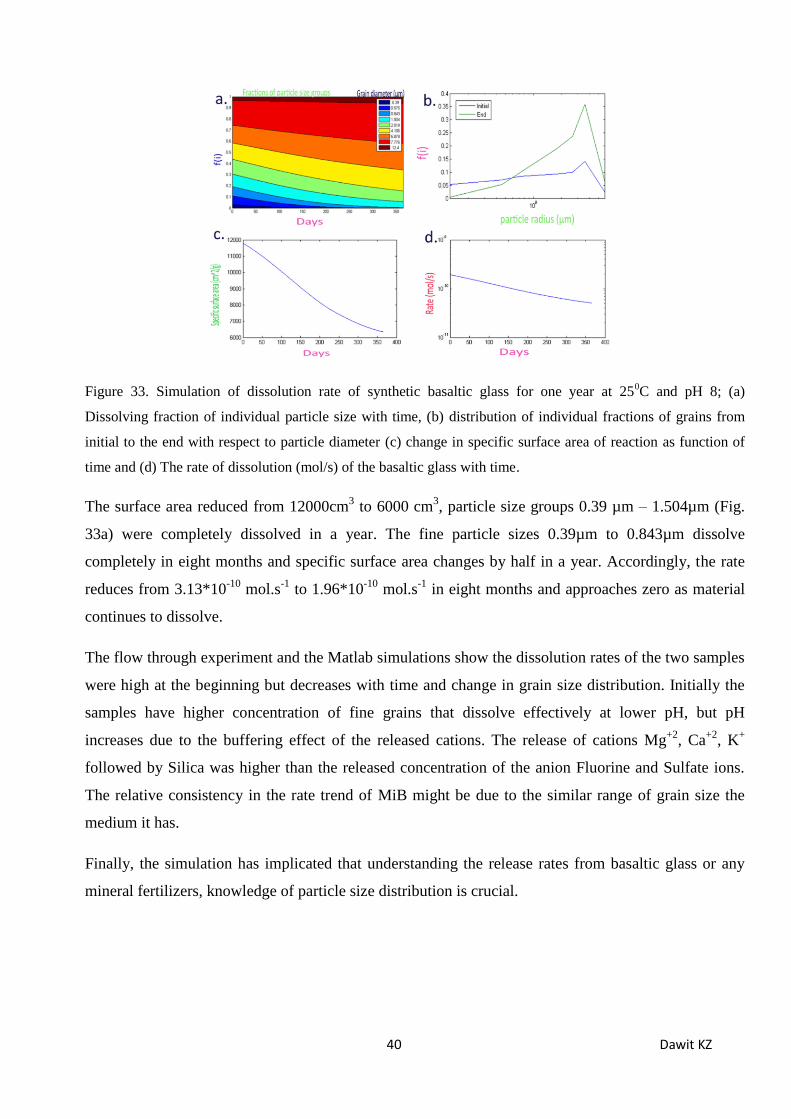
40 Dawit KZ
Figure 33. Simulation of dissolution rate of synthetic basaltic glass for one year at 250C and pH 8; (a)
Dissolving fraction of individual particle size with time, (b) distribution of individual fractions of grains from
initial to the end with respect to particle diameter (c) change in specific surface area of reaction as function of
time and (d) The rate of dissolution (mol/s) of the basaltic glass with time.
The surface area reduced from 12000cm3 to 6000 cm
3, particle size groups 0.39 µm – 1.504µm (Fig.
33a) were completely dissolved in a year. The fine particle sizes 0.39µm to 0.843µm dissolve
completely in eight months and specific surface area changes by half in a year. Accordingly, the rate
reduces from 3.13*10-10
mol.s-1
to 1.96*10-10
mol.s-1
in eight months and approaches zero as material
continues to dissolve.
The flow through experiment and the Matlab simulations show the dissolution rates of the two samples
were high at the beginning but decreases with time and change in grain size distribution. Initially the
samples have higher concentration of fine grains that dissolve effectively at lower pH, but pH
increases due to the buffering effect of the released cations. The release of cations Mg+2
, Ca+2
, K+
followed by Silica was higher than the released concentration of the anion Fluorine and Sulfate ions.
The relative consistency in the rate trend of MiB might be due to the similar range of grain size the
medium it has.
Finally, the simulation has implicated that understanding the release rates from basaltic glass or any
mineral fertilizers, knowledge of particle size distribution is crucial.

41 Dawit KZ
4.5 RESULT PART TWO
The concentration evolution of the plant nutrient (PO43-
& K+), cations and Silica as a function of time are
plotted in figure 34 and 35. Inference from the plots showed that there is reasonable high release of silica
in the beginning of the reaction. Breaking of the silica network allowed phosphate and other ions to be
released in to the solution as the concentration increases with time while silica is decreasing.
Figure 34. Change in concentration of Silica (a) and phosphate ion (b) as function of time after treating the basaltic glass
with acids (given in the legend) at 90 0C and pH 0. The release rate of the phosphate ion and silica has negative correlation.
PO4 3-
is better released relatively for the treatment with sulfuric acid.
Figure 35. Change in concentration of cations Na+ (a), K
+ (b), Mg
2+ (c) and Ca
2+ (d) with time after treating the basaltic
glass with acids (shown in the legend) at 90 0C and pH 0. The release of the cations increases with time as a result of
detaching the Si-bond after treating the glass with the acid. Sharp drop in concentration of Ca2+
was detected from the
basalt treated with sulfuric acid (d) that will explain by SEM analysis below.
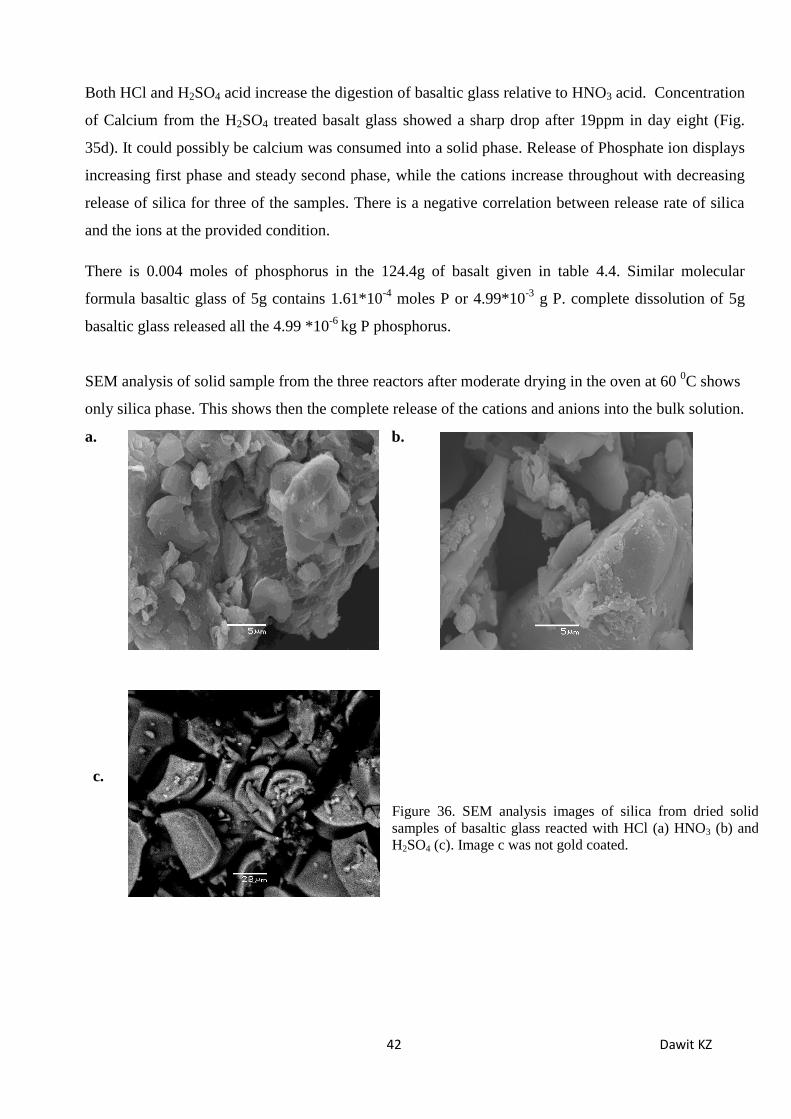
42 Dawit KZ
Both HCl and H2SO4 acid increase the digestion of basaltic glass relative to HNO3 acid. Concentration
of Calcium from the H2SO4 treated basalt glass showed a sharp drop after 19ppm in day eight (Fig.
35d). It could possibly be calcium was consumed into a solid phase. Release of Phosphate ion displays
increasing first phase and steady second phase, while the cations increase throughout with decreasing
release of silica for three of the samples. There is a negative correlation between release rate of silica
and the ions at the provided condition.
There is 0.004 moles of phosphorus in the 124.4g of basalt given in table 4.4. Similar molecular
formula basaltic glass of 5g contains 1.61*10-4
moles P or 4.99*10-3
g P. complete dissolution of 5g
basaltic glass released all the 4.99 *10-6
kg P phosphorus.
SEM analysis of solid sample from the three reactors after moderate drying in the oven at 60 0C shows
only silica phase. This shows then the complete release of the cations and anions into the bulk solution.
a. b.
c.
Figure 36. SEM analysis images of silica from dried solid
samples of basaltic glass reacted with HCl (a) HNO3 (b) and
H2SO4 (c). Image c was not gold coated.

43 Dawit KZ
The Basalt treated with sulfuric acid though show formation of calcium sulphate mineral in the last
days of the reaction. This could confirm the sharp decline in Ca2+
. The absence of other cations and
anions in the solid sample could be a proof for their presence in the bulk solution samples.
SEM analysis shows calcium sulphate mineral was formed from the basaltic glass reacted with sulfuric
acid. The sulfate ion was likely to be from the sulfuric acid used.
Figure 38. Calcium sulphate precipitated from the dissolved calcium and available sulfur (from sulfuric acid).
Concentration of Ca2+
declined at the 8th day due to formation of this mineral.
Figure 37. Illustrates random selection of grains for elemental analysis which Silicon and Oxygen are
the constituents as the table of element statistics (%) at the right shows. This endorses the residual solid
particles were pure silica and the other elements are in the liquid solutions.

44 Dawit KZ
XRD analysis of the solid samples showed crystalline minerals of gypsum and pure silica at 900C and
pH 0. Moreover, the SEM (Fig. 36) as well as XRD (Fig. 39) has showed the treatment of basaltic
glass with these acids separated the silica from Aluminum, Iron, Other cations and anions.
Figure 39. Illustrates contrast between XRD analysis spectrums of (a) unreacted basaltic glass (b) pre-treated
with H2SO4 (c) pre-treated with HNO3 and (d) pre-treated with HCl. The unreacted basaltic glass was described
in Figure 7 that forsterite and quartz comprises 15% and the rest 85% was glass. The comparison reveals the
formation of gypsum from the H2SO4 treated basaltic glass (Fig. 39b) and pure amorphous silica (described as
background in b, c &d) after pre-treating the glass with the acids.
All the phosphorus in the basaltic glass was released to the aqueous solution and the possibility of
precipitating as mineral fertilizer was modeled using Phreeqc. The simulation defines the possibility to
precipitate the phosphate ion as Hydro- and Fluor-apatite. In addition, Brucite was also other mineral
that has super saturated with the step wise increase moles of NaOH (Fig. 40).
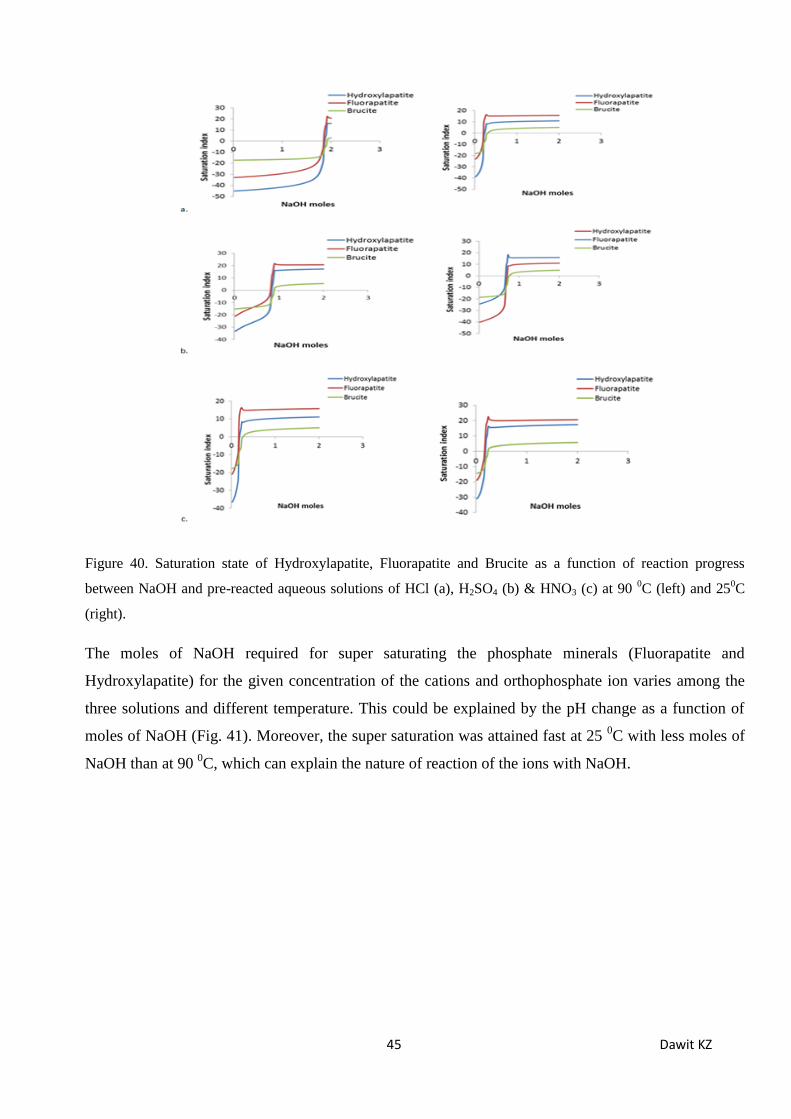
45 Dawit KZ
Figure 40. Saturation state of Hydroxylapatite, Fluorapatite and Brucite as a function of reaction progress
between NaOH and pre-reacted aqueous solutions of HCl (a), H2SO4 (b) & HNO3 (c) at 90 0C (left) and 25
0C
(right).
The moles of NaOH required for super saturating the phosphate minerals (Fluorapatite and
Hydroxylapatite) for the given concentration of the cations and orthophosphate ion varies among the
three solutions and different temperature. This could be explained by the pH change as a function of
moles of NaOH (Fig. 41). Moreover, the super saturation was attained fast at 25 0C with less moles of
NaOH than at 90 0C, which can explain the nature of reaction of the ions with NaOH.

46 Dawit KZ
Figure 41. Change in pH as function of reaction progress between pre-reacted aqueous solution of HCl, H2SO4
and HNO3 at 900C (a), 25
0C (b). The change in pH for the aqueous solution of HNO3 and HCl was similar at 25
0C but different at 90
0C with increase in moles of NaOH.
The pH showed positive response to the increase in the NaOH and pH conditions that enable the super-
saturating of the above mineral phases were reached.

47 Dawit KZ
5 DISCUSSIONS
5.1 DISCUSSION PART ONE
The pH dependency is known and since the dissolution leads to higher pH, rate increases in a soil with
acidic pH and stabilizes with the pH buffering to neutral. Digestion of the monovalent and divalent
cations from the surface of the basaltic glass at 800C and neutral condition depicts the high dissolution
first phase. The pH measurement for the initial liquid samples lowers to 6.2. Steady state dissolution
was attained after the second day of the reaction start and it looks the dissolution was independent of
pH at the measured circum-neutral pH. Slight buffering effect was shown where the pH rise to 7.8 –
8.4 and dissolution of ions such as Ca, Na and Si responded to the change. Moreover, the release of
mineral Ca, Mg and K in to the soil could alter the soil acidity. This was found to agree with (Heim et
al., 2012) where they state the presence of these minerals increase the quality of the plant growth.
The flow through experiment and the Matlab simulations expresses the dissolution rates of the two
samples decrease as function of time. The interpretation indicates the timely declining surface area
mainly controlled the dissolution reaction and the longer the time of reaction enables utilization of the
surface area of the large particles. Moreover, the simulation on the synthetic sample describes the
dissolution is a relative selection of available particle sizes. Hence, there is no clear demarcation to
determine optimum size range but it approves the finer the particles the higher will be the initial rates.
Therefore, the early digestion of the finer particles modifies the size distribution, available surface area
and kinetics of the reaction. Moreover, the effect of time was significant in this modeling as the one-
year simulation for both samples has showed.
Relatively BMI has consistently decreasing rate compared to HCB, which could likely due to the
larger range in grain size distribution of HCB. The relative high rate of micronized sample revealed the
higher surface area enhanced the dissolution of basaltic glass. Similar observation has been also made
by (Gislason and Oelkers, 2003). The change in rate of dissolution modeled for three of the samples
are negative as described by eq. (2.3).
Ranges of temperatures as well as pH were used for the Matlab modeling. The dissolution of basaltic
glass shows low temperature dependency at pH 4 and high temperature dependency at pH 8. This is
also in good agreement with the findings of (Helgeson et al., 1984) who noted pH independency at
higher temperature and (Gudbrandsson et al., 2008) identify the high dependency of glass in
temperature at alkaline pH.

48 Dawit KZ
The main objective was to quantify how much phosphorus (in the form of Orthophosphates) could be
obtained from the dissolution of basaltic glass. Accordingly, complete dissolution of 10 g will release
3.2*10-4
moles P (9.96*10-3
g) phosphorus as well as 6.43*10-4
moles (0.02g) K at 800C and pH 7.
Orthophosphates are the form of phosphate species that are edible by plants. The orthophosphate that
can be formed from the dissolution of basaltic glass depends on the pH value. Hence, the term
orthophosphate in this case stands for either HPO4-2
, H2PO4- or PO4
-3. The contrast between dissolution
rate of basaltic glass as function of pH (Fig 16) with species abundance given in figure 6 depicts
H2PO4- and HPO4
2- are the dominant P species in the pH zones (pH 3 – 5 and 7 -10) respectively.
Nevertheless, the dissolution of basalt glass at the circum-neutral pH zone was low though the
proportionally occurrence of two species (H2PO4- and HPO4
2-) could be important for plants.
For this study recommended concentration of plant nutrients for wheat described as 23-28kg P (Ross
H., 2013) 28kg P and 140 kg K (Pathak et al., 2010) were considered as standard concentrations to
determine the amount of basaltic glass. Amount of basaltic glass required per hectare per year was
computed at 10 0C pH 4 using e.q 3.3 (details Appendix II), and were found 121,481.2 kg and
240,632.2 kg basalt per hectare per year for P and K respectively. Nitrate is the third plant nutrient
specie but calculating the concentration of nitrate was ignored due to its negligible occurs in basaltic
glass.
We see that the masses of basaltic glass required obtaining the standard amount of P and K are way too
large. Moreover, for the hand crushed sample that has lower rate would be higher than these vales.
Hence, two reasons could be described why direct use of basaltic glass is infeasible. First, the rate of
dissolution of basaltic glass at neutral pH was too low.
Secondary, the actual pH in the agricultural fields is likely acidic that reduce the effect of low (relative
to experiment temperature) actual temperature. In addition, the time considered was short to provide
solid assessment of the possibility of development of secondary minerals at the surface of particles and
sorption of phosphorus to developed clay mineral or hydroxides. Consequently, Basaltic glass can´t be
used directly as source of fertilizer because of;
The rate of P release is too low to deliver the required amount of P.
The application of high mass of basaltic glass might cause accumulation of fluorine that lead to
fluorine related environmental problems, and
There might develop secondary minerals through time, which in turn could cause sorption
effect and reduce the release of P.

49 Dawit KZ
Therefore, basaltic glass is not feasible to be applied directly as source of inorganic P fertilizer. But
this result made us desperate to question the possibility of separating the nutrients and silica in the
glass. Hence, pre-treating the glass with different acid types was conducted as second experiment to
detach the plant nutrients and silica. Discussion follows.
5.2 DISCUSSION PART TWO
The plot of silica and phosphate indicates negative correlation (Fig. 37) because SiO2 formed
amorphous silica but phosphate was released completely. It can be also observed from Fig. 38 that the
breaking of the Si-bonding has set the elements free as the cations concentration regularly increases
with time. Hence, the more breakage of silica bonding would facilitate the release of cations and
phosphate in to the solution. The decrease in the silica concentration with time looks due to SiO2
formed amorphous silica whereas the other elements were released in to the solution (Fig. 36a-c). The
concentration of the Ca2+
declined after the 8th
day for the treatment with sulfuric acid since the
formation of gpsum was consuming the element (Fig. 39). This could reasonably explain the drop in
the calcium concentration (figure 37d).
The EDS and XRD analysis of the solid sample reveals only pure silica structure and no Aluminum,
implying Al could be released in to the bulk solution. This describes the complete release of phosphate
and cations were dependent on the breakage silica structure. This goes in harmony with the
explanation given by Guys and Scott, 1989 as well as Oelkers and Gislason, 2001. They showed that
basaltic glass dissolution rate is proportional to the partially detached tetrahedral of silica. Separation
of Silica and Aluminum reduces the possibility of formation of secondary clay minerals and the
possible sorption of phosphorus. Therefore, this might then increase the amount of phosphorus
released in to the bulk solution. The high initial silica release could be related to the fast dissolution
property of basaltic glass in the strongly acidic medium and slowed down as the pH was buffered due
to increased release of the cations (figures 34 & 35) as well as due to amorphous SiO2 formation (Fig.
36). Similar observation was made in the work of (Gudbrandsson et al., 2011) where they noticed slow
silica release from basaltic glass at higher temperature (750C) and alkaline pH. The treatment of
basaltic glass with NaOH initially increased the release of silica but the main problem was the
formation of Smectite.
The simulation using phreeqc showed that precipitation of the released phosphate ion likely in the
form of Fluroapatite and Hydroapatite. The difference in the moles of NaOH consumed among the
three solutions for the super saturated solutions depend on the reaction nature of the ions with respect
to the pH change (Fig. 42). Moreover, at higher temperature more ions are released to the solution and

50 Dawit KZ
it is likely to form salts as well as ions that can act as weak acid. This might cause high moles of
NaOH to be consumed to neutralize the pH as the reaction progresses (Fig. 41a-c left).
The solution being super saturated with Brucite, Mg (OH) 2, was also observed according to the
geochemical modeling code phreeqc. This might increase the possibility of using basaltic glass as a
fertilizer. High amount of basaltic glass is required as a source of phosphate fertilizer; hence
considerable amount of Brucite might be formed. Brucite is identified as commercial flame-retardant
and ore mineral for Mg due to its high Mg content. Moreover, advantageous of not releasing CO2 in to
the atmosphere (Simandl et al., 2007). We strongly believe that using basaltic glass in an environment
friendly ways will boost its feasibility.
Super saturation of P in the forum of Fluorapatite could reduce the anthropogenic influence of soil
environment in reference to the description given by (Loganthan eta al., 2008). They identify that the
fluorine associated with Ca5 (PO4)3F to be miner. This restrained the concern arose by EHS guidelines
in 2007.
The complete release of phosphate was encouraging achievement and confirms possibility of basaltic
glass as fertilizer source rock. But the cost of pretreatment may be high. Furthermore, the high amount
of silica as a secondary product might be seen as environmental concern and cost exploiting in this
case. Nevertheless, recently silica has attracted industrial demand. It is being used for many
commercial purposes such as chips, optical fibers and telescope glasses. In addition, due to its
mechanical resistance, high electrical strength and selectivity, amorphous silica was used as
semiconductor in micro-electrons and chromatography (www.ks.uiuc.edu/Research/silica). The
possibility to commercialize the amorphous silica and brucite could rather generate means of
reimbursing the costs of processing the basaltic glass in to potential fertilizer. Moreover, this could
also likely provide the fertilizer in cheap price and enable resource management.

51 Dawit KZ
6. CHAPTER SIX
6.1 CONCLUSION
Basaltic glass dissolution rate might be influenced by a number of factors such as pH change
throughout the reaction, aqueous transport of species from the surface of the grains, temperature and
the far from equilibrium conditions. The main objective of this study was to evaluate the feasibility of
basaltic glass as potential source rock for phosphorus fertilizer. Experimental conditions were chosen
to ensure that the rate is far from equilibrium and surface reaction controlled. The first experiment
reveals the natural glass dissolution rate was so slow to deliver the required standard phosphorus
concentration. As a result the basaltic glass doesn’t look feasible to be used as source rock for
phosphorus fertilizer directly may be due to one of the following reasons.
The rate of P release was too low to supply the required amount of P by the plants.
The application of high mass of basaltic glass might cause accumulation of fluorine that lead to
fluorine related environmental problems.
Therefore, depending on this flow through result, it looks basaltic glass cannot be used directly as
inorganic source of P fertilizer.
The second experimental result revealed the complete release of phosphate and makeover of pure
amorphous silica. It showed the breaking of the Al-Si network setting free the essential nutrients in the
glass for plant growth. This experimental result clearly showed that silica structure network in the
basaltic glass influences the dissolution rate of basaltic glass and hence the release rate of P. This could
be why release of P in the first experiment was low. Provided the basaltic glass is pretreated it could
furnish the whole amount of P and could possibly be precipitated in the form of Hydro-and/or Fluor-
apatite to be used as fertilizer. Hence, basaltic glass might be feasible inorganic source rock for
fertilizer after treated with acids. But the cost of pretreatment might be high. If the byproducts such as
amorphous silica and brucite have the possibility to be commercialized, they could probably create an
alternative solution to cover the costs associated to the processing of pretreatment of basaltic glass.
This could perhaps provide the fertilizer in cheap price and enable feasibility of basaltic glass as source
for fertilizer.
As a possible alternative, mining the resource for the purpose of silica production and separating the
plant nutrients for fertilization could also be a way to use the resource as source of P fertilizer. In this
case the other released elements, such as Si and Mg, are foreseen to be the main product of the acid

52 Dawit KZ
treatment with possible commercial purposes and the plant nutrients as by product would be used for
fertilizer.
6.2 RECOMMENDATION
The experiments were conducted for a very short period of time and relatively at higher temperatures
compared to the soil environment. Therefore we recommend longer time experiments at a soil
temperature condition because this could provide essential data on the natural dissolution of the
basaltic glass as well as about the possibility of formation of secondary mineral phases from the direct
use and acid treatment.
Moreover, further experimental study on the possibility of crystallizing the silica would be done to
explore the multipurpose utilization of basaltic glass. Last but not least, studying the basaltic glass
dissolution rate in the presence of the actual soil environment could also be advisable as soil types may
affect the dissolution rate of basaltic glass and hence affect the potential of basaltic glass a source
fertilizer.

53 Dawit KZ
REFERENCES
Aulakh, M. S., Kabba, B. S., Baddesha, H. S., Bahl, G. S., and Gill, M. P. S., 2003, Crop yields and phosphorus fertilizer transformations after 25 years of applications to a subtropical soil under groundnut-based cropping systems: Field Crops Research, v. 83, no. 3, p. 283-296.
Berger, G., Schott, J., and Guy, C., 1988, Behavior of Li, Rb and Cs during basalt glass and olivine dissolution and chlorite, smectite and zeolite precipitation from seawater: Experimental investigations and modelization between 50° and 300°C: Chemical Geology, v. 71, no. 4, p. 297-312.
Berger, G., Schott, J., and Loubet, M., 1987, Fundamental processes controlling the first stage of alteration of a basalt glass by seawater: an experimental study between 200 and 320 C: Earth and Planetary Science Letters, v. 84, no. 4, p. 431-445.
Brunet, F., and Chazot, G., 2001, Partitioning of phosphorus between olivine, clinopyroxene and silicate glass in a spinel lherzolite xenolith from Yemen: Chemical Geology, v. 176, no. 1–4, p. 51-72.
Chen, G. C., He, Z. L., Stoffella, P. J., Yang, X. E., Yu, S., and Calvert, D., 2006, Use of dolomite phosphate rock (DPR) fertilizers to reduce phosphorus leaching from sandy soil: Environmental Pollution, v. 139, no. 1, p. 176-182.
Cooper, J., Lombardi, R., Boardman, D., and Carliell-Marquet, C., 2011, The future distribution and production of global phosphate rock reserves: Resources, Conservation and Recycling, v. 57, no. 0, p. 78-86.
Cordell, D., Drangert, J.-O., and White, S., 2009, The story of phosphorus: Global food security and food for thought: Global Environmental Change, v. 19, no. 2, p. 292-305.
Dawson, C. J., and Hilton, J., 2011, Fertiliser availability in a resource-limited world: Production and recycling of nitrogen and phosphorus: Food Policy, v. 36, Supplement 1, no. 0, p. S14-S22.
Devau, N., Cadre, E. L., Hinsinger, P., Jaillard, B., and Gérard, F., 2009, Soil pH controls the environmental availability of phosphorus: Experimental and mechanistic modelling approaches: Applied Geochemistry, v. 24, no. 11, p. 2163-2174.
EHS, 2007, Environmental, Health and Safety Guidelines for Phosphate Fertilizer Manufacturing: IFC, p. 20.
Gilbert, N., 2009, The disappearing nature: nature v. 461, p. 3.
Gislason, S. R., and Oelkers, E. H., 2003, Mechanism, rates, and consequences of basaltic glass dissolution: II. An experimental study of the dissolution rates of basaltic glass as a function of pH and temperature: Geochimica et Cosmochimica Acta, v. 67, no. 20, p. 3817-3832.
Gudbrandsson, S., Wolff-Boenisch, D., Gislason, S., and Oelkers, E., 2008, Dissolution rates of crystalline basalt at pH 4 and 10 and 25–75 C: Mineralogical Magazine, v. 72, no. 1, p. 155-158.
Gudbrandsson, S., Wolff-Boenisch, D., Gislason, S. R., and Oelkers, E. H., 2011, An experimental study of crystalline basalt dissolution from 2 ⩽ pH ⩽ 11 and temperatures from 5 to 75 °C: Geochimica et Cosmochimica Acta, v. 75, no. 19, p. 5496-5509.
Gustafsson, J. P., Mwamila, L. B., and Kergoat, K., 2012, The pH dependence of phosphate sorption and desorption in Swedish agricultural soils: Geoderma, v. 189, p. 304-311.

54 Dawit KZ
Guy, C., and Schott, J., 1989, Multisite surface reaction versus transport control during the hydrolysis of a complex oxide: Chemical Geology, v. 78, no. 3–4, p. 181-204.
Hanrahan, G., Salmassi, T. M., Khachikian, C. S., and Foster, K. L., 2005, Reduced inorganic phosphorus in the natural environment: significance, speciation and determination: Talanta, v. 66, no. 2, p. 435-444.
Harley, A., and Gilkes, R., 2000, Factors influencing the release of plant nutrient elements from silicate rock powders: a geochemical overview: Nutrient Cycling in Agroecosystems, v. 56, no. 1, p. 11-36.
Heffer, P., and Prud'homme, M., 2012, Fertilizer outlook in 2012-2016: International Fertilizer Association (IFA), v. A/12/69, p. 7.
Heffer, P., and Prud’homme, M., Fertilizer Outlook 2010-2014, in Proceedings 78th IFA Annual Conference, Paris2010.
Heim, M., Hillersøy, M. H., Bleken, M. A., Gautneb, H., and Gjengedal, E. L., 2012, APATITE–BIOTITE–CARBONATITE (STJERNØY, N-NORWAY) – POTENTIAL AND OBSTACLES REGARDING A MULTINUTRIENT ROCK-FERTILIZER: International Congress for Applied Mineralogy (ICAM), p. 8.
Helgeson, H. C., Murphy, W. M., and Aagaard, P., 1984, Thermodynamic and kinetic constraints on reaction rates among minerals and aqueous solutions. II. Rate constants, effective surface area, and the hydrolysis of feldspar: Geochimica et Cosmochimica Acta, v. 48, no. 12, p. 2405-2432.
Hendrix, J. L., 2012, Sustainable Agricultural Practices Impact on Phosphate rock production: Procedia Engineering, v. 46, no. 0, p. 54-61.
Loganathan, P., and Hedley, M. J., 1997, Downward movement of cadmium and phosphorus from phosphatic fertilisers in a pasture soil in New Zealand: Environmental Pollution, v. 95, no. 3, p. 319-324.
Loganathan, P., Hedley, M. J., and Grace, N. D., 2008, Pasture soils contaminated with fertilizer-derived cadmium and fluorine: livestock effects, Reviews of environmental contamination and toxicology, Springer, p. 29-66.
Loganathan, P., Hedley, M. J., Wallace, G. C., and Roberts, A. H. C., 2001, Fluoride accumulation in pasture forages and soils following long-term applications of phosphorus fertilisers: Environmental Pollution, v. 115, no. 2, p. 275-282.
Manoharan, V., Loganathan, P., Tillman, R. W., and Parfitt, R. L., 2007, Interactive effects of soil acidity and fluoride on soil solution aluminium chemistry and barley (Hordeum vulgare L.) root growth: Environmental Pollution, v. 145, no. 3, p. 778-786.
McDowell, R. W., Monaghan, R. M., and Carey, P. L., 2003, Potential phosphorus losses in overland flow from
pastoral soils receiving long‐term applications of either superphosphate or reactive phosphate rock: New Zealand Journal of Agricultural Research, v. 46, no. 4, p. 329-337.
Mezghani, I., Elloumi, N., Abdallah, F. B., Chaieb, M., and Boukhris, M., 2005, Fluoride accumulation by vegetation in the vicinity of a phosphate fertilizer plant in Tunisia: Fluoride, v. 38, no. 1, p. 18-24.
Morgan, N. A., and Spera, F. J., 2001, Glass transition, structural relaxation, and theories of viscosity: a molecular dynamics study of amorphous CaAl< sub> 2</sub> Si< sub> 2</sub> O< sub> 8</sub>: Geochimica et Cosmochimica Acta, v. 65, no. 21, p. 4019-4041.

55 Dawit KZ
Nesbitt, H., and Young, G., 1984, Prediction of some weathering trends of plutonic and volcanic rocks based on thermodynamic and kinetic considerations: Geochimica et Cosmochimica Acta, v. 48, no. 7, p. 1523-1534.
Oelkers, E. H., and Gislason, S. R., 2001, The mechanism, rates and consequences of basaltic glass dissolution: I. An experimental study of the dissolution rates of basaltic glass as a function of aqueous Al, Si and oxalic acid concentration at 25°C and pH = 3 and 11: Geochimica et Cosmochimica Acta, v. 65, no. 21, p. 3671-3681.
Pathak, H., Mohanty, S., Jain, N., and Bhatia, A., 2010, Nitrogen, phosphorus, and potassium budgets in Indian agriculture: Nutrient Cycling in Agroecosystems, v. 86, no. 3, p. 287-299.
Pickering, H. W., Menzies, N. W., and Hunter, M. N., 2002, Zeolite/rock phosphate—a novel slow release phosphorus fertiliser for potted plant production: Scientia Horticulturae, v. 94, no. 3–4, p. 333-343.
Ross H., M., Allan Middleton, 2013, Phosphorus Fertilizer Application in Crop Production: Alberta Agriculture and Rural Development, Research and Innovation Division, Agriculture Centre, Lethbridge, p. 1-12.
Rowe Jr, G. L., and Brantley, S. L., 1993, Estimation of the dissolution rates of andesitic glass, plagioclase and pyroxene in a flank aquifer of Poas Volcano, Costa Rica: Chemical Geology, v. 105, no. 1, p. 71-87.
Ryan, J., Ibrikci, H., Delgado, A., Torrent, J., Sommer, R., and Rashid, A., 2012, Chapter three - Significance of Phosphorus for Agriculture and the Environment in the West Asia and North Africa Region, in Donald, L. S., ed., Advances in Agronomy, Volume Volume 114, Academic Press, p. 91-153.
Sheldon, R. P., 1982, Phosphate Rock: SCIENTIFIC AMERICAN, v. 246, p. 7.
Simandl, G. J., Paradis, S., and Irvine, M., 2007, Brucite-industrial mineral with a future: Geoscience Canada, v. 34, no. 2.
Smith, I. E. M., Ward, G. K., and Ambrose, W. R., 1978, Geographic Distribution and the Characterization of Volcanic Glasses in Oceania: Oceania Publications, University of Sydney collaborating with JSTOR, v. 12, p. 30.
Smith, J. V., 1981, Halogen and phophorus storage in the earth: Nature, v. 289, p. 762-764.
Stockmann, G. J., Wolff-Boenisch, D., Gislason, S. R., and Oelkers, E. H., 2011, Do carbonate precipitates affect dissolution kinetics? 1: Basaltic glass: Chemical Geology, v. 284, no. 3–4, p. 306-316.
Suh, S., and Yee, S., 2011, Phosphorus use-efficiency of agriculture and food system in the US: Chemosphere, v. 84, no. 6, p. 806-813.
Takahashi, S., and Anwar, M. R., 2007, Wheat grain yield, phosphorus uptake and soil phosphorus fraction after 23 years of annual fertilizer application to an Andosol: Field Crops Research, v. 101, no. 2, p. 160-171.
White, A. F., and Brantley, S. L., 2003, The effect of time on the weathering of silicate minerals: why do weathering rates differ in the laboratory and field?: Chemical Geology, v. 202, no. 3–4, p. 479-506.
Wolff-Boenisch, D., Gislason, S. R., and Oelkers, E. H., 2004a, The effect of fluoride on the dissolution rates of natural glasses at pH 4 and 25°C: Geochimica et Cosmochimica Acta, v. 68, no. 22, p. 4571-4582.

56 Dawit KZ
Wolff-Boenisch, D., Gislason, S. R., Oelkers, E. H., and Putnis, C. V., 2004b, The dissolution rates of natural glasses as a function of their composition at pH 4 and 10.6, and temperatures from 25 to 74°C: Geochimica et Cosmochimica Acta, v. 68, no. 23, p. 4843-4858.
Yang, Y., He, Z., Yang, X., Fan, J., Stoffella, P., and Brittain, C., 2012, Dolomite Phosphate Rock–Based Slow-Release Fertilizer for Agriculture and Landscapes: Communications in Soil Science and Plant Analysis, v. 43, no. 9, p. 1344-1362.
http://www.geoforskning.no/index.php?option=com_content&view=article&id=495:mineralavfall-
kan-redusere-klimagassutslipp&catid=23:co2&Itemid=218 (accessed 13 august, 2013)
http://www.fertilizer.org/ifa/HomePage/Statistics/Production-and-trade (accessed 01 November, 2013)
http://www.ks.uiuc.edu/Research/silica ( accessed on 03 january, 2014)

57 Dawit KZ
APPENDIX I: Results and procedures used for the flow through experiment
A. Sampling chart and particle size measurement
Table 1 data chart for the mixed flow through performed at 80 0C and neutral pH
Day One
Reservoir Sample name Bottle Wt. (g) Total Wt. (g) Solution Wt. (g) Sampling start time Total time(min) Rate (g/min) Date
R4 BDK 10 29,5 19,5 17:00 10 1,95 26-03-13
R5 BMI 10,1 28,8 18,7 17:02 10 1,87 26-03-13
Day Two
R4 BDK 10 29,5 19,5 09:16 10 1,95 27-03-13
R5 BMI 9,9 28,2 18,3 10:16 10 1,83 27-03-13
R4 BDK 10,1 28,8 18,7 11:16 10 1,87 27-03-13
R5 BMI 10 29,6 19,6 12:16 10 1,96 27-03-13
R4 BDK 9,9 28,9 19 17:07 10 1,9 27-03-13
R5 BMI 10 28,5 18,5 17:09 10 1,85 27-03-13
Day Three
R4 BDK 10 28,6 18,6 09:29 10 1,86 28- 03-13
R5 BMI 10 29,6 19,6 09:26 10 1,96 28- 03-13
R4 BDK 10 29,9 19,9 13:35 10 1,99 28- 03-13
R5 BMI 10 27,8 17,8 13:37 10 1,78 28- 03-13
R4 BDK 10 29,1 19,1 17:05 10 1,91 28- 03-13
R5 BMI 10 30,4 20,4 17:07 10 2,04 28- 03-13

58 Dawit KZ
Day Four
R4 BDK 10 29,5 19,5 09:23 10 1,95 29-03-13
R5 BMI 10,1 27,3 17,2 09:20 10 1,72 29-03-13
R4 BDK 10 28,4 18,4 13:15 10 1,84 29-03-13
R5 BMI 10 29,5 19,5 13:17 10 1,95 29-03-13

59 Dawit KZ
B. CALCULATING THE RATE TO ESTIMATE THE FLOW RATE FOR THE MIXED
FLOW EXPERIMENT
………………………………………………………….. 1
r is rate (mol.cm-2
.s.-1
), k rate constant (mol.cm-2
.s.-1
) , aH+ activity of hydrogen ion and n is slope of the rate
graph
………………………………………...2
The value of (i=1, 2 & 3) can be calculated according to Arrhenius equation. Hence;
(
) ………………………………………………………….3
is specific rate constant at 250C. From eq. 3
, and
are equal to their respective . Hence, at
250C eq. 2 would be;
………………………………………….. 4
To calculate at pH= 0 we consider
is zero. Therefore;
………………………………………………………………. 5
The same procedure was done to calculate and
. After this ,
and are calculated based on
equation 3.
n1, n2 and n3 are the slopes of the graph drown at 250C for the log r and pH. They are calculated according
to general formula
.
………………………………………………………………………. 6
n2 and n3 were calculated likewise and Calculation results are given in Table 3 -8 with respect to their
temperature and sample name.

60 Dawit KZ
Table 3. Calculated rate of dissolution (mol/cm2/s) at 25
0C for sample HCB based on equation 3.2
Table 4. calculated rate of dissolution (mol/cm2/s) at 25
0C for sample MiB based on equation 3.2
pH K1T'*aH+n K2T*aH+
n K3T*aH+
n r (mol/cm
2/s) Log r s(m
2/g
)
0 1,00E-17 1,00E-15 5,01E-10 5,01E-10 -9,3 0,51
1 3,55E-17 1,00E-15 3,98E-11 3,98E-11 -10 0,51
2 1,26E-16 1,00E-15 3,16E-12 3,16E-12 -12 0,51
3 4,47E-16 1,00E-15 2,51E-13 2,53E-13 -13 0,51
4 1,58E-15 1,00E-15 2,00E-14 2,25E-14 -14 0,51
5 5,62E-15 1,00E-15 1,58E-15 8,21E-15 -14 0,51
6 2,00E-14 1,00E-15 1,26E-16 2,11E-14 -14 0,51
7 7,08E-14 1,00E-15 1,00E-17 7,18E-14 -13 0,51
8 2,51E-13 1,00E-15 7,94E-19 2,62E-13 -13 0,51
9 8,91E-13 1,00E-15 6,31E-20 8,92E-13 -12 0,51
10 3,16E-12 1,00E-15 5,01E-21 3,16E-12 -12 0,51
Table 5: rate of reaction (mol/s) calculated at 500C for sample HCB based on equation 3.2
pH K1T'*aH+n K2T*aH+
n K3T*aH+
n r (mol/cm
2/s) Log r s(m
2/g
)
0 1,00E-17 1,00E-15 5,01E-10 5,01E-10 -9,3 0,16
1 3,55E-17 1,00E-15 3,98E-11 3,98E-11 -10,4 0,16
2 1,26E-16 1,00E-15 3,16E-12 3,16E-12 -11,5 0,16
3 4,47E-16 1,00E-15 2,51E-13 2,53E-13 -12,6 0,16
4 1,58E-15 1,00E-15 2,00E-14 2,25E-14 -13,65 0,16
5 5,62E-15 1,00E-15 1,58E-15 8,21E-15 -14,09 0,16
6 2,00E-14 1,00E-15 1,26E-16 2,11E-14 -13,68 0,16
7 7,08E-14 1,00E-15 1,00E-17 7,18E-14 -13,14 0,16
8 2,61E-13 1,00E-15 7,94E-19 2,62E-13 -12,6 0,16
9 8,91E-13 1,00E-15 6,31E-20 8,92E-13 -12,05 0,16
10 3,16E-12 1,00E-15 5,01E-21 3,16E-12 -11,5 0,16
pH K1T'*aH+n K2T*aH+
n K3T*aH+
n r (mol/cm
2/s) Log r s(m
2/g
)
0 1,39E-09 2,78E-15 3,50E-18 1,39E-09 -8,86 0,16
1 1,10E-10 2,78E-15 1,24E-17 1,10E-10 -9,96 0,16
2 8,77E-12 2,78E-15 4,40E-17 8,77E-12 -11,06 0,16
3 6,96E-13 2,78E-15 1,56E-16 6,99E-13 -12,16 0,16
4 5,54E-14 2,78E-15 5,54E-16 5,87E-14 -13,23 0,16
5 4,40E-15 2,78E-15 1,97E-15 9,14E-15 -14,04 0,16
6 3,49E-16 2,78E-15 6,98E-15 1,01E-14 -14,00 0,16
7 2,77E-17 2,78E-15 2,47E-14 2,76E-14 -13,56 0,16
8 2,20E-18 2,78E-15 4,99E-14 5,27E-14 -13,28 0,16
9 1,75E-19 2,78E-15 3,12E-13 3,15E-13 -12,50 0,16
10 1,39E-20 2,78E-15 1,11E-12 1,11E-12 -11,95 0,16

61 Dawit KZ
Table 6. Rate of reaction (mol/s) calculated at 500C for sample MiB based on eq. (2.1)
pH K1T'*aH+n K2T*aH+
n K3T*aH+
n r (mol/cm
2/s) Log r s(m
2/g
)
0 1,39E-09 2,78E-15 3,50E-18 1,39E-09 -8,86 0,16
1 1,10E-10 2,78E-15 1,24E-17 1,10E-10 -9,96 0,16
2 8,77E-12 2,78E-15 4,40E-17 8,77E-12 -11,06 0,16
3 6,96E-13 2,78E-15 1,56E-16 6,99E-13 -12,16 0,16
4 5,54E-14 2,78E-15 5,54E-16 5,87E-14 -13,23 0,16
5 4,40E-15 2,78E-15 1,97E-15 9,14E-15 -14,04 0,16
6 3,49E-16 2,78E-15 6,98E-15 1,01E-14 -14,00 0,16
7 2,77E-17 2,78E-15 2,47E-14 2,76E-14 -13,56 0,16
8 2,20E-18 2,78E-15 4,99E-14 5,27E-14 -13,28 0,16
9 1,75E-19 2,78E-15 3,12E-13 3,15E-13 -12,50 0,16
10 1,39E-20 2,78E-15 1,11E-12 1,11E-12 -11,95 0,16
Table 7: rate of reaction (mol/s) calculated at 750C for sample HCB based on eq. (2.1)
Table 8: rate of reaction (mol/s) calculated at 750C for sample MiB based on eq. (2.1)
pH K1T'*aH+n K2T*aH+
n K3T*aH+
n r (mol/cm
2/s) Log r s(m
2/g
)
0 8,40E-18 6,68E-15 3,35E-09 3,35E-09 -8,475 0,16
1 2,98E-17 6,68E-15 2,66E-10 2,66E-10 -9,5751 0,16
2 1,06E-16 6,68E-15 2,11E-11 2,11E-11 -10,675 0,16
3 3,75E-16 6,68E-15 1,68E-12 1,69E-12 -11,773 0,16
4 1,33E-15 6,68E-15 1,33E-13 1,41E-13 -12,85 0,16
5 4,72E-15 6,68E-15 1,06E-14 2,20E-14 -13,658 0,16
6 1,68E-14 6,68E-15 8,41E-16 2,43E-14 -13,615 0,16
7 5,95E-14 6,68E-15 6,68E-17 6,62E-14 -13,179 0,16
8 3,12E-13 6,68E-15 5,32E-18 3,18E-13 -12,497 0,16
9 7,49E-13 6,68E-15 4,22E-19 7,55E-13 -12,122 0,16
10 2,66E-12 6,68E-15 3,35E-20 2,66E-12 -11,575 0,16
pH K1T'*aH+n K2T*aH+
n K3T*aH+
n r (mol/cm
2/s) Log r s(m
2/g
)
0 8,40E-18 6,68E-15 3,35E-09 3,35E-09 -8,475 0,51
1 2,98E-17 6,68E-15 2,66E-10 2,66E-10 -9,5751 0,51
2 1,06E-16 6,68E-15 2,11E-11 2,11E-11 -10,676 0,51
3 3,75E-16 6,68E-15 1,68E-12 1,69E-12 -11,773 0,51
4 1,33E-15 6,68E-15 1,33E-13 1,41E-13 -12,851 0,51
5 4,72E-15 6,68E-15 1,06E-14 2,20E-14 -13,658 0,51
6 1,68E-14 6,68E-15 8,41E-16 2,43E-14 -13,614 0,51
7 5,95E-14 6,68E-15 6,68E-17 6,62E-14 -13,179 0,51
8 3,12E-13 6,68E-15 5,31E-18 3,18E-13 -12,497 0,51
9 7,49E-13 6,68E-15 4,21E-19 7,56E-13 -12,122 0,51
10 2,66E-12 6,68E-15 3,35E-20 2,67E-12 -11,574 0,51

62 Dawit KZ
C. CALCULATING THE GEOMETRIC SURFACE AREA
………………………………………. (1)
The number (Nr.) of particles was calculated for 1g of basaltic glass material.
…………. (2)
Assuming each grain is spherical, the surface area and volume of Particles was calculated based
on their radius obtained from the grain size analysis.
……………………………..……………. (3)
…………………………... (4)
The volume of fraction was determined from the volume of the basalt and Differential volume of
the particles. The differential volume was obtained from the LS-PSA. Hence, a basalt density of
2.9g/cm3 was used to calculate the Volume of 1g basalt. The Volume of basalt (total volume) was
calculated by;
……………………………. (5)
Then,
)……….. (6)
Since the specific surface area (s) of reaction is expressed in terms of the radius and density of the
particles, placing together eq. 1, 2, 3, and 4 can give us the geometric specific surface area of
reaction of the particles in each sample.
∑
………………………….. (7)
Where are fraction of volume per gram of basaltic glass, fraction of individuals,
density and radius of grains respectively.

63 Dawit KZ
Table 9. Specific surface area (m2/g), Nr. of grains/gram and Volume fraction (cm
3) of each particle size calculated according to the formulas
given in equation 7 above, sample MiB. All grains are assumed to be sphere
Similarly, the geometrical surface area for the hand crushed sample was found 0.16 m2 per gram.
d(µm) r(cm) Diff. Vol% SAP(4πr2) Vol part.(4/3πr3) Vbasalt(1g/ρ) Vol. fraction Nr.particles/g SA fract.(m2/g)
0,474 2,37E-05 1,60 7,10E-09 5,56E-14 0,34 0,01 9,92E+10 0,07
0,755 3,78E-05 3,95 1,80E-08 2,25E-13 0,34 0,01 6,06E+10 0,11
1,204 6,02E-05 5,09 4,60E-08 9,11E-13 0,34 0,02 1,93E+10 0,09
1,919 9,60E-05 5,58 1,20E-07 3,69E-12 0,34 0,02 5,22E+09 0,06
3,06 1,53E-04 7,00 2,90E-07 1,50E-11 0,34 0,02 1,61E+09 0,05
4,878 2,44E-04 10,10 7,50E-07 6,06E-11 0,34 0,03 5,75E+08 0,04
7,776 3,89E-04 14,30 1,90E-06 2,45E-10 0,34 0,05 2,01E+08 0,04
12,4 6,20E-04 18,70 4,80E-06 9,95E-10 0,34 0,06 6,48E+07 0,03
19,76 9,88E-04 19,50 1,20E-05 4,03E-09 0,34 0,07 1,67E+07 0,02
31,51 1,58E-03 10,50 3,10E-05 1,63E-08 0,34 0,04 2,22E+06 0,01
50,23 2,51E-03 1,96 7,90E-05 6,62E-08 0,34 0,01 1,02E+05 0,00
80,07 4,00E-03 0,92 2,00E-04 2,68E-07 0,34 0,00 1,18E+04 0,00
127,7 6,39E-03 0,57 5,10E-04 1,09E-06 0,34 0,00 1,81E+03 0,00
203,3 1,02E-02 0,09 1,30E-03 4,39E-06 0,34 0,00 6,68E+01 0,00
Total 0,52
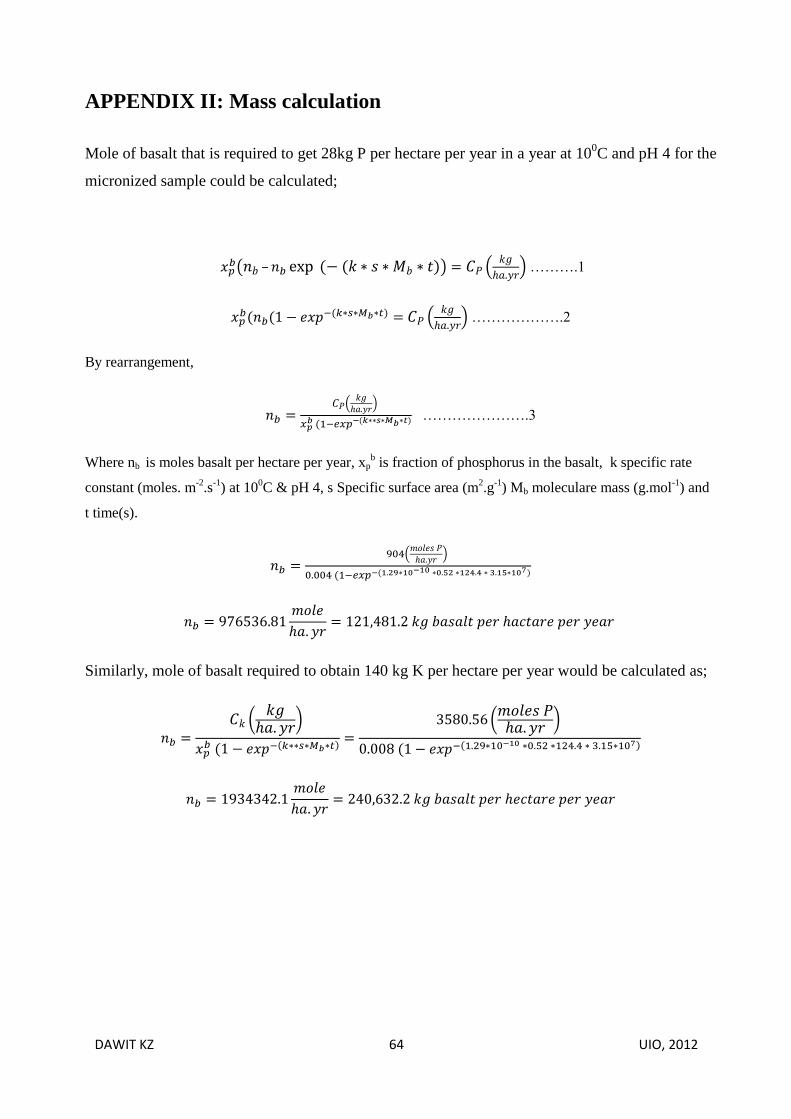
DAWIT KZ 64 UIO, 2012
APPENDIX II: Mass calculation
Mole of basalt that is required to get 28kg P per hectare per year in a year at 100C and pH 4 for the
micronized sample could be calculated;
( – ) (
) ……….1
(
) ……………….2
By rearrangement,
(
)
………………….3
Where nb is moles basalt per hectare per year, xpb is fraction of phosphorus in the basalt, k specific rate
constant (moles. m-2
.s-1
) at 100C & pH 4, s Specific surface area (m
2.g
-1) Mb moleculare mass (g.mol
-1) and
t time(s).
(
)
Similarly, mole of basalt required to obtain 140 kg K per hectare per year would be calculated as;
(
)
(
)
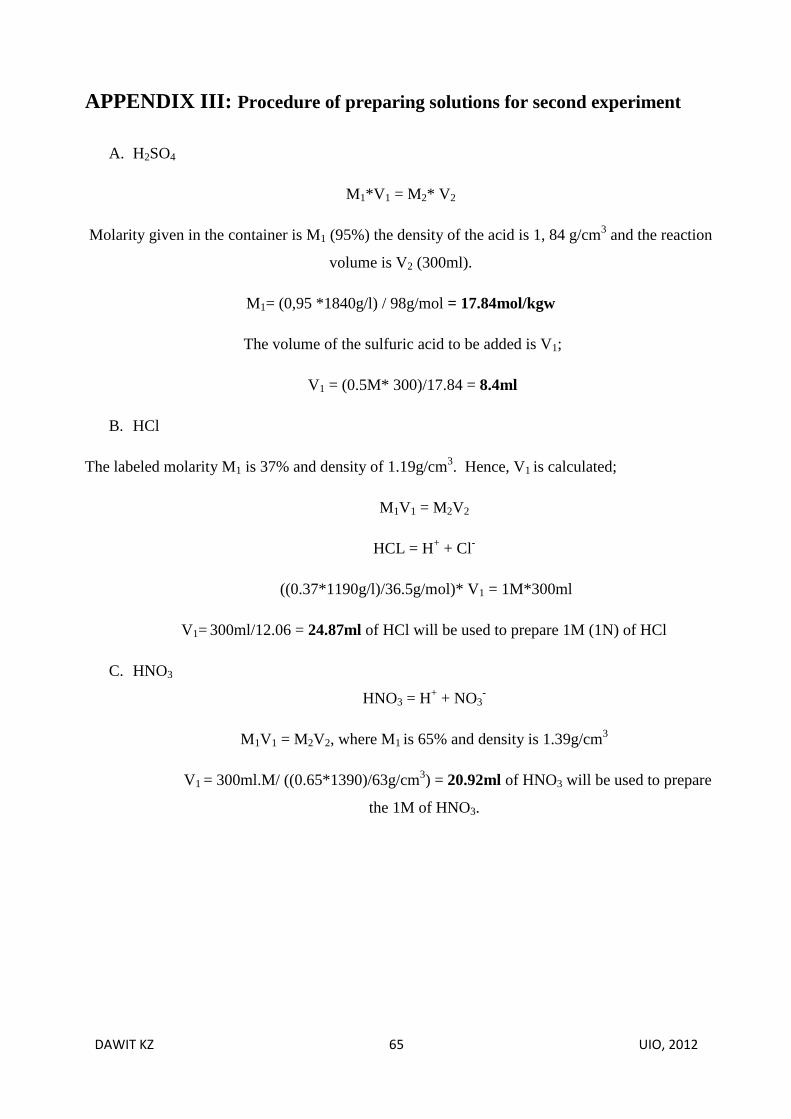
DAWIT KZ 65 UIO, 2012
APPENDIX III: Procedure of preparing solutions for second experiment
A. H2SO4
M1*V1 = M2* V2
Molarity given in the container is M1 (95%) the density of the acid is 1, 84 g/cm3 and the reaction
volume is V2 (300ml).
M1= (0,95 *1840g/l) / 98g/mol = 17.84mol/kgw
The volume of the sulfuric acid to be added is V1;
V1 = (0.5M* 300)/17.84 = 8.4ml
B. HCl
The labeled molarity M1 is 37% and density of 1.19g/cm3. Hence, V1 is calculated;
M1V1 = M2V2
HCL = H+ + Cl
-
((0.37*1190g/l)/36.5g/mol)* V1 = 1M*300ml
V1= 300ml/12.06 = 24.87ml of HCl will be used to prepare 1M (1N) of HCl
C. HNO3
HNO3 = H+ + NO3
-
M1V1 = M2V2, where M1 is 65% and density is 1.39g/cm3
V1 = 300ml.M/ ((0.65*1390)/63g/cm3) = 20.92ml of HNO3 will be used to prepare
the 1M of HNO3.
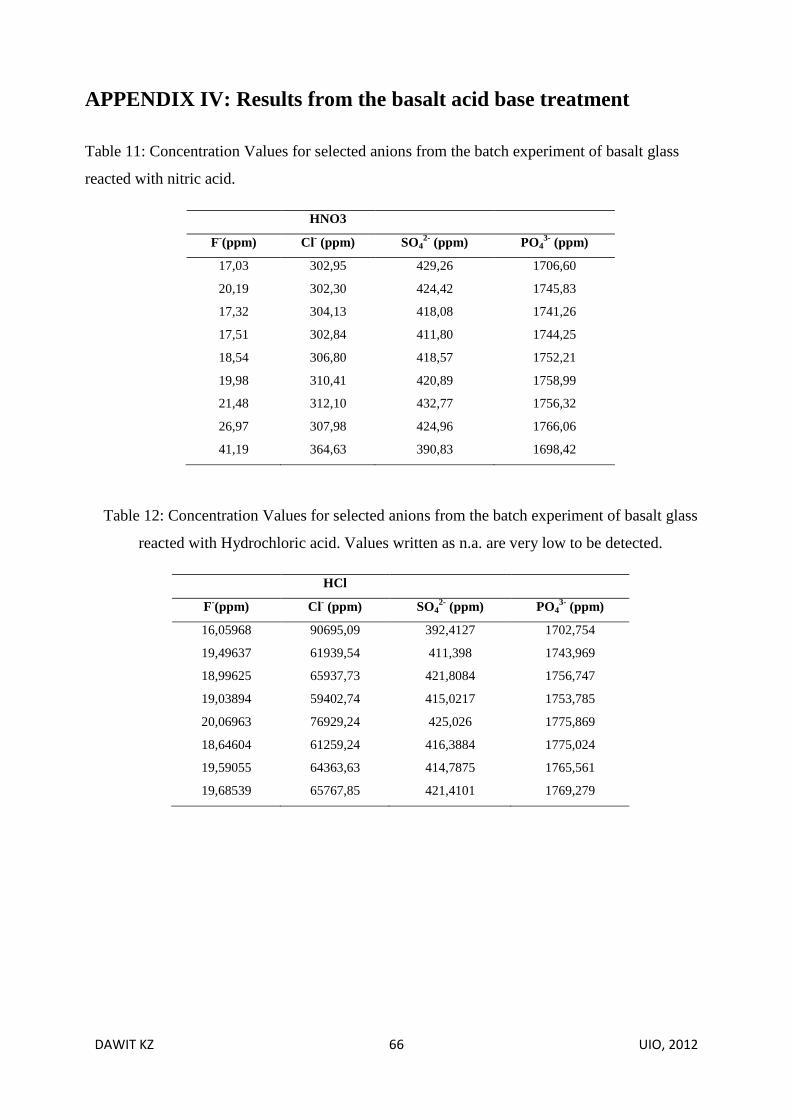
DAWIT KZ 66 UIO, 2012
APPENDIX IV: Results from the basalt acid base treatment
Table 11: Concentration Values for selected anions from the batch experiment of basalt glass
reacted with nitric acid.
HNO3
F-(ppm) Cl
- (ppm) SO4
2- (ppm) PO4
3- (ppm)
17,03 302,95 429,26 1706,60
20,19 302,30 424,42 1745,83
17,32 304,13 418,08 1741,26
17,51 302,84 411,80 1744,25
18,54 306,80 418,57 1752,21
19,98 310,41 420,89 1758,99
21,48 312,10 432,77 1756,32
26,97 307,98 424,96 1766,06
41,19 364,63 390,83 1698,42
Table 12: Concentration Values for selected anions from the batch experiment of basalt glass
reacted with Hydrochloric acid. Values written as n.a. are very low to be detected.
HCl
F-(ppm) Cl
- (ppm) SO4
2- (ppm) PO4
3- (ppm)
16,05968 90695,09 392,4127 1702,754
19,49637 61939,54 411,398 1743,969
18,99625 65937,73 421,8084 1756,747
19,03894 59402,74 415,0217 1753,785
20,06963 76929,24 425,026 1775,869
18,64604 61259,24 416,3884 1775,024
19,59055 64363,63 414,7875 1765,561
19,68539 65767,85 421,4101 1769,279

DAWIT KZ 67 UIO, 2012
Table 13: Concentration Values for selected anions from the batch experiment of basalt glass
reacted with Sulfuric acid. Values written as n.a. are very low to be detected.
H2SO4
F-(ppm) Cl
- (ppm) SO4
2- (ppm) PO4
3- (ppm)
15,49201 303,714 116477,5 1663,518
19,41337 309,148 60869,92 1667,921
19,97416 302,1785 65611,38 n.a
19,41972 304,4354 61571,62 1711,188
19,49205 302,3125 60872,06 1707,551
20,2984 306,6387 70759,33 1718,63
20,26321 308,7862 68708,73 1710,36
20,68124 304,3348 71790,48 1722,998

DAWIT KZ 68 UIO, 2012
APPENDIX V: Phreeqc Simulation data block
a. b.
Input data block that define the Simulation reaction of the aqueous solution from H2SO4 with NaOH at
25(a) and 90 0C (b)
a. b.
b. Input data block that define the Simulation reaction of the aqueous solution from HCl with NaOH
at 25(a) and 90 0C (b)

DAWIT KZ 69 UIO, 2012
a. b.
Input data block that define the Simulation reaction of the aqueous solution from HNO3 with NaOH
at 25(a) and 90 0C (b)