preliminaryseismicvu lnerability assessment of … · preliminaryseismicvu lnerability assessment...
TRANSCRIPT

© 2010 Macmillan Publishers Ltd. 1742–8262 Journal of Building Appraisal Vol. 5, 4, 357–368
www.palgrave-Journals.com/jba/
Original Article
Preliminary seismic vulnerability assessment of Mussoorie Town, Uttarakhand (India) Received (in revised form): 22 nd February 2010
Girish Chandra Joshi is Senior Executive at the Disaster Mitigation and Management Centre, Department of Disaster Management ,
Dehradun, India. He received his Bachelor of Technology from G.B. Pant University of Agriculture & Technology, India,
and Master of Technology and PhD from Indian Institute of Technology Roorkee, India. His research interests include
seismic microzonation, seismic evaluation and retrofi tting of RC structures and seismic risk assessment.
Ratnesh Kumar is Fellow B / Research Scholar at the Department of Earthquake Engineering, Indian Institute of Technology Roorkee,
India. He received his Bachelor of Engineering from Bangalore University, India, and Master of Technology from
Indian Institute of Technology Roorkee, India. His research interests include modeling of reinforced concrete
structures, performance-based design, and seismic vulnerability and risk assessment.
Correspondence: Ratnesh Kumar , Department of Earthquake Engineering, Indian Institute of Technology Roorkee, Roorkee 247 667,
Uttarakhand, India
ABSTRACT Rapid visual screening (RVS) can be effectively used to evaluate the vulnerability of a large number of buildings with less computational effort. In this study, a seismic vulnerability assessment is conducted for all municipal wards in Mussoorie town, Uttarakhand, India. Various structural parameters of the building, like structure type, number of stories, soil type, age and roof type and non-structural parameters like occupancy, use and owner name have been collected. Further, seismic vulnerability of every individual building in the town has been assessed. The data collection form of the Federal Emergency Management Agency, FEMA 154 for RVS was modifi ed to suit local conditions and was utilized for this purpose. Using satellite image all of the buildings are mapped in a GIS and a damage probability matrix is used to estimate the effects of an earthquake. The buildings are classifi ed in fi ve categories of seismic vulnerability. The data of Mussoorie town show that a total of 623 buildings (about 20 per cent of those surveyed) show a high probability of Grade 5 damage and a very high probability of Grade 4 damage, whereas 587 buildings (about 19 per cent of those surveyed) show a high probability of Grade 4 damage and a very high probability of Grade 3 damage in case of earthquake shaking of Intensity VIII or more in MSK scale. Journal of Building Appraisal (2010) 5, 357 – 368. doi: 10.1057/jba.2010.7
Keywords: earthquake ; rapid visual screening (RVS) ; vulnerability ; risk ; FEMA
INTRODUCTION Himalaya has evolved because of the convergence and eventual collision of the Indian and Eurasian plates and the ongoing tectonism is responsible for the high seismic hazard and vulnerability of the State of Uttarakhand. In the past, the North Indian

© 2010 Macmillan Publishers Ltd. 1742–8262 Journal of Building Appraisal Vol. 5, 4, 357–368358
Joshi and Kumar
region has been jolted by four Great Earthquakes (magnitude > 8.0 on the Richter Scale): 1897 Shillong Earthquake, 1905 Kangara Earthquake, 1934 Bihar-Nepal Earthquake and 1950 Assam earthquake ( Thakur, 2006 ). Uttarakhand is located entirely in the seismic gap of the 1934 Bihar-Nepal earthquake and the 1905 Kangara earthquake, and is categorized under zones IV and V as per IS: 1893 – 2002 . This region has been identifi ed as a potential site for a future catastrophic earthquake ( Bilham et al , 2001 ; Fedl and Bilham, 2006 ) and has already witnessed seismic events of lesser magnitude (Uttarkashi earthquake, 1999 and Chamoli earthquake, 1991) in the recent past. These earthquakes have demonstrated that the seismic vulnerability of the building stocks in the region was primarily responsible for a large number of human casualties. Most of the buildings in the region are non-engineered and awareness and knowledge among the masses is lacking regarding earthquake-resistant construction techniques in areas of high seismic vulnerability. Inadequate building bye laws and lenient regulatory regimes only add to the problems. There is a need to assess the vulnerability of building stocks in such a seismically active area.
Vulnerability can be briefl y defi ned as ‘ being prone to or susceptible to damage or injury ’ ( Blaikie et al , 1994 ). To determine vulnerability, a long chain of causes or factors can be analysed, and among them, natural, technological, social and political are the salient factors. The assessment of vulnerability to estimate the seismic risk requires particular information on each one of the factors and elements at risk. All items, like geologic evolution, urban development, strength of structures and possible collateral effects, have to be considered carefully to assess as accurately as possible the seismic vulnerability of a site. Seismic vulnerability can be measured either qualitatively or quantitatively ( Dowrick, 2003 ). The qualitative measure of assessment can be carried out by classifi cation of damages to various types of constructions using different earthquake intensity scales (MMI or MSK). Another way of making qualitative measures of vulnerability is in terms of damage states ( Dowrick, 1998 ).
STUDY AREA The hill station of Mussoorie (30 ° 27 ’ N / 78 ° 06 ’ E) was discovered by the military offi cer Captain Young in 1826 and was set up as a sanatorium and retreat for the British to fl ee the heat of the plains during the hot summer months. Many boarding schools were established in and around Mussoorie. Edwin T. Atkinson writes in 1886 that ‘ the population is entirely non-agricultural, chiefl y visitors, servants, shop-keepers, and carriers ’ and it has not changed a lot since then. Mussoorie is a tourist destination. The British made way to honeymooners and weekenders mainly from Dehradun and Delhi, and also from further away. Most of Mussoorie population is concentrated at ‘ Kulri Bazaar ’ and ‘ the Library ’ at either end of the long Mall Road. The 2001 census gives a population of 26 069 for Mussoorie. But because of massive tourism, the actual number of people staying in Mussoorie varies a lot. During the peak season, from April / May to September / October, thousands of visitors come to Mussoorie.
The study area covers all 11 wards of Mussoorie. Mussoorie is located in the district of Dehradun, Uttarakhand, and is situated on a Himalayan mountain range running from east to west, parallel to the Shiwaliks, at an average altitude of 2005.5 m above sea level. On account of the continuous convergence of the two continental plates (Indian and Eurasian plates), the Himalaya is one of the most seismically active regions in the world. Many active faults exist along the Himalaya collision zone; particularly famous are the Main Boundary Thrust fault (MBT) and the Main Central Thrust fault (MCT). In the last 100 years or so, four great earthquakes have occurred in 1897, 1905, 1934 and 1950

Preliminary seismic vulnerability assessment of Mussoorie Town, Uttarakhand (India)
© 2010 Macmillan Publishers Ltd. 1742–8262 Journal of Building Appraisal Vol. 5, 4, 357–368 359
along the Himalayan plate boundary. In the recent past Uttarkashi (1991) and Chamoli (1999) earthquakes and in particular the October 2005 Muzaffarabad, Kashmir, earthquake enhanced the consciousness about the increasing risk that the growing population in Himalayas and its vicinity is confronted with.
The focal depths of most of the earthquakes in the Himalaya lie between 12 and 18( ± 4) km below the earth ’ s surface ( Molnar, 1990 ). The focal depths of the majority of microearthquakes and moderate earthquakes, occurring in the Garhwal Himalaya, are confi ned to shallow depths up to 20 km ( Baranowski et al , 1984 ; Ni and Barazangi, 1984 ; Gaur et al , 1985 ; Khattri et al , 1989 ; Kumar et al , 1997 ). The reported focal depth of Uttarkashi earthquake of 20 October 1991, which occurred near the MCT, is 19 km and the more recently occurring Chamoli earthquake of 29 March 1999 is around 15 km ( USGS, 1999 ). The region has witnessed many moderate to large size earthquakes ( Figure 1 ).
Mussoorie town lies in the outer lesser Garhwal Himalaya. The MBT, the west-east running tectonic features that divide the Himalaya into several north dipping thrust sheets, just passes the township of Mussoorie ( Bhatia et al , 2007 ). Also, as per the seismic zoning map of India from IS: 1893 – 2002, Mussoorie is located in seismic zone IV. This stands for a high seismic hazard, where the maximum damage during an earthquake may be up to MSK Intensity VIII.
METHODOLOGY TO ASSESS SEISMIC VULNERABILITY There is an urgent need to assess the seismic vulnerability of buildings in Mussoorie town because of its importance as tourist destination and varying rate of occupancy in different seasons of the year. Detailed seismic vulnerability evaluation is a technically complex and expensive procedure and can only be performed on a limited number of buildings.
Figure 1: Map showing epicenters of earthquakes in Uttarakhand.

© 2010 Macmillan Publishers Ltd. 1742–8262 Journal of Building Appraisal Vol. 5, 4, 357–368360
Joshi and Kumar
It is, therefore, very important to use simpler procedures that can help to rapidly evaluate the vulnerability profi le of different types of buildings, so that the more complex evaluation procedures can be limited to the most critical buildings ( Sinha and Goyal, 2004 ).
A procedure for rapid visual screening (RVS) was fi rst proposed in the United States in 1988, and was further modifi ed in 2002 to incorporate latest technological advancements and lessons from the earthquake disasters in the 1990s. Even though RVS procedures were originally developed for typical constructions in the United States, they have been widely used in many other countries after suitable modifi cations. The most important feature of this procedure is that it permits vulnerability assessment based on a walk-around of the building by a trained evaluator. The evaluation procedure and system is compatible with GIS-based city database, and also permits use of the collected building information for a variety of other planning and mitigation purposes.
The RVS method is designed to be implemented without performing any structural calculations. The procedure utilizes a scoring system that requires the evaluator to identify (1) the primary structural lateral load-resisting system and (2) building attributes that modify the seismic performance expected for this lateral load-resisting system. The inspection, data collection and decision-making process typically occurs at the building site, and is expected to take around 30 min for each building. For the actual data collection a modifi ed version of the FEMA-154 and ATC-21 -based data collection form for RVS for potential seismic vulnerability has been used ( Figure 2 ).
As Mussoorie is located in zone IV of the seismic zoning map of India, the standard RVS form for ‘ seismic zones IV and V ’ by Sinha and Goyal (2004) has been taken. The form was then modifi ed to match the conditions in Mussoorie. The high number of tourists makes it necessary to distinguish between peak and low occupancy of the buildings. Because of the relief, a broad estimation of the slope in three categories ( < 15 ° ; 15 ° – 30 ° ; > 30 ° ) is included. Also parameters like ID, ward number, owner name, roof type, accessibility and a comment section are added for a broader information spectrum and to make parts of the analysis, easier to perform.
The data collection form has a clear structure and is easy to fi ll in while surveying the buildings in the fi eld. After a basic training the surveyor can complete the form just by ‘ screening ’ the building from the outside, although entering the building can help to identify the building type when in doubt. This is at least true if basic pre-fi eld data are available, like the owner name or the age of the building. In this case study there are no pre-fi eld data available and these parameters are to be inquired in the fi eld. Ground data are collected for each building in the study area. For this purpose maps for the different wards have been prepared. These maps show the satellite image, ward boundaries and roads as orientation. In the fi eld each building has been identifi ed and marked with a unique ID on the map. The same ID is marked on the data collection form to relate the attribute data to the spatial information. The digitization of all buildings of Mussoorie for all 11 wards has been carried out in ArcGIS 9.1. The use of ArcGIS 9.1 facilitates different kinds of query operations during the analysis of data.
CLASSIFICATION OF BUILDINGS IN RVS PROCEDURE A wide variety of construction types and building materials are used in urban areas of India. These include local materials such as mud and straw, semi-engineered materials such as burnt brick and stone masonry and engineered materials such as concrete and steel. The seismic vulnerability of the different building types depends on the choice of building materials. The building vulnerability is generally highest with the use of local

Preliminary seismic vulnerability assessment of Mussoorie Town, Uttarakhand (India)
© 2010 Macmillan Publishers Ltd. 1742–8262 Journal of Building Appraisal Vol. 5, 4, 357–368 361
materials without engineering inputs and lowest with the use of engineered material with engineering inputs. The building stock of Mussoorie town has been classifi ed into nine categories, out of which three building types are under unreinforced brick / stone masonry, and others are wood, steel (two building types) and concrete (three building types). The descriptions of different building types are as: (1) URM 1 type of buildings are unreinforced burnt brick or stone masonry but reinforced with RCC or seismic bands either horizontally, vertically or both in few cases, (2) URM 2 type of buildings are unreinforced burnt brick or stone masonry with cement mortar without any special seismic safety provisions, (3) URM 3 type of buildings are unreinforced burnt brick or stone masonry with cement mortar or lime mortar and distressed without any special seismic safety provisions and normal loading safety measures, (4) wood buildings mostly
Figure 2: Rapid visual screening (RVS) for potential seismic vulnerability.

© 2010 Macmillan Publishers Ltd. 1742–8262 Journal of Building Appraisal Vol. 5, 4, 357–368362
Joshi and Kumar
made by seasoned wood having fl oor and roof framing consisting of wood joists or rafters on wood studs, (5) S1 types of buildings consist of a steel frame with fl oor and roof framing consisting of cast-in-place concrete slabs or metal deck with concrete fi ll supported on steel beams, open web joists or steel trusses, (6) S2 buildings are pre-engineered and prefabricated with transverse rigid steel frames with roof and walls consisting of lightweight metal, fi berglass or cementitious panels, (7) C1 types of buildings consist of a moment resistant frame assembly of cast-in-place concrete beams and columns, (8) C2 building types are same as C1 types but have shear walls to resist the lateral loads of the building, (9) C3 types of buildings are an older type of building construction that consists of a frame assembly of cast-in-place concrete beams and columns where infi ll walls are constructed of solid clay brick, concrete block or hollow clay tile masonry.
GRADE OF DAMAGEABILITY The likely damage to structures has been categorized in different grades depending on their impact on the seismic strength of the building. The different damage levels that have been recommended by European Macroseismic Scale (EMS-98) are used to describe as: Grade 1 for Negligible to slight damage (No structural damage, slight non-structural damage), Grade 2 for Moderate damage (Slight structural damage, moderate non-structural damage), Grade 3 for Substantial to heavy damage (moderate structural damage, heavy non-structural damage), Grade 4 for Very heavy damage (heavy structural damage, very heavy non-structural damage) and Grade 5 for Destruction (very heavy structural damage).
Table 1 ( Sinha and Goyal, 2004 ) provides guidance regarding likely performance of the building in the event of design-level earthquake. Table 1 can also be used to make a decision for the necessity of any further evaluation using more sophisticated procedures. Further, in the case of ordinary buildings where more detailed evaluation is not feasible, it can be used to identify the necessity for retrofi tting. Generally, score S < 0.7 indicates high vulnerability and entail further evaluation and retrofi tting of the building.
RESULT AND DISCUSSIONS When particular damage intensity occurs, different building types experience different levels of damage depending on their inherent characteristics. For carrying out the RVS as per IS, 1893: 2002 , four hazard zones have been defi ned, corresponding to low seismic risk (Zone II), moderate seismic risk (Zone III), high seismic risk (Zones IV ) and very high seismic hazard (Zones V). RVS in 11 wards, a total of 3339 buildings, in Mussoorie town has been carried out.
Table 1 : Expected damage level as function of RVS score
RVS score Damage potential
S < 0.3 High probability of grade 5 damage; Very high probability of grade 4 damage 0.3 < S < 0.7 High probability of grade 4 damage; Very high probability of grade 3 damage 0.7 < S < 2.0 High probability of grade 3 damage; Very high probability of grade 2 damage 2.0 < S < 3.0 High probability of grade 2 damage; Very high probability of grade 1 damage S > 3.0 Probability of grade 1 damage
Sinha and Goyal, 2004 ; FEMA 154 ; ATC-21 ; EMS-98.

Preliminary seismic vulnerability assessment of Mussoorie Town, Uttarakhand (India)
© 2010 Macmillan Publishers Ltd. 1742–8262 Journal of Building Appraisal Vol. 5, 4, 357–368 363
Building classes The predominant class of buildings is URM (Unreinforced Masonry). Out of which 933 (28 per cent) are URM1, 1802 (54 per cent) are URM2 and 431 (13 per cent) are URM3 type of buildings. However, only 168 (5 per cent) are buildings of the other fi ve classes, that is, C1, C3, S1, S2 and wood were found but no buildings of class C2 was observed during the survey. In total, 95 per cent of the building classes are in URM (Unreinforced Masonry) construction. Among these, the URM 3 and URM 2 (67 per cent of total building) type are highly vulnerable to severe damage in MSK IX and VIII, which form the basis of seismic Zones V and IV, respectively. RC framed, steel and wood buildings are rather safe in moderate earthquakes, constituting only about 5 per cent. Unreinforced burnt brick or stone masonry buildings having seismic bands either horizontally, vertically or both are 28 per cent of the total buildings and generally safe in the case of small earthquakes and suffer lesser damages in moderate earthquakes.
The predominant roof type are roofs made in sloping fashion (GI sheets, slate, and so on) which are about 73 per cent, RC and RB lintel roofs are about 25 per cent and the other 2 per cent of buildings having both types of roof. Ward-wise classifi cation of the buildings is shown in Figure 3 .
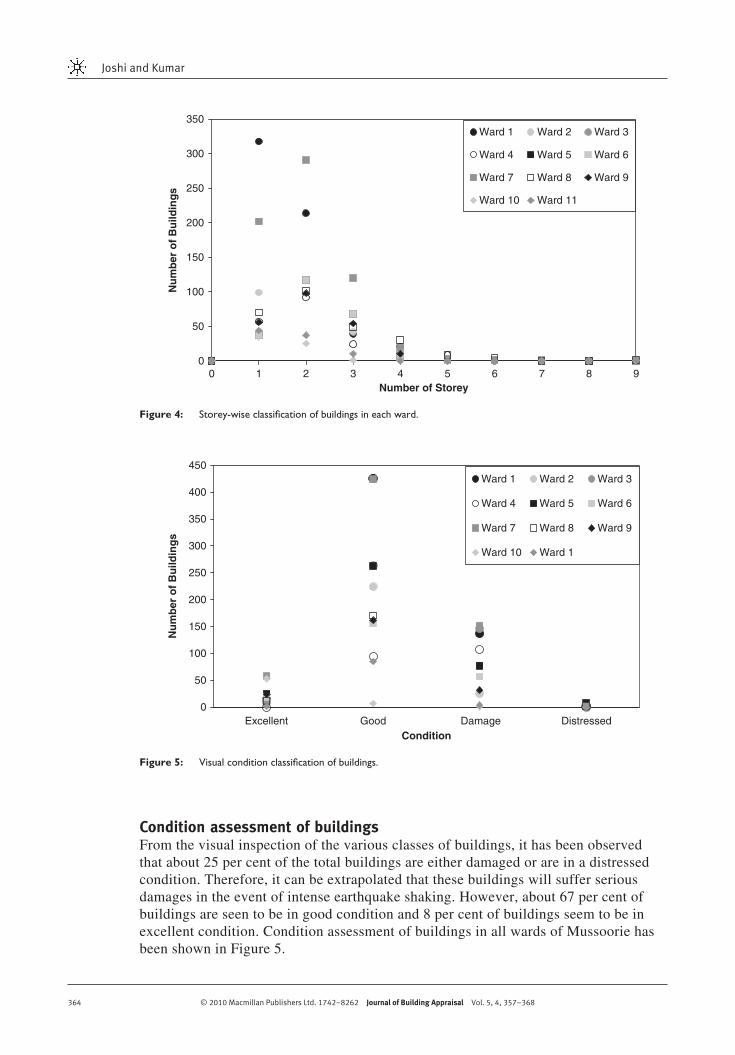
Buildings height The fundamental natural period of a building depends on the height of the building, that is, number of stories and plan dimension. In Mussoorie town, out of the total 3339 buildings surveyed, 1138 are single storied, 1422 are double storied, 561 are three storied, 142 are four storied, 46 are fi ve storied, 22 are six storied and one building of nine stories. Figure 4 shows the storey-wise classifi cations of the buildings in each ward.
URM278%
URM117%
URM35%
Ward Number: 1
URM252.5%
URM139.1%
URM38%
Wood0.4%
Ward Number: 2
URM268.6%
URM123%
URM38%
C10.2%
C30.2%
Ward Number: 3
URM256%
URM119%
URM324%
C11%
Ward Number: 4
URM254.7%
URM131%
URM36%
C11%
C36%
S10.3%
Wood1%
Ward Number: 5
URM230%
URM134%URM3
27%
C10.4%
C38.6%
Ward Number: 6
Wood0.2%
S20.2%
C310%C1
0.2%
URM321.4%
URM127%
URM241%
Ward Number: 7
URM239%
URM127%
URM323%
C11%
C310%
Ward Number: 8
S12%
Wood1%C1
6%URM33%
URM246%
URM142%
Ward Number: 9
URM310%
URM260%
URM130%
Ward Number: 10
URM243%
URM157%
Ward Number: 11
URM253.97%
URM127.94%
URM312.91%
C10.75%
C34.04%
S10.15%
S20.03% Wood
0.21%
Mussoorie Town
Figure 3: Ward-wise classifi cation of the buildings.
© 2010 Macmillan Publishers Ltd. 1742–8262 Journal of Building Appraisal Vol. 5, 4, 357–368364
Joshi and Kumar
Condition assessment of buildings From the visual inspection of the various classes of buildings, it has been observed that about 25 per cent of the total buildings are either damaged or are in a distressed condition. Therefore, it can be extrapolated that these buildings will suffer serious damages in the event of intense earthquake shaking. However, about 67 per cent of buildings are seen to be in good condition and 8 per cent of buildings seem to be in excellent condition. Condition assessment of buildings in all wards of Mussoorie has been shown in Figure 5 .
0
50
100
150
200
250
300
350
Number of Storey
Nu
mb
er o
f B
uild
ing
s
Ward 1 Ward 2 Ward 3
Ward 4 Ward 5 Ward 6
Ward 7 Ward 8 Ward 9
Ward 10 Ward 11
0 1 2 3 4 5 6 7 8 9
Figure 4: Storey-wise classifi cation of buildings in each ward.
0
50
100
150
200
250
300
350
400
450
DistressedCondition
Nu
mb
er o
f B
uild
ing
s
Ward 1 Ward 2 Ward 3
Ward 4 Ward 5 Ward 6
Ward 7 Ward 8 Ward 9
Ward 10 Ward 1
Excellent Good Damage
Figure 5: Visual condition classifi cation of buildings.

Preliminary seismic vulnerability assessment of Mussoorie Town, Uttarakhand (India)
© 2010 Macmillan Publishers Ltd. 1742–8262 Journal of Building Appraisal Vol. 5, 4, 357–368 365
Vulnerability of the buildings The categories for the vulnerability of the buildings in the study area are based on the European Macroseismic Scale (EMS-98). The damage expected to a building is classifi ed in fi ve class viz. a , b , c , d , e as defi ned below:
a = Probability of Grade 1 damage b = High probability of Grade 2 damage, Very high probability of Grade 1 damage c = High probability of Grade 3 damage, Very high probability of Grade 2 damage d = High probability of Grade 4 damage, Very high probability of Grade 3 damage e = High probability of Grade 5 damage, Very high probability of Grade 4 damage
The damageability of various classes of buildings has been shown in the damage probability matrix in Table 2 . This multi-criteria analysis is based on the building type. Each type has a basic score based on different structural parameters that highly infl uence the vulnerability of the building (number of stories, plan and vertical irregularities, code detailing, soil type and condition, and so on).
From the analysis, based on the damage probability matrix as defi ned earlier for different classes of buildings, the following scenario emerges:
About 63 per cent of URM 1 buildings in Mussoorie town are under High probability of Grade 3 damage and Very high probability of Grade 2 damage, whereas the other 36 per cent are under High probability of Grade 2 damage and Very high probability of Grade 1 damage . For URM 2 buildings of Mussoorie town, 20 per cent are under High probability of Grade 5 damage and Very high probability of Grade 4 damage , 29 per cent are High probability of Grade 4 damage, Very high probability of Grade 3 damage and 50 per cent are High probability of Grade 3 damage, Very high probability of Grade 2 damage . The worst scenario is being shown by the URM 3 type of building in Mussoorie town which was quite obvious because of very low resistance against earthquake forces. 66 per cent of URM 3 buildings shows High probability of Grade 5 damage, Very high probability of Grade 4 damage, 17 per cent High probability of Grade 4 damage, Very high probability of Grade 3 damage and 16.5 per cent are High probability of Grade 3 damage, Very high probability of Grade 2 damage. C1 Buildings in Mussoorie town are relatively better showing only 4 per cent are High probability of Grade 5 damage, Very high probability of Grade 4 damage, 8 per cent are High probability of Grade 4 damage, Very high probability of Grade 3 damage , 20 per cent are High probability of Grade 3 damage, Very high probability of Grade 2 damage and 68 per cent are High probability of Grade 2 damage, Very high probability of Grade 1 damage . C3 type buildings in Mussoorie are more vulnerable than the C1 class because of non-compliance of seismic codes. 6 per cent of the C3 buildings could have a High probability of Grade 5 damage, Very high probability of Grade 4 damage, about 17 per cent are High probability of Grade 4 damage, Very high probability of Grade 3 damage, 20 per cent having High probability of Grade 3 damage, Very high probability of Grade 2 damage and 68 per cent are High probability of Grade 2 damage, Very high probability of Grade 1 damage. S1 and S2 buildings appear less in the town and have very low damageability. In S1 buildings 50 per cent are in High probability of Grade 3 damage, Very high probability of Grade 2 damage and 50 per cent are in High probability of Grade 2 damage, Very
•
•
•
•
•
•

© 2010 Macmillan Publishers Ltd. 1742–8262 Journal of Building Appraisal Vol. 5, 4, 357–368366
Joshi and Kumar
high probability of Grade 1 damage . All buildings of S2 class are High probability of Grade 2 damage, Very high probability of Grade 1 damage . Some wooden buildings are also present in the city. Because the wood is very light weight and has good fl exibility, the damages occurring in these types of the buildings is quite low. 80 per cent of such buildings are High probability of Grade 3 damage, Very high probability of Grade 2 damage and 20 per cent are High probability of Grade 2 damage, Very high probability of Grade 1 damage.
By analysing the data in each ward it has been found that 623 buildings (about 20 per cent of the total surveyed buildings) are High probability of Grade 5 damage, Very high probability of Grade 4 damage , meaning they are the most vulnerable buildings in Mussoorie town and 587 buildings (about 18 per cent of the total surveyed buildings) are High probability of Grade 4 damage, Very high probability of Grade 3 damage , that is, severely damaged buildings in case of Intensity VIII or more earthquake shaking . Figure 6 shows the ward-wise damageability of Mussoorie town. ArcGIS software has been used for data analysis and assessment of expected damage grades. The different damageability is shown in Figure 7 .
CONCLUSION The State of Uttarakhand (India) has been exposed to destructive earthquakes and in the recent past earthquakes of Uttarkashi (1991) and Chamoli (1999) have caused heavier damages in some parts of the State. The vulnerability of Mussoorie to destructive earthquakes is very high and has increased dramatically in recent years. The population has also considerably increased, the buildings have deteriorated, and most of the new buildings have not been built from the viewpoint of seismic strength. Most of the
•
Table 2 : (a) Damage probability matrix of URM 1, URM 2, URM 3 and C1 buildings; (b) Damage probability matrix of C 3, S 1, S 2 and wood buildings
Wards a b c d e a b c d e a b c d e a b c d e
URM 1 URM 2 URM 3 C 1
W1 0 32 53 0 0 0 0 347 76 0 2 0 10 2 14 0 0 0 0 0 W2 0 54 48 0 0 1 4 96 25 2 0 0 7 6 1 0 0 0 0 0 W3 0 30 57 3 3 0 1 133 95 57 0 0 10 4 21 0 0 1 0 0 W4 0 8 31 0 0 0 0 12 82 20 0 0 2 0 48 0 0 2 0 0 W5 0 9 106 0 0 0 0 80 17 103 0 0 7 6 8 0 1 0 1 1 W6 0 20 58 1 1 0 0 10 9 48 0 0 0 11 34 0 0 0 1 0 W7 1 60 92 0 1 0 0 83 83 74 0 0 19 24 77 0 0 1 0 0 W8 0 25 45 0 0 0 0 22 59 19 0 0 4 10 46 0 2 1 0 0 W9 0 58 34 0 0 0 0 46 34 18 0 0 4 2 0 0 14 0 0 0 W10 0 7 9 0 0 0 1 28 4 2 0 0 2 1 20 0 0 0 0 0 W11 0 18 31 0 0 0 0 20 16 0 0 0 0 0 0 0 0 0 0 0 C 3 S1 S2 Wood
W1 0 0 0 0 0 0 0 0 0 0 0 0 0 0 0 0 0 0 0 0 W2 0 0 0 0 0 0 0 0 0 0 0 0 0 0 0 0 0 1 0 0 W3 0 0 1 0 0 0 0 0 0 0 0 0 0 0 0 0 0 0 0 0 W4 0 0 0 0 0 0 0 0 0 0 0 0 0 0 0 0 0 0 0 0 W5 0 5 17 0 0 0 0 3 0 0 0 0 0 0 0 0 1 2 0 0 W6 0 4 10 6 0 0 0 0 0 0 0 0 0 0 0 0 0 0 0 0 W7 0 0 5 8 5 0 0 0 0 0 0 1 0 0 0 0 0 1 0 0 W8 0 3 23 1 0 0 0 0 0 0 0 0 0 0 0 0 0 0 0 0 W9 0 0 0 0 0 0 4 0 0 0 0 2 0 0 0 0 0 0 0 0 W10 0 0 0 0 0 0 0 0 0 0 0 0 0 0 0 0 0 0 0 0 W11 0 0 0 0 0 0 0 0 0 0 0 0 0 0 0 0 0 0 0 0

Preliminary seismic vulnerability assessment of Mussoorie Town, Uttarakhand (India)
© 2010 Macmillan Publishers Ltd. 1742–8262 Journal of Building Appraisal Vol. 5, 4, 357–368 367
buildings in the region are non-engineered and awareness and knowledge among the masses is lacking regarding earthquake-resistant construction techniques in areas of high seismic vulnerability. Inadequate building bye laws and lenient regulatory regimes only add to the problems. It is imperative to be prepared for future earthquakes. Based on vulnerability studies in Mussoorie town, the critical zones for damage from expected earthquakes are: ward numbers 3, 4, 5, 6 and 7. The zones corresponding to the tri-junction
d15%
c76%
a0.4%
e2.6%
b6%
Ward Number: 1
b23.7%
e1.2%
a0.4%
c62%
d12.7%
Ward Number: 2
b7%e
19%
c49%
d25%
Ward Number: 3
b4%
e33%
c23%
d40%
Ward Number: 4
b4%
e31%
c58%
d7%
Ward Number: 5
b11%
e39%
c37%
d13%
Ward Number: 6
d21.5%
c37.6%
a0.2%
e29.3%
b11.4%
Ward Number: 7
b12%e
25%
c36%
d27%
Ward Number: 8
b36%
e8%
c39%
d17%
Ward Number: 9
b11%
e30%
c52%
d7%
Ward Number: 10
b21%
c60%
d19%
Ward Number: 11
d18.6%
c49%
a0.1%e
19.8%
b11.5%
Mussoorie Town
Figure 6: Ward-wise damageability of Mussoorie town.
Figure 7: Seismic damageability of Mussoorie town.

© 2010 Macmillan Publishers Ltd. 1742–8262 Journal of Building Appraisal Vol. 5, 4, 357–368368
Joshi and Kumar
of wards 5, 6 and 7 are high-density population areas with highly vulnerable buildings. The present preliminary study of earthquake damage scenario could provide, as far as possible, a critical image of the anticipated disaster. However, the detailed evaluation of buildings can exhibit a precise seismic vulnerability scenario in the town.
ACKNOWLEDGEMENTS Financial support for the study from the Disaster Risk Management Programme, Ministry of Home Affairs, Government of India, and United Nation Development Programme, India is acknowledged. The authors convey their sincere thanks to Dr Piyoosh Rautela, Executive Director, Disaster Mitigation and Management Centre, for their support and encouragement and Mr Shubham Pathak, Disaster Mitigation and Management Centre, for preparation of GIS maps. The authors also extend their thanks to survey team members for collecting the data.
REFERENCES Applied Technology Council . ( 1988 ) Rapid Visual Screening of Buildings for Potential Seismic Hazards: A Handbook
ATC-21 . Washington DC: Federal Emergency Management Agency .
Baranowski , J . , Armbruster , J . , Seeber , L . and Molnar , P . ( 1984 ) Focal depths and fault plane solutions of earthquakes
and active tectonics of the Himalaya . Journal of Geophysical Research 89 : 6918 – 6928 .
Bhatia , S . C . , Kumar , M . R . and Gupta , H . K . ( 2007 ) A probabilistic seismic hazard map of India and adjoining regions ,
http://www.seismo.ethz.ch/gshap/ict/india.html , accessed 13 February 2007 .
Bilham , R . , Gaur , V . K . and Molnar , P . ( 2001 ) Himalayan seismic hazard . Science 293 : 1442 – 1444 .
Blaikie , P . , Cannon , T . , Davis , I . and Wisner , B . ( 1994 ) At Risk: Natural Hazards, People’s Vulnerability, and
Disasters , 2nd edn. London: Routledge .
Dowrick , D . J . ( 1998 ) Earthquake risk for property and people in New Zealand . Proceedings of New Zealand National
Society for Earthquake Engineering Conference, Wairakei. New Zealand Society for Earthquake Engineering:
Wellington, New Zealand, pp. 43 – 50 .
Dowrick , D . J . ( 2003 ) Earthquake Risk Reduction . UK: John Wiley & Sons .
Fedl , N . and Bilham , R . ( 2006 ) Great Himalayan earthquakes and the Tibetan plateau . Nature 444 : 165 – 170 .
FEMA 154 . ( 2002 ) Rapid Visual Screening of Buildings for Potential Seismic Hazards, A Handbook , 2nd edn. Redwood
City, CA: FEMA 154 .
Gaur , V . K . , Chander , R . , Sarkar , I . , Khattri , K . N . and Sinvhal , H . ( 1985 ) Seismicity and the state of stress from
investigations of local earthquakes in the Kumaon Himalayas . Tectnophysics 118 : 243 – 251 .
Indian Standard: IS 1893, Part 1 . ( 2002 ) Criteria for Earthquake Resistant Design of Structures - General Provisions
and Buildings . New Delhi: Bureau of Indian Standards .
Khattri , K . N . , Chandra , R . , Gaur , V . K . , Sarkar , I . and Kumar , S . ( 1989 ) New seismological results on the tectonics of
Garhwal Himalaya . Proceedings of the Indian Academy of Science 98 : 91 – 101 .
Kumar , D . , Teotia , S . S . and Khattri , K . N . ( 1997 ) The representation of attenuation characteristics of strong ground
motions observed in the 1986 Dharamsala and 1991 Uttarkashi earthquake by available empirical relationships .
Current Science 73 : 543 – 548 .
Molnar , P . ( 1990 ) A review of the seismicity and the rates of active under thrusting and deformation at the Himalayas .
Journal of Himalayan Geology 2 : 131 – 154 .
Ni , J . and Barazangi , M . ( 1984 ) Seismotectonics of the Himalayan collision zone: Geometry of the underthrusting
Indian plate beneath the Himalaya . Journal of Geophysical Research 89 : 1147 – 1163 .
Sinha , R . and Goyal , A . ( 2004 ) A national policy for seismic vulnerability assessment of buildings and procedure for rapid
visual screening of buildings for potential seismic vulnerability . Proposed National Policy on Seismic Vulnerability
Assessment of Buildings, Mumbai, India , http://www.civil.iitb.ac.in/~rsinha/Vulnerability_Assessment.pdf .
Thakur , V . C . ( 2006 ) Seismotectonics and earthquake geology of northwestern Himalaya . Geological Survey of India
Special Publication 85 : 61 – 71 .
US Geological Survey . ( 1999 ) Earthquake Catalogue . US Geological Survey, Reston, VA, USA .