premier foods plc - annual reports
TRANSCRIPT

Premier Foods plc
Premier HouseCentrium Business ParkGriffiths WaySt AlbansHertfordshireAL1 2RE
T: 01727 815850
Registered in England and Wales No. 5160050
www.premierfoods.co.uk
Prem
ier Foo
ds p
lc Annual rep
ort fo
r the 52 week p
eriod
ended
2 Ap
ril 2016
ANNUAL REPORT 2015/16
Investing in success

Our Growth Strategy is working
We’re now expanding this investment across the portfolio and driving additional strategic opportunities to accelerate growth.
Premier Foods plc Annual report for the 52 week period ended 2 April 2016
Our strategy of investing in our brands and our commercial expertise is working despite challenging market conditions. In the areas where we’ve focused investment we’re starting to deliver growth, generating value for our consumers and our customers.

Investing in our brandsA step change in innovation based on our insight into UK consumer trends.
14 for more information.
Investing in commercial expertiseInvesting in our commercial teams to accelerate growth and expand into new channels.
16 for more information.
Delivering growthOur investment strategy has resulted in six of our eight largest brands delivering average sales growth of 3.4% in 2015/16.
18 for more information.
INTRODUCTION STRATEGIC REPORT GOVERNANCE FINANCIAL STATEMENTS 01
The Company's results are presented for the 52 weeks ended 2 April 2016. In the strategic report comparative pro forma results are presented for the 52 weeks ended 4 April 2015 and are unaudited. The Company’s results are presented on an underlying basis which excludes the results of previously completed disposals and joint ventures and are presented to illustrate the trading performance of the Company on a like-for-like basis.
38 for a reconciliation of underlying numbers to continuing operations.
INTRODUCTION
At a glance 02
Chairman’s statement 04
STRATEGIC REPORT
Chief Executive's review 06
Marketplace 08
Our strategic model 10
Our strategy in action 12
– Investing in our brands 14
– Investing in commercial expertise 16
– Delivering growth 18
Key performance indicators 20
Our responsibilities 22
Managing our risks 28
Operating and financial review 32
GOVERNANCE
Chairman’s introduction 42
Board of directors 43
Governance overview 44
Nomination Committee report 46
Audit Committee report 48
Directors’ Remuneration report 50
Other statutory information 67
FINANCIAL STATEMENTS
Independent auditor's report 70
Consolidated financial statements 74
Notes to the financial statements 79
Company financial statements 131
Notes to the Company financial statements 133
The directors' report is comprised of pages 2 to 69.
Explore our report
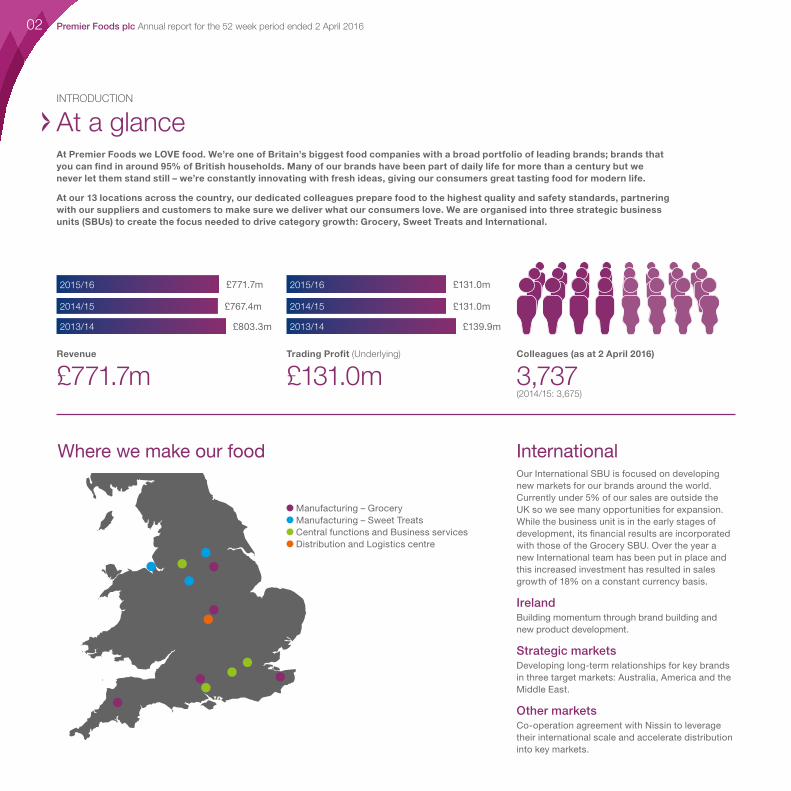
At Premier Foods we LOVE food. We’re one of Britain’s biggest food companies with a broad portfolio of leading brands; brands that you can find in around 95% of British households. Many of our brands have been part of daily life for more than a century but we never let them stand still – we’re constantly innovating with fresh ideas, giving our consumers great tasting food for modern life.
At our 13 locations across the country, our dedicated colleagues prepare food to the highest quality and safety standards, partnering with our suppliers and customers to make sure we deliver what our consumers love. We are organised into three strategic business units (SBUs) to create the focus needed to drive category growth: Grocery, Sweet Treats and International.
InternationalOur International SBU is focused on developing new markets for our brands around the world. Currently under 5% of our sales are outside the UK so we see many opportunities for expansion. While the business unit is in the early stages of development, its financial results are incorporated with those of the Grocery SBU. Over the year a new International team has been put in place and this increased investment has resulted in sales growth of 18% on a constant currency basis.
IrelandBuilding momentum through brand building and new product development.
Strategic marketsDeveloping long-term relationships for key brands in three target markets: Australia, America and the Middle East.
Other marketsCo-operation agreement with Nissin to leverage their international scale and accelerate distribution into key markets.
Where we make our food
Revenue
£771.7mTrading Profit (Underlying)
£131.0mColleagues (as at 2 April 2016)
3,737(2014/15: 3,675)
INTRODUCTION
At a glance
£767.4m £131.0m
£803.3m £139.9m
£771.7m £131.0m
2014/15 2014/15
2013/14 2013/14
2015/16 2015/16
Manufacturing – Grocery Manufacturing – Sweet Treats Central functions and Business services Distribution and Logistics centre
Premier Foods plc Annual report for the 52 week period ended 2 April 201602

GroceryThe Grocery SBU is responsible for developing our portfolio of leading brands in four key categories:
• Flavourings & seasonings
• Cooking sauces & accompaniments
• Quick meals & soups
• Ambient desserts
2015/16 highlights• Significant increase in product innovation including the launches of:
OXO Stock Pots; Loyd Grossman Gastro pouch range; Ambrosia Deluxe premium tier custard and frozen custard ice cream; Batchelors Deliciously Thick cup-a-soup and Sharwood's stir fry Melts.
• Partnership with Paul Hollywood, our first new brand in 20 years, building on our presence in the home-baking category.
• Dedicated team in place to realise growth opportunities in the growing online channel.
Sweet TreatsThe Sweet Treats SBU is responsible for growing the nation’s leading cake brands: Mr Kipling, Cadbury and Lyons, and developing the ambient cake category to compete in the broader Sweet Treats market.
2015/16 highlights• Completion of £20m investment in a new Mr Kipling snack pack line.
• Significant increase in product innovation with the launch of Mr Kipling 'Exceedingly Good' range of slices, Deluxe Viennese Whirls, Cupcakes and range of whole cakes, Cadbury Amaze Bites and Hot Cakes.
• Cadbury Mini Rolls back on TV for the first time in 8 years.
• A record 185m mince pies sold during the Christmas season in 2015.
• New commercial team recruited for the launch of 'Cake on the go' in the convenience channel.
Revenue
£548.6mout of £771.7m
Branded Mix
92%
Colleagues
1,562out of 3,737
Revenue
£223.1mout of £771.7m
Branded Mix
80%
Colleagues
2,175out of 3,737
34 for more information. 33 for more information.
INTRODUCTION STRATEGIC REPORT GOVERNANCE FINANCIAL STATEMENTS 03

INTRODUCTION
Chairman's statementDear shareholder,The Company has made encouraging progress over the past year in delivering its growth strategy and strengthening the foundations for future growth and shareholder value creation.
The grocery market in the UK faced another tough year in 2015/16. We continued to see downward pressure on food prices driven by lower commodity costs and intense competition amongst our retail customers as they continue to adjust to changing shopping habits. Volumes did, however, improve as consumers have been generally buying more food. Trends also continued to evolve as people looked for greater convenience and the opportunity to feel more involved in the cooking experience as well as showing a greater interest in health and what goes into their food.
Our strategy in this environment has been to increase investment behind our brands and continue strengthening the capabilities and expertise of our commercial teams through the strategic business unit structure we put in place 18 months ago. I’m delighted with the way the management team has executed the strategy, which is clearly starting to show results. Initial focus has been on six of our largest brands in Bisto, Oxo, Loyd Grossman, Sharwood’s, Mr Kipling and Cadbury cakes. We stepped up our rate of new product innovation, increased our marketing spend and improved our in-store execution with powerful effect. Sales of these six brands collectively grew by 3.4% despite the tough market and we grew sales overall by 0.6%. This gives the Board confidence that, as we apply the strategy to more of our brands this year, the Company will be able to drive further growth.
Furthermore, as we reviewed our future business plans earlier in the year, the Board was encouraged by management’s confidence that growth could be further accelerated through a number of additional strategic initiatives. Our plans to expand the share of cake in the large and growing ‘snacking on the go’ market provides a significant growth opportunity for the category. Similarly, taking our well-loved Grocery brands into the chiller cabinet with a range of innovative new products is equally compelling. And we’ve only really just started exploring the many opportunities that exist for our brands internationally, with bold plans to expand our cake brands in markets such as the USA and the Middle East.
All of these initiatives are achievable with relatively modest additional investment.
The combination of our existing strategy and new strategic initiatives is what led the Board to double our sales growth guidance from 1–2% to 2–4% for 2016/17 and the medium-term.
Given the progress we’ve made, it wasn’t altogether surprising that others would take a close interest in the Company and shareholders will be aware of the approach we received earlier in the year from McCormick & Company, Inc. ('McCormick') to potentially acquire Premier Foods.
The Board was very conscious of its duties in this situation and of the need to do what was in the best interest of shareholders as a whole and also our employees and other stakeholders in the Company. We took extensive advice on the valuation of the Company and we were clear that the indicative offers from McCormick undervalued the Company and our significant growth prospects. We did, nevertheless, engage constructively with McCormick to explain our view and provide relevant information about the business to enable them to put forward a deliverable offer on appropriate terms.
In the event, McCormick declined to make a formal offer for the Company and I recognise that some shareholders were disappointed with this outcome. However, Gavin Darby and I have held a number of meetings with our largest shareholders to explain our growth plans in more detail and we believe
Our strategic model
10–11
Premier Foods plc Annual report for the 52 week period ended 2 April 201604

the majority appreciate our ambitions for Premier Foods and are supportive of these growth plans.
Our prospects are further enhanced by the strategic co-operation agreement we signed with Nissin Foods Holdings Co., Ltd ('Nissin') in March 2016. We’ve discussed a number of opportunities with Nissin in the past and I was delighted that we could crystallise our relationship with an agreement to collaborate on mutual growth opportunities in the UK and internationally. Nissin also acquired a significant stake in the Company demonstrating their confidence in our future and I’m delighted to welcome Mr Tsunao Kijima who will join the Board as Nissin’s representative under the terms of our Relationship agreement, with effect from 21 July 2016.
Details of our governance process and the Board’s activities in the year are set out in the governance section on pages 42 to 69.
Underpinning our growth plans we have continued to make progress in driving our corporate responsibility and sustainability agenda. A major focus has been the nutrition and health debate. With consumers showing a greater interest in health and the Government looking to stem the rise in obesity in the UK, particularly amongst children, we have
taken a fresh look at our nutrition strategy. Building on our achievements to date, we’ve developed a number of additional commitments to encourage healthier food choices over the next three years. These include taking steps to reduce sugar and calories in many of our products, launching new products with more wholesome ingredients and tightening restrictions around advertising and marketing to children under 16 years of age.
On the people side we’ve also made progress through continuing to invest in apprenticeships, improving the diversity balance amongst senior management and maintaining our industry leading Health & Safety record. And in terms of our supply chain, we’ve taken important steps to safeguard our business from any kind of human trafficking and modern day slavery through becoming a supporting partner of the Stronger Together initiative. I am also personally very impressed by the efforts of colleagues from around the business in supporting the communities in which we operate and am delighted that we are well on the way to exceeding our fund-raising target of £250,000 for our corporate charity partner, Cancer Research UK, by the end of 2016. For more information see the section on our responsibilities on pages 22 to 27.
We have a strong future and the Board is confident that our strategy will deliver shareholder value.
Finally, I would like to take this opportunity to thank all colleagues within the business for their hard work over the year and for their enormous contribution in helping to deliver our strategy and returning the business to growth. Our strategy is working and we have many new and exciting opportunities to accelerate growth. We have a strong future and the Board is confident that our strategy will deliver shareholder value. I look forward to updating you on progress.
David BeeverChairman
16 May 2016
Our responsibilities Governance overview Remuneration
22–27 44–45 50–66
INTRODUCTION STRATEGIC REPORT GOVERNANCE FINANCIAL STATEMENTS 05

Premier Foods plc Annual report for the 52 week period ended 2 April 201606
STRATEGIC REPORT
Chief Executive’s reviewWe’re accelerating growthThe progress we made in 2015/16 demonstrates that our growth strategy is working. Where we’ve focused investment, we’re delivering results. This gives us a solid platform from which to accelerate future growth.
How would you summarise the results for 2015/16?Overall I believe we delivered a solid set of results in a challenging market. Six of our key brands collectively grew sales by 3.4% in the year and total sales increased by 0.6% whilst Trading profit was in line with expectations. This reflects the higher investment we’ve been making behind our brands in line with our strategy. We’ve increased our marketing significantly in the last two years and we are now well on our way to meeting our target of generating 20% of our sales from new and improved products. I’m particularly pleased with how our Sweet Treats business has performed with sales up 3.4% in the year as Mr Kipling and Cadbury cakes responded well to higher levels of
Accelerating growth:Sales guidance now doubled to 2–4%.
Our growth strategy is working and we are expanding it to benefit more brands in our portfolio.
investment. Our International business also grew strongly with sales up 18%, in constant currency terms, as a result of our increased focus and investment in this area. We were additionally able to significantly reduce our Net debt by over £50m, helping our Net debt to EBITDA ratio fall to 3.6x.
What are the growth plans for the business?The progress we made in 2015/16 shows that in the areas where we’ve invested, our strategy is working. Our next step is to apply the strategy to two further brands in 2016/17 with Ambrosia and Batchelors. We have a full programme of new product introductions and advertising planned for these brands that we’re confident will drive growth. In addition, we’ve identified a number of additional strategic initiatives that will help us accelerate growth. We’ve already started to invest in building a ‘Cake on the go’ business that will expand our brands in the large and growing ‘snacking on the go’ market where cake has historically only had a small share. We’re also developing plans to take our Grocery brands into premium segments of the chilled food category. And we’re investing more in expanding our International business particularly in capturing opportunities for our cake brands in markets such as the USA and the Middle East. Finally, we have entered a strategic partnership with Nissin Foods Holdings Co., Ltd. ('Nissin') which we expect will open up new growth opportunities for us both in the UK and internationally.
How confident are you of delivering your revised sales guidance of 2–4%?We’ve been gradually gathering momentum since we put our new business unit structure in place around 18 months ago and started implementing our investment strategy. Our rate of new product innovation has risen significantly and we’ll yet again be increasing our spend on marketing in 2016/17 with nine of our brands back on TV. We're also managing our revenue carefully both through improving our promotional efficiency and launching more premium products with a higher pence per serving. Our retail customers are supportive of our plans and innovation and beyond the major supermarkets we’ve been growing in other channels such as with the discounters and online with a focused approach. There’s also lots of opportunity to build stronger momentum internationally. The Board feels very confident about the direction we’re taking and the guidance we’ve given.
What does the partnership with Nissin bring to Premier Foods?I’m very excited about the opportunities we have with Nissin following the co-operation agreement we signed with them on 23 March 2016. They’re a global player present in nineteen countries around the world and a clear leader in instant noodles, although they also have a presence in other categories in Japan such as frozen and chilled products, yoghurt drinks and cereal based confectionery. In the UK market there are opportunities for us to distribute Nissin brands and to launch Nissin products under our own brands such as Batchelors. We’ll also explore the potential to use Nissin’s network in other markets to support our international expansion. I’m additionally excited

INTRODUCTION STRATEGIC REPORT GOVERNANCE FINANCIAL STATEMENTS 07
by the opportunity to share expertise and know-how in a number of areas including manufacturing and quality. As a first step, we’ve put in place a project structure between the two companies to develop the various opportunities and we’ll provide updates on progress later in the year.
Can you say more about the investment you’ve made in people and commercial expertise?A key part of our strategy has been to invest in strengthening our business units through hiring more people with the right capabilities and expertise to help us accelerate growth. Over the past 18 months we’ve hired almost 100 new people in a variety of commercial functions including marketing, innovation, consumer insights, e-commerce, sales and International. The majority have strong backgrounds in major FMCG companies and bring a lot of experience, ideas and energy to the Company which is already making a difference. This is great for the business and gives us further confidence about delivering our plans.
How are you going to fund your growth plans?In broad terms, as we grow the business we’re able to generate more profit to be able to invest behind our brands. This is supported by a range of supply chain efficiencies that we’ll continue to deliver year-on-year through more efficient manufacturing processes, less waste, leaner structures and improvements in logistics costs. Overall, we plan to increase our investment in consumer marketing by 17–22% in 2016/17 as well as fund our new strategic initiatives to accelerate growth. It’s very important to be able to invest in our brands if we are to be successful in the current market.
How are you addressing growth with the discounters and other channels beyond the supermarkets? The hard discounters remain a fast growing channel but are predominantly focused on non-branded products. Tactically we’ve been able to expand sales with these customers over the past year through winning more non-branded contracts, for instance, in desserts and mince pies. We’re also continuing to grow online through taking a more dedicated approach to the channel led by our new head of e-commerce. However, our main focus continues to be with the major supermarkets where we sell most of our brands. As they’ve adapted their strategies to the changing environment over the past twelve months, we’ve continued to work closely with them to identify growth opportunities.
How have Hovis and Knighton performed in the period?Hovis has had a tough time over the past year given the intensely competitive bread market. We remain very supportive of their strategy to improve efficiencies and invest selectively in new products, marketing and quality but decided to take a cautious approach writing off our remaining investment in the business. We have also taken the decision to re-integrate the Knighton Foods business ('Knighton') as part of Premier Foods over the course of 2016/17. This business had been struggling following an unsatisfactory systems implementation which affected profitability, customer service and working capital. Given its importance as a supplier to Premier we concluded it was in the Company’s best interests to regain control of the business. This will add to our 2016/17 sales by around £35m.
What is the Company doing to address the obesity issue?We believe we have a role to play both to meet the growing consumer interest in healthy options and to work with the Government and others to help address the obesity challenge. Building on the progress we’ve already made in adapting our recipes, portion sizes and labelling, we’ve recently refreshed our nutrition strategy to set new goals for the next three years. We’re planning to reduce sugar and calories in our cake, desserts and cooking sauce brands and continue our plans to reduce salt in line with Government targets. We’ll also be focused on launching more nutritious products across the portfolio and expanding our single portion packs of cake. And we’ll continue to champion front of pack traffic light labelling as well as tightening our advertising policies. I’m also personally committed to working with our industry partners to encourage a broader stakeholder coalition to address this important issue.
Gavin DarbyChief Executive Officer
The strategic report on pages 6 to 41 was approved by the Board of directors on 16 May 2016 and signed on its behalf by Gavin Darby, Chief Executive Officer.
Compelling initiatives to expand our business into new categories:
in Sweet Treats with the roll out of 'Cake on the go' in the convenience channel;
in Grocery by extending our brands into premium areas of the chilled food category; and
in International through accelerating expansion in the USA and Middle East.
Exciting opportunities for strategic collaboration with Nissin.

Premier Foods plc Annual report for the 52 week period ended 2 April 201608
STRATEGIC REPORT
MarketplaceUK grocery market The overall UK grocery market was worth approximately £177.5bn in 2015/16 and accounted for 51.3p in every £1 of UK retail sales1. We operate primarily in the ambient grocery sector which incorporates all food and drink except frozen, fresh, chilled and alcohol. The ambient grocery market declined by 1.0% in 2015/16 but remains the largest sector within the UK grocery market and was worth around £28.7bn2.
Our categoriesWe have strong competitive positions and leading brands in our five core categories. We’re also strengthening our existing presence within the home-baking category with our new Paul Hollywood range of mixes.
Category Our brands Our market positionTotal3
market size
Flavourings & seasonings Bisto, OXO, Paxo No. 1 £470m
Cooking sauces & accompaniments Sharwood’s, Loyd Grossman, Homepride No. 1 £937m
Quick meals & soups Batchelors, Smash No. 1 £393m
Ambient desserts Ambrosia, Bird’s, Angel Delight, Mr Kipling, Cadbury No. 1 £378m
Ambient cakes Mr Kipling, Cadbury, Lyons No. 1 £949m
2
1
0
-1
-2
UK grocery channel value3 UK grocery price deflation2UK grocery sectors2
Mar
201
4
Jun
2014
Sep
201
4
per
cen
t
Dec
201
4
Mar
201
5
Sep
201
5
Jun
2015
Dec
201
5
Mar
201
6
1 Institute of Grocery Distribution (IGD) UK Grocery June 2015.
2 Kantar Worldpanel Purchase 27 March 2016, Total consumer spend.
3 Kantar Worldpanel Purchase Total Market for the 52 weeks to 27 March 2016, Total consumer spend.
Ambient – £28.7bn
Fresh – £21.7bn
Chilled – £20.7bn
Alcohol – £11.9bn
Frozen – £5.7bn
Supermarkets – £80.6bn
Multiple convenience – £12.8bn
Hard discounters – £10.9bn
Online – £7.7bn
High street bargain stores – £7.0bn
Other – £27.6bn

INTRODUCTION STRATEGIC REPORT GOVERNANCE FINANCIAL STATEMENTS 09
Customer and channelThe Group considers all of the major food retailers in the UK as key customers of its products. The majority of our sales are with the major supermarkets, such as Tesco, Asda, Sainsbury’s, Morrisons, Waitrose and the Co-op and we continue to focus our attention on these customers.
However, as shopping habits change and other channels continue to grow, we have expanded our focus to deliver more tailored approaches to grow our business with discounters, convenience stores and shopping online.
Hard discounters, such as Aldi and Lidl, as well as other high street bargain stores continued to see significant growth in the year. We have responded with a differentiated range of products for this channel and, where appropriate, with a non-branded offering and this has helped us grow broadly in line with this channel in 2015/16.
The online channel also grew strongly in 2015/16 and we have appointed a new head of e-commerce to develop and strengthen our online strategy.
Overview of the yearConsumer confidence increased over the period as disposable incomes rose and people benefited from low interest rates and falling oil prices. However, conditions in the UK grocery market remained challenging with continued downward pressure on prices driven by lower commodity costs and increasing price competition amongst retailers.
The UK has now seen 20 consecutive months (as at March 2016) of year-on-year food and drink retail price reductions and prices in March were 1.5% lower than a year before2. Whilst price deflation provides a challenge for us and our customers, volume growth has returned to the market as consumers are buying more.
Consumer trendsHealth continues to be an important priority for consumers with many seeking products with less sugar, fat or salt or with the addition of wholesome ingredients. As a Company we take health and nutrition very seriously and for many years have been adapting our recipes, portion sizes and labelling to allow for healthier food choices.
New healthier products launched in the year include our reduced salt Bisto Best and the new Mr Kipling ‘Exceedingly Good’ cake slice range. Over the year we have reviewed our nutritional strategy and agreed a number of new Commitments to Healthier Choices including a commitment to remove 1,000 tonnes of sugar from our portfolio by 2018. Details of these commitments are set out on page 22.
Busy lives mean people are constantly looking for quick and simple ways to cook, however, they still want to feel like they are cooking a proper wholesome meal. Responding to the increasing popularity of hob top cooking and the convenience of tray bakes, Bisto Made Simple have launched a range of tray bakes and hob top concentrated wet pastes made from fresh ingredients including real meat juices, herbs and seasonings.
Modern lifestyles mean people are also eating more 'on the go'. We have identified a significant opportunity for cake within the convenience channel where we are currently under represented. Following successful trials we are now launching a range of Mr Kipling and Cadbury twin packs designed specifically for the convenience channel and we are investing significantly in creating new distribution routes into this market.
People want to know what’s in their food and where it comes from. There is also a perception that ‘wet’ formats are fresher than ‘dry’ formats. OXO have developed and launched a range of versatile Stock Pots using gel pot technology to provide a rich flavour base to meals. In addition Sharwood’s launched a new range of stir fry Melts specifically designed to add extra flavour to stir fry meals.
We believe there are significant opportunities for our Ambrosia, Batchelors and Bisto brands within the chilled channel. For example, following the launch of Ambrosia frozen custard in the premium ice cream category, we are currently investing in the development of further opportunities for Ambrosia within chilled desserts. This represents a major strategic opportunity for the future.
Consumers are still looking for an indulgent sweet treat or end of day reward. In response we have launched a number new products such as Mr Kipling Deluxe Viennese Whirls, indulgent Mr Kipling Cupcakes and Ambrosia deluxe custard. During 2015/16 we also launched Cadbury Amaze Bites targeting the adult sweet snacking occasion. Togetherness and sharing a special moment with friends and family is also important and in the year Mr Kipling launched a new range of whole cakes.
Within the international market we have identified a number of opportunities for Mr Kipling and Cadbury using our differentiated offering, formats and packaging and in 2016/17 we will be focusing investment in the USA and Middle East.

STRATEGIC REPORT
Our strategic model
Health & well-being
Our responsibilitiesBEING RESPONSIBLE & SUSTAINABLE
22 - 27 for more information.
Our business modelOur business model is based around our core purpose – to create food the nation loves most for modern life. We develop a deep understanding of the role food plays in our consumers’ lives and use this knowledge to create food they love to eat. We believe this drives increased sales and creates value for our shareholders.
Leading British brandsWe have a valuable portfolio of market leading British brands, many with a unique heritage going back more than 100 years. With 95% of British households buying at least one of our brands each year we have a great opportunity to deliver new products which meet consumers' needs.
Experience & expertiseOur management team have a deep understanding of today’s food industry and our dedicated colleagues have vast experience in manufacturing and product development. We have strong capability in the areas of consumer insights, innovation, marketing, sales, engineering and food science.
Operational capabilityOur manufacturing base can produce our products in a wide variety of formats to meet today’s food occasions, utilising modern technology and leading safety standards for our food and our people.
Premier Foods plc Annual report for the 52 week period ended 2 April 201610
12–19 See our strategy in action.

Investing in skills Community involvement Sustainable supply chain
Our strategyDRIVING CATEGORY GROWTH
Through our five strategic priorities
Our outcomesDELIVERING VALUE TO OUR STAKEHOLDERS
ConsumersExploiting our deep UK expertise to delight our consumers
BrandsBuilding stronger brands and accelerating innovation
CustomersCultivating more responsive and valued customer partnerships
PeopleUnlocking our people’s potential
CostsWorking smarter to reduce costs and drive effectiveness
20–21 See how KPIs link to our strategy. 51 See how remuneration is aligned with our strategy.
Generating shareholder valueOur strategy is designed to drive profitable growth and to generate the cash we need to pay down debt and to re-invest in the business.
We have identified strategic opportunities to accelerate our growth plans by leveraging our capabilities, infrastructure and brand equity to expand into new formats, channels and markets.
We believe this approach will be central to the creation of value for our shareholders over the medium-term.
Acting responsiblyBy acting responsibly and sustainably in everything we do we also bring wider value to our colleagues, our suppliers, our communities and others who touch our business.
INTRODUCTION STRATEGIC REPORT GOVERNANCE FINANCIAL STATEMENTS 11

We believe the best opportunity to achieve sustainable growth is by driving growth in the categories in which we operate. This aligns our business with the interests of our major customers and our category leading brands ensure we benefit the most from a growing category. We have recently announced a number of new initiatives to accelerate growth and expand our brands into new categories.
Strategic Priority Key drivers
• Putting the consumer at the heart of everything we do by constantly updating our consumer research and refreshing our insights.
• Gaining insights into shopper behaviour to see what motivates consumers when in store.
• Translating these insights into innovation to meet evolving consumer trends.
• Creating innovative new products to meet consumer needs.
• Investing in new and traditional marketing for our brands.
• Ensuring our promotional investments are effective, efficient and inspiring.
• Working closely with our customers to agree shared goals for our mutual growth.
• Being agile to respond to the opportunities created by emerging retail channels.
• Seeking strategic international opportunities for medium-term growth.
• Communicating our purpose and living our values and behaviours.
• Creating a workplace that encourages and rewards high levels of performance and develops colleagues at all levels of the organisation to maximise their potential.
• Constantly seeking improvement to our industry leading Health & Safety record.
• Driving unwanted cost and complexity out of the business wherever we can.
• Working smarter by improving our business processes and use of technology.
• Building stronger partnerships with our key suppliers to support innovation and achieve mutually beneficial growth.
STRATEGIC REPORT
Our strategy in action
CONSUMERSExploiting our deep UK expertise to delight our consumers
BRANDSBuilding stronger brands and accelerating innovation
CUSTOMERSCultivating more responsive and valued customer partnerships
PEOPLEUnlocking our people’s potential
COSTSWorking smarter to reduce costs and drive effectiveness
Premier Foods plc Annual report for the 52 week period ended 2 April 201612
Progress in 2015/16
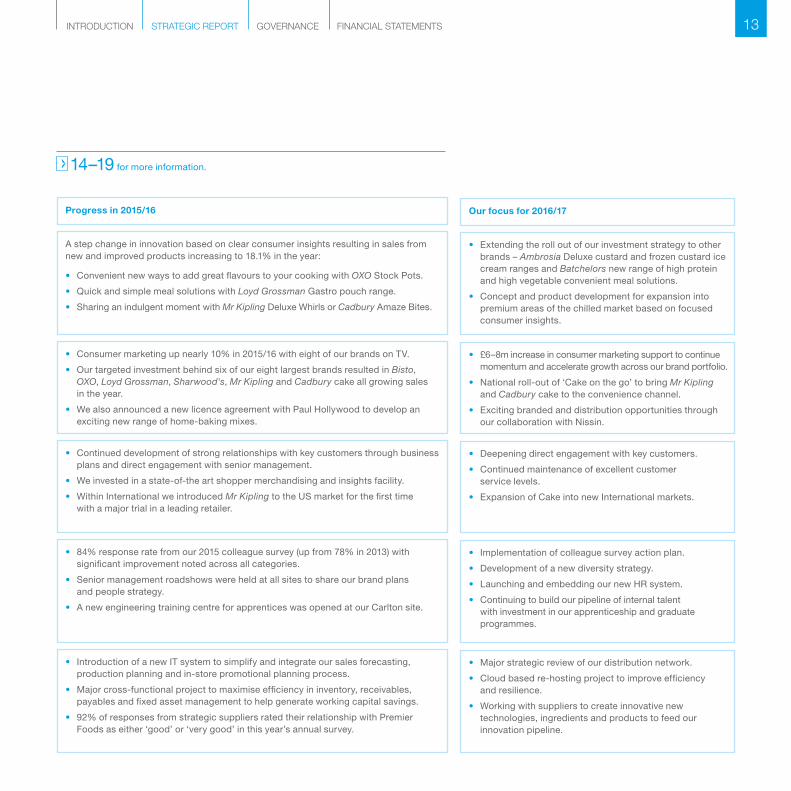
A step change in innovation based on clear consumer insights resulting in sales from new and improved products increasing to 18.1% in the year:
• Convenient new ways to add great flavours to your cooking with OXO Stock Pots.
• Quick and simple meal solutions with Loyd Grossman Gastro pouch range.
• Sharing an indulgent moment with Mr Kipling Deluxe Whirls or Cadbury Amaze Bites.
• Consumer marketing up nearly 10% in 2015/16 with eight of our brands on TV.
• Our targeted investment behind six of our eight largest brands resulted in Bisto, OXO, Loyd Grossman, Sharwood's, Mr Kipling and Cadbury cake all growing sales in the year.
• We also announced a new licence agreement with Paul Hollywood to develop an exciting new range of home-baking mixes.
• Continued development of strong relationships with key customers through business plans and direct engagement with senior management.
• We invested in a state-of-the art shopper merchandising and insights facility.
• Within International we introduced Mr Kipling to the US market for the first time with a major trial in a leading retailer.
• 84% response rate from our 2015 colleague survey (up from 78% in 2013) with significant improvement noted across all categories.
• Senior management roadshows were held at all sites to share our brand plans and people strategy.
• A new engineering training centre for apprentices was opened at our Carlton site.
• Introduction of a new IT system to simplify and integrate our sales forecasting, production planning and in-store promotional planning process.
• Major cross-functional project to maximise efficiency in inventory, receivables, payables and fixed asset management to help generate working capital savings.
• 92% of responses from strategic suppliers rated their relationship with Premier Foods as either ‘good’ or ‘very good’ in this year’s annual survey.
Our focus for 2016/17
• Extending the roll out of our investment strategy to other brands – Ambrosia Deluxe custard and frozen custard ice cream ranges and Batchelors new range of high protein and high vegetable convenient meal solutions.
• Concept and product development for expansion into premium areas of the chilled market based on focused consumer insights.
• £6–8m increase in consumer marketing support to continue momentum and accelerate growth across our brand portfolio.
• National roll-out of ‘Cake on the go’ to bring Mr Kipling and Cadbury cake to the convenience channel.
• Exciting branded and distribution opportunities through our collaboration with Nissin.
• Deepening direct engagement with key customers.
• Continued maintenance of excellent customer service levels.
• Expansion of Cake into new International markets.
• Implementation of colleague survey action plan.
• Development of a new diversity strategy.
• Launching and embedding our new HR system.
• Continuing to build our pipeline of internal talent with investment in our apprenticeship and graduate programmes.
• Major strategic review of our distribution network.
• Cloud based re-hosting project to improve efficiency and resilience.
• Working with suppliers to create innovative new technologies, ingredients and products to feed our innovation pipeline.
14–19 for more information.
INTRODUCTION STRATEGIC REPORT GOVERNANCE FINANCIAL STATEMENTS 13

STRATEGIC REPORT
Investing in our brandsWe have a great portfolio of leading British brands deeply rooted in the hearts and minds of consumers. Our growth strategy is based on increasing investment behind these brands through higher levels of product innovation, effective consumer marketing and excellent in-store execution.
Building on the strong foundations laid in 2014/15 we continued to drive a step-change in the level of innovation in 2015/16 recognising the importance this has in delivering category growth over the long-term. We’ve identified key trends relevant to our categories and developed new products to meet changing consumers’ needs.
From OXO’s move to premium wet stock with OXO Stock Pots to the launch of our first new brand in 20 years with Paul Hollywood's artisanal home baking range to an innovative partnership with Contact the Elderly to promote Bisto Spare Chair Sunday, we’re making our brands more relevant to modern life.
Over the year we increased the level of new and improved products as a percentage of sales to 18.1%, well on the way to meet our target of 20%.
Strong and effective marketing is an essential element of our brand investment. In 2015/16 we continued to increase our spend on consumer marketing, up nearly 10% to £36m with eight of our brands on TV. For 2016/17 we plan to increase this further to £42–44m as we expand our investment to further brands in our portfolio. We’re also expanding our communications across a range of digital and non-digital media channels.
OXO Stock PotsWhile consumers love using our classic stock cubes to add flavour to their meals, research shows they’re also looking for ever more exciting flavours that deliver great taste in easier to use formats.
OXO Stock Pots are made from our special blend of real meat juices, vegetables, herbs and seasoning, contain no artificial flavours or colours and are all completely gluten free. The chicken and beef varieties are also available in reduced salt variants. Backed by a new TV ad campaign OXO Stock Pots helped to deliver sales growth for OXO during the period.
Paul Hollywood In February 2016 we launched our first new brand in 20 years. The Paul Hollywood range of bread, savoury and sweet mixes is based on Paul’s ambition to give consumers the confidence to bake artisanal products in the comfort of their own home. Recipes were developed by Paul himself in close collaboration with the Company and bring an exciting new level of innovation to the home-baking market to help grow the overall category.
Continued increase in consumer marketing spend
£33m
£25m
£36m
2014/15
2013/14
2015/16
Premier Foods plc Annual report for the 52 week period ended 2 April 201614

Bisto Spare Chair Sunday campaignIn 2015 Bisto teamed up with charity partner, Contact the Elderly, to launch a nationwide initiative encouraging people to offer a ‘spare chair’ at their Sunday dinner table for an older person in their community.
‘Spare Chair Sunday’ was supported by a brand new advertising and integrated media campaign to highlight the problem of loneliness amongst older people in the UK and request people to volunteer. The campaign has been hugely successful so far encouraging hundreds of new volunteers to host a lunch, beating all expectations.
Photo: Campaign spokesperson and TV personality, Rachel Riley, hosting a Spare Chair Sunday. To find out more information or to join this important initiative go to:
www.bistotogetherproject.com
INTRODUCTION STRATEGIC REPORT GOVERNANCE FINANCIAL STATEMENTS 15

STRATEGIC REPORT
Investing in commercial expertiseOver the course of the year we’ve strengthened our commercial teams, recognising the importance of people and expertise in delivering our growth agenda. We’ve been successful in attracting high calibre individuals with valuable sales, marketing, insights, innovation and international experience who are already making a major contribution to our growth plans.
Having the right experience and expertise is an important part of our growth strategy. We’ve consequently been strengthening our commercial teams in key areas and ensuring that they have the right training, technology and leadership to be able to deliver our growth ambitions.
This is particularly important given changing shopping behaviour and the growth of different channels beyond the supermarket. Each channel demands its own expertise to help maximise the opportunities, whether this be in improving the visibility of our brands when shopping online, or managing a different route to market for ‘Cake on the go’.
In addition, we’re continuing to build our understanding of consumers and shoppers through hiring dedicated experts and investing in new tools such as our state-of-the-art merchandising and insights facility known as PRISM. PRISM is a virtual reality store where we can see our products in the context of the full supermarket aisle and instantly create a life-like version of fixtures. This enables us to review our products against competitors and plan for effective in-store activation with our customers in an entirely new, modern and cost effective way.
Experience and expertise is also important when it comes to developing growth opportunities for our brands internationally. Over the past year we’ve significantly increased the size of our International team from 9 to 28 colleagues. We have ambitious plans to further accelerate growth with the expansion of our cake brands in the USA and other geographies utilising our differentiated UK brands, formats and packaging.
Online According to the Institute of Grocery Distribution, online food shopping is forecast to be the fastest growing channel by 2020. Our brands are growing rapidly in this channel but it’s important we have the right experience and expertise to grow them faster. In July 2015 we appointed a new head of e-commerce with a new focused online team. This will help us to create a more systematic and structured approach online across our entire brand portfolio. We are also undertaking detailed research on the most effective ways to engage shoppers and drive sales. Our ambition is to grow our sales online ahead of the market.
International To expand the opportunities for our brands overseas, we’ve trebled the size of our International team and delivered immediate results with sales up 18% in the year, on a constant currency basis. We’ve experienced strong growth in cake sales in Australia and also with the Sharwood’s brand in the USA as more Americans develop a taste for Indian food. We’ve also continued to build momentum in Ireland with our pipeline of new products. In March 2016 we announced the appointment of Jette Andersen as the new Managing Director of our International SBU.
Photo: Adam Buckley, International Sales Director with the Rt Hon Elizabeth Truss MP, Secretary of State for Environment, Food and Rural Affairs hosting a curry evening with Sharwood's in Washington, DC, to showcase British food and drink in the USA.
Premier Foods plc Annual report for the 52 week period ended 2 April 201616

‘Cake on the go’Snacking ‘on the go’ is a large and growing sector although cake currently represents only a small part of the market. To help take advantage of this opportunity we’ve recruited a dedicated ‘Cake on the go’ team to manage this channel. In 2016, we’re launching new twin pack formats of Mr Kipling snack pack slices and Cadbury Mini Rolls in a range of convenience outlets providing a welcome alternative to confectionery and biscuits and a significant new growth avenue for our business.
INTRODUCTION STRATEGIC REPORT GOVERNANCE FINANCIAL STATEMENTS 17

STRATEGIC REPORT
Delivering growthOur investment strategy is starting to deliver results. In 2015/16 we continued to focus investment on six of our eight largest brands – Bisto, OXO, Loyd Grossman, Sharwood's, Mr Kipling, and Cadbury cake. As a result, these brands have collectively delivered sales growth of 3.4% in the year. In 2016/17 we plan to expand this investment to two more of our famous brands, Ambrosia and Batchelors.
The rejuvenation of the cake category is a great example of our strategy in action. Following a period of category decline, we invested in creating a dedicated business unit for Sweet Treats in 2014 with a new management team. By developing a stronger understanding of changing consumer needs, a robust plan was developed to improve the relevance, quality and range of our leading brands, Mr Kipling and Cadbury cakes.
A significant number of new products were launched during the year from the Mr Kipling ‘Exceedingly Good’ range of slices with wholesome ingredients to Cadbury Amaze Bites brownie cakes. This was supported by increased investment and marketing including new TV advertising and in-store merchandising.
We also continued to invest in our manufacturing capability to expand the product and packaging formats available and improve efficiency.
As a result of this investment sales within Sweet Treats grew 3.4% in 2015/16. Building on this success, we’re continuing to invest this year in developing formats to drive growth in the expanding ‘on the go’ market.
We are also extending our strategy to other brands in our portfolio with new products based on clear consumer trends. For 2016/17 this includes Ambrosia Deluxe custard and frozen custard ice cream and Batchelors high protein and high vegetable pots.
Major capital Investment In 2015 we completed a major £20m investment in a new automated Mr Kipling snack pack slice line at our Carlton bakery using innovative robotic technology. The new line can produce around 1,000 slices per minute with an annual capacity of around 300 million slices per year! It also gives us flexibility to produce a wider range of snack pack formats from a twin pack format for ‘Cake on the go’ to nine-slice format for families.
The new line was officially launched in June 2015 following a successful analyst and investor day held at the bakery to highlight our exciting innovation plans for Sweet Treats.
New Mr Kipling marketing campaign During 2015 we rolled out a new logo and packaging across the whole range, leveraging Mr Kipling’s heritage and values of quality and craftsmanship.
To continue momentum behind the UK’s number one cake brand, we’re making a £4m investment behind Mr Kipling including a new £2.5m TV campaign, launched in April 2016, with the brand’s new message that Mr Kipling is an ‘Exceedingly Good Distraction’.
Premier Foods plc Annual report for the 52 week period ended 2 April 201618

New Cadbury Amaze BitesWe launched a new product targeted at the adult snacking occasion and packaged in a convenient re-sealable tub. Cadbury Amaze Bites are bite-sized brownies covered in Cadbury chocolate, with a double-blended cake texture inside. They are available in three flavours – Double Chocolate Brownie, Chocolate & Orange and Chocolate & Mint.
INTRODUCTION STRATEGIC REPORT GOVERNANCE FINANCIAL STATEMENTS 19

2013
STRATEGIC REPORT
Key performance indicatorsWe use a large number of performance indicators to monitor financial, operational and responsibility performance. These are reviewed on a daily, weekly or monthly basis by our senior management teams. Strategic performance indicators are reviewed by directors at Board meetings. These indicators are used to encourage focus and measure performance across a range of areas and to highlight areas for attention and corrective action, as well as recognising good performance and celebrating success. Health & Safety and environmental performance is reported in detail in the section on our responsibilities on pages 22 to 27.
£767.4m
4.0x
£131.0m
(16.8)%
£803.3m
5.3x
£139.9m
55.6%
£771.7m
3.6x
£131.0m
48.6%
2014/15
2013/14
2014/15
2014/15
2013
2013/14
2015/16
2015/16
2015/16
2014/15
2015/16
Why is this important? Investing behind our brands to support long-term sustainable growth is one of our strategic priorities. Over the year we have amended our sales KPI from branded sales to total sales. This captures performance across all channels, including hard discounters who are predominantly non-branded.
Progress we’ve made Our investment in marketing and new products has resulted in six of our eight largest brands growing sales and overall Group sales increased 0.6% in the year. For 2016/17 we are extending our investment strategy to Ambrosia and Batchelors.
Why is this important? The ratio is tied with the Company’s priority to organically deleverage the business. Our banking arrangements allow the resumption of dividend payments when the ratio drops below 3.0x.
Progress we’ve made Net debt has reduced significantly over the last few years from £830.8m in 2013 to £534.2m in 2015/16. Over the year net debt has reduced by 8.7%. The Company’s medium-term leverage target is 2.5x.
Why is this important? This measure reflects the measurement of revenues and costs associated with the operational performance of the business and is also a good proxy for the cash generative capacity of the business. It is also a key measure used by the market.
Progress we’ve made We have delivered trading profit of £131.0m in line with last year and our expectations. We spent approximately £3m more on consumer marketing in the year and plan further investment behind our brands in 2016/17 to accelerate our growth strategy. See the Chief Executive's review on pages 6 and 7.
Why is this important? Cash flow as a % of EBITDA is a good indicator of the underlying quality of earnings and the overall health of the business. It also identifies cash available to repay debt and also to invest in our brands as part of our category growth strategy.
Progress we’ve made We maintained tight control of cash during the year with capital expenditure, interest, pensions and working capital all in line with the Group's expectations. The business remains cash generative, allowing us to pay down debt and reinvest behind our brands.
Group sales Year-on-year growth in sales.
Net debt/EBITDA ratioThe ratio measures the Company’s overall level of debt. It is calculated as the Company’s interest bearing borrowings, less cash, divided by its EBITDA.
Trading profit (Underlying) Trading profit is defined in the Operating and financial review on page 38.
Recurring cash flow as a % of EBITDA Cash flow is before non-recurring items such as the proceeds from disposals and associated restructuring costs and financing fees.
Premier Foods plc Annual report for the 52 week period ended 2 April 201620

Consumers BrandsDelivering category growth
Generating shareholder value
How KPIs link to our strategy
Our responsibilities
CostsCustomers
28.7% 25.1%
96%
11.3%
52%
96%
6.9%
37%
28.2% 25.1%
95%
18.1%
67%
2014/15 2014/15
2014/15
2014/15
2014/15
2013/14
2013/14
2013/14
2015/16 2015/16
2015/16
2015/16
2015/16
Why is this important? Increasing market share indicates consumer preference for our products and also demonstrates successful partnerships with our customers to grow the overall categories in which we operate.
Progress we’ve made Good progress was made in certain Grocery categories offset by declines in Quick meals & soups. We held share within Ambient Cake following a strong performance in Sweet Treats over 2015/16.
Why is this important? This is an important measure of the quality of our product portfolio. It drives recipe improvements and ensures focus on consistent product quality.
Progress we’ve made Overall performance was broadly in line with prior year. The review covered 71% of our branded portfolio (by retail sales value) as part of a two year rolling programme. We will continue to focus on consumer quality benchmarking and reformulate any products testing below par.
Why is this important? In order to generate category growth we must focus on innovation. This measure is an important indicator of whether we are responding to consumer trends. Our medium-term goal is generate 20% of sales from new products.
Progress we’ve made We have seen a step change in the delivery of innovation with sales from new and improved products increasing from 6.9% in 2013/14 to 18.1% in 2015/16. Over the year we launched over 130 new products. We will continue to invest in our innovation teams to further strengthen our pipeline.
Why is this important? Aligns with our insights which highlight consumers' increasing focus on ‘better-for-you’ options. Further information on health and nutrition is set out in the section on our responsibilities on pages 22 to 27.
Progress we’ve made Over the course of the period 67% of new product launches delivered a claimable nutritional benefit or calorie reduction. As set out in our Commitment to Healthier Choices (see page 22) we have set a three year target to ensure that at least 75% of new products we launch each year across our Grocery portfolio will provide ‘better-for-you’ choices.
Branded market shareFor Grocery this is the percentage of the total sales of our branded products within the four Grocery categories in which we participate. For Sweet Treats this is our branded share of the Ambient Cake category. (Based on IRI data 52 weeks ending 2 April 2016).
% of products testing superior or at par with competitorsConsumer panel blind testing of our major branded products against their main competitor, whether branded or own label.
% of sales from new productsSales of new products as a % of our branded sales. New products include new product launches and extensions to existing ranges. (Based on IRI Total Grocers 19 March 2016).
% of NPD to be ‘better-for-you’ choicesSales value of new product launches with a claimable nutritional benefit or calorie reduction (excludes extensions to existing ranges).
Grocery Sweet Treats
INTRODUCTION STRATEGIC REPORT GOVERNANCE FINANCIAL STATEMENTS 21

We focus on areas that are important to our business and where we feel we can make the most positive contribution: encouraging healthier food choices, developing and engaging our people and promoting a sustainable supply chain.
Encouraging healthier food choicesHealth remains important to consumers and making the right food choices is a priority. With a growing obesity challenge in the UK, the nation’s diet is also becoming increasingly important to policy makers. Over the last year the role of sugar has in particular received higher attention.
For many years we’ve been adapting our recipes, portion sizes and labelling to encourage healthier food choices, whilst still making sure we don’t compromise on the quality and taste our consumers expect. We’ve also made sure we advertise and promote our products responsibly, particularly when it comes to children.
But we recognise there is more to do, both to meet a growing demand for healthy options, and to contribute to a broader effort by Government, food manufacturers, retailers and others to encourage healthier food choices.
During the year we reviewed our nutrition strategy and agreed a number of new commitments over the next three years. These include plans to reduce the amount of added sugar in our products, introduce calorie caps for individual cakes and expand the proportion of single portion packs as a percentage of our portfolio. We’ll also build on our strong track record by further reducing the level of salt in our food and increasing the number of new products that have a health or nutritional benefit, including launching products with more wholesome ingredients. We’ve additionally committed to avoiding marketing or advertising products considered high in fat, salt or sugar directly to children under 16 years of age. And we’ll be expanding healthy eating programmes at our sites to encourage our colleagues to make healthier choices.
STRATEGIC REPORT
Our responsibilitiesBeing responsible and sustainable underpins our business strategy and is crucial to how we drive growth, productivity and reputation in the longer-term interest of our shareholders, colleagues and all those who touch our business.
Our Commitment to Healthier ChoicesOver the next 3 years we are committed to:
1. Removing 1,000 tonnes of added sugar from our portfolio by 2018 (vs 2015 base year), primarily through a 4–10% reduction across our cake, desserts and cooking sauce brands.
2. Ensure at least three-quarters of new products we launch each year across our Grocery portfolio provide consumers with a nutritional benefit or calorie reduction.
3. Introducing calorie caps for Mr Kipling cakes. By 2018, all individual cakes will be 150 calories or less, all pastry products will be 200 calories or less, and all celebration, premium and seasonal cakes will be 350 calories or less per portion.
4. Continue expanding the proportion of single portion packs of cake from 40% to at least 50% of our branded cake portfolio by 2018, to help consumers control their intake.
5. Launching nutritious new products, including a range of affordable quick meals with higher levels of fibre, protein and micro nutrients.
6. Reducing salt to meet the Government’s 2017 salt
targets in relevant categories, and ensure all new products are in line with these targets.
7. Prohibiting the advertising or marketing of foods high in sugar, salt or fat in any broadcast and non-broadcast media directly targeted at children under the age of 16.
8. Helping improve consumer understanding of nutrition by enhancing the information we provide through our own communications channels and continuing to champion front of pack traffic light nutrition labelling.
9. Working with our suppliers to create innovative new technologies, ingredients and products that will provide a nutritional benefit to our brands.
10. Expanding healthy eating programmes across all of our factories and offices to encourage colleagues to make healthier choices.
More than half of Homepride cooking sauces now contain one of your five a dayDuring the year we’ve been improving the recipes of our Homepride cooking sauces to provide consumers with even more ways to cook affordable nutritious meals. Half the entire range now has higher vegetable content with at least one of your five a day. We’ve also continued to reduce salt levels across the range to meet the Government’s 2017 salt targets. And in 2016/17 we’re working on adding 50% more vegetables to Homepride Pasta Bake sauces as well as removing added sugar.
Premier Foods plc Annual report for the 52 week period ended 2 April 201622

'Exceedingly Good' CakesNearly two thirds of UK adults (63%) think health is an important factor when doing their food shop, so we continually work to reduce calories, fat, sugar and salt across all our brands, while maintaining the high quality and great taste our consumers expect.
Responding to consumers’ desire for ‘better-for-you’ products, we recently launched Mr Kipling 'Exceedingly Good' cake slices with added wholesome ingredients.
Full of golden oats and dried fruits including cranberry, orange and coconut, our new slices – in delicious Cranberry & Orange and Dark Chocolate & Coconut varieties – contain less than 140 calories and one gramme or less of saturated fat per slice.
To help our consumers keep on top of their portion size and calorie intake, our 'Exceedingly Good' slices come individually wrapped in our popular snack pack format.
INTRODUCTION STRATEGIC REPORT GOVERNANCE FINANCIAL STATEMENTS 23

STRATEGIC REPORT
Our responsibilities continued
Feeding Britain’s FutureIn 2015/16 we continued our support of the Institute of Grocery Distribution’s (IGD) Feeding Britain’s Future campaign through its extension to Years 9–12 school children. Representatives from Premier Foods helped facilitate sessions with the participants to encourage them to think about the world of work before they finish their studies and start the search for a job. Our CEO, Gavin Darby, also dropped into a session to encourage the participants and talk about his own experiences and the career opportunities available in the food industry. The IGD campaign reached 5,000 school children in 2015 with plans to expand to 7,000 children in 2016. Volunteers from Premier Foods will be participating in around 50 school sessions in 2016.
www.premierfoods.co.uk/responsibility/skills
PeopleInvesting in skills We’re committed to developing the skills of young people and strengthening the talent pipeline needed to ensure our future success.
Throughout the past year we’ve continued to invest in taking on apprentices, particularly in engineering, to help support our focus on innovation. We currently have around 30 apprentices across our business with plans to take on more in the coming years in line with the ambitions of the food industry and in anticipation of the new Apprenticeship Levy. To support our commitment, we invested in a new apprentice training centre at our Mr Kipling bakery in Carlton in 2015. More broadly, we also continued our support for the new Food Engineering degree course and National Centre of Excellence for Food Engineering at Sheffield Hallam University.
Despite falling rates of unemployment overall, the rate of youth unemployment remains high. Along with others in the food and grocery industry, we continued to play our part in addressing this issue through our support for the IGD's Feeding Britain’s Future campaign. Since its inception in 2012, the Group has offered more than 1,000 pre-employment training opportunities to unemployed youngsters aged 18–24, helping them with basic job search skills such as CV writing and interview techniques. The programme has also provided an opportunity to illustrate the range of career options in the food industry and in 2015 was extended by the IGD to Years 9–12 school children.
Colleague communication and engagementWe recognise the value of good communication in engaging our colleagues to achieve common goals. In the year we extended our suite of communications channels further to include large digital news screens at every site adding to our mobile-enabled intranet, monthly printed and digital newspaper, weekly news roundup email and posters. We also
started to video stream our CEO-led monthly briefing sessions directly to all sites in addition to cascading through local briefings. We continued to encourage colleagues to engage with their local communities through supporting local charities and by fund-raising for our corporate charity partnership with Cancer Research UK. All of this and more led to significantly improved feedback in all categories of our 2015 ‘Recipe for Success’ colleague engagement survey which achieved 84% participation up from 78% in 2013. To demonstrate that we take all colleagues’ views seriously, senior management road shows were held at all sites to communicate the results of the survey and an action plan is in place for 2016/17 to drive further improvement.
In addition, we consult colleagues where appropriate on major changes to the business, and with most colleagues being shareholders, we encourage them to vote in advance of our AGM.
Premier Foods plc Annual report for the 52 week period ended 2 April 201624

Progress we’ve madeWe were delighted that our Andover, Charnwood and Worksop sites went a full year without a single LTA. This helped achieve an overall 24% reduction in the year.
Progress we’ve madeNot a single RIDDOR was recorded at any site for the second half of the year helping our RIDDOR rate to also achieve a downward trend in the year.
A responsible employerWe’re committed to ensuring that the people who work for us are treated with respect, and that their health, safety and basic human rights are protected and promoted.
DiversityWe recruit, train, promote and retain skilled and motivated people irrespective of gender, age, marital status, disability, sexual orientation, gender identity, race, religion, ethnic or national origin. It’s our policy to give full and fair consideration to applications for employment received from disabled persons, having regard to their particular aptitudes and abilities. Wherever possible we will continue the employment of, and arrange appropriate training for, employees who have become disabled persons during the period of their employment. The Group provides the same opportunities for training, career development and promotion for disabled people as for other colleagues.
Increasing the participation of women across all levels of the organisation is a particular priority. In 2015/16, we made significant progress in improving the representation of women in our senior management population, including the appointment of Jette Anderson as Managing Director of our International SBU. Jette also became the first female member of our Executive Leadership Team. Details of our gender diversity across the Board of directors, senior management, central functions and the Group as at 2 April 2016 are set out below.
Health & SafetyHealth & Safety is taken extremely seriously by management at all levels in the Group, and we’re proud to have one of the lowest accident rates in the food industry. Our unique, inclusive approach to hazard identification and control, our 'Total Observation Process', is a vital preventative tool in making our factories safer places to work and is a key ingredient of our industry leading performance as indicated by the chart below.
Premier Foods has a leading Health & Safety record (as at 2 April 2016)
At every scheduled Board meeting, directors review our Health & Safety performance which includes two important measures; Lost Time Accidents (LTA), which represent accidents that result in a colleague having to take any time off work and Reporting of Injuries, Diseases and Dangerous Occurrences Regulations (RIDDOR) which is the standard regulatory measure of identifiable, unintended incidents, which cause physical injury.
Central functions
Gender Diversity(% female as at 2 April 2016)
PLC Board
2014/15
2014/15
2014/15
2013
2013
2013
2015/16
2015/16
2015/16
2014/15
2013
2015/16
Senior management All colleagues
29% 44%
39% 36%
25%
25%
46%
37%
25%
19%
45%
23%
LTA
2015/16 0.16
RIDDOR
2015/16 0.06
2014/15 0.085
0.50
Aiming Higher to support Cancer Research UKSupporting the communities in which we operate, locally and nationally, is a part of the DNA of our business, and a powerful way to engage our colleagues. Collectively, we’ve already raised over £200k towards our £250k two year target for our charity partner, Cancer Research UK. Numerous fundraising events last year included raft races, bake sales, dog walking days, football shirt Fridays and our Aim Higher Challenge, during which 150 colleagues spent a day cycling up to 115 miles or trekking 24 miles through the Yorkshire Dales!
www.premierfoods.co.uk/responsibility/charity-community
2014/15 0.21
0.24
0.06
UK Manufacture
of Food Products
All UK Manufacture
Premier Foods
All
RID
DO
R a
ccid
ents
per
10
0,0
00
ho
urs
wo
rked
INTRODUCTION STRATEGIC REPORT GOVERNANCE FINANCIAL STATEMENTS 25

Stronger TogetherPremier Foods is committed to tackling all forms of hidden labour exploitation, including slavery and human trafficking and has policies and procedures in place to identify and eradicate these practices. Early in 2016 we became a business partner of ‘Stronger Together’, a multi-stakeholder initiative of employers, labour providers, workers and their representatives focused on addressing modern day slavery and third party exploitation.
As part of our support for 'Stronger Together', our Human Resources teams have received specific training on labour exploitation and we’ve stepped up our communications to colleagues and new starters, including promoting a confidential helpline for colleagues to report any hidden cases of labour exploitation. All of our manufacturing sites have been audited internally to support compliance with our policy and to identify areas of best practice that can be shared across the Group.
We also make sure that all of our recruitment and outsourcing partners are aware of, and agree to, the principles of our policy, and we expect them to communicate to us the steps they take in their own organisations to prevent hidden labour exploitation.
To read our Modern Slavery Act statement, go to our website:
www.premierfoods.co.uk/responsibility
STRATEGIC REPORT
Our responsibilities continued
Sustainable supply chainFrom farm to fork, we work tirelessly to produce and deliver the best quality products in a safe, ethical, environmentally sustainable and efficient way. The vast majority of the food we make is produced in the UK using predominantly ingredients, goods and services provided by UK suppliers and farmers helping keep supply chains short and standards high.
Ethical supply chainWe champion high ethical standards throughout our supply chain. Premier Foods is a founding member of Sedex (the Supplier Ethical Data Exchange), a not-for-profit organisation dedicated to driving improvements in responsible and ethical business practices in global supply chains through the sharing of data. We equally ask all of our ingredient and packaging suppliers to become members so that we have visibility of their ethical performance, helping us assess any risks in our supply base against our ethical trading policy and to target relevant suppliers for auditing using our own protocols as well as Sedex Member Ethical Trade Audits (SMETA). These checks cover compliance with local laws and regulations as well as minimum standards of labour rights and Health & Safety. At year end we had 240 active Sedex direct suppliers accounting for 95% of our direct spend.
Animal welfare High standards of animal welfare have always been important to us. In 2012 we committed to use only cage-free eggs in our products and for many years the milk and dairy products we use have met Red Tractor assured food standards. In 2015/16 we reviewed and strengthened our animal welfare policy as the basis to expand dialogue with our suppliers about further improvements. This step was recognised by The Business Benchmark on Farm Animal Welfare (BBFAW), an annual scorecard of how 90 of the world’s leading food companies are managing and reporting their farm animal welfare policies and practices.
Premier Foods’ BBFAW score improved compared to the previous year, moving us from the fifth to the fourth tier (of six). We intend to build upon this progress in 2016/17 through initiating further dialogue with our suppliers.
Greenhouse gas (GHG) emissions reportingThe Companies Act 2006 (Strategic Report and directors’ Reports) Regulations 2013 requires quoted companies to report on environmental matters to the extent it is necessary for an understanding of the company’s business within their annual report, including where appropriate the use of key performance indicators (KPIs). In the table below we have detailed our scope 1 & 2 GHG emissions for the period 1 January 2014 to 31 December 2015 from a 2011 baseline year. While the financial year end of the Company has changed from 31 December, the regulations permit environmental reporting for a period outside of a company’s financial year. To assist users in comparing 2015 performance with that of 2014, we have removed sites which separated from the Group under the Hovis joint venture and the Knighton Food business during 2014. The intensity increases over base year, 2011, have arisen from the divestment of low energy use/high production tonnage sites, such as flour mills.
GHG Emissions 2015 2014
Base Year (2011)
Scope 1 44,397.73 41,476.78 158,164.71
Scope 2 39,365.63 42,940.71 133,046.62
Total annual net emissions 83,763.36 84,417.49 291,211.33
Overall Intensity (kgCO2e per tonne of product) 251.15 258.14 143.3
MethodologyPremier Foods’ GHG emissions were assessed and calculated using internal data and emission factors from Defra’s Conversion Factors for Company Reporting 2014 for converting energy usage to carbon dioxide equivalent (CO2(e)) emissions. We have followed the methodology in the GHG Protocol Corporate Accounting and Reporting Standard (revised edition). The analysis has used an operational control approach. This assessment takes into account all of the emission sources required under the Companies Act 2006. The emissions data relates to all production sites within the control of the Company during the period.
Premier Foods plc Annual report for the 52 week period ended 2 April 201626

Courtauld 2025In March 2016, Premier Foods was announced as one of the principal signatories of the Courtauld Commitment 2025, an ambitious ten year voluntary commitment that brings together organisations across the food and grocery sector to make food and drink production and consumption more sustainable.
Along with the other signatories from the retailer, food manufacturing, hospitality and Local Authority sectors, we collectively committed to the following three goals, calculated as a relative reduction per head of population:
• 20% reduction in food & drink waste arising in the UK;
• 20% reduction in the greenhouse gas intensity of food & drink consumed in the UK; and
• A reduction in impact associated with water use in the supply chain.
Building on the progress we’ve made through our commitment to previous Courtauld agreements, we have committed to work with the Waste Resources Action Programme (WRAP) and other signatories to develop best practice, implement change and report annually against four key areas: 1) finding innovative ways to make best use of the wastes and surpluses; 2) optimising the whole supply chain to produce more with less; 3) embedding new criteria into design, buying and sourcing; and 4) influencing consumption behaviours and reducing waste.
Environmental performance 2015/16 vs 2014/15
2014/15
2014/15
2014/15
2015/16
2015/16
2015/16
275
704
79,611
Total energy usage: Gigawatts
Total (non-ingredient) water usage: Megalitres
CO2(e) emissions:Metric tonnes
254
658
72,374
2015/16 Target
2015/16 Performance
2016/17 Target
Maintain zero waste to landfill (Absolute)
Zero Reduce waste (RDF) to incineration by
-1.5%
Reduce energy consumption by -2.5%
+4.7% -1.5%
Reduce (non-ingredient) water usage by -2.3%
+8.3% -1.5%
Reduce Carbon equivalent (CO2(e)) emissions by -1.5%
-0.1% -1.5%
Environmental performance
We're continually looking for ways to reduce our environmental footprint. Each year we set challenging targets for each of our sites to reduce their energy, water, waste and carbon dioxide equivalent (CO2(e)) emissions. We encourage all of our colleagues to play their part through our 'Green Matters' initiative, an internal environmental campaign which has seen the identification and training of 47 Environmental Champions across our sites, who have helped deliver a reduction in CO2(e) at 6 out of 9 sites. In the year we also began to work with The Woodland Trust. Under their 'Woodland Carbon' scheme we have committed to planting new native woodland in Britain, linked to our site CO2(e) reduction performance. Based on this year's CO2(e) reduction alone, an area of 4.6 acres of woodland will be planted, which in time will remove a further 755 tonnes of carbon. We're also aiming for all of our sites to be certified to the globally recognised standards of environmental management, through ISO 14001, by the end of the 2016/17 financial year.
During the period we successfully maintained our zero waste to landfill target and set new targets to reduce the amount of waste sent to incineration. The overall amount of waste to incineration reduced by 2.8% as a result of improved segregation and awareness. Other goals have proved more challenging to achieve. As we increased production units, stepped up our rate of new product innovation and invested in line automation, energy usage grew overall and our use of non-ingredient water expanded as we increased manufacturing flexibility and improved customer service.
CO2(e) emissions per tonne marginally decreased, however, the 2015/16 reduction target was not achieved due to a changing mix of products as we move to a wider range of pack sizes and weights to meet consumer trends. More modest reduction improvement targets have been set for 2016/17 taking account of the changing mix and profile of our portfolio. The below chart sets out our environmental performance for the year on an absolute basis, whilst the table sets out environment targets and perfomance as relative measures, based on tonnes of product manufactured, unless otherwise stated.
INTRODUCTION STRATEGIC REPORT GOVERNANCE FINANCIAL STATEMENTS 27

Board accountabilityThe Board has ultimate responsibility for the effective risk management of the Group’s strategic objectives. The Group has a well-established process which has operated throughout the year that identifies and monitors the key strategic and operational risks, ensures appropriate mitigating activities and reports on their effectiveness.
The Board has considered and approved the risk management policy, the risk appetite of the Group (discussed below) and has delegated the review of the risk management process to the Audit Committee. The Audit Committee receives regular reports from management and internal audit detailing the risks that are relevant to our business activity, the effectiveness of our internal controls in dealing with these risks and any required remedial actions along with an update on their implementation.
The Audit Committee reports to the Board on the effectiveness of the risk management process. Day-to-day risk management is the responsibility of senior management as part of their everyday business processes and is underpinned by the Group’s policies and procedures to ensure this is fully embedded.
There is a structured business review process that operates across all business areas which management report to the Board and this, along with the corporate governance framework, further underpins the ongoing management of risk.
Management controlsThe internal control system provides senior management with an ongoing process for the management of the risks that could impact on the fulfilment of the Group’s business objectives. The system is designed to manage rather than eliminate the risk of failure to achieve our business objectives and can only provide reasonable, not absolute, assurance against material misstatement. Our internal controls cover all areas of operations. The system also supports senior management’s decision making processes improving the reliability of business performance.
Corporate oversightRisk management – The Group operates a formal risk management process designed to provide information to the Board, drive internal audit activities and support the executive and senior management in identifying and mitigating the key risks facing the business on an ongoing basis. Collective top down executive reviews are conducted, as a minimum twice per annum, and detailed functional risk registers are maintained for each business area.
Financial control – The Group maintains a strong system of accounting and financial management controls. Our accounting controls ensure data in the Group’s financial statements are reconciled to the underlying financial systems. A review of the data is undertaken to provide assurance that the position of the Group is fairly reflected, through compliance with approved accounting practices.
The Group has a dedicated team of finance managers aligned to business areas, supported by systems to provide the best available decision making information to management on an ongoing basis. This is reflected in an annual budgeting process, monthly management reporting and ongoing investment appraisal.
Treasury risk management committee – This Committee focuses on the commodities purchased by the Group, reviewing our policies and operational delivery with respect to forward trading and foreign exchange exposures.
Health & Safety – The Group maintains an ongoing programme of Health & Safety audits and has established internal Health & Safety compliance tours at all factory sites.
STRATEGIC REPORT
Managing our risksFood safety – The Group has developed and implemented corporate technical standards and established an ongoing food quality and safety compliance programme which audits all factory sites and major suppliers. This supplements internal testing facilities established as part of our internal control system which confirm food quality, safety and authenticity.
Internal auditThe Audit Committee annually reviews and approves the internal audit programme for the year. The Committee reviews progress against the plan on a quarterly basis considering the adequacy of audit resource, the results of audit findings and any changes in business circumstances which may require additional audits.
The results of internal audits are reported to the Executive Leadership Team and senior management and where required corrective actions are agreed. The results of all audits are summarised for the Audit Committee along with progress against agreed actions.
Risk appetiteThe organisation’s approach is to minimise exposure to reputational, financial and operational risk, whilst accepting and recognising a risk/reward trade-off in the pursuit of its strategic and commercial objectives.
As a food manufacturing company, with many well known brands, the integrity of the business is crucial and cannot be put at risk. Consequently, it has a zero tolerance for risks relating to Health & Safety and food safety. The business, however, operates in a challenging and highly competitive market place and as a result it recognises that strategic, commercial and investment risks will be required to seize opportunities and deliver results at pace.
It is therefore prepared to make certain financial and operational investments in pursuit of growth objectives, accepting the risk that the anticipated benefits from these investments may not always be fully realised. Its acceptance of risk is subject to ensuring that potential benefits and risks are fully understood and sensible measures to mitigate risk are established.
Corporate Governance Framework
Board/Audit Committee
Executive Leadership Team
1st Line of defence
Operational Review
Internal control self
assessment
Management Controls
Documented policies
and procedures
Risk Registers
Risk Management
Financial Control
Treasury Committee
Health & Safety
Food Safety
Internal Audit Reports
Quarterly reporting to
Audit Committee
Internal Audit
2nd Line of defence 3rd Line of defence
Reg
ulato
ry Au
tho
rities
Extern
al Au
dit
Premier Foods plc Annual report for the 52 week period ended 2 April 201628

Changes since last yearThe business has continued to invest in its commercial capability since the business unit restructure announced in 2014, particularly in International where we have a new team and Managing Director in place. Our consumer focused growth strategy has demonstrated results in the areas where we have focused investment, such as Bisto, OXO, Loyd Grossman, Sharwood's, Mr Kipling and Cadbury cake. Growth has been driven by increased investment in marketing and innovation which is set to increase even further in the coming financial period. We have increased our 2016/17 and medium-term growth forecasts and supported this with the announcement of a number of new strategic initiatives including 'Cake
Impact
Hig
h
>80
%
High
Med
ium
20
–80%
Medium
£2m–£7.5m Profit impact
< £2m Profit impact
> £7.5m Profit impact
Low
<
20%
Low
Lik
elih
oo
d
1
3
5
7
8
6
42
1 Commercial arrangements
2 Commodity prices / Brexit
3 Regulatory and Government policy
4 Investments5 Pension fund deficit6 Innovation &
consumer trends7 Operational continuity8 Legal compliance
technology and infrastructure. Last year’s risk on reputation and stakeholder perception has been reduced through a review of corporate policies and their enforcement, as well as numerous high profile brand initiatives including charity and community partnerships. Effective resources and processes are in place to manage external communications and media responses where required.
Summary of major strategic & operational risksWe have focused on six key strategic risks which pose the greatest threat to the delivery of our strategy. We have also highlighted a number of operational risks which we believe are common to all food manufacturers under the headings; Operational continuity and Legal compliance. These risks are identified on the heat map below and are described in more detail on pages 30 and 31, together with a discussion of the mitigating activities we are taking to reduce the likelihood or potential impact of these risks. Our website also contains a more detailed discussion of operational risks seven and eight below.
on the go', expansion of our Grocery business into the chilled category, and further roll-out of cake into the USA following successful trials. We have recently entered into a Relationship agreement and co-operation agreement with Nissin, who are now also our biggest shareholder. The co-operation agreement identifies a number of opportunities to drive mutual growth including potential co-branding, distribution, manufacturing and technical innovation initiatives.
However, we continue to operate in a highly challenging environment and have raised our growth targets against a market undergoing price deflation. As a result, growth from new strategic initiatives may not be in line with expectations, or take longer than expected to deliver results. Long-term growth is dependent on innovation delivery, the success of which cannot be guaranteed. The success of our international growth strategy depends on identifying the correct business partners in our key territories (e.g. direct sales customers, strategic distributors and other partners). Increasing our international presence brings with it certain inherent risks and it is important that we have appropriate processes in place to mitigate these risks. A key focus for the business currently is the renewal of our Cadbury cake license, which will run for a period to expire not earlier than 30 June 2017, subject to 12 months rolling notice. The economic environment is a risk and our supply costs could be impacted by an increase in commodity prices. The upcoming EU referendum creates uncertainty over the exchange rate and could adversely impact input costs in the event of Britain leaving the EU. However, because the business is predominantly UK focused, Brexit is not expected to give rise to any other material commercial or operational risks. New Government regulations, particularly around obesity and sugar, could have an adverse impact, particularly in our Sweet Treats business. Our Hovis Joint Venture is included as a risk given the challenging trading conditions they are operating in, however, we have fully written off our investment in this company. We have also assumed control of the Knighton Foods business.
Last year’s report included a risk around organisational structure and capability which has now been mitigated by successfully embedding the new business structure, the recruitment of key vacancies with high calibre staff and ongoing investment in
Viability StatementIn accordance with provision C2.2. of the 2014 revision of the Code, the directors have assessed the prospect of the Group over a period significantly longer than 12 months. The directors believe that an assessment period of three years is appropriate based on the following considerations:
• The Group’s strategic review covers a three year period; and
• The Group’s current financing arrangements are in place for the next 3 years and pension deficit cash contributions are fixed for at least this period.
Taking into account the Group’s current position and its principal risks, the directors have a reasonable expectation that the Group will be able to continue in operation and meet its liabilities as they fall due over three years. The directors’ assessment included a robust review of the financial impact of the most severe but plausible scenarios that could threaten the viability of the Group and the likely effectiveness of the potential mitigations that management reasonably believes would be available to the Group over this period.
In assessing the prospects of the Group, the directors noted that such assessment is subject to a degree of uncertainty that can be expected to increase looking out over time and, accordingly, that future outcomes cannot be guaranteed or predicted with certainty.
INTRODUCTION STRATEGIC REPORT GOVERNANCE FINANCIAL STATEMENTS 29

STRATEGIC REPORT
Managing our risksStrategic risks Mitigating activities
1. Commercial arrangementsDelivery of the Company’s commercial objectives is dependent on a number of key arrangements with customers, suppliers and distributors. A large proportion of our revenue derives from sales to the major UK retailers who are themselves under significant pressure due to continuing structural changes in grocery retailing. New strategic initiatives around ‘Cake on the go’, our planned expansion into the chilled Grocery segment and increased focus on International markets expose us to risks and uncertainties associated with operating in new categories, markets and/or customers. Growth may not be as strong as expected and/or may take longer than expected to be delivered. However ‘Cake on the go’ is considered to be the lowest risk of these new initiatives. We have a key licensing agreement for use of the Cadbury brand (which runs at least until 30 June 2017 with an extension currently being negotiated). Failure to renew this license could have implications for our Cadbury manufacturing site at Moreton. Other licensing agreements include Loyd Grossman (which continues until 2026 but is dependent on achieving performance targets) and a new agreement with Paul Hollywood to support a range of home baking products introduced to the market in the last quarter of 2015/16, also subject to performance targets.
2. Commodity prices / BrexitThere is a risk that commodity prices may increase over the time frame of our strategic plan which could impact margins and/or our ability to invest in marketing and capital expenditure activities. Additionally, if the upcoming referendum results in the UK leaving the EU, the subsequent forecasted devaluation of sterling would have an adverse impact on imported raw material costs, only partially offset by positive currency benefits in our international business.
3. Regulatory and Government policyThe business may be subject to significant new regulatory compliance requirements as a result of Government policies, including potential measures to address the obesity issue which could adversely impact our business, particularly in Sweet Treats. New legislation on the National Living Wage and the Apprenticeship Levy could also adversely affect margins. Corporate tax legislation changes, although currently unconfirmed, could impact our ability to utilise tax losses in future.
We have worked closely with our major customers to agree business plans that are strategically aligned and reflect mutual growth opportunities and have strengthened customer relationships through our category management activities. Strategic initiatives to grow our business with discounters, convenience, online and international markets will broaden our customer base and reduce the dependence on major retailers. We have significantly increased our investment in our commercial teams to support our growth plans. The non-branded business has seen substantial growth. The ‘Cake on the go’ offering aims to grow our share in the convenience market. New strategic initiatives are being implemented in a measured way through phased entry and are supported by trials where appropriate. In addition we expect that the new co-operation agreement with Nissin, announced in March 2016, will support our growth initiatives and create mutual opportunities to leverage brands, technology, presence in international markets and customer relationships. We enjoy good relationships with our licensed brand owners and are engaged in appropriate commercial discussions with them. This is supported by successful recent innovation activity, particularly with Cadbury.
Hedging activity and ongoing supplier risk management and price negotiation processes are in place to mitigate the impacts of commodity price inflation. Appropriate assumptions for movements in commodities and foreign exchange have already been reflected in the current budget and business plan. If commodity price increases are significant, we could seek to recover these through price increases to our customers.
We are taking pro-active steps to reduce the sugar and calorie content in our products and have published a nutrition strategy with ten commitments to healthier choices (for further information see page 22). Innovation activities are also focused on improving health aspects of our product portfolio. We actively engage in regulatory discussions with trade bodies such as the Food and Drink Federation (FDF). The business is currently reviewing its short and long-term strategy with regard to the National Living Wage and Apprenticeship Levy. We will monitor changes to tax legislation and review our tax strategy accordingly.
Premier Foods plc Annual report for the 52 week period ended 2 April 201630

Strategic risks
Operational risks
Mitigating activities
Mitigating activities
5. Pension fund deficitThe Group supports a number of significant pension schemes which are in deficit on a technical provisions basis. The resulting balance sheet assets and liabilities may fluctuate due to factors outside the Group’s control.
6. Innovation and consumer trendsThe Group's portfolio of products needs to align with changing consumer requirements, particularly trends towards healthy eating, convenience, ‘real food’ and indulgence. This needs to be delivered through effective innovation and marketing activity supported by appropriate manufacturing capability.
4. Investments The Group could be exposed to reputational and/or financial risks through the activities and performance of its Hovis Joint Venture and the Knighton Foods business, previously a joint venture and now fully controlled by the Group.
Under certain circumstances, as a result of English statute law, the Group could also have some residual liability for certain operational properties held by Hovis under long-term leases, although this element of risk is currently considered to be remote.
7. Operational continuityDelivery of our strategy is dependent on the organisation’s ability to minimise operational disruption from issues with facilities, IT and factory infrastructure, as well as procurement and logistics functions.
8. Legal complianceThe business is subject to a number of legal and regulatory compliance requirements and must continually monitor new and emerging legislation, in areas such as Health & Safety, the listing regime, competition law, food safety, labelling regulations and environmental standards.
The Group has agreed deficit funding payments which (unless the Group resumes payment of dividends) are fixed until the end of 2019. The RHM Pension Scheme, which is the largest scheme, has a sophisticated investment strategy which is designed to minimise risk while earning long-term returns in line with the scheme’s funding requirements. The scheme makes use of swaps and other financial derivatives in order to hedge interest rate and inflation exposures. The smaller Premier Foods schemes have a much lower funding position and therefore less ability to hedge. These schemes are more reliant on cash contributions from the Group as well as positive investment returns to reach a satisfactory long-term funding position. The Group enjoys close relationships with the various Trustees, through regular meetings with the Trustee Chairs through the Pension Liaison Forum and attendance, by invitation, of the CFO and members of his team at investment committee meetings. A triennial valuation will be concluded later in 2016 but this will not affect deficit contributions until 2020.
The business continues to invest strongly in commercial insights resources to understand consumer trends, as well as its marketing and innovation capability. Product innovation activities are targeted at addressing healthy eating and other trends and product lifecycle management processes are in place to manage the decline of products in our portfolio. Exciting new developments in our product portfolio are underway or planned for this year, particularly for Batchelors and Ambrosia.
The Group has senior executive representation on the Board of Hovis and has fully written off its investment in this company. Hovis has independent sources of finance which are non-recourse to the Group. In the event that the Group becomes liable for Hovis property obligations we would seek to sub-let these properties or surrender the leases. The Group has assumed control of the Knighton Foods business in order to address operational issues.
We have crisis management processes in place and business continuity plans are reviewed and refreshed on an ongoing basis. The financial impact of material site issues is mitigated by insurance cover. Systems resilience is built in through the deployment of dual data centres and will be enhanced following the completion of a re-hosting project in early 2016/17. Procurement category strategy plans are in place to monitor and mitigate risk around key suppliers.
Leading food industry processes are in place to manage Health & Safety and food safety issues, including an ongoing programme of internal and external audits. There are dedicated legal and regulatory teams in place to monitor changes in legislation, ensure compliance across the organisation and defend against litigation where necessary.
Find out more about our operational risks (risks 7 and 8) on our website: www.premierfoods.co.uk/about/governance/risk-management.
INTRODUCTION STRATEGIC REPORT GOVERNANCE FINANCIAL STATEMENTS 31

Operating reviewThe following commentary unless otherwise stated is prepared for the 52 weeks ended 2 April 2016 with comparative results for the 52 weeks ended 4 April 2015. Results are stated on an ‘underlying business’ basis which are unaudited and exclude all disposals and joint ventures transactions previously completed. The comparative results are stated on a ‘pro forma’ basis. Trading results of Knighton Foods Limited ('Knighton') which was consolidated on 1 April 2016 are not reflected in the Sales and Trading profit results and associated commentary of the Operating review. All references to the ‘year’, unless otherwise stated, are for the 52 weeks ended 2 April 2016 and the comparative period, 52 weeks ended 4 April 2015. All references to the ‘quarter’, unless otherwise stated, are for the 13 weeks ended 2 April 2016 and the comparative period, 13 weeks ended 4 April 2015.
£m2015/16
(52 weeks)2014/152
(52 weeks)Change
(%)
Group Sales
Branded 683.4 683.7 (0.0)
Non-branded 88.3 83.7 5.5
Total 771.7 767.4 0.6
Divisional contribution 167.1 163.2 2.4
Group & corporate costs (36.1) (32.2) (12.1)
Trading profit3 131.0 131.0 0.0
EBITDA 147.1 144.9 1.5
Quarter 4 sales results
£m2015/16 Q4 (13 weeks)
2014/15 Q4 (13 weeks)
Change (%)
Group Sales
Branded 168.8 167.2 1.0
Non-branded 16.7 15.7 6.5
Total 185.5 182.9 1.4
IntroductionGroup sales for the 52 weeks ended 2 April 2016 were £771.7m, an increase of 0.6% on the prior year. In the fourth quarter of the year, total sales grew by 1.4% to £185.5m compared to the equivalent quarter a year ago. While branded sales were flat, six of the Group’s eight largest brands delivered average sales growth of 3.4% during the year. These six brands have received more focus on innovation and marketing investment over the last two years and this result clearly demonstrates that the Group’s innovation and brand marketing strategy is working.
Trading profit for the 52 weeks ended 2 April 2016 was £131.0m; in line with both the prior year and the Company’s expectations. Within this, the Group has invested approximately £3m more consumer marketing compared to the prior year, while depreciation was £2.2m higher following recent increased levels of capital investment in the Group’s cake bakeries.
Market overviewDuring the past year, the UK grocery market has continued to display volume growth alongside a consistently deflationary environment. The rate of UK food deflation has remained broadly constant at 1.5%–2.0% over the last twelve months and as previously commented, reflects a combination of benign input costs and price competition across the wider grocery market.
The significant growth channels of discounters and online have continued their respective progress over the last year with the Group displaying growth broadly in line with both these growth sectors of the market. This reflects commitments to deliver growth in the discounters channel, principally but not exclusively through our non-branded offering, while dedicated resource has been recruited to realise the opportunities in online through a more focused and tailored approach.
During the year the Group continued to expand its offering of products with a nutritional benefit in response to a growing consumer demand for healthy choices. This included the launch of the 'Exceedingly Good' range of Mr Kipling snack pack slices containing wholesome ingredients such as oats, cranberry and coconut, the launch of Bisto Best Reduced Salt which has been a strong seller since its introduction in 2015 and increased vegetable content of its Loyd Grossman, Sharwood's and Homepride cooking sauces so that around 70% contain 'one of your five a day'. Building on existing achievements, the Group has recently refreshed its nutrition strategy for the next three years including plans to reduce calories and levels of added sugar in a number of product categories through reformulation initiatives, the introduction of calorie caps for individual cakes and the expansion of single portion packs of cake as a percentage of the portfolio. The Company also plans further salt reductions throughout its portfolio and will expand the number of new products launched into market with added nutritional benefits or calorie reductions.
STRATEGIC REPORT
Operating and financial review
Premier Foods plc Annual report for the 52 week period ended 2 April 201632

Brand investment and innovationThe Group increased its investment in consumer marketing in the year to approximately £36m, an increase of nearly 10% on the prior year. The Group is committed to progressively increasing its consumer marketing investment over the medium-term. In 2016/17 the Group plans to spend £42-£44m on consumer marketing, increasing its expenditure on media advertising and preparing the foundations for the launch of certain Grocery brands in the chilled arena. Consequently, nine of the Group’s brands are planned to benefit from TV advertising in 2016/17.
Where the Group has invested in marketing its brands and introducing new products to market, it has demonstrated positive results. During the past year, six of the Group’s largest eight brands; Bisto, OXO, Loyd Grossman, Sharwood’s, Mr Kipling and Cadbury cake all grew sales and on average, by +3.4%. Ambrosia and Batchelors, the other two major brands, saw sales decline by (2.9%) in the year. In aggregate the former six benefited from both higher levels of marketing investment as a proportion of sales and more product launches. In 2016/17, the Ambrosia and Batchelors brands will receive higher levels of marketing investment and are also expected to benefit from new products which align to current consumer trends such as Ambrosia Deluxe custard, Ambrosia frozen custard ice cream and Batchelors High Protein and High Veg pots.
Customer relationshipsThe Group counts all of the major food retailers in the UK as key customers of its products. In the ordinary course of business, it is customary for the food retailers to regularly review their product categories to ensure they offer their customers the best value and choice in their stores through category range reviews. Some of the Group’s major customers have undertaken category range reviews over the past year and in overall terms, the outcome of these reviews is that they have concluded in line with the Company’s expectations. While the Company has lost some slower selling product codes in some areas, it has also gained increased availability of some higher selling product codes in other areas; both changes were as expected. With its category based strategy, the Company continues to enjoy good relationships across its customer portfolio.
Grocery
£m2015/16
(52 weeks)2014/15
(52 weeks)Change
(%)Q4 Change
(%)
Sales
Branded 504.9 508.5 (0.7%) 0.2%
Non-branded 43.7 43.2 1.1% 3.8%
Total sales 548.6 551.7 (0.6%) 0.5%
Divisional contribution 142.1 145.2 (2.1%) –
Grocery sales were £548.6m in the year, slightly behind the prior year as growth in non-branded sales was offset by a small decline in branded sales to £504.9m. Sales in the fourth quarter increased by 0.5%, with both branded and non-branded delivering growth compared to the prior year. These results are set against the backdrop of deflation in the wider UK grocery market. Divisional contribution was £3.1m lower at £142.1m due to increased consumer marketing investment in the year.
In the Flavourings & seasonings category, Bisto and OXO recorded strong performances, growing both sales and volumes during the year. For Bisto, the Group’s second largest brand, new products launched into market contributed to over half the sales growth, with the new reduced salt Bisto Best product proving particularly popular among consumers. OXO sales benefited from the launch of Stock Pots using gel pot technology, aligned to key consumer trends and which accounted for approximately half the brand’s sales growth in the year. This category has received a significant level of investment and focus over the last two years and clearly demonstrates that the Group’s category led strategy is delivering results.
In the Cooking Sauces & accompaniments category, sales of Loyd Grossman and Sharwood’s continued their positive trajectory from the first half of the year, with both delivering full year sales growth. Loyd Grossman sales benefited from the rollout of its ‘Gastro’ and ‘Classic’ pouches range and the gel pot Pan Melts product, while Sharwood’s Stir fry Melts were supported by a major TV advertising campaign.
Sales of Ambrosia were down slightly in the year, however they returned to healthy growth in the fourth quarter, assisted by two new product ranges. These comprised a range of premium Deluxe custard including clotted cream, toffee and contemporary salted caramel flavours and a significant extension of the brand into the ice cream market with a range of frozen custard ice cream. Elsewhere in the Desserts category, Mr Kipling and Cadbury sponge puddings and Cadbury desserts pots have all performed strongly in the year.
As previously highlighted, while sales and volumes of Batchelors have experienced significant declines in the past, this declining trend has materially reduced. New premium cup-a-soup products were launched in the first half of the year, with flavours including Thai Inspired Chicken & Sweet Potato and Southern Style Pulled Pork. Additional new products to be launched in 2016/17 include High Protein pots, High Veg Pots and Soup Dippers.
In the fourth quarter, the Group entered into a partnership with renowned baker, Paul Hollywood and launched a unique range of premium artisanal home-baking products which are now available in a number of the Group’s major retail customers.
INTRODUCTION STRATEGIC REPORT GOVERNANCE FINANCIAL STATEMENTS 33

STRATEGIC REPORT
Operating and financial review continued
Sweet Treats
£m2015/16
(52 weeks)2014/15
(52 weeks)Change
(%)Q4 Change
(%)
Sales
Branded 178.5 175.2 1.9% 3.0%
Non-branded 44.6 40.5 10.0% 10.5%
Total sales 223.1 215.7 3.4% 3.8%
Divisional contribution 25.0 18.0 38.9% –
Sweet Treats total sales increased by 3.4% in the full year and by 3.8% in the fourth quarter. This marks a consistently strong trajectory for the business unit which has delivered sales growth in all four quarters of the year. Both branded and non-branded sales grew in the year; up 1.9% and 10.0% respectively, with similar trends recorded for the fourth quarter. Volumes, measured in cases and packets of products, also displayed healthy increases in the year. As expected, the business unit achieved its target of delivering double-digit Divisional contribution margins in the year, increasing from 8.3% in the prior year to 11.2% for 2015/16.
Cadbury cake enjoyed an excellent year, with sales and volumes growing in double-digit percentage terms in both the year and the fourth quarter. While new products such as Amaze Bites and Hot Cakes have provided nearly half of the brand’s growth in the year, the core range has also performed very well. Cadbury cake benefited from its first television advertising for eight years during the year and this will be repeated in 2016/17.
Mr Kipling launched a number of new products in the year including Deluxe Viennese Whirls, Fabulous Fancy, Victoria Sponge and Coffee cakes, 'Exceedingly Good' slices and premium cupcakes. Mr Kipling grew sales in the year and up to the third quarter this year, had delivered six quarters of consistent growth. Sales were lower in the fourth quarter due to an exceptionally strong comparative quarter in 2014/15. Both Mr Kipling and Cadbury have been instrumental in driving category growth during the year with a number of the new product launches supporting the Group’s premiumisation strategy.
Over half of the business unit’s non-branded sales are generated in the third quarter of the year, and the strong performance in this area reflected mince pie contract gains across both multiple retail and discounter channels. In 2015, the Company sold 185 million mince pies, an 8% increase on the prior year. Other non-branded contract wins in the year which contributed to this sales and volume growth included fruit pies.
The strong Divisional contribution margin delivery in the year reflects improved asset utilisation through increased branded and non-branded volumes, improving the product profitability mix and efficiency benefits from capital projects.
InternationalSales in the International business increased by approximately 15% in the year, and excluding the impact of adverse foreign currency movements, were ahead approximately 18%.
The Australian business performed very well, up 47% during the year as a result of new listings of both Sharwood’s and Mr Kipling and Cadbury cakes in certain retailers. Market share of Indian cooking sauces increased by +4.6 percentage points reflecting improved distribution levels.
Sales in the USA grew by 23%, with the fourth quarter particularly strong, reflecting a very good Sharwood’s performance with market share in Indian cooking sauces up +2.2 percentage points in the year. The Company also undertook a new trial of Mr Kipling Apple, Fruit and Mississippi Mud Pies across 250 stores of a major US retailer in the third quarter of the year which delivered some encouraging results. Ireland sales grew in constant currency, supported by Bisto and OXO TV advertising in the second half of the year.
The International business unit has significantly increased the size of the team during the year to reflect the growth aspirations of the Group. The business unit now employs 28 people, an increase from just 9 a year ago, across a range of key functions to support the Group’s growth plans.
Efficiency and cost controlOver the coming financial year, the Group will be looking more closely at improving the quality and product consistency across certain lines within its Grocery business. Expertise will be used to review current manufacturing processes to identify areas for improvement which are expected to deliver increased line efficiencies. Additionally, and following a review of its Grocery plant line management operations, teams will become more streamlined, delivering greater flexibility within manufacturing sites and resulting in overhead cost reductions.
In logistics, the Group is reviewing options in both its transport and warehousing operations which may lead to changes in the configuration of its network. While these reviews are ongoing, the majority of these changes are likely to take place late in the year and into 2017/18.
The Group maintains a continual focus on improving the returns on investment from promotional activity in which it participates with major customers. In the third quarter of the year, the Group’s key trading period of the year, the Grocery business delivered improved returns on investment on promotional activity and also executed 27% more off shelf instore shipper displays compared to the prior year.
The Government has recently implemented a National Living Wage (NLW) for all employees above the age of 25 which was effective from April 2016. The Company expects there will be a relatively small increase in labour costs in 2016/17 as a result of this legislation. The impact is expected to be greater at some of the Group's manufacturing sites than others. While the NLW is expected to rise to at least £9.00 an hour by 2020, this level represents the bottom of current Government forecasts. Additionally, the Government
Premier Foods plc Annual report for the 52 week period ended 2 April 201634

have also proposed to implement an Apprenticeship Levy, effective from April 2017. The Group will look to offset the impact of this levy through its continued investment in training and apprenticeships and create a more flexible workforce.
Net regular interest
£m2015/16
(52 weeks)2014/15
(52 weeks)Change
(%)
Senior secured notes interest 30.8 30.9 0.2
Bank debt interest 8.5 10.2 17.7
Securitisation interest 1.2 2.5 48.9
40.5 43.6 7.1
Amortisation and deferred fees 4.4 4.2 (5.4)
Net regular interest 44.9 47.8 6.0
Net regular interest for 2015/16 was £44.9m, in line with the Group’s expectations and £2.9m lower than the prior year. The Group’s sources of financing were largely unchanged in the year, except for the previously announced closure of its £80m debtors securitisation programme. As a result of the low utilisation and subsequent closure of this securitisation programme, interest charges attributable to it more than halved to £1.2m in the year. As expected, the largest component of financing was interest due to holders of the senior secured notes and was £30.8m in the year. Bank debt interest was £1.7m lower in the year due to approximately one month’s term loan debt from the previous financing structure included in the comparative period.
The Company expects net regular interest for the 2016/17 financial year to be marginally lower than 2015/16.
Associate investmentsAs at 4 April 2015, the Company held a 49% interest in both Hovis Limited ('Hovis') and Knighton. On 1 April 2016, the Company gained control of Knighton for reporting purposes under IFRS 10 and consequently this business is consolidated in the financial statements for the year from that date.
£m Hovis Knighton Total
4 April 2015 22.6 12.6 35.2
Interest receivable 0.8 0.2 1.0
Share of loss from associates (14.1) (8.5) (22.6)
Impairment charge (9.3) (4.3) (13.6)
2 April 2016 – – –
For the financial period ended 2 April 2016, the Company recognised a share of loss from associates of (£22.6m), of which (£14.1m) is due to the share of loss from its investment in Hovis. This loss reflects the highly competitive UK Bread market. The share of loss from the Company’s investment in Knighton was (£8.5m) during the period due to challenging market conditions, an unsatisfactory systems implementation and following a review of the carrying value of certain assets.
Additionally, the Group wrote off its remaining investment in Hovis which is reflected in the impairment charge of £9.3m. The remaining £4.3m investment in Knighton was written off reflecting the challenging market conditions faced by the business. Consequently, associate investments had a nil value as at 2 April 2016.
Cash flow£m 2015/16
Trading profit 131.0
Depreciation 16.1
Other non-cash items 4.1
Interest (41.7)
Pension contributions (12.9)
Capital expenditure (25.4)
Working capital & other 0.3
Recurring cash inflow 71.5
Restructuring costs (7.5)
Free cash flow 64.0
Knighton consolidation (8.3)
Total cash inflow 55.7
Total cash inflows in the year were £55.7m. Trading profit was £131.0m, while depreciation of £16.1m was in line with the Company’s expectations, although this is expected to be slightly higher in 2016/17 at £17–18m. Interest paid was £41.7m and capital expenditure was £25.4m. Pension contributions of £12.9m were broadly in line with the previously agreed schedule of pension deficit contributions and costs associated with administering the pension schemes. Other non-cash items principally relate to the add-back of share based payments. Cash restructuring costs relating to a major re-organisation of the Group’s IT function is one of the main elements of the £7.5m outflow in the year.
INTRODUCTION STRATEGIC REPORT GOVERNANCE FINANCIAL STATEMENTS 35

STRATEGIC REPORT
Operating and financial review continued
Net debtNet debt at 2 April 2016 was £534.2m. This represents a £50.7m reduction in Net debt compared to the prior year and also includes the impact of consolidating Knighton.
£m
Net debt at 4 April 2015 584.9
Free cash flow generation in period (64.0)
Knighton consolidation 8.3
Movement in debt issuance costs 5.0
Net debt at 2 April 2016 534.2
EBITDA 147.1
Net debt / EBITDA 3.6x
The Company’s Net debt / EBITDA ratio reduced to 3.6x at the year end, down from 4.0x as at the end of 2014/15 and reflects the Group’s focus on debt reduction. The Group expects deleveraging will progress at a slower rate from 2016/17 due to the increase in the previously agreed annual deficit cash contributions to the pension schemes.
Pensions
IAS 19 Accounting Valuation (£m)
2 April 2016 4 April 2015
RHMPremier
Foods Combined RHMPremier
Foods Combined
Assets 3,758.7 584.2 4,342.9 3,636.0 612.5 4,248.5
Liabilities (3,207.8) (1,004.2) (4,212.0) (3,394.4) (1,065.9) (4,460.3)
Surplus/(Deficit) 550.9 (420.0) 130.9 241.6 (453.4) (211.8)
Net of tax (20.0%/21.4%) 440.7 (336.0) 104.7 189.9 (356.4) (166.5)
The IAS 19 pension schemes valuation reported a surplus for the combined RHM and Premier Foods’ pension schemes at 2 April 2016 of £130.9m, equivalent to £104.7m net of notional tax charge. This compares to a deficit at 4 April 2015 of £211.8m and £166.5m after tax.
The valuation at 2 April 2016 comprised a £550.9m surplus in respect of the RHM schemes and a deficit of £420.0m in relation to the Premier Foods schemes.
One of the key reasons for the £248.3m reduction in combined liabilities in the schemes, from £4,460.3m to £4,212.0m is the 25 basis points increase in the discount rate from 3.30% at 4 April 2015 to 3.55% at 2 April 2016. One of the largest movements in the asset classes is in the swaps classification; this reflect the impact of the RHM schemes’ hedging strategy.
The reduction in the pension valuation between these dates has no impact on the previously agreed pension deficit cash contributions which are fixed until December 2019. As previously highlighted, one approach in valuing the pension liabilities as part of the Enterprise value of the Company is to discount the post tax future cash flows of the agreed deficit contribution payment schedule. On this basis, the pension schemes deficit be valued between £400m–420m.
Combined pensions schemes (£m) 2 April 2016 4 April 2015
Assets
Equities 405.4 348.5
Government bonds 474.8 547.5
Corporate bonds 1.9 329.8
Property 292.3 260.0
Absolute return products 1,227.6 1,332.9
Cash 326.9 294.4
Infrastructure funds 228.0 196.6
Swaps 862.5 430.0
Private equity 259.4 250.9
Other 264.1 257.9
Total Assets 4,342.9 4,248.5
Liabilities
Discount rate 3.55% 3.30%
Inflation rate (RPI/CPI) 3.0%/1.9% 3.0%/1.9%
Total Liabilities (4,212.0) (4,460.3)
Surplus/(Deficit) 130.9 (211.8)
Notional tax (20.0%/21.4%) (26.2) 45.3
Surplus/(Deficit) net of tax 104.7 (166.5)
Premier Foods plc Annual report for the 52 week period ended 2 April 201636

Pension sensitivities
Pension sensitivities (IAS 19 basis, £m)
Increase/(Reduction)
in assets
Increase/(Reduction) in liabilities
Increase/(Reduction)
in deficit
25 basis point decrease in government gilts 170 181 11
25 basis point increase in credit spreads – (170) (170)
25 basis point increase in RPI 55 71 16
Life expectancy increase by 1 year – 171 171
The above table intends to provide assistance in understanding the sensitivity of the valuation of pension assets and liabilities to market movements of government gilts, credit spreads and the retail price index (RPI). The asset movement caused by a change in government gilts is predominantly driven by hedging in the RHM pension scheme. It is stressed that these sensitivities are indicative only and may change over time as the schemes’ execution of its investment strategy may evolve to maximise asset performance.
Accelerating growth strategyOn 23 March 2016, the Group announced a number of strategic initiatives to help accelerate growth across its three business units of Grocery, Sweet Treats and International. Together with the Group’s existing plans, these new initiatives are expected to support the Group to deliver its medium-term sales growth guidance of 2–4%.
The new initiatives will leverage the Company’s existing platforms, infrastructure and brand presence to expand further into new formats, channels and markets:
• In Sweet Treats, we plan to build on the successful trial of our ‘Cake on the go’ range of Mr Kipling twin pack slices and Cadbury mini roll twin packs by accelerating growth of our brands in broader convenience channels through capitalising on our manufacturing investments, innovation expertise and dedicated new team.
• In Grocery, we intend to extend our strong brands into premium areas within the chilled grocery sector in both the sweet and savoury segments, to meet consumers’ growing health-consciousness.
• In International, we plan to leverage the investment we have already made in hiring an experienced team to step-change the size of our International business. Our focus will be on accelerating the expansion of our cake brands in the USA and other geographies using our differentiated offering, unique formats and packaging. Initial store trials have demonstrated the potential for future growth in these markets.
The Group also announced on 23 March 2016 that it had entered into a co-operation agreement with Nissin Foods Holdings Co., Ltd. ('Nissin') and subsequently a Relationship agreement was entered into.
Over recent years, the Group has discussed a number of potential strategic opportunities with Nissin. This new strategic partnership has the potential to create significant long-term value for both organisations through strategic co-operation in the following areas:
• Providing Premier with access to Nissin’s innovative products and formats to distribute in the UK market under either Nissin’s or Premier’s brands, such as Batchelors.
• Enabling Premier to benefit from Nissin’s international scale to accelerate the distribution of Premier’s products in key overseas markets.
• Sharing of Nissin’s significant intellectual property, innovation and technical know-how to develop new products.
• Creating opportunities for both companies to leverage their joint manufacturing capabilities and infrastructure.
• Facilitating sharing of expertise and best practice through appropriate secondments of personnel.
Further to the Relationship agreement dated 22 April 2016, Nissin have nominated Mr Kijima, Managing Director of Nissin, to be appointed a non-executive director of the Board of Premier Foods with effect from 21 July 2016.
INTRODUCTION STRATEGIC REPORT GOVERNANCE FINANCIAL STATEMENTS 37

STRATEGIC REPORT
Operating and financial review continued
OutlookThe Group’s strategy of investing behind its brands and bringing new innovative products to market delivered positive results in 2015/16. In 2016/17 consumer marketing investment is expected to increase again, to £42–£44m, with nine brands planned to benefit from television advertising. Building on this trajectory, the Group now expects to deliver sales growth of 2–4% in both 2016/17 and the medium-term, and together with its supply chain efficiency programme, anticipates good progress to be delivered in 2016/17.
Future prospects for the Group are reinforced by the recently announced initiatives to accelerate growth in each of its business units in addition to the potential opportunities presented by the partnership with Nissin. The Board are focused on delivering shareholder value and see a strong future for Premier Foods with its leading category positions, great brands and strong operational cash flows.
Gavin Darby Chief Executive Officer
16 May 2016
Reconciliation of the Company’s results on an underlying basis to a continuing operations basisThe Company’s results are presented for the 52 weeks ended 2 April 2016. Results are stated on an ‘underlying business’ basis which exclude all disposals and joint ventures transactions previously completed. The comparative results are stated on a ‘pro forma’ basis, are unaudited and are presented to illustrate the performance of the Company on the new reporting calendar methodology.
‘Continuing operations’ includes the respective periods that the Company maintained ownership of previously completed disposals and joint ventures entered into. The results of the 52 weeks ended 2 April 2016 and its comparative period for statutory reporting purposes, the financial period from 1 January 2014 to 4 April 2015, are commented on in the financial review.
£mContinuing operations
Less: Disposals
Less: Knighton
Add/(Less): 1 Jan – 5 Apr 2014
Underlying business
2015/16
Sales 771.7 0.0 N/A N/A 771.7
Trading profit3 128.8 2.2 N/A N/A 131.0
EBITDA4 144.9 2.2 N/A N/A 147.1
2014/152
Sales 964.3 (0.2) (8.1) (188.6) 767.4
Trading profit3 150.2 3.8 0.7 (23.7) 131.0
EBITDA4 168.7 3.6 0.7 (28.1) 144.9
Continuing operations Trading profit of £128.8m in 2015/16 above includes £2.2m of non-cash costs predominantly relating to the write off of legacy fixed assets in the year and is excluded from ‘underlying business’ Trading profit.
Notes1. The statutory accounting period is the 52 weeks from 5 April 2015 to 2 April 2016.2. Comparative pro forma results are prepared for the 52 weeks ended 4 April 2015 and
are unaudited.3. Trading profit for the underlying business is reconciled to continuing operations
Trading profit and is defined as Operating profit before amortisation of intangible assets, impairment, fair value movements on foreign exchange and other derivative contracts, restructuring costs, profits and losses associated with divestment activity and net interest on pensions and administration costs.
4. EBITDA is Trading profit excluding depreciation.5. Adjusted profit before tax is defined as Trading profit for the underlying business less
net regular interest. Net regular interest is defined as net finance cost after excluding write-off of financing costs, fair value movements on interest rate financial instruments and other interest. Adjusted earnings per share is defined as Adjusted profit before tax less a notional tax charge of 20.0% (2014/15: 21.4%) divided by the weighted average of the number of shares of 826.0 million (52 weeks ended 4 April 2015: 824.4 million). The weighted average of the number of shares and the notional tax charge for the financial period from 1 January 2014 to 4 April 2015 was 731.4 million and 21.4% respectively.
6. International sales growth is stated excluding the impact of foreign currency movements.
Premier Foods plc Annual report for the 52 week period ended 2 April 201638

Financial reviewWithin this financial review, the Company presents its results for the 52 weeks ended 2 April 2016 (364 days) with comparative information for the financial period from 1 January 2014 to 4 April 2015 (459 days). All commentary on the performance of the Company included below refers to continuing operations unless otherwise stated and therefore reflects the respective periods that the Company maintained ownership of previously completed disposals.
Income statementRevenue from continuing operations in the year was £771.7m compared to £964.3m in the prior year. Revenue in the comparative period benefited from an additional 95 days due to the transition to the Company’s new financial year end. As commented on in the Operating review, revenues on a pro forma basis grew slightly in the year with revenues of branded goods flat and non-branded goods higher. Grocery revenues for the 52 weeks ended 2 April 2016 were £548.6m compared to £699.6m in the comparative period, while Sweet Treats revenues were £223.1m compared to the prior period of £264.7m.
Gross profit was £295.5m in the year, a decrease of £38.0m compared to the prior period, primarily due to the fewer days in the accounting period. Within this, good progress was made in the Sweet Treats business unit in the year, reflecting improved asset utilisation through increased branded and non-branded volumes, improving the product profitability mix and efficiency benefits from capital projects. Gross margins increased by 3.7 percentage points to 38.3% for the year to 2 April 2016.
Divisional contribution for the Group was £167.1m in the year compared to £196.4m for the period ended 4 April 2015. Grocery Divisional contribution was £142.1m, a decrease of £37.5m compared to the prior period, while Sweet Treats Divisional contribution was £25.0m, an increase of £8.2m, reflecting the points identified above despite being a shorter time period.
Operating profitThe Group reported an Operating profit for the year of £54.5m, set against an Operating loss of £44.1m for the comparative period. Before impairment and loss on disposal of operations, the Group delivered an Operating profit of £68.1m in the year, compared to £45.8m for the period ended 4 April 2015; an increase of £22.3m.
The main driver of the improved Operating performance in the period was due to lower impairment charges in the year and lower net interest on pensions and administrative expenses.
In the prior period impairments relating substantially to the Sweet Treats business unit goodwill resulted in charges for the period of £83.9m, while in 2015/16, impairment charges in the Group were significantly lower at £13.6m reflecting the write down of associate investments. Net interest on pensions and administrative expenses in the year were £14.5m; £33.5m lower than the prior period, due to a lower opening pension deficit (£211.8m compared with £603.3m) and fewer reporting days in the 52 weeks ended 2 April 2016.
Amortisation of intangible assets was £37.6m in the year, compared to £47.6m, although this entirely reflects the longer comparative reporting period. The Group continues to expect the annual run rate for intangible asset amortisation to be approximately £38–40m.
Restructuring costs were £11.2m in the year, largely due to costs associated with restructuring the Group’s IT function and corporate activity fees.
Trading profit on this statutory reporting basis was £128.8m in the year compared to £150.2m in the prior reporting period. This is largely due to the longer comparative reporting period, and also includes £2.2m of costs predominantly relating to the write off of legacy fixed assets. The Group also invested approximately £3m more in consumer marketing in the year on a pro forma basis, reflecting its strategy of investing behind its brands.
Finance costsNet finance cost for the year ended 2 April 2016 was £44.9m compared to £81.9m in the comparative period, in overall terms due to lower levels of Group net debt following the re-financing completed in April 2014. The Group’s sources of financing were largely unchanged in the year, except for the previously announced closure of its £80m debtors securitisation programme. The largest component of financing costs in the year was interest payable on the senior secured notes issued by the Group in March 2014 and amounted to £30.8m.
The higher financing costs in the prior period were due to costs associated with previous financing facilities, and included interest payable on term facility (£7.2m); deferred fees associated with previous arrangements (£6.7m) and the write off of financing costs associated with previous arrangements (£14.6m). None of these costs relating to the Group's previous financing facilities, as described above, were repeated in the 52 weeks ended 2 April 2016.
Write off costs associated with the closure of the Group’s securitisation programme in January 2016 amounted to £0.4m in the year.
Associate investmentsThe Group reported a share of loss from associates of £22.6m in the year, compared to a loss of £9.6m in the comparative period. The share of loss associated with Hovis was £14.1m and reflects competitive market conditions in the UK bread market. The share of loss from Knighton for the year was £8.5m and was due to a combination of challenging market conditions, costs associated with an unsatisfactory systems implementation and following a review of the carrying value of certain assets.
INTRODUCTION STRATEGIC REPORT GOVERNANCE FINANCIAL STATEMENTS 39

STRATEGIC REPORT
Operating financial review continued
As a result of the losses in the year and challenging market conditions, the Group wrote off its remaining investment in Hovis which is reflected in the impairment charge of £9.3m. The remaining £4.3m investment in Knighton was written off reflecting the challenging market conditions faced by the Knighton business. Consequently, associate investments had a nil value as at 2 April 2016.
On 1 April 2016, the Group gained control (as defined under IFRS 10) of Knighton, in which the Group already held 49% of the ordinary share capital and associated voting rights and as a result, the Group has consolidated Net debt of £8.3m relating to this business. The securitisation facility drawn of £6.4m at 2 April 2016 relates to Knighton. In anticipation of acquiring 100% of the Knighton business, the Group has arranged a new debtor finance facility which was undrawn at the year end and is expected to accomodate any additional working capital requirements from Knighton.
Profit before taxationThe Group made a loss before tax of £13.0m for the year ended 2 April 2016 compared to a prior period loss of £135.6m. Operating profit of £54.5m was offset by net finance costs of £44.9m and a share of loss from associates of £22.6m as outlined above.
TaxationA taxation credit of £47.0m is reported for the 52 weeks ended 2 April 2016, due to movements in deferred tax. This compares to a prior period credit of £42.9m, which largely reflects the loss incurred in the comparative period. The applicable rate of corporation tax for the year was 20.0% (4 April 2015: 21.4%).
The Group’s deferred tax net asset as at 2 April 2016 was £25.9m. Within this deferred tax net asset of £25.9m, the Group recognises a deferred tax liability of £23.8m associated with retirement benefit obligations reflecting the combined pension schemes surplus at 2 April 2016. Additionally, the Group has recognised an asset reflecting prior year tax losses of £70.5m which equate to approximately £400m of losses which can be used to offset taxable profits in future periods. These losses can generally be carried forward indefinitely. Detailed proposals announced in the Chancellor of the Exchequer’s 2016 budget regarding limits on interest charge deductions and the utilisation of prior year losses are yet to be announced and hence any potential implications on the Group’s current or future tax position will be disclosed in due course.
The corporation tax rate for 2016/17 is expected to be 20.0% and the deferred tax rate is 18.0%.
Earnings per shareThe Group reports a basic earnings per share on continuing operations for the 52 weeks ended 2 April 2016 of 4.1 pence, compared to a basic loss per share on continuing operations of in the prior period of 12.7 pence. Earnings/(loss) per share is calculated by dividing the earnings/(loss) attributed to ordinary shareholders of £34.0m (4 April 2015: (£92.7m)) by the weighted number of shares in issue during the period. The weighted number of shares in the comparative period reflects the issue of new shares on 24 March 2014 and is adjusted for the relevant bonus factor.
Adjusted earnings per share for continuing operations were 8.1 pence (4 April 2015: 9.0 pence). Adjusted earnings per share on continuing operations has been calculated by dividing the adjusted earnings (defined as Trading profit less net regular interest and notional taxation) attributed to ordinary shareholders of £67.1m (4 April 2015: £65.9m) by the weighted number of ordinary shares in issue during each period. These earnings have been calculated by reflecting tax at a notional rate of 20.0% (4 April 2015: 21.4%). The weighted average number of shares in issue for the 52 weeks ended 2 April 2016 was 826.0m and the comparative period ended 4 April 2015 was 731.4m.
Cash flow and borrowingsThe Group’s net borrowings as at 2 April 2016 were £534.2m, a decrease of £50.7m since 4 April 2015. The cash inflow from operations to 2 April 2016 was £137.1m, compared to an inflow of £62.5m in the comparative period.
Net cash interest paid was £41.7m in the year (4 April 2015: £59.1m), of which £30.8m related to cash payments to holders of the Group’s senior secured notes. The purchase of property, plant and equipment was £23.0m in the period, a reduction of £11.1m from the prior period and intangible asset purchases were £6.9m which relate to certain IT systems implementation to provide improved analysis in areas such as commercial reporting. No cash tax was payable in the year due to the availability of relief for capital expenditure and pension deficit contribution payments.
The Group repaid £58.0m of borrowings related to its revolving credit facility in the year and closed its debtors securitisation programme, resulting in a movement of £19.7m in the year.
In the comparative period, the Group received £500.0m proceeds from the issue of its senior secured fixed and floating notes and £353.4m gross proceeds from the issue of new equity following the completion of the Capital Re-financing Plan in 2014. These proceeds were used to repay term facilities under the previous financing arrangements of £679.5m. Financing fees and other costs of finance amounted to £58.3m which included fees associated with the raising of new equity, issuing senior secured notes, new revolving credit facilities, advisory fees and other fees arising from previous re-financing arrangements.
Retirement benefit schemesAt 2 April 2016, the Company’s pension schemes under the IAS 19 accounting valuation showed a combined gross surplus of £130.9m, compared to a combined deficit of £211.8m at 4 April 2015. The valuation at 2 April 2016 comprised a £550.9m surplus in respect of the RHM schemes (4 April 2015: £241.6m) and a deficit of £420.0m (4 April 2015: £453.4m) in relation to the Premier Foods schemes. Further commentary on the Group’s pension schemes is provided in the Operating review.
The Accounting Standards Board under IFRIC 14, are currently reviewing the recognition of a pensions surplus in the financial statements of an entity. Dependent upon the final published standard, there is potential that any future defined benefit surplus may not be recognised in the financial statements of the Group and additionally, the deficit valuation methodology may also change.
Alastair MurrayChief Financial Officer16 May 2016
Premier Foods plc Annual report for the 52 week period ended 2 April 201640

Pro forma results for 52 weeks to 2 April 2016 (Includes effect of Knighton consolidation)The table below is presented to show the pro forma trading results of the Group as if it controlled Knighton for the duration of the 52 weeks ended 2 April 2016 and are unaudited.
These results will form the basis on which the Group will report its pro forma results for the 52 weeks ending 1 April 2017.
£m
52 weeks to 2 April 2016
Q1 (13 weeks)
Q2 (13 weeks)
H1 (26 weeks)
Q3 (13 weeks)
Q4 (13 weeks)
FY (52 weeks)
Grocery
Branded sales 110.1 116.1 226.2 155.0 123.7 504.9
Non-branded sales 16.1 18.4 34.5 20.7 18.1 73.3
Total sales 126.2 134.5 260.7 175.7 141.8 578.2
Divisional contribution – – 60.2 – – 140.2
Sweet Treats
Branded sales 40.0 40.4 80.4 53.0 45.1 178.5
Non-branded sales 6.0 7.4 13.4 25.2 6.0 44.6
Total sales 46.0 47.8 93.8 78.2 51.1 223.1
Divisional contribution – – 7.4 – – 25.0
Group
Branded sales 150.1 156.5 306.6 208.0 168.8 683.4
Non-branded sales 22.1 25.8 47.9 45.9 24.1 117.9
Total sales 172.2 182.3 354.5 253.9 192.9 801.3
Divisional contribution – – 67.6 – – 165.2
Group & corporate – – (17.6) – – (36.1)
Trading profit – – 50.0 – – 129.1
EBITDA – – 58.3 – – 146.5
Notes1. The Company reports its Full Year results on a 52 week ended basis.2. The term Divisional contribution refers to Gross Profit less selling, distribution and marketing expenses directly attributable to the relevant business unit.3. Group & corporate costs refer to Group and corporate expenses which are not directly attributable to a business unit and are reported at total Group level.4. The International business unit is currently too small for separate disclosure and in line with accounting standards is aggregated within the Grocery business unit for reporting purposes.
Pension deficit contribution scheduleThe table below shows the phasing of previously agreed deficit contributions in the context of the Company’s new financial calendar.
£m 2016/17 2017/18 2018/19 2019/20
Deficit contributions 48 49 44 44
Administration costs + PPF levy 8–10 8–10 8–10 8–10
Total cash outflow 56–58 57–59 52–54 52–54
INTRODUCTION STRATEGIC REPORT GOVERNANCE FINANCIAL STATEMENTS 41

We believe that good corporate governance is essential for building a successful and sustainable business in the long-term interests of shareholders. An effective governance framework is also designed to ensure accountability, fairness and transparency in the Company’s relationships with all of its stakeholders whether customers, suppliers, employees, Government or the wider community. Further information on our governance process is set out pages 44 and 45.
Key areas of focus in the yearThe Board spent a considerable amount of time focussing on the Group’s three year business plan and growth strategies. This included an initial detailed review of plans for each strategic business unit in November 2015 and then further reviews of challenging stretch plans designed to accelerate the Group’s growth strategy. The Board also reviewed management’s capabilities and the resources available to deliver these plans, together with an assessment of potential risks.
Also, as detailed in my Chairman’s Statement on pages 4 and 5, the Board devoted significant time to carefully consider if the indicative offers from McCormick & Company, Inc. were in the best interest of our shareholders and other stakeholders. We also considered the potential benefits of entering into a co-operation agreement with Nissin Foods Holdings Co., Ltd. (‘Nissin’), further details are provided in the CEO review on pages 6 and 7.
Succession plans for the executive directors and Executive Leadership Team (ELT) were reviewed by the Nomination Committee to ensure we have robust plans in place over the medium-term. An audit tender exercise was successfully concluded in the year and, following a recommendation from the Audit Committee, we appointed KPMG LLP ('KPMG') as the Company’s auditor.
Finally, as part of our risk management exercise we have prepared our first viability statement, details of which can be found on page 29.
Board balance and experienceFollowing the retirement of Charles Miller Smith in June 2015 there were no further changes to the Board in the period. I am confident we have the right balance of skills, experience and independence required to bring constructive challenge to bear on the Company’s management. The Board considers that all the non-executive directors are independent in character and judgement.
Richard Hodgson, who joined as a new non-executive director in January 2015, has extensive experience in food retailing, gained through senior roles with Asda, Waitrose and Morrisons. This retail experience, ranging from the value to premium ends of UK grocery retailing, is clearly of great benefit to Board discussions by providing a customer viewpoint in the Boardroom.
Over the year the Company has significantly increased the level of new products being launched to market and also the level of consumer marketing
GOVERNANCE
Chairman’s introduction
to support this. Jennifer Laing and Pam Powell have extensive marketing and brand building experience having developed some of the world’s leading consumer brands. This is a valuable resource as the Company looks to build its brands in new channels and markets. Jennifer also provides experience in overseeing executive remuneration, gained in a listed global company, in her role as Chairman of the Remuneration Committee.
I am keenly aware of the benefits of a robust risk management system to help protect the reputation of both the Company and its brands. Ian Krieger has a wealth of risk management and accounting expertise built up during his career in the accountancy and finance industry. He brings detailed knowledge and robust challenge in his capacity as Audit Committee Chairman and in addition, as Senior Independent Director, Ian also provides me with a sounding board on the key strategic risks facing the Company. Both Ian and Jennifer are also involved in meetings and consultations with major shareholders.
In March 2016, Nissin became our largest shareholder following their purchase of just under 20% of the Company’s shares and on 22 April 2016 we signed a Relationship agreement with them under which they are entitled to appoint a non-executive director to the Board.
Nissin have nominated Mr Tsunao Kijima, their Managing Director, to be appointed as a non-executive director with effect from 21 July 2016. I look forward to Mr Kijima joining the Board and to his contributions to our strategic discussions, and in particular how we will develop growth opportunities between our two companies.
AGMOur AGM will again be held at the offices of Gowling WLG (UK) LLP (formerly Wragge Lawrence Graham & Co LLP), 4 More London Riverside, London, SE1 2AU on Thursday 21 July 2016 at 11.00 am and I look forward to seeing you then.
David BeeverChairman
16 May 2016
Compliance with the UK Governance Code 2014 (the Code)As described in more detail by Ian Krieger in the Audit Committee Report on page 48 we have deferred the annual review of external auditor effectiveness until the 2016/17 financial year as KPMG are new to the role. Otherwise, I am pleased to confirm that over the course of the year we complied with all the provisions of the Code.
Dear shareholder,
Premier Foods plc Annual report for the 52 week period ended 2 April 201642

Board of directors
GAVIN DARBY CHIEF EXECUTIVE OFFICER
Appointed to the Board: February 2013. Skills and experience: Gavin has a strong consumer goods pedigree and extensive senior leadership experience. He spent 15 years at the Coca-Cola Company in various senior positions, including Division President roles for North West Europe and Central Europe. Prior to joining Premier Foods, Gavin served as CEO of Cable & Wireless Worldwide plc, leading a successful turnaround of the business before negotiating its eventual sale to Vodafone plc. Previously he worked at Vodafone plc for nine years, during which time he served as UK CEO and CEO of Americas, Africa, India and China.
ALASTAIR MURRAY CHIEF FINANCIAL OFFICER
Appointed to the Board: September 2013. Skills and experience: Prior to joining Premier Foods, Alastair spent 10 years at Dairy Crest Group plc as Group Finance Director, where he helped lead a significant restructuring to simplify the business, creatively addressing its pension deficit and reinforcing its position as an industry leader. Previously he was the Group Finance Director at The Body Shop International plc. Earlier in his career Alastair was a Divisional Finance Director at Dalgety plc and spent 13 years in various finance and operations roles at Unilever plc. He is a Fellow of the Chartered Institute of Management Accountants.
DAVID BEEVER CHAIRMAN
Appointed to the Board: January 2008 and appointed Chairman in June 2012. Skills and experience: After qualifying as a Chartered Engineer, David has spent most of his career in the financial sector. He was a Vice-Chairman of S. G. Warburg where he handled many corporate finance transactions for major UK and international companies. He was later a board member of KPMG and Chairman of Corporate Finance and has been Chairman of several major companies.
RICHARD HODGSON NON-EXECUTIVE DIRECTOR
Appointed to the Board: January 2015. Skills and experience: Richard has been Chief Executive Officer of Pizza Express since 2013 and has over 20 years of experience in the food industry. In 2010 he was appointed Commercial Director at Morrisons, a newly created role, combining Trading and Marketing. Richard joined Waitrose in 2006 as Commercial Director and prior to that spent 10 years at Asda holding a number of senior roles culminating in his appointment as Marketing & Own Brand Director.
IAN KRIEGER SENIOR INDEPENDENT DIRECTOR (SID)
Appointed to the Board: November 2012. Skills and experience: Ian is the Senior Independent Director and Chairman of the Audit Committee at Safestore Holdings plc and also non-executive director and Chairman of the Audit Committee at Capital & Regional plc. He is also Vice Chairman of Anthony Nolan and a trustee and Chair of Finance at the Nuffield Trust. Ian is a Chartered Accountant and was a senior partner and Vice Chairman of Deloitte until his retirement in 2012.
JENNIFER LAING NON-EXECUTIVE DIRECTOR
Appointed to the Board: October 2012. Skills and experience: Jennifer has over 30 years experience in brand building and communications including 16 years with Saatchi & Saatchi, twice as Chairman of the London office, and culminating in her role as Chairman and CEO of Saatchi & Saatchi North America. In the early 1990s she led her own advertising agency, Laing Henry, which was subsequently sold to Saatchi & Saatchi. Jennifer is currently a non-executive director of Conviviality Plc and a trustee of the IHG Foundation.
PAM POWELL NON-EXECUTIVE DIRECTOR
Appointed to the Board: May 2013. Skills and experience: Pam has more than 20 years marketing experience developing some of the world’s leading consumer brands. Most recently, she was the Group Strategy and Innovation Director for SAB Miller, one of the world’s leading brewers. Pam spent nine years at SAB Miller in senior management roles and prior to that held numerous marketing roles in the home and personal care sector during a 13 year career at Unilever plc, culminating in her role as global Vice-President of the Skin Care category. Pam is also a non-executive director at A.G. BARR p.l.c.
Committee Membership
Audit Committee
Remuneration Committee
Nomination Committee
denotes Committee Chair
Biographies for the Executive Leadership Team can be found on our website www.premierfoods.co.uk/about/leadership
INTRODUCTION STRATEGIC REPORT GOVERNANCE FINANCIAL STATEMENTS 43

Does the Board meet with shareholders?The Board believes it is very important to engage with our shareholders. Communication with institutional investors is via presentations, conference calls and investor roadshows. Communication with smaller shareholders is via our website and the AGM. The Chairman, SID and Committee Chairmen, also meet with shareholders on specific issues. For further information on stakeholder relations go to page 69.
GOVERNANCE
What is corporate governance?The Code describes corporate governance as the system by which companies are directed and controlled. The Board of directors is responsible for the governance of the Company. The shareholders’ role in governance is to appoint the directors and the auditor and to satisfy themselves that an appropriate governance structure is in place. The responsibilities of the Board include setting the Company’s strategic aims, providing the leadership to put them into effect, supervising the management of the business, monitoring performance and reporting to shareholders on their stewardship. The Board’s actions are subject to laws, regulations and the shareholders in general meeting.
How long have the Board been in their roles?The average appointment of our directors is just under 4 years. Tenure of individual appointments can be seen in the graph on the right. Our Board evaluation determines if individual directors continue to be effective and considers if new appointments are needed to refresh the balance of skills on the Board.
How does the Board report to shareholders?The annual report is an update for shareholders on the Company’s stewardship of their assets and key Company developments in the year. The financial statements are audited by the auditor, who is appointed by, and report to, our shareholders.
The main source of information is via the Board pack which is designed to keep directors up-to-date with all material business developments in advance of Board meetings, in addition training on specific issues is provided as and when required. The Board pack contains the following standing items:
CEO introduction;H&S and employee issues;SBU Commercial updates;Customer service levels; Strategic projects; Capital expenditure; CFO report; and Investor Relations.
How do directors keep up-to-date on the Company’s performance?
The Board held nine scheduled Board meetings during the year and a number of other meetings convened for specific business. In addition there were three Audit, three Remuneration and two Nomination Committee meetings in the year. All directors are expected to attend the AGM, scheduled Board meetings and relevant Committee meetings, unless they are prevented from doing so
by prior commitments. Where a director is unable
to attend a meeting they have the opportunity to read the papers and ask the Chairman to raise any comments. They are also updated on the key discussions and decisions which were taken at the meeting. Non-executive directors also have the opportunity to meet to discuss the Company without management present. Details of Board and Committee membership and attendance at meetings are set out in the table on page 47.
How often are Board and Committee meetings held?
Premier Foods plc Annual report for the 52 week period ended 2 April 201644

Shareholders
Diversity
Who appoints directors?The Board has the power to appoint one or more additional directors. Under the Articles any such director holds office until the next AGM when they are eligible for election. Shareholders may appoint, re-appoint or remove, directors by an ordinary resolution. In accordance with the Code all our directors offer themselves for re-election every year.
What induction do new directors receive?All directors receive a tailored induction on joining the Board covering their duties and responsibilities as directors. Non-executive directors also receive a full briefing document on all key areas of the Company’s business and they may request further information as they consider necessary. A typical non-executive director induction would include meetings with the Executive Leadership Team (ELT) and key management, site visits and an induction & governance pack.
What is the role of the Committees? The Board delegates responsibility for the oversight of Board composition, financial performance, internal controls and remuneration strategy to its three Committees. Their terms of reference are available on the Company’s website. Details of the work of the Audit, Remuneration and Nomination Committees are set out on pages 46 to 66.
In addition the Board delegates day-to-day responsibility for managing the business to the ELT and its sub-committees. Together, these form part of the Company’s corporate governance framework. To read more about the work of some of these Committees go to governance section of our website:
The Chairman is responsible for the leadership of the Board and ensuring its effectiveness and promoting the highest standards of corporate governance. He chairs Board meetings ensuring timely and accurate distribution of information and full review and discussions of agenda items. The CEO is responsible for the day-to-day management of the Company working with the ELT to ensure the
implementation of the agreed strategy. The Senior Independent Director (SID) supports the Chairman and leads the non-executive directors in the oversight of the Chairman and CEO. He is also available to shareholders if they have concerns that cannot be raised through normal channels. Further information on these roles can be found on our website.
Audit Remuneration Nomination
Who does the Board look for when appointing a new director? When selecting a new director the Board considers a broad range of skills, backgrounds and experience reflecting both the type of industry and the geographical locations in which we operate. In 2011 the Board adopted a policy to have at least two female Board directors by 2015 and this target was successfully achieved in May 2013. For further details on our approach to diversity go to the Responsibility Section on page 25.
29%of our Board are female
Pam Powell
Ian Krieger
David Beever
Jennifer Laing
Richard Hodgson
8.25
3.5
3.5
3.0
1.25
0 1 2 3 4 5 6 7 8Year’s Service
How are the roles of the Board divided?
www.premierfoods.co.uk/about/governance
INTRODUCTION STRATEGIC REPORT GOVERNANCE FINANCIAL STATEMENTS 45

On behalf of your Board, I am pleased to present the Nomination Committee Report for the period ended 2 April 2016. The Committee is responsible for;
• considering the size, structure and composition of the Board;
• conducting annual Board and Committee evaluations;
• leading the formal, rigorous and transparent process for appointment of directors; and
• making appointment recommendations so as to maintain an appropriate balance of skills, knowledge and experience on the Board.
The Committee also reviews the succession requirements of the Board and senior management on an annual basis and makes recommendations to the Board as appropriate. Committee membership and meeting attendance is set out on pages 43 and 47.
Board and Committee evaluationWe view our Board evaluation as a three year cycle. In 2013 Springboard Associates Limited (who had no other connection with the Company) were appointed to conduct an external Board and Committee evaluation and the process, findings and resulting action plan (External Action Plan) were reported in the 2013 annual report. In the following two years the evaluation for the Board and its Committees has been conducted by way of an internal questionnaire, which has built on the process and findings of the External Action Plan.
A summary of progress against the External Action Plan and additional recommendations from last year’s review together with actions for the next 12 months are set out below.
StrategyThe External Action Plan noted that following the Capital Re-financing Plan and Hovis Joint Venture the Company needed to review its strategy. In 2014, the Board developed its strategy for the medium-term with the first three year business plan for a number of years. A new purpose and set of values were created to support these medium and long-term goals. During 2014/15 the Board reviewed the Company’s strategy as part
of the normalised three year business planning framework and proposals from each SBU on the opportunities to significantly accelerate our growth strategy. The 2015/16 Board evaluation noted that strategic planning had become more robust with a fully bottom-up approach and detailed downside risk analysis. Annual strategic reviews allow for emerging opportunities and threats to be factored into the medium and long-term business plan. For 2016/17 the Board aims to focus on how financial and human resources can best be deployed to achieve the base, and stretching growth plans. Another key strategic focus for the coming year will be leveraging our co-operation agreement with Nissin to provide mutual growth opportunities, to read more about this go to the CEO review on pages 6 to 7.
PerformanceIn accordance with the Board’s role to set the strategy and monitor its implementation by management, performance was naturally an important area of focus in the External Action Plan. Increased awareness of the external environment and competitors was progressed following the External Action Plan with a comprehensive programme of competitor product testing and New Product Development (NPD) review introduced at Board meetings. SBU updates provided the Board with greater insight into market trends and competitor actions. In 2015/16 the performance focus shifted to post investment reviews on major capital projects and in the year the Board received updates on the implementation of the £20m Mr Kipling snack pack line, the Hovis Joint Venture and the Knighton Foods business. For the coming year (2016/17) the Board evaluation has identified a desire to continue with post investment reviews and to further improve the Board’s awareness of NPD via increased reporting of NPD performance metrics at meetings.
SuccessionAnother area of key focus for the Nomination Committee is succession planning. The External Action Plan highlighted the continued need for succession plans for executive directors and senior management. The move to a SBU structure in 2014 and investment in senior commercial management
has helped facilitate succession planning. On the non-executive front, the 2014 Board evaluation identified a need for more experience from a retail customer perspective which culminated in the appointment of Richard Hodgson.
In December 2015, the annual talent management process included detailed succession plans for each member of the ELT. In February 2016 a new Managing Director was appointed for the International SBU. The induction allowed for an effective hand over period, allowing joint travel to overseas markets to meet with our business partners and customers. In addition robust succession plans for the CEO and CFO were reviewed by the Nomination Committee in May 2016.
The Committee believes that succession planning and individual development are important at every level in the organisation. As a former University trustee and an engineering graduate, I am particularly interested in our focus on skills for young people, as it is through the graduate and apprenticeships programmes of today that we will produce the leaders of tomorrow. Whenever a role becomes available, we are mindful of the benefits that diversity can bring to our organisation. In 2016/17 we will be strengthening our approach to building a more diverse workforce, which will include the creation of a diversity working group, formalising the Company’s diversity reporting and KPIs, and making sure we are fully prepared for the requirement to report on gender pay (which comes into force in 2018). To read more about our approach to diversity and investment in people go to pages 24 and 25.
Board processIt is important to get the procedural aspects of Board meetings right in order to get the most out of meetings. The External Action Plan recommended that the annual appraisal plan for directors be formalised with the scheduling of one-to-one performance reviews with each non-executive directors and with myself in 2014. Non-executive directors also received bespoke training sessions in a number of specific areas such as the investment strategy of the Group’s pension schemes. In 2015 the frequency and format of Board meetings was reviewed. It was agreed that
GOVERNANCE
Nomination Committee reportDear shareholder,
Premier Foods plc Annual report for the 52 week period ended 2 April 201646

the number of scheduled Board meetings could be reduced following the Company’s successful capital restructuring. The format of meetings was revised to reflect the structure of the business with commercial updates being received from the SBUs. For the coming year we aim to provide additional time for review of our responsibility agenda which is becoming an area of increased focus. Following my one-to-one meetings with non-executive directors any refresher or bespoke training will be provided as necessary.
Risk managementThe External Action Plan highlighted the need to identify high performers and to manage their careers. Mitigation of these talent management and key individual risks was bolstered in 2014 through increased investment in performance development and learning tools and the launch of a new annual bonus plan for management grades below Board level. The new plan includes a share element to increase alignment between wider management and shareholders. A full discussion of key risks to the Group’s strategy is presented by the Board on pages 28 to 31. As a reflection of the importance of risk management to the Board the focus in 2014/15 shifted to a formal review of the risk appetite of the Group and increasing updates on significant risks. Whilst the Audit Committee is constantly focused on identifying risks in all areas of the business, on two occasions each year a formal risk review process is presented to the full Board. In 2015/16 directors additionally received an executive summary of significant risks facing the Company in each Board pack. In the coming year, risk management will focus on the risks to our accelerated growth strategy and long-term consumer trends which affect the categories in which we operate. To read more about these trends go to the Marketplace section on pages 8 and 9.
Review of non-executive director performanceOver the course of the year, my review of non-executive directors performance covered attendance, preparation for and contribution at meetings, their knowledge and understanding of the business and any training and development requirements.
Assessment of Chairman’s performanceRecognising the importance of the role of the Chairman in the overall governance of the Company, as part of our annual Board evaluation process, Ian Krieger, the SID, led a review of the Chairman’s performance over the year. A meeting was held in May 2016 with the other non-executive directors, without the Chairman being present. The review focused on the relationship between the Chairman and the CEO, the overall leadership of the Board, the governance process, the conduct of Board meetings and the quality of debate. In addition, the Chairman’s relationship with major shareholders and his understanding of their priorities was discussed.
A summary of the key findings was discussed at a subsequent meeting between the SID and the Chairman. The review concluded that David Beever had no other significant external commitments, was able to dedicate sufficient time to the role and continued to perform an effective role as Chairman.
Board and Committee meetingsDetails of Board and Committee membership and attendance at scheduled Board and Committee meetings are set out in the table below. This indicates the number of meetings attended versus the number of meetings held during the year. Richard Hodgson missed two Board meetings during the year due to pre-arranged overseas business commitments and David Beever missed one meeting due to a personal family commitment. All directors attended the 2015 AGM.
Executive directors BoardAudit Committee
Remuneration Committee
Nomination Committee
Gavin Darby 9/9 – – –
Alastair Murray 9/9 – – –
Non-executive directors
David Beever 8/9 – 3/3 2/2
Richard Hodgson 7/9 1/3 – 2/2
Ian Krieger 9/9 3/3 3/3 2/2
Jennifer Laing 9/9 3/3 3/3 2/2
Pam Powell 9/9 3/3 3/3 2/2
Charles Miller Smith1 1/2 – – 0/1
1 Charles Miller Smith attended the April Board meeting but did not attend the May Board or Nomination Committee meetings, before his retirement on 1 June 2015.
Following the completion of the Board evaluation process it was agreed that the Board contained an appropriate balance of skills, experience, independence and knowledge of the Company to enable them to discharge their respective duties and responsibilities effectively. It was concluded that each non-executive director continued to make an effective contribution to the Board and consequently the Committee has proposed the re-election of all directors at the 2016 AGM. The tenure of the current Board members can be found on page 45.
In the coming year we plan to have our annual Board evaluation externally facilitated in accordance with the recommendations of the Code. I look forward to working with the selected provider who will be able to bring an external perspective on our progress.
David BeeverNomination Committee Chairman
16 May 2016
INTRODUCTION STRATEGIC REPORT GOVERNANCE FINANCIAL STATEMENTS 47

On behalf of your Board, I am pleased to present the Audit Committee Report for the period ended 2 April 2016. The Committee has responsibility, on behalf of the Board, for reviewing the effectiveness of the Company’s financial reporting systems and the internal control policies and procedures for the identification, assessment and reporting of risk.
The Committee also keeps under review the relationship with the external auditor, including the terms of their engagement and fees, their independence and expertise, resources and qualification, and the effectiveness of the audit process. The Committee met with the internal and external auditor on one occasion in the year without the presence of management. Committee membership and meeting attendance is set out on pages 43 and 47.
I was appointed as Audit Committee Chairman in April 2013 following my retirement as a senior partner of Deloitte in 2012, qualifications of other Committee members are set out on page 43. In addition to the Committee members, the following individuals are regularly invited to the Committee’s meetings: the CEO, CFO, Director of Internal Audit and Risk and external audit lead partner. The Company Secretary also attends in his capacity as secretary of the Committee.
Audit tenderThe Code recommended that companies put their external audit contract out to tender at least every 10 years. As explained in more detail in last year’s annual report, PricewaterhouseCoopers LLP (PwC) were retained to audit their 11th set of financial statements for the 2014/15 financial period due to significant business change in the period.
There are no contractual obligations restricting the Committee’s choice of auditor and shortly after the conclusion of last year’s annual report a tender exercise got underway. A number of audit firms were requested to tender for the contract, including PwC, and a shortlist of three firms advanced to the final stage of the tender process. The Committee recommended the appointment of KPMG LLP (‘KPMG’) based on an impressive proposal, the experience of their lead partner and a competitive fee structure. The Board’s appointment of KPMG was announced in September 2015.
External audit effectivenessThe Code recommends an annual review of the relationship the Company has with the external auditor. Given that KPMG were newly appointed and had not completed a full audit cycle it was not deemed appropriate to undertake a review in 2015/16. Immediately after their appointment KPMG commenced work on the Company’s half year results which were released to the market in November. Management found KPMG’s approach to the half year results to be effective and accordingly no concerns were identified in the lead up to the year end audit process. It is envisaged that shortly after the completion of the 2015/16 audit cycle an effectiveness review of KPMG’s performance will be conducted, which will allow any recommendations to be incorporated into the planning process for the half and full year results for the 2016/17 period.
Auditor independence and non-audit servicesThere is an established policy governing auditor independence and the engagement of the external auditor for non-audit services designed to maintain the independence and objectivity of the external auditor and the key terms of the current policy are available on the Company’s website.
Over the last few years the Company has undergone a very significant transformation as management have implemented the turnaround of the business. This had resulted in the external auditor being engaged to perform a number of non-audit services. As highlighted in last years annual report, now that the business has returned to a more stable footing the level of non-audit fees has reduced. However, following the unsolicited indicative offer for the Company from McCormick & Company, Inc., KPMG, as statutory auditor, were engaged to perform an additional financial review and to provide a limited amount of advice on the Company’s pension schemes. As a result, non-audit fees for the year were £120,032 representing approximately 26% of the audit fee (2014/15: £567,500).
In accordance with our Auditor Independence Policy the Committee has continued to review the level of non-audit fees with management during the year. The Committee also received an
update from KPMG’s lead partner on the internal controls which they employ to safeguard their independence, together with confirmation that the audit engagement with the Company is not financially significant to the firm as a whole or to the office which handles the audit.
Risk managementDetails of our risk management process are set out in the risk management section on pages 28 to 31. Details of financial risks: market risk; credit risk and liquidity risk and others are set out in note 22 on pages 109 to 117.
Internal controlsIn accordance with the FRC guidance on audit committees an annual review of internal controls is conducted. The Board has delegated authority to the Audit Committee to regularly monitor internal controls and conduct the full annual review. This review covers all material controls such as financial, operational and compliance, and also the overall risk management system in place throughout the year under review up to the date of this annual report. The Committee reports the results of this review to the Board for discussion and, when necessary, agreement on the actions required to address any material control weaknesses. The Committee confirms that it has not been advised of any failings or breaches which it considers to be significant during the financial period and found the internal controls to be effective.
Internal Audit effectivenessThe effectiveness of the Company’s internal audit function is reviewed on an annual basis. The review was conducted with the Committee and the ELT and covered the function’s independence, resource, the scope of the annual audit plan, the reports issued and the identification of issues. In addition, feedback from post completion questionnaires for internal audits undertaken during the period were also reviewed. The Committee concluded that the internal audit function remained effective.
Fair, balanced and understandableThe Board requested that the Audit Committee confirm whether the annual report and accounts taken as a whole were fair, balanced and understandable
GOVERNANCE
Audit Committee reportDear shareholder,
Premier Foods plc Annual report for the 52 week period ended 2 April 201648

and whether it provided the necessary information for shareholders to assess the Company’s performance, business model and strategy. The Audit Committee recommended that the Board make this statement which is set out on page 68.
In making this recommendation the Committee considered the process for preparing the annual report which included regular cross functional reviews from the teams responsible for preparing the different sections of the report, senior management review, verification of the factual contents, a review of the balance and consistency of information, the disclosure of risk and the key messages presented in the report.
Significant issues in relation to the financial statements The Committee considered the following significant issues in relation to the financial statements with management and the internal and external auditor during the year:
Carrying value of goodwill and brandsGoodwill and brands represent a significant item on the balance sheet. The value of goodwill is reviewed annually by management and the Committee and brands are reviewed where there is an indicator of impairment. The impairment testing for goodwill and brands is based on a number of key assumptions which relies on management judgement. The Company has three cash generating units (CGUs) – Grocery, International and Sweet Treats. The International business has no goodwill or intangible assets.
The Committee reviewed the results of impairment testing in the CGUs. The entire carrying value of goodwill in the Sweet Treats CGU was written off in the prior financial period. The results of the impairment testing included management’s assumptions in respect of cash flows, long-term growth rates and discount rates. The Committee also considered sensitivities to changes in assumptions and related disclosure as required by IAS 36. This year’s review concluded that there was sufficient headroom and that each key assumption would need to move by a significant degree before an impairment would be required. Further information is set out in notes 13 and 14 on pages 101 to 104.
Commercial arrangementsCommercial payments to customers in the form of rebates and discounts represent significant balances in the income statement and balance sheet. Calculations of these balances are complex and require management assumptions and estimates. During the year the Company rolled out an integrated SAP solution into its commercial functions which helped reduce complexity and improve management of trade promotions enabling the generation of a ‘one number’ forecast. The Committee reviewed the assumptions and estimates and the level of accruals and provisions in detail. The Committee also reviewed management’s internal processes and controls, internal audit review of the implementation of the new SAP solution and, where appropriate, any management actions. Further information is set out in note 3.3 on page 86.
Defined benefit pension plansThe Company operates a number of defined benefit schemes. The schemes are closed to future accrual but hold substantial assets and liabilities. Valuation of the scheme is based on a number of assumptions such as inflation, discount rates and mortality rates, each of which could have a material impact of the valuation under IAS 19 included in the balance sheet. The Committee reviewed the basis for management’s assumptions and the movements in the IAS 19 valuation in detail over the year. Further information is set out in note 24 on pages 119 to 125.
Deferred tax assetsA deferred tax asset is an asset on a company’s balance sheet, which may be used to reduce taxable income. Valuation of the asset involves a number of assumptions including forecasts of future taxable profits and growth rates and assessment of historic forecasts. During the year the net IAS 19 surplus created a deferred tax liability which has reduced the deferred tax asset compared to the prior financial period. The Committee will continue to keep under review any tax volatility between the income statement and other comprehensive income and management’s policy relating to the order in which deferred tax assets are recognised. Further information is set out in note 8 on pages 93 to 96.
Accounting for associatesAt the end of the year, management assumed control of the Knighton Foods business ('Knighton'). The Committee reviewed the basis on which this assumption of control was made which included financial support the Company extended to Knighton, dependence on key persons seconded by the Company to Knighton and the fact that a significant portion of Knighton's activities are conducted on behalf of the Company. Accordingly it was deemed appropriate to consolidate Knighton. Impairment testing for the Hovis and Knighton businesses was presented to the Committee and they agreed that the carrying value of the investments in Hovis and Knighton were impaired and should be fully written off. Further information is set out in note 17 on page 106.
What else did the Committee review during the financial period?During the financial period the Committee also discussed the following:
• Monitored financial reporting including the annual and interim reports, preliminary results announcements and formal announcements relating to financial performance and reporting;
• Considered the viability statement for the Company which can be found on page 29;
• Received regular reports from the internal audit function, ensured it was adequately resourced, monitored its activities and effectiveness, and agreed the annual internal audit plan; and
• Received updates on calls received from the whistle blowing helpline and on the Company’s Speaking Up policy which was re-launched in the year.
The report of those matters that the external auditor considered to be areas of focus in relation to the financial statements is set out on pages 70 to 73.
Ian KriegerAudit Committee Chairman
16 May 2016
INTRODUCTION STRATEGIC REPORT GOVERNANCE FINANCIAL STATEMENTS 49

GOVERNANCE
Directors’ Remuneration reportCommittee Chairman’s LetterDear shareholder,On behalf of your Board, I am pleased to present the Directors' Remuneration report for the period ended 2 April 2016.
Overview of remuneration strategyThe focus of our remuneration strategy is on rewarding performance – the majority of executive remuneration (approximately 70% at maximum) is variable and only payable if demanding performance targets are met. The performance measures are firmly linked to our strategy and ultimately aligned with shareholders’ interests to deliver earnings growth and improved shareholder value in the medium-term. The majority of variable pay is payable in the form of shares.
Further information on how executive remuneration links to our strategy and aligns with colleagues in the rest of the business is set out in the table opposite.
2015 AGMWhilst overall the Directors' Remuneration report received strong support at the AGM in 2015, there was a 15% vote against (full details of the votes are provided on page 62). The reasons for this negative vote were discussed by the Committee and it was concluded that there were a number of contributory factors rather than a single significant issue. These included the award of a pro rata adjusted Long Term Incentive Plan (LTIP) award to the CFO following the change in the Company’s year end, a desire to see more detailed disclosure on the annual bonus performance outcome for the year and the high salary levels of executive directors compared with companies of a similar market capitalisation. Over the year we have taken into consideration shareholders' views and, where possible, sought to address them in this year’s report. One of the changes implemented is a change of the comparator group for the LTIP from the FTSE 250 to the FTSE All Share Index as this captures the performance of a broad spectrum of companies including the FTSE Small Cap Index.
Remuneration considerations for 2015/16Following the approval of a new bonus scheme for management below Board level in April 2015 there have been no significant changes in remuneration arrangements over the year.
The Committee strengthened its recovery provisions with the approval of clawback arrangements in respect of the annual bonus plan for executive directors and the Executive Leadership Team designed to align, as closely as possible, with the recovery provisions already in place under the LTIP and Deferred Share Bonus Plan (DSBP). These apply over a two year period following the payment of a bonus in the event of a material misstatement of the Company’s financial results, an error in the amount awarded due to inaccurate or misleading information being provided to the Committee or in the event of fraud by a participant.
As disclosed in last year’s report the Committee determined that going forward the performance targets for the DSBP (which applies only to the CFO) will be aligned with those of the Annual Bonus plan. This simplifies arrangements whilst retaining the delivery of a significant proportion of any variable reward earned by the CFO in the form of shares, deferred for two years.
Following the Company’s change in year end in 2014 the comparative figures for 2014/15 in the Annual Report on Remuneration are on a 15 month basis versus 12 months for 2015/16. All payments to directors in the financial period and arrangements for 2016/17 are in accordance with our approved policy.
Performance outcome for 2015/16The Committee reviewed the CEO’s and CFO’s performance over the financial period and assessed the extent to which their annual bonus targets had been achieved.
As highlighted in the Chairman's Statement on pages 4 and 5, the Company made encouraging progress in 2015/16 in delivering its growth strategy. Trading profit of £131.0m was in line with last year and our target. The Committee
considered this to be a good performance taking into account the current deflationary market and the increase in investment made in the year which is crucial to support our future growth plans. This included a £3m increase in consumer marketing and significant incremental investment in people within our consumer insight, innovation, marketing and sales teams. There was also a significant reduction in net debt and successful delivery of financial savings targets. Details of performance against Strategic and Personal targets are set out on pages 54 and 55. As a result the Committee approved an award of 57.0% of total opportunity (£598,500) to Gavin Darby and 57.7% of total opportunity (£244,521) to Alastair Murray (for Alastair Murray this includes both annual bonus and DSBP). Gavin Darby has requested he receive his entire bonus in shares (net of income tax and employee national insurance).
In addition, the final tranche of Gavin Darby’s Co-Investment Award vested on 1 May 2016. No LTIP awards vested in the year.
Arrangements for the coming periodTargets for the annual bonus, DSBP and LTIP awards for 2016/17 have been set in the context of our recently announced accelerated growth plans and aligned with our increased guidance on sales growth of 2–4%.
A salary increase of 1%, in line with all colleagues not involved in collective bargaining, was approved for executive directors with effect from 1 April 2016. For a second year, Gavin Darby has elected not to take the increase and his salary therefore remains unchanged since his appointment in 2013.
The Director’s Remuneration Policy, which was approved in 2014, is required to be presented to shareholders for a binding vote every three years and will therefore be resubmitted at the AGM in 2017. The Committee will review the policy and whether any changes are required over the course of the year.
I look forward to your continuing support.
Jennifer LaingRemuneration Committee Chairman
16 May 2016
Premier Foods plc Annual report for the 52 week period ended 2 April 201650

How remuneration links with strategyThe following table summarises the performance measures for executive incentive arrangements and how they are aligned with our strategy (see our strategic model on pages 10 and 11).
Strategic priority Objective Measures for 2015/16 Incentive scheme
Delivery of our category growth strategy
Increase in earnings/ profitable growth
Trading profit
Adjusted EPS
Annual Bonus
Deferred Share Bonus Plan1
Long Term Incentive Plan
Reducing debt to organically deleverage the business and generate shareholder value
Debt reduction Net debt
Cash management
Annual Bonus
Deferred Share Bonus Plan1
Cultivating more responsive and valued customer partnerships
Unlocking our people’s potential
Being responsible and sustainable
Development of key stakeholder relationships
Strategic and personal objectives focused on commercial, customer and employee relationships
Annual Bonus
Deferred Share Bonus Plan1
Delivery of improved shareholder value over the medium-term
Share price growth Relative TSR Long Term Incentive Plan
1 The Deferred Share Bonus Plan only applies to the CFO.
Alignment of executive arrangements with wider work forceOur Directors' Remuneration Policy is set within the wider context of the remuneration policy for the entire workforce. The key differences of quantum and structure in pay arrangements reflect the different levels of responsibilities, skill and experience required for the role. Executive directors together with the other members of the Executive Leadership Team (ELT), have a much greater emphasis on performance based pay.
Salary increases for executive directors are considered together with all colleagues not involved in collective bargaining on an annual basis, with any changes coming into effect from 1 April each year. For those involved in collective bargaining, specific arrangements are in place at each site and these may be annual arrangements or form part of a longer-term arrangement linked to the delivery of efficiency targets. The Committee is kept updated on salary negotiations by regular briefings from the HR Director during the year.
Bonus arrangements for executive directors and the rest of the management population are reviewed annually with the quantum of opportunity set by reference to management grade. To ensure alignment within the Group, the same Trading profit targets and underpins apply across the bonus scheme and executive director’s strategic objectives are also cascaded to ELT members and the wider management population.
LTIP awards for executive directors and the rest of the ELT are also reviewed annually with the same performance conditions applying to all participants. ELT participation in long term incentive arrangements reflects their contribution to business performance and enhancing shareholder value.
The Committee recognises the importance of aligning colleagues across the business with those of shareholders and encourages share ownership in order to increase focus on the delivery of shareholder return. In 2014 all colleagues (excluding the ELT) were given an award of 500 free shares under the Share Incentive Plan and each year colleagues are invited to join the Company’s all employee Sharesave Plan. Participation in the 2015 Sharesave Plan represented 25% of the workforce.
Consideration of shareholders’ viewsThe Remuneration Committee and the Board considers shareholder feedback received in relation to the AGM each year at meetings in the lead up to and immediately following the AGM. This, and any additional feedback received from shareholders from time to time, is then considered by the Committee as part of the Company’s annual review of remuneration arrangements. Specific engagement with major shareholders may be undertaken when a significant change in remuneration policy is proposed or if a specific item of remuneration is considered to be potentially contentious.
How the Annual Report on Remuneration is structured• Remuneration of
executive directors pages 52 to 59
• Other disclosures pages 60 to 61
• Remuneration of non-executive directors page 61
• Work of the Remuneration Committee page 62
• Directors' Remuneration Policy (summary) pages 63 to 66
INTRODUCTION STRATEGIC REPORT GOVERNANCE FINANCIAL STATEMENTS 51

GOVERNANCE
Directors’ Remuneration report continued
Fixed Pay Annual Bonus
LTIP
CEOCFO
ANNUAL REPORT ON REMUNERATIONAn advisory vote on this Annual Report on Remuneration will be put to shareholders at the AGM on 21 July 2016.
Single figure table for Total Remuneration (audited)Single figure for the total remuneration received by each executive director for the period ended 2 April 2016 (12 months) and for the financial period ended 4 April 2015 (15 months).
Directors
Salary Taxable Benefits Pension Annual bonus Share based awards Total
2015/16(12 mth)
£’000
2014/15(15 mth)
£’000
2015/16(12 mth)
£’000
2014/15(15 mth)
£’000
2015/16(12 mth)
£’000
2014/15(15 mth)
£’000
2015/16(12 mth)
£’000
2014/15(15 mth)
£’000
2015/16(12 mth)
£’000
2014/15(15 mth)
£’000
2015/16(12 mth)
£’000
2014/15(15 mth)
£’000
Gavin Darby 700 881 19 31 140 176 599 307 293 342 1,751 1,737
Alastair Murray 404 503 20 26 34 41 245 125 – – 703 695
Benefits include those mentioned in the summary table in the Directors' Remuneration Policy report on page 65.
Gavin Darby received a basic salary for the period of £700,000 per annum and a salary supplement in lieu of pension of 20% of base salary. He was awarded a bonus of £598,500 representing 57.0% of his bonus opportunity in respect of the financial period. Under the Remuneration Policy 25% of any annual bonus payment to Gavin Darby will be awarded in the form of shares. The first 25% of his total bonus award will be awarded in July 2016 in shares with reference to the opening share price at the start of the financial period fixed at 42.0 pence. In addition, the final tranche of his Co-Investment Award, which comprised 751,814 shares, vested on 1 May 2016. For the purposes of this table the award has been valued at £293,207, based on the share price on 1 May 2016.
Alastair Murray received a basic salary for the period of £404,000 per annum and an annualised salary supplement in lieu of pension of 7.5% of the Earnings Cap (£149,400 for the 2015/16 tax year) which equates to £11,205 for the period together with an additional RPI adjusted pensions supplement of £22,548 in respect of the financial period. Alastair Murray was awarded a bonus of £244,521 representing 57.7% of his bonus opportunity in respect of the financial period (this comprises £177,558 in respect of his annual bonus and £66,963 in respect of the DSBP).
Remuneration scenarios and outcome for the yearThese graphs indicate the level of remuneration that could be earned by executive directors at minimum, mid-point and maximum under the Company’s current remuneration policy. In addition the actual level of remuneration received in the year is included for comparison.
The scenarios are based on remuneration levels as at 2 April 2016.
Minimum = fixed pay only (base salary, benefits and pension).
Mid-point = fixed pay plus 50% of annual bonus and DSBP payable and 50% of LTIP vesting.
Maximum = fixed pay plus 100% of annual bonus and DSBP payable and 100% of LTIP vesting.
Excludes Gavin Darby’s Co-investment Award as this does not form part of his ongoing remuneration. As the DSBP is based on annual performance it is included within annual bonus. The value of share awards does not include any assumptions on share price movements.
100%
£860
£2,085
£3,310
£1,458
£463
£983
£1,503
£70341% 26% 59%
100% 31% 65%
25%
32%34%
42%
41%41%
28%31%
22% 35%
47%
Minimum MinimumMid-point Mid-pointMaximum MaximumActual 2015/16
Actual 2015/16
Premier Foods plc Annual report for the 52 week period ended 2 April 201652

Base salary and fees (executive directors) (audited)The Committee sets base salary by reference to the size and complexity of the business based on factors such as revenue, market share, and total enterprise value rather than just market capitalisation, which can be highly volatile as a result of the Group’s capital structure. Given the challenges facing the business in 2013, the Board felt it was important to appoint a CEO and CFO with significant experience to lead the Company through a period of significant change and consequently their salaries are set at the upper quartile for the FTSE 250. The business turnaround has involved the establishment of a joint venture for the Hovis bread business and the completion of a successful restructuring of our financial structure with the introduction of a new smaller lending group, an equity raise, the diversification of funding through a high yield bond and also the completion of a new agreement with the Group’s pension trustees. The retained business has now been re-organised into three strategic business units (SBUs) to be more closely aligned with the way our customers are structured and a new senior management team has been brought in to lead the SBU business structure. The Committee is mindful of these salaries when considering pay increases and elements of variable pay which are based on multiples of salary.
In line with the salary increase to all employees not involved in collective bargaining the Committee approved a 1% salary increase for the CEO and CFO in 2015/16 and also in respect of 2016/17 (these took effect from 1 April 2015 and 1 April 2016). Gavin Darby has elected not to take either salary increase and therefore his salary remains unchanged from his appointment in 2013.
Executive director 2 April 2016 Change 4 April 2015 Change 31 December 2013
Gavin Darby £700,000 – £700,000 – £700,000
Alastair Murray £408,000 +1% £404,000 +1% £400,000
Annual Bonus (executive directors) (audited)Each year the Committee sets individual performance targets and bonus potentials for each of the executive directors. Annually the Committee reviews the level of achievement against the performance targets set and, based on the Committee’s judgement, approves the bonus of each executive director. Annual bonus payments are not pensionable.
Performance assessment for 2015/16The Committee undertook a full and detailed review of the performance of each executive director against the targets set at the start of the period. This took into account the financial performance of the business as a whole as well as an assessment of the market in which the Company operates. It also considered whether the outcomes of the application of the present targets reflected the performance of the business and the executives. Having carefully considered these factors, the Committee was satisfied that the application of the originally set targets was appropriate and approved an award of 57.0% of total opportunity (£598,500) for Gavin Darby and 58.6% of total opportunity (£177,558) for Alastair Murray. For Alastair Murray the same financial and strategic performance measures applied to his DSBP award, for more information see page 57. The first 25% of Gavin Darby’s total bonus is awarded in shares with the price fixed at the start of the financial period. The Committee considers this to be an effective way of increasing alignment of the CEO’s interests with those of shareholders and incentivising value growth. Gavin Darby has requested that the remaining cash bonus payment for 2015/16 be used to acquire shares (net of income tax and employee national insurance).
Financial targetsThe Company delivered Trading profit for the period of £131.0m which was in line with last year and our target level of profit for the Annual Bonus plan. Following an assessment of performance the Committee concluded this was a good performance taking into account the current deflationary market and the increase in investment made in the year which is crucial to support our future growth plans. This included a £3m increase in consumer marketing and significant incremental investment in people within our consumer insight, innovation, marketing and sales teams. This achieved an award of half of the maximum opportunity for this element. Additional financial measures applied to the CFO’s bonus. Net debt reduced by over £50m, which exceeded target, and the operational efficiency savings and SG&A cost control measures were both on target. Full details are set out on pages 54 and 55.
Strategic and personal performance assessmentThe detail of strategic and personal targets and performance is also set out in the tables on pages 54 and 55. Individual weightings have been provided for each strategic objective. Performance against personal objectives was assessed on an individual basis, however, the Committee agreed that it was appropriate to provide a combined performance outcome for this element of bonus.
INTRODUCTION STRATEGIC REPORT GOVERNANCE FINANCIAL STATEMENTS 53

GOVERNANCE
Directors’ Remuneration report continued
Gavin DarbyAnnual Bonus
Performance measure Target StretchPerformance outcome Weighting
Outcome (% of max
bonus)
Financial objectives (subject to a Trading profit underpin of £127m)
Trading profit £131m £138m £131m 50% 25%
50% 25%
Performance measure Performance outcome Weighting
Outcome (% of max
bonus)
Short to medium-term strategic objectives (subject to a Trading profit underpin of £127m)
Commercial growth opportunities
The Committee agreed that excellent progress had been made in this area allowing the initial part of the objective to be achieved. However, as commercial negotiations were ongoing the balance of the objective would roll forward and be assessed fully next year.
8.0% 4.0%
Three year plan A detailed bottom up three year plan, with challenging stretch plans, was reviewed and approved by the Board resulting in the identification of a number of new growth initiatives and a doubling of medium-term guidance to 2–4%.
8.0% 7.0%
Accelerating the International business
Successful establishment of new International team and the appointment of a new Managing Director. Key initiatives undertaken with major customers in USA, Australia and Ireland resulting in sales growth of 18% in 2015/16 (on a constant currency basis).
5.3% 4.0%
Investor relations and broadening shareholder base
Strong engagement including shareholder visits to the USA targeting new investors and a successful capital markets day at our Carlton site attended by around 40 analysts and investors. However, an important element of the objective was to broaden the shareholder base and the Committee determined that this element had not been achieved in the period.
8.0% 2.0%
Hovis Joint Venture Strong relationship developed with JV partner and a new long-term plan approved, however, the Committee concluded that the specific objective had not been met.
4.0% -
33.3% 17.0%
Personal objectives
Customer relationships Strong relationships built through regular direct contact with senior management following a period of significant change in strategic focus and personnel at a number of key customers.
2015 All employee survey 84% response rate (up from 78% in 2013) and substantial improvements made in all areas compared to the results of the last survey in 2013. Action plan prepared to address feedback from survey which is now being implemented.
Stakeholder engagement Proactive role with Institute of Grocery Distribution (IGD), Food and Drink Federation (FDF) and other key stakeholders to drive the health and wellness agenda. The Company has revised and adopted a progressive three year nutritional strategy and was one of the first signatories of the Courtauld 2025 environmental commitments.
16.7% 15.0%
100% 57.0%
Premier Foods plc Annual report for the 52 week period ended 2 April 201654

Alastair MurrayAnnual Bonus
Performance measure Target StretchPerformance outcome Weighting
Outcome (% of max
bonus)
Financial objectives (subject to Trading profit underpin of £127m)
Trading profit £131m £138m £131m 25% 12.5%
Net Debt £540.6m £530.6m £534.2m 10% 8.0%
Operational efficiency savings £7m £10m £7m 10% 7.5%
SG&A cost control £36.1m £34.6m £36.1m 5% 4.0%
50% 32.0%
Performance measure Performance outcome Weighting
Outcome (% of max
bonus)
Short to medium-term strategic objectives (subject to a Trading profit underpin of £127m)
Investor relations and broadening shareholder base
Strong engagement including shareholder visits to the USA targeting new investors and a successful capital markets day at our Carlton site attended by around 40 analysts and investors. However, an important element of the objective was to broaden the shareholder base and the Committee determined that this element had not been achieved in the period.
16.7% 5.0%
Corporate development Detailed review of strategic opportunities to accelerate growth and to deleverage the business undertaken. The Committee concluded that whilst part of the objective had been successfully completed other elements had yet to be concluded and could only be assessed in 2016/17.
11.1% 5.5%
Treasury and risk management Effective management of working capital allowed for the cancellation of our debtor securitisation facility. Development of effective relationships with bondholders and rating agencies and single B rating maintained.
5.5% 5.0%
33.3% 15.5%
Personal objectives
Shared service centre operational efficiency
Introduction of new leadership resulting in improved efficiency, effectiveness and an enhanced control environment, with further actions to be implemented.
Cash forecasting and budgeting
Successful implementation of new IT system to integrate and improve forecasting and budgeting.
External audit tender Completion of audit tender.
2015 All employee survey Strong engagement from Finance team and an average 17% improvement in favourable scores from the previous survey in 2013.
16.7% 11.1%
100% 58.6%
INTRODUCTION STRATEGIC REPORT GOVERNANCE FINANCIAL STATEMENTS 55

GOVERNANCE
Directors’ Remuneration report continued
Annual bonus measures for 2016/17The Committee has determined that the structure for the annual bonus scheme will continue on a similar basis to last year, details of which are set out below. The financial performance measures for 2016/17 continue to be heavily based on Trading profit as this is aligned to the Company’s strategy of category growth. For the CEO it includes an element of revenue growth aligned with our increased sales growth guidance and for the CFO it includes the delivery of further net debt reduction, reflecting the importance of organically deleveraging the business. Sales, Trading profit and Net debt are all KPIs (see page 20). Strategic objectives reflect the Company’s recently announced accelerated growth plans and the commercial opportunities from our collaboration with Nissin. The Board considers the financial targets and certain of the strategic targets to be commercially sensitive but has agreed that they will be disclosed as part of the performance assessment in next year’s annual report. The financial and strategic targets contain a Trading profit underpin.
The first 25% of Gavin Darby’s total bonus will be awarded in shares with the price fixed at the start of the financial period and the whole of any award to Alastair Murray under the Deferred Share Bonus Plan shall be in the form of shares deferred for two years (see page 57 for further details).
CEO CFO
Maximum opportunity as a % of salary 150% 75%
Performance measure Weighting Weighting
Financial objectives (subject to a Trading profit underpin)
Trading profit 40% 30%
Revenue growth 10%
Net debt 20%
50% 50%
Short to medium-term strategic objectives (subject to a Trading profit underpin)
CEO 33.3%
• Delivery of growth acceleration though a number of initiatives including further expansion within International and developing incremental growth and value initiatives through the co-operation agreement with Nissin.
• Corporate development opportunities.
• Management of the Hovis Joint Venture and re-integration of Knighton.
• Investor relations
CFO 33.3%
• Management of Hovis Joint Venture and re-integration of Knighton.
• Corporate development opportunities.
• Strategic cost and efficiency opportunities.
• Evaluating financial synergies from our co-operation agreement with Nissin.
• Developing relationships with the Group’s pension trustees and agreeing the 2016 actuarial valuation.
Personal objectives
CEO 16.7%
Deepen Customer relationships/ Develop and implement diversity strategy/ Stakeholder management
CFO 16.7%
Delivery of KPIs for the Company’s shared service centre/ Delivery of investor relations strategy/ Completion of IT enabling and efficiency project/ Improved efficiency within audit and control
100% 100%
Premier Foods plc Annual report for the 52 week period ended 2 April 201656

Deferred Share Bonus Plan (DSBP)Alastair Murray participates in the DSBP which operates alongside the Annual Bonus plan with a maximum opportunity of 30% of salary. The CEO does not participate in the DSBP. Awards can be based on the achievement of a range of Company-wide financial and strategic targets which are set at the start of each financial period. If the objective is met, the bonus earned will be converted into shares following the announcement of the results for the financial period and deferred for a period of up to two years. These shares are subject to forfeiture over the period of deferral and the shares for these awards are sourced in the market.
DSBP award for 2015/16For 2015/16 the Committee determined that the performance targets for the DSBP would be aligned with those of the Annual Bonus plan (excluding personal objectives). This simplifies the CFO’s remuneration arrangements whilst retaining the delivery of a significant proportion of any variable reward earned by Alastair Murray in the form of shares deferred for two years. The two performance conditions were split 50:50 between financial and strategic measures and full details of the performance outcome is set out in the table on the 2015/16 annual bonus on page 55. The Committee approved an award of 55.3% of total opportunity (£66,963) which will be made in the form of shares.
Deferred Share Bonus Plan CFO
Maximum opportunity as a % of salary 30%
Performance Measures (subject to a Trading profit underpin of £127m) Weighting Outcome
Financial 50% 32.0%
Short to medium-term strategic objectives 50% 23.3%
100% 55.3%
DSBP award for 2016/17The Committee has determined that for 2016/17 the DSBP will operate on the same basis as last year and details of the financial and strategic objectives are set out in the table on 2016/17 annual bonus on page 56.
Long Term Incentive Plan (LTIP)The current LTIP was approved by shareholders in 2011; awards have two elements, performance shares and matching shares. The Committee determined in 2012 that whilst the business is in turnaround and the share price continues to be volatile, awards under the LTIP will take the form of performance shares only.
LTIP award for 2015/16As advised last year the award to Alastair Murray was increased pro rata, on a one-off basis, to reflect the longer 15 month period following the change in year end. No adjustment was made to the size of the award to Gavin Darby in 2015.
Basis of awardValue on
award date Performance period
Gavin Darby 200% £1,400,000 05.04.15 – 31.03.18
Alastair Murray 187.5% £757,500 05.04.15 – 31.03.18
Performance measure Weighting Targets
Below threshold Threshold Stretch
Relative TSR1 2/3 < Median Median
Upper
quartile
Adjusted EPS2 1/3 < 8.97p 8.97p 10.00p
% of relevant portion of award vesting3 0% 20% 100%
1 Measured against the constituents of the FTSE 250 Index (excluding investment trusts) around the start of the period.
2 2014/15 base year EPS was 8.0p.3 Straight line vesting between threshold and stretch.
INTRODUCTION STRATEGIC REPORT GOVERNANCE FINANCIAL STATEMENTS 57

LTIP award for 2016/17For the 2016/17 award the Committee proposes to use the same measures as the 2015/16 LTIP award, i.e. a relative TSR condition (comprising 2/3rds of the award) and an adjusted EPS condition (comprising 1/3rd of the award), which is aligned with the Company’s strategy to deliver sustainable earnings growth and improved shareholder return over the medium-term. The Committee believes that these measures are fully aligned with the interests of shareholders at this stage in the Company’s turnaround and that awards will only vest following the achievement of stretching performance targets.
The Company is a member of the FTSE Small Cap Index, however, for a number of years the Company has used the FTSE 250 Index as the comparator group for the TSR measure as this is aligned with the size and scale of the business in terms of turnover and enterprise value. Over the year the Committee reviewed the comparator group and has concluded that the FTSE All Share Index is a more appropriate index to use as this includes a wide range of companies, including the members of the FTSE Small Cap Index. The TSR condition requires at least a median ranking to be achieved for 20% of this part of the award to vest, with full vesting taking place for an upper quartile ranking against the constituents of the FTSE All Share Index (excluding investment trusts). The EPS targets reflect our recently announced accelerated growth plans and the additional investment required to deliver them. The Committee considers the targets to be challenging, particularly in the context of current growth levels in the markets in which we operate. The Compound Annual Growth Rate (CAGR) ranges from 3.5% to 7.11%. Further details of all outstanding LTIP awards are provided in the table on page 59.
Basis of award
Value on award date Performance period
Gavin Darby 200% £1,400,000 03.04.16 – 31.03.19
Alastair Murray 150% £612,000 03.04.16 – 31.03.19
Performance measure Weighting Targets
Below threshold Threshold Stretch
Relative TSR1 2/3 < Median MedianUpper
quartile
Adjusted EPS2 1/3 < 9.2p 9.2p 10.2p
% of relevant portion of award vesting3 0% 20% 100%
1 Measured against the constituents of the FTSE All Share Index (excluding investment trusts) around the start of the period.
2 2015/16 base year EPS was 8.3p.3 Straight line vesting between threshold and stretch.
Anticipated vesting of 2013 LTIP AwardThe performance conditions for the 2013 LTIP award are based on an absolute TSR condition (comprising 2/3rds of the award) and an adjusted EPS condition (comprising 1/3rd of the award). During 2014 the market in which we operate experienced a period of significant change which impacted our major retail customers and as a result the Company re-set its growth and profit expectations. As a result the entry point for the EPS target has not been achieved. The TSR condition is based on the Company’s average share price over the 91 day period starting on 1 April 2016 and will not be known until the end of July. However, based on the Company’s share price on 2 April 2016, the Committee has concluded that the entry point for the TSR target will not be achieved and consequently the 2013 LTIP award will not vest.
Co-Investment AwardThe Co-Investment Award which is specific to Gavin Darby, was awarded following his appointment as CEO in 2013, and is designed to align the CEO with shareholders and the delivery of share price growth. On appointment Gavin Darby purchased shares worth 100% of annual base salary in the Company. In return the Company made a matching award of shares worth 200% of salary which vested in thirds on 1 May 2014, 2015 and 2016. The award is subject to a bonus having been paid for the relevant financial year and continued employment. The second tranche of the Co-Investment Award vested on 1 May 2015 and Gavin Darby exercised the award on 8 June 2015. 354,064 shares were sold at 41.25p to cover tax and employee national insurance with the remaining shares being retained. Following the payment of an annual bonus to Gavin Darby in respect of the period ended 2 April 2016 the performance condition for the final tranche of his Co-Investment Award has now been satisfied and this has been reflected in the single figure table on page 52.
Dilution limitsAwards under the LTIP and all-employee share plans may be satisfied using either newly issued shares or shares purchased in the market and held in the Company’s Employment Benefit Trust (which held 34,336 shares as at 2 April 2016). The Company complies with the Investment Association guidelines in respect of the dilutive effect of newly issued shares.
Pension paymentsThe table below provides details of the executive directors’ pension benefits:
Total contributions to DC-type pension plan
£’000
Cash in lieu of contributions to DC-type pension plan
£’000
Gavin Darby – 140
Alastair Murray 11 23
Executive directors have the right to participate in the Company's defined contribution ('DC') pension plan or elect to be paid some or all of their contributions in cash. Gavin Darby is paid a cash contribution of 20% of salary whilst Alastair Murray participates in the Company's DC pension scheme and receives a cash supplement.
GOVERNANCE
Directors’ Remuneration report continued
Premier Foods plc Annual report for the 52 week period ended 2 April 201658

Share ownership guidelines and share interest table (audited)To align executive directors’ interests with those of shareholders they are expected to build a holding of shares within three years of appointment at least equal to their annual salary (valued at the time of purchase). The following table shows executive directors’ interests in Company shares. Awards under the LTIP are subject to a three year vesting period and will only vest if stretching performance conditions are met. The figures shown represent the maximum number of shares a director could receive following the end of the vesting period if all performance targets were achieved in full.
Shares owned as at 2 April 2016
Shares owned as at 4 April 2015
Extent to which share ownership
guidelines met
Unvested share interests under the
LTIP
Unvested share interests under
the Co-Investment Award1
Sharesave Plan Total
Gavin Darby 4,153,526 3,366,523 373% 8,178,666 751,814 30,524 13,114,530
Alastair Murray 309,522 309,522 62% 2,909,112 – 16,906 3,235,540
1 The final tranche of the CEO’s Co-Investment Award vested on 1 May 2016
Executive share awards
Date of grant
Balance as at
4 April 2015
Shares awarded in
the year
Shares exercised in
the year
Shares lapsed
in the year
Balance as at
2 April 2016Option
price
Share price on date of
grant
Share price on date of
exercise
Exercise period/
vesting date
Gavin Darby
Co-Investment Award 22.02.13 1,503,628 – 751,814 – 751,814 – 62.07p 41.25p 01.05.16
LTIP1 22.02.13 2,255,442 – – 2,255,442 – 62.07p – 31.03.16
25.06.14 2,629,107 – – – 2,629,107 – 53.25p – 31.03.17
11.06.15 – 3,294,117 – – 3,294,117 – 42.50p – 31.03.18
Sharesave Plan2 11.10.13 3,214 – – – 3,214 72.79p – – 01.12.16
26.09.14 10,404 – – – 10,404 34.60p – – 01.12.17
15.12.15 – 16,906 – – 16,906 31.94p – – 01.02.19
Alastair Murray
LTIP1 25.06.14 1,126,760 – – – 1,126,760 – 53.25p – 31.03.17
11.06.15 – 1,782,352 – – 1,782,352 – 42.50p – 31.03.18
Sharesave Plan2 15.12.15 – 16,906 – – 16,906 31.94p – – 01.02.19
1 All LTIP awards are in the form of performance shares. Details of the anticipated vesting of the 2013 LTIP Award are set out on page 58.2 The Sharesave Plan is a HMRC tax advantaged scheme under which option prices for awards may be set at up to a 20% discount to the market value of shares immediately prior to
the date the offer is made. Executive directors are eligible to participate in the Company’s Sharesave Plan on the same basis as all other eligible employees.
INTRODUCTION STRATEGIC REPORT GOVERNANCE FINANCIAL STATEMENTS 59
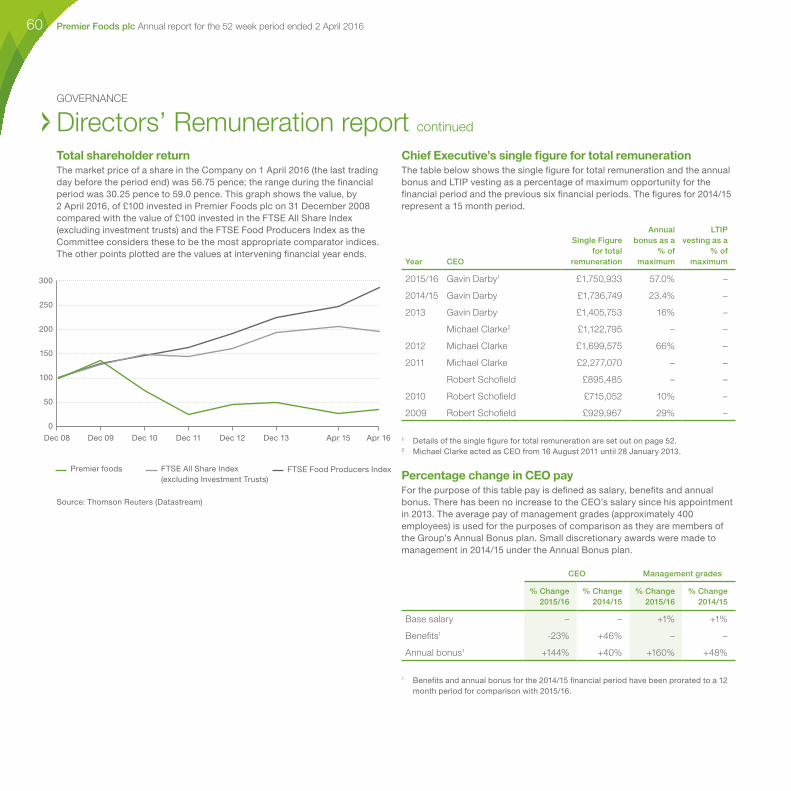
Chief Executive’s single figure for total remunerationThe table below shows the single figure for total remuneration and the annual bonus and LTIP vesting as a percentage of maximum opportunity for the financial period and the previous six financial periods. The figures for 2014/15 represent a 15 month period.
Year CEO
Single Figure for total
remuneration
Annual bonus as a
% of maximum
LTIP vesting as a
% of maximum
2015/16 Gavin Darby1 £1,750,933 57.0% –
2014/15 Gavin Darby £1,736,749 23.4% –
2013 Gavin Darby £1,405,753 16% –
Michael Clarke2 £1,122,795 – –
2012 Michael Clarke £1,699,575 66% –
2011 Michael Clarke £2,277,070 – –
Robert Schofield £895,485 – –
2010 Robert Schofield £715,052 10% –
2009 Robert Schofield £929,967 29% –
1 Details of the single figure for total remuneration are set out on page 52. 2 Michael Clarke acted as CEO from 16 August 2011 until 28 January 2013.
Percentage change in CEO payFor the purpose of this table pay is defined as salary, benefits and annual bonus. There has been no increase to the CEO’s salary since his appointment in 2013. The average pay of management grades (approximately 400 employees) is used for the purposes of comparison as they are members of the Group’s Annual Bonus plan. Small discretionary awards were made to management in 2014/15 under the Annual Bonus plan.
CEO Management grades
% Change 2015/16
% Change 2014/15
% Change 2015/16
% Change 2014/15
Base salary – – +1% +1%
Benefits1 -23% +46% – –
Annual bonus1 +144% +40% +160% +48%
1 Benefits and annual bonus for the 2014/15 financial period have been prorated to a 12 month period for comparison with 2015/16.
GOVERNANCE
Directors’ Remuneration report continued
Total shareholder returnThe market price of a share in the Company on 1 April 2016 (the last trading day before the period end) was 56.75 pence; the range during the financial period was 30.25 pence to 59.0 pence. This graph shows the value, by 2 April 2016, of £100 invested in Premier Foods plc on 31 December 2008 compared with the value of £100 invested in the FTSE All Share Index (excluding investment trusts) and the FTSE Food Producers Index as the Committee considers these to be the most appropriate comparator indices. The other points plotted are the values at intervening financial year ends.
Source: Thomson Reuters (Datastream)
50
100
150
200
250
300
0
Dec 08 Dec 10Dec 09 Dec 11 Dec 12 Dec 13 Apr 15 Apr 16
Premier foods FTSE All Share Index (excluding Investment Trusts)
FTSE Food Producers Index
Premier Foods plc Annual report for the 52 week period ended 2 April 201660

Relative importance of spend on payThe following table sets out the amounts and percentage change in total employee costs. The terms of our current bank facility agreement contain restrictions on the payment of dividends. Recurring cash flow and net debt have therefore been included as additional indicators. Cash flow demonstrates the cash available to reinvest in the business and service debt payments and net debt highlights the importance of organically deleveraging the business to a point at which dividend payments can be resumed under the Group’s banking arrangements. The figures for 2014/15 represent a 15 month period.
2015/16 2014/15 Change
Total employee costs £147.6m £213.9m -31.0%
Recurring cash flow £71.5m £(24.4)m N/A
Net debt £534.2m £584.9m -8.7%
Non-executive directorsSingle figure for the total remuneration received by each non-executive director for the financial period ended 2 April 2016 (12 months) and for the financial period ended 4 April 2015 (15 months) (audited).
Basic Fee Committee
Chair Fee SID FeeTotal Fees
2015/16Total Fees
2014/15
David Beever £265,000 – – £265,000 £333,458
Richard Hodgson1 £57,000 – – £57,000 £14,077
Ian Krieger £57,000 £13,000 £9,167 £79,167 £92,708
Jennifer Laing £57,000 £10,500 £67,500 £81,437
Pam Powell £57,000 – – £57,000 £71,725
Former non-executive directors:
Charles Miller Smith2 £9,500 – – £9,500 £71,725
1 Richard Hodgson was appointed as a non-executive director on 6 January 2015.2 Charles Miller Smith retired as a non-executive director on 1 June 2015.
Non-executive directors' feesThe fees of our non-executive directors (NEDs) are set out in the table opposite. A review of non-executive fees was undertaken in May 2015 and this concluded that the fee for the Senior Independent Director (SID) should be increased from £5,000 to £10,000 per annum recognising the increased level of work required by the role. This is the first increase to NED fees (excluding the Chairman fee) since 2009. No changes to the Chairman’s fee or basic NED fee were proposed.
NED Fees 2 April 2016 Change 4 April 2015
Chairman fee £265,000 – £265,000
Basic NED fee £57,000 – £57,000
Additional remuneration:
Audit Committee Chairman fee £13,000 – £13,000
Remuneration Committee Chairman fee £10,500 – £10,500
Senior Independent Director fee £10,000 100% £5,000
Non-executive directors' terms of appointmentAll non-executive directors have entered into letters of appointment/amendment as detailed in the table below. The appointments are subject to the provisions of the Companies Act 2006 and the Company’s Articles. Terms of appointment are normally for three years or the date of the AGM immediately preceding the third anniversary of appointment. Non-executive directors’ continued appointments are evaluated annually, based on their contributions and satisfactory performance. Following the expiry of a term of appointment, non-executives may be re-appointed for a further three year period.
NEDDate of original
appointment
Expiry of current
appointment/ amendment
letter Notice period
David Beever 22 January 2008 AGM 2017 3 months
Richard Hodgson 6 January 2015 AGM 2017 3 months
Ian Krieger 1 November 2012 AGM 2018 3 months
Jennifer Laing 1 October 2012 AGM 2018 3 months
Pam Powell 7 May 2013 AGM 2016 3 months
Non-executive directors' interests in shares (audited)
NED
Ordinary shares owned as at 2 April 2016
Ordinary shares owned as at 4 April 2015
David Beever 304,881 304,881
Richard Hodgson – –
Ian Krieger 504,000 304,000
Jennifer Laing 54,802 54,802
Pam Powell 160,366 160,366
Former non-executive directors:
Charles Miller Smith1 1,095,069 1,095,069
1 Interest as at the date immediately before Charles Miller Smith ceased to be a director, the shares were held in the form of contracts for difference.
INTRODUCTION STRATEGIC REPORT GOVERNANCE FINANCIAL STATEMENTS 61

GOVERNANCE
Directors’ Remuneration report continued
The CommitteeThe table on page 47 identifies the Committee members and meeting attendance. In accordance with the Committee’s terms of reference, no one attending a Committee meeting may participate in discussions relating to his/her own terms and conditions of service or remuneration. Only independent non-executive directors may become members of the Committee. In addition, the CEO, HR Director and New Bridge Street regularly attend by invitation. The Deputy Company Secretary acts as secretary to the Committee. Over the course of the year the Committee held three scheduled meetings.
AdvisersNew Bridge Street (NBS) (a trading name of Aon Hewitt Limited) have been appointed as advisers to the Committee. During the year NBS provided advice in connection with executive remuneration arrangements and the introduction of a new Annual Bonus plan for management operating below Board level. NBS are signatories of the Remuneration Consultants Company Code of Conduct. The trustees of the Company’s pension schemes have appointed Aon Hewitt Limited to act as Administrators and Actuary to the schemes and, in the case of the RHM pension scheme, to act as Investment Advisers. NBS operates independently of the pension teams and the Committee is satisfied there is no conflict of interest. NBS received fees of £57,512 (2014/15: £97,416) in respect of their advice to the Committee during the financial period.
Role of the Remuneration CommitteeThe Committee has been delegated authority by the Board to approve the overall design of the Remuneration Policy for executive directors and senior management, to agree the terms of employment including recruitment and termination terms of executive directors, approve the design of all share incentive plans and recommend appropriate performance measures and targets for the variable element of remuneration packages and determine the extent to which performance targets have been achieved. The Committee’s terms of reference are available on the Company’s website.
What the Committee discussed during the financial period:
• Reviewed the voting results for the 2015 Directors' Remuneration report at the AGM;
• Approved a second award under the Company’s management bonus scheme which is linked to completing the turnaround of the business;
• Reviewed and recommended executive directors’ and senior managers’ annual bonuses in respect of the financial period and set the targets for the 2016/17 annual bonus in accordance with the strategic objectives of the Company;
• Granted the 2015 awards under the Company’s all-employee and executive share plans and agreed the targets for awards due to be made in 2016; and
• Discussed developments in best practice with regard to remuneration policy and disclosure.
External appointmentsThe Company is supportive of executive directors who wish to take on a non-executive directorship with a publicly quoted company in order to broaden their experience and they are entitled to retain any fees they may receive. The current executive directors do not have any external appointments with publicly quoted companies.
Statement of voting at Annual General MeetingDetails of our engagement with shareholders and our response to the vote at the AGM in 2015 are set out in the Remuneration Committee Chairman’s letter on page 50.
Approval of Directors'
Remuneration Report
2014/15
% of votes
cast
Approval of the Remuneration
Policy
% of votes
cast
Date of AGM 23 July 2015 29 April 2014
Votes for 478,131,714 84.94% 593,707,405 99.05%
Votes against 84,762,438 15.06% 5,714,208 0.95%
Total votes cast 562,894,152 100% 599,421,613 100%
Votes withheld 13,136,566 3,168,444
Premier Foods plc Annual report for the 52 week period ended 2 April 201662
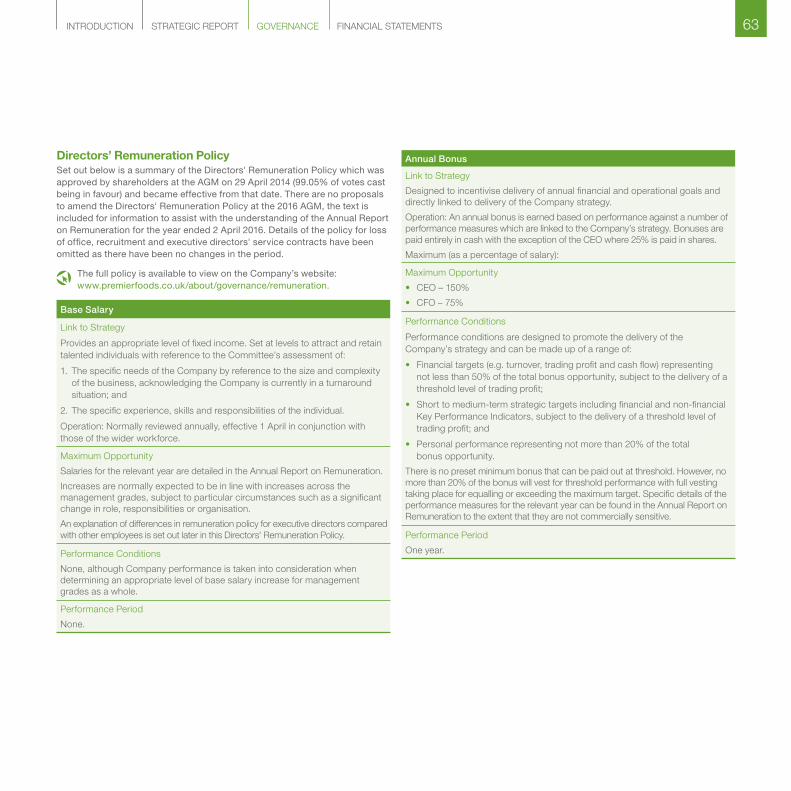
Directors’ Remuneration PolicySet out below is a summary of the Directors' Remuneration Policy which was approved by shareholders at the AGM on 29 April 2014 (99.05% of votes cast being in favour) and became effective from that date. There are no proposals to amend the Directors' Remuneration Policy at the 2016 AGM, the text is included for information to assist with the understanding of the Annual Report on Remuneration for the year ended 2 April 2016. Details of the policy for loss of office, recruitment and executive directors' service contracts have been omitted as there have been no changes in the period.
The full policy is available to view on the Company’s website: www.premierfoods.co.uk/about/governance/remuneration.
Base Salary
Link to Strategy
Provides an appropriate level of fixed income. Set at levels to attract and retain talented individuals with reference to the Committee’s assessment of:
1. The specific needs of the Company by reference to the size and complexity of the business, acknowledging the Company is currently in a turnaround situation; and
2. The specific experience, skills and responsibilities of the individual.
Operation: Normally reviewed annually, effective 1 April in conjunction with those of the wider workforce.
Maximum Opportunity
Salaries for the relevant year are detailed in the Annual Report on Remuneration.
Increases are normally expected to be in line with increases across the management grades, subject to particular circumstances such as a significant change in role, responsibilities or organisation.
An explanation of differences in remuneration policy for executive directors compared with other employees is set out later in this Directors' Remuneration Policy.
Performance Conditions
None, although Company performance is taken into consideration when determining an appropriate level of base salary increase for management grades as a whole.
Performance Period
None.
Annual Bonus
Link to Strategy
Designed to incentivise delivery of annual financial and operational goals and directly linked to delivery of the Company strategy.
Operation: An annual bonus is earned based on performance against a number of performance measures which are linked to the Company’s strategy. Bonuses are paid entirely in cash with the exception of the CEO where 25% is paid in shares.
Maximum (as a percentage of salary):
Maximum Opportunity
• CEO – 150%
• CFO – 75%
Performance Conditions
Performance conditions are designed to promote the delivery of the Company’s strategy and can be made up of a range of:
• Financial targets (e.g. turnover, trading profit and cash flow) representing not less than 50% of the total bonus opportunity, subject to the delivery of a threshold level of trading profit;
• Short to medium-term strategic targets including financial and non-financial Key Performance Indicators, subject to the delivery of a threshold level of trading profit; and
• Personal performance representing not more than 20% of the total bonus opportunity.
There is no preset minimum bonus that can be paid out at threshold. However, no more than 20% of the bonus will vest for threshold performance with full vesting taking place for equalling or exceeding the maximum target. Specific details of the performance measures for the relevant year can be found in the Annual Report on Remuneration to the extent that they are not commercially sensitive.
Performance Period
One year.
INTRODUCTION STRATEGIC REPORT GOVERNANCE FINANCIAL STATEMENTS 63

GOVERNANCE
Directors’ Remuneration report continued
Directors’ Remuneration Policy continued Deferred Share Bonus Plan (DSBP)
Link to Strategy
Operates alongside the annual bonus but with a longer-term focus. Awards are satisfied in the form of shares deferred for a period of up to two years to focus on medium-term share price performance.
Operation: Based on in-year Company wide strategic performance targets with any award being made following the end of the financial year in the form of shares that are deferred for up to two years. The rules contain a dividend equivalent provision enabling dividends to be paid (in cash or shares) on shares at the time of vesting. Clawback provisions apply.
Maximum Opportunity
• CFO – 30% of the salary.
• CEO – The current CEO does not participate in the DSBP.
Performance Conditions
Performance conditions are designed to promote the delivery of the annual business plan and can be made up of a range of:
• Financial targets (e.g. turnover, trading profit and cash flow) representing not less than 50% of the total bonus opportunity, subject to delivery of a threshold level of trading profit; and
• Short to medium-term strategic targets including financial and non-financial Key Performance Indicators, subject to the delivery of a threshold level of trading profit.
There is no preset minimum bonus that can be paid out at threshold. However, no more than 20% of the bonus will vest for threshold performance with full vesting taking place for equalling or exceeding the maximum target.
Performance Period
One year, with a retention period of up to two years.
Long Term Incentive Plan (LTIP)
Link to Strategy
The LTIP provides a clear link to our strategic goal of returning to profitable growth with sustainable share price growth over the long-term.
Operation: Annual grant of awards. The LTIP comprises two elements – performance shares and matching shares – and the aggregate maximum under both elements is 200% of base salary.
Performance shares are the conditional award of shares or nil cost options which normally vest after three years subject to performance conditions. Matching shares are similar to performance shares but require participants to invest in Company shares. Any investment will receive a maximum match of up to 2:1 from the Company subject to performance.
Currently it is the Remuneration Committee’s policy for awards under the LTIP to be made only in the form of performance shares. Whilst the Remuneration Committee does not expect to change this policy it wishes to retain the flexibility to do so.
Awards under the LTIP, including the determination of any relevant performance conditions, will be considered and determined on an annual basis at the discretion of the Committee. The rules contain a dividend equivalent provision enabling dividends to be paid (in cash or shares) on shares at the time of vesting. Clawback provisions apply.
Long Term Incentive Plan (LTIP) continued
Maximum Opportunity
Maximum individual limit of 200% of salary. Where matching shares are used, no more than half of the award can be comprised of matching shares.
Normal award levels are (as a percentage of salary):
• CEO – 200%
• CFO – 150%
Performance Conditions
Performance conditions are based on a range of targets focused on the delivery of increased shareholder value over the medium to long-term. These include a combination of Total Shareholder Return and earnings per share. 20% of the bonus will vest for threshold performance with full vesting taking place for equalling or exceeding the maximum target.
Performance Period
Three years.
Pension
Link to Strategy
To offer market competitive levels of benefit and help to recruit and retain and to recognise long-term commitment to the Company.
Operation: Executive directors receive an allowance in lieu of pension provision which is subject to periodic review or may participate in the Company’s defined contribution scheme on the same basis as all other new employees. Executive directors may also salary sacrifice additional amounts into this scheme but will not receive any additional contribution from the Group. Only basic pay is pensionable.
Maximum Opportunity
Annual allowances of:
• CEO – 20% of salary.
• The CFO participates in the Company’s pension scheme and receives a contribution of 7.5% of the Earnings Cap set annually by the Company on the basis of the calculation previously used by HMRC. Should the CFO decide not to participate in the Company’s pension scheme he would receive a cash allowance of this amount. Additionally, the CFO receives a cash supplement (currently £21,610) which is reviewed annually by the Company in line with the Retail Price Index (RPI).
Performance Conditions
N/A
Performance Period
N/A
Premier Foods plc Annual report for the 52 week period ended 2 April 201664

Link to Strategy
To offer all employees the opportunity to build a shareholding in a simple and tax-efficient manner.
Operation: The Company’s Sharesave Plan is an HMRC compliant scheme which is usually offered annually in September to all employees. The key terms of the plan will only be changed to reflect HMRC changes. At the 2014 AGM shareholders approved a new plan which will run until 2024.
Maximum Opportunity
Participants may save up to the statutory limit over a three year period, following which they have the opportunity to buy Company shares at a price set at the beginning of the savings period.
Performance Conditions
None, other than continued employment.
Performance Period
Three years.
Co-Investment Award (one-off award in 2013)
Link to Strategy
To facilitate the recruitment of Gavin Darby as CEO in 2013 and immediately align the CEO with shareholders and the delivery of share price growth.
Operation: Award specific to Gavin Darby. On appointment Gavin Darby acquired shares worth 100% of annual base salary in the Company. The Company made a matching award of shares worth 200% of salary which vest in three equal tranches on 1 May 2014, 2015 and 2016 subject to satisfaction of a performance condition requiring payment of a bonus.
Maximum Opportunity
200% of salary (one-off award specific to Gavin Darby).
Performance Conditions
Subject to a bonus having been paid for the relevant financial year and continued employment. The Co-Investment Award vests in specified circumstances including a change of control.
Performance Period
One, two and three years.
Other Benefits
Link to Strategy
Help recruit and retain and to promote the efficient use of management time.
Operation: The Company typically provides the following benefits: Company car or cash allowance. The CEO has use of the Company’s chauffeur driven car for Company business which allows the CEO to work while commuting to appointments; Private health insurance; Life insurance; Telecommunication services; Professional memberships; Allowance for personal tax and financial planning; and
Other ancillary benefits, including relocation expenses (as required).
Maximum Opportunity
The provision and level of allowances and benefits are considered appropriate and in line with market practice.
Performance Conditions
N/A
Performance Period
N/A
Non-executive director fees
Link to Strategy
Provides an appropriate level of fixed fee to recruit and retain individuals with a broad range of experience and skill to support the Board in the delivery of its duties. Fees are reviewed annually.
Operation: The remuneration of non-executive directors is determined by the Chairman and executive directors. The remuneration of the Chairman is determined by the Remuneration Committee. Includes a Chairman’s fee and standard non-executive fee. Additional fees are payable to Committee Chairs and the Senior Independent Director.
Maximum Opportunity
Increases are normally expected to be in line with the market, taking into account increases across the Company as a whole, subject to particular circumstances such as a significant change in role, responsibilities or organisation.
Performance Conditions
None.
Performance Period
None.
Sharesave Plans
INTRODUCTION STRATEGIC REPORT GOVERNANCE FINANCIAL STATEMENTS 65

GOVERNANCE
Directors’ Remuneration report continued
Directors’ Remuneration Policy continued
For the avoidance of doubt, in approving this Directors' Remuneration Policy, authority is given to the Company to honour any commitments entered into with current or former directors that have been disclosed to shareholders in previous remuneration reports. Details of any payments to former directors will be set out in the Annual Report on Remuneration as they arise as required under the Remuneration Regulations.
The Committee operates the Annual Bonus plan, DSBP, Co-Investment Award and LTIP according to their respective rules which includes flexibility in a number of areas. These include:
• The timing of awards and payments;• The size of an award, within the maximum limits;• The participants of the plan;• The performance measures, targets and weightings to be used for the
annual bonus plan, DSBP and long term incentive plans from year to year;• The assessment of whether performance conditions have been met;• The treatment to be applied for a change of control or significant restructuring of
the Company;• The determination of a good/bad leaver for incentive plan purposes and the
treatment of awards thereof; and• The adjustments, if any, required in certain circumstances (e.g. rights
issues, corporate restructuring, corporate events and special dividends).
Choice of performance measures and approach to target settingThe Committee reviews the performance measures used in the incentive arrangements on an annual basis to ensure that they remain appropriate and aligned to the delivery of the annual business plan and Company strategy. The majority of annual bonus and DSBP measures will be focused on financial performance with the remainder linked to individual performance and/or strategic objectives. This approach is adopted in order to link pay to the delivery of overall Company performance measured across a balance of key strategic aims. The targets will be set by reference to internal budgeting and strategic plans for the financial and strategic measures and key objectives identified by the Committee for the personal performance measures.
Currently the LTIP uses a combination of Earnings per Share and Total Shareholder Return based measures to reflect both an internal measure of Company performance as well as the delivery of shareholder value. Targets are set taking into account both internal and external assessments of future performance and what constitutes good and superior returns for shareholders.
The Committee also retains the discretion within the policy to adjust the targets and/or set different measures and alter weightings for the annual bonus plan and DSBP and to adjust targets for the long term incentive plans if events happen that cause it to determine that the conditions are unable to fulfil their original intended purpose.
The Committee will consider the bonus outcomes against all of the pre-set targets following their calculation and in exceptional circumstances may moderate (up and down) these outcomes to take account of a range of factors including the Committee’s view of overall Company performance for the year. No upward moderation would be undertaken without first consulting with major shareholders.
Service Contracts Executive directors have rolling service contracts. The current executive directors’ service contracts contain the key terms shown in the below table. In the event that any additional executive directors are appointed it is likely that their service contracts will contain broadly similar terms.
Provision
Remuneration
Salary, bonus, share incentives, expenses and pension entitlements in line with the above Directors' Remuneration Policy Table.
Change of Control
The service agreements do not provide for any enhanced payments in the event of a change of control of the Company.
Notice Period
Standard notice periods are set at 12 months.
Payment in lieu of notice
The Company may, at its discretion, pay a sum equal to base salary, benefits, and pension contributions which would have been earned during the Notice Period as payment in lieu of notice. This payment is payable in two six monthly instalments or until such earlier date alternative employment is secured, subject to mitigation.
In the event of the Company serving notice within 12 months following a change of control then employment will terminate immediately and the Company will make a payment in lieu of notice.
There is no entitlement to a pro rata bonus payment in lieu of notice.
The terms and conditions for non-executive directors are set out in their letters of appointment, which are available for inspection at the Company’s registered office and will be available at the AGM, as are executive service contracts. The appointment of non-executive directors is for a fixed term of three years which may be terminated by three months notice from either party.
The letters of appointment entitle the non-executive directors to receive fees but do not have provisions on payment for early termination.
The Directors' Remuneration report was approved by the Board on 16 May 2016 and signed on its behalf by:
Jennifer LaingChairman of the Remuneration Committee
Premier Foods plc Annual report for the 52 week period ended 2 April 201666

Directors’ reportThe directors’ report consists of pages 2 to 69 and has been drawn up and presented in accordance with, and in reliance upon, applicable English company law and the liabilities of directors in connection with that report shall be subject to the limitations and restrictions provided by such law. In the directors’ report references to the Company or Group are references to Premier Foods plc and its subsidiaries.
Profit and dividendsThe loss before tax on continuing operations for the financial year was £13.0m (2014/15 loss: £135.6m). The directors do not recommend the payment of a dividend for the period ended 2 April 2016 (2014/15: £nil).
Research and developmentApplied research and development work continues to be directed towards the introduction of new and improved products; the application of new technology to reduce unit and operating costs; and to improve service to customers. Total research and development spend (including capitalised development costs) was £12.1m (2014/15: £16.6m).
Share capital informationThe Company’s issued share capital as at 2 April 2016 comprised 826,567,063 ordinary 10p shares. During the period 825,807 ordinary shares were issued, solely as a result of the vesting of shareholder approved all-employee Sharesave Plan awards, details of the movements can be found in note 26 on page 125. All of the ordinary shares rank equally with respect to voting rights, the rights to receive dividends and distributions on a winding up. In accordance with the Articles there are no restrictions on share transfers, limitations on the holding of any class of shares or any requirement for prior approval of any transfer.
Articles of associationThe Company’s Articles may only be amended by a special resolution at a general meeting. The Articles are available on our website. Subject to the provisions of the statutes, the Company's articles and any directions given by special resolution the directors may exercise all the powers of the Company.
Directors’ and officers’ liability insuranceThis insurance covers the directors and officers against the costs of defending themselves in civil proceedings taken against them in their capacity as a director or officer of the Company and in respect of damages resulting from the unsuccessful defence of any proceedings.
Access to external adviceDirectors are allowed to take independent professional advice in the course of their duties. In addition, all directors have access to the advice and services of the Company Secretary. If any director were to have a concern over any unresolved business issue following professional advice, they are entitled to require the Company Secretary to minute that concern. Should they later resign over a concern, non-executive directors are asked to provide a written statement to the Chairman for circulation to the Board.
Conflicts of interestThe Company has procedures in place for managing conflicts of interest and directors have continuing obligations to update the Board on any changes to these conflicts. This process includes relevant disclosure at the beginning of each Board meeting and also the Company’s annual formal review of potential conflict situations which includes the use of a questionnaire. During the period ended 2 April 2016 no director had a material interest at any time in any contract of significance with the Company or Group other than their service contract.
Under the Relationship agreement, Nissin (following consultation with the Company) may nominate an individual for appointment to the Board so long as they retain an interest in shares in the Company representing 15%. As described in the Chairman's introduction on page 42, Nissin have proposed the appointment of Mr Kijima with effect from 21 July 2016.
GOVERNANCE
Other statutory informationSubstantial shareholdingsInformation provided to the Company pursuant to the Financial Conduct Authority’s (FCA) disclosure and Transparency Rules (DTRs) is published on a Regulatory information Service and on the Company’s website. As at 16 May 2016, the Company has been notified of the following interests of 3% or more in the Company:
Shareholder Ordinary shares % of share capital
Nissin Foods Holdings Co., Ltd. 164,486,846 19.90
Paulson & Co. Inc. 63,390,111 7.67
Standard Life Investments (Holdings) Limited 62,093,092 7.51
Brandes Investment Partners, L.P. 43,682,375 5.28
Dimensional Fund Advisors, L.P. 32,303,123 3.91
INTRODUCTION STRATEGIC REPORT GOVERNANCE FINANCIAL STATEMENTS 67

GOVERNANCE
Other statutory information continued
Going concern The directors have a reasonable expectation that the Company and Group have adequate resources to continue in operational existence for the next 12 months and therefore continue to adopt the going concern basis in preparing the consolidated financial statements. Further information on the basis of preparation is set out in note 2.1 on page 79.
Statement of directors’ responsibilities in respect of the annual report and accountsThe directors, whose names and functions are listed on page 43, are responsible for preparing the annual report and the Group and parent company financial statements in accordance with applicable law and regulations.
Company law requires the directors to prepare Group and parent company financial statements for each financial year. Under that law they are required to prepare the Group financial statements in accordance with IFRSs as adopted by the EU and applicable law and have elected to prepare the parent company financial statements in accordance with UK Accounting Standards, including FRS 101 Reduced Disclosure Framework.
Under company law the directors must not approve the financial statements unless they are satisfied that they give a true and fair view of the state of affairs of the Group and parent company and of their profit or loss for that period. In preparing each of the Group and parent company financial statements, the directors are required to:
• select suitable accounting policies and then apply them consistently;
• make judgements and estimates that are reasonable and prudent;
• for the Group financial statements, state whether they have been prepared in accordance with IFRSs as adopted by the EU;
• for the parent company financial statements, state whether applicable UK Accounting Standards have been followed, subject to any material departures disclosed and explained in the parent company financial statements; and
• prepare the financial statements on the going concern basis unless it is inappropriate to presume that the Group and the parent company will continue in business.
The directors are responsible for keeping adequate accounting records that are sufficient to show and explain the parent company’s transactions and disclose with reasonable accuracy at any time the financial position of the parent company and enable them to ensure that its financial statements comply with the Companies Act 2006. They have general responsibility for taking such steps as are reasonably open to them to safeguard the assets of the Group and to prevent and detect fraud and other irregularities.
Under applicable law and regulations, the directors are also responsible for preparing a Strategic Report, directors’ Report, Directors' Remuneration report and Corporate Governance Statement that complies with that law and those regulations.
The directors are responsible for the maintenance and integrity of the corporate and financial information included on the Group’s website. Legislation in the UK governing the preparation and dissemination of financial statements may differ from legislation in other jurisdictions.
Responsibility statement of the directors in respect of the annual financial report Each of the persons who is a director at the date of approval of this report confirms that to the best of his or her knowledge:
• the financial statements, prepared in accordance with the applicable set of accounting standards, give a true and fair view of the assets, liabilities, financial position and profit or loss of the Company and the undertakings included in the consolidation taken as a whole;
• the strategic report includes a fair review of the development and performance of the business and the position of the issuer and the undertakings included in the consolidation taken as a whole, together with a description of the principal risks and uncertainties that they face; and
• the annual report and accounts, taken as a whole, is fair, balanced and understandable and provides the information necessary for shareholders to assess the Group’s position and performance, business model and strategy.
Independent auditorAs set out on page 48 following the completion of the audit tender the Audit Committee has recommended KPMG LLP’s ('KPMG') appointment and KPMG has indicated its willingness to continue as auditor. The appointment of KPMG and the setting of their remuneration will be proposed at the 2016 AGM.
Auditor and the disclosure of information to the auditorThe Companies Act requires directors to provide the Company’s auditor with every opportunity to take whatever steps and undertake whatever inspections they consider to be appropriate for the purpose of enabling them to give their audit report. The directors, having made appropriate enquiries, confirm that:
• so far as the director is aware, there is no relevant audit information of which the Company’s auditor are unaware; and
• he/she has taken all the steps that he ought to have taken as a director in order to make himself/herself aware of any relevant audit information and to establish that the Company’s auditor are aware of that information.
Premier Foods plc Annual report for the 52 week period ended 2 April 201668

The directors’ report was approved by the Board on 16 May 2016 and signed on its behalf by:
Andrew McDonaldCompany Secretary
Stakeholder relations
ShareholdersAs mentioned on page 44 the Board believes it is very important to engage with our shareholders; large and small. The main channels of communication to institutional investors is through the CEO, CFO and Head of Investor Relations via presentations, conference calls, investor roadshows, broker organised conferences and face-to-face meetings. The main channels of communication with smaller shareholders are via this annual report, our website and the AGM. The Chairman, SID and Committee Chairmen, also meet with shareholders on specific issues.
BondholdersManagement hold conference calls with bondholders following the release of Full Year and Interim results. Additionally, management attend bond investor conferences at least twice a year.
PensionsThe Company has established a Pensions Liaison Forum which meets regularly throughout the year. This is attended by the CFO, Pension Manager and the Chairmen of the Company’s pension schemes. The Forum discusses significant issues affecting the schemes and/or their relationship with the Company.
BanksRegular updates are provided to the Company’s current banking syndicate on the Company’s financial performance.
SuppliersThe Company develops close partnerships with its suppliers to deliver mutual benefit. For example, our online supplier innovation portal seeks to leverage our suppliers' unique capabilities and strengths to feed into our product development pipeline with the aim of creating new products which will drive growth in both our businesses. Since launching in September 2014 our suppliers have presented more than 200 ideas through the portal.
In 2015, we carried out a more extensive 'Voice of the Supplier' anonymous survey which was sent to 494 suppliers representing over 97% of our total spend. Of those suppliers who responded 92% of strategic suppliers confirmed our relationship was 'Good' or 'Very Good', with 79% of suppliers who are SMEs (Small or Medium Sized Enterprises) saying Premier Foods was a 'Customer of Choice'. The outcome of this survey was discussed at our annual Supplier Conference, this forum being a key method to communicate with our suppliers and to update them on the Company¹s strategy and growth plans.
INTRODUCTION STRATEGIC REPORT GOVERNANCE FINANCIAL STATEMENTS 69

70
Opinions and conclusions arising from our audit1 Our opinion on the financial statements is unmodified We have audited the financial statements of Premier Foods plc for the 52 weeks ended 2 April 2016 set out on pages 74 to 136. In our opinion:
• the financial statements give a true and fair view of the state of the Group’s and of the parent company’s affairs as at 2 April 2016 and of the Group’s profit for the 52 weeks then ended;
• the Group financial statements have been properly prepared in accordance with International Financial Reporting Standards as adopted by the European Union;
• the parent company financial statements have been properly prepared in accordance with UK Accounting Standards, including FRS 101 Reduced Disclosure Framework; and
• the financial statements have been prepared in accordance with the requirements of the Companies Act 2006 and, as regards the Group financial statements, Article 4 of the IAS Regulation.
2 Our assessment of risks of material misstatementIn arriving at our audit opinion above on the financial statements the risks of material misstatement that had the greatest effect on our audit, in decreasing order of audit significance, were as follows:
• Revenue recognition relating to commercial arrangements with customers• Carrying value of goodwill and brands• Accounting for defined benefit pension plans• Recoverability of deferred tax asset• Accounting for investments
Revenue recognition relating to commercial arrangements with customers £771.7 million (2014/15: £964.3 million)Refer to page 49 (Audit Committee report) and page 86 of the notes to the financial statements.
The riskThe Group enters into commercial arrangements with its customers on a regular basis, offering volume rebates and discounts for product promotions. These arrangements often include complex terms. The Group measures revenue taking into consideration estimated discounts and rebates.
Due to the complex nature of some arrangements and the number of different arrangements in place there is a risk that these arrangements are not appropriately reflected and as a result revenue is misstated. The most significant areas of estimation uncertainty are:
• determining the period which the arrangements cover and hence the correct period for recognition; and• estimating the sales volumes attributable to each arrangement.
Our responseOur procedures included considering the appropriateness of the revenue recognition accounting policies relating to volume rebates and discounts and assessing compliance with applicable accounting standards.
We gained an understanding of, evaluated and tested the effectiveness of the controls over the initiation and authorisation of each commercial arrangement. We also tested the controls in place over the periodic review of the related accruals.
We conducted detailed testing of the amounts deducted by customers from sales invoices for the commercial arrangements. We compared the accruals recorded to the amounts deducted by customers to assess the accuracy of the Directors' estimates. We also tested credit notes issued after the period end to assess the completeness of the accruals recorded. We formed an expectation of the rebates and discounts through reviewing historical trading patterns and compared this to current year amounts recognised. We also conducted analysis to identify unusual or unexpected movements.
We have also considered the adequacy of the Group's disclosures in respect of the critical accounting policies relating to volume rebates and discounts applied on page 86.
Independent auditor’s Report to the members of Premier Foods plc
Premier Foods plc Annual report and accounts for the financial period ended 2 April 2016

Carrying value of goodwill £649.8 million (2014/15: £646.0 million) and brands £448.2 million (2014/15: £474.2 million)Refer to page 49 (Audit Committee report) and page 86 of the notes to the financial statements.
The riskGoodwill and brand asset valuations are dependent on the achievement of future business plans which are inherently uncertain.
The Grocery and Sweet Treats business units operate in an environment of significant retailer pressure on price and competitor activity. In light of these trading challenges, there is a risk that the Group’s significant goodwill and brand asset values may not be recoverable.
Our responseWe assessed the appropriateness of the cash generating units identified.
We subsequently assessed the methodologies used to generate the discounted cash flow model for each cash generating unit.
Our audit procedures also involved the testing of the integrity of the discounted cash flow model. This involved using our own valuation specialists to assist us in evaluating the assumptions applied and comparing the assumptions used to external data where applicable. The key assumptions include:
• the short and long-term revenue growth rates assumed in the model;• future changes in gross profit;• the discount rates used; and• the royalty rate used in the brand assessment.
We tested the sensitivity of the impairment calculations to changes in key assumptions to evaluate the impact on the headroom for the Grocery cash generating unit and the brands.
We also evaluated the adequacy of the disclosures in respect of the impairment assessment on pages 101 to 104.
Accounting for defined benefit pension plans £130.9 million (2014/15 : £(211.8) million)Refer to page 49 (Audit Committee report) and page 86 of the notes to the financial statements.
The riskSmall changes in the assumptions used to determine the liabilities, in particular those relating to inflation, mortality and discount rates, can have a significant impact on the calculation of the net defined benefit position.
Our responseOur audit procedures included assessing the reasonableness and sensitivity of the key assumptions, in particular those relating to inflation, mortality and discount rates, using our own actuarial specialists, benchmarking against our internally calculated rates and the market median rates.
We have also considered the adequacy of the Group's disclosures, including the sensitivity of the deficit to these assumptions on pages 119 to 125.
Recoverability of deferred tax asset £25.9 million (2014/15 : £41.9 million)Refer to page 49 (Audit Committee report) and page 86 of the notes to the financial statements.
The riskThe recoverability of the Group’s deferred tax asset is dependent on future taxable profits and the ability of the Group to utilise those losses in the future. The Group is forecasting future taxable profits in determining the amount of the deferred tax asset. The achievement of such forecasts is inherently uncertain due to the level of judgment and estimation in developing forecasts.
Our responseOur procedures included using our own tax specialists to assess the existence of brought forward losses and other tax credits. We critically assessed the forecast of future taxable profits supporting the recognition of the deferred tax asset by looking at historical forecasting accuracy and comparing the assumptions, such as projected growth rates, to our own expectation of those assumptions.
We considered the adequacy of the disclosures in respect of deferred taxation on pages 93 to 96.
INTRODUCTION STRATEGIC REPORT GOVERNANCE FINANCIAL STATEMENTS 71

72
Accounting for investmentsRefer to page 49 (Audit Committee report) and page 86 of the notes to the financial statements.
The riskThe Group has provided financial and operational support to Knighton Foods Limited ('Knighton') in which it has a 49% interest. Given the level of support provided and the terms attached to this support, the Directors have determined that the Group has obtained the power to control Knighton, as described in the notes to the financial statements on page 106. The assessment of the power to control and the requirement to consolidate involves significant judgment when there has been no change in voting rights or interest in the capital of the investee.
Our responseWe assessed the judgment made by the Directors as to whether the financial and operational support provided to Knighton indicates that they have the power to control Knighton given that the Group does not have a majority interest in Knighton. Our procedures included inspecting the terms of the joint venture agreement, examining subsequent amendments to the agreement and additional agreements and arrangements put in place. We also inspected correspondence between the Group, the Directors of Knighton and Knighton’s creditors.
We considered the adequacy of the disclosures in respect of the accounting for Knighton on page 106.
3 Our application of materiality and an overview of the scope of our auditThe materiality for the Group financial statements as a whole was set at £5.25 million, determined with reference to a benchmark of Group revenue of £771.7 million of which it represents 0.68%. We consider Group revenue to be the most appropriate benchmark as it is a key strategic performance indicator. Currently we do not consider the pre-tax result to be an appropriate benchmark as it is not a key measure of the performance of the Group. We reported to the Audit Committee any corrected or uncorrected identified misstatements exceeding £0.25 million, in addition to other identified misstatements that warranted reporting on qualitative grounds.
Of the Group’s 40 components we subjected 6 components to a full scope audit. These components include all active trading businesses of the Group located in the UK and account for 100% of Group revenue, 96% of Group loss before tax and 99% of Group total assets.
Independent auditor’s Report continued
Group Revenue Group loss before tax Group total assets
Audit scope Out of scope
The component materialities ranged from £0.6 million to £4.0 million, having regard to the mix of size and risk profile of the Group across the components. All full scope components are managed from the central locations in the UK and the work on all components subject to audit was performed by the Group team. For the remaining components, we performed analysis at an aggregated Group level to re-examine our assessment that there were no significant risks of material misstatement within these.
4 Our opinion on other matters prescribed by the Companies Act 2006 is unmodifiedIn our opinion:
• the part of the Directors' Remuneration report to be audited has been properly prepared in accordance with the Companies Act 2006; and• the information given in the Strategic Report and the Directors’ Report for the financial year for which the financial statements are prepared is consistent
with the financial statements.
Based solely on the work required to be undertaken in the course of the audit of the financial statements and from reading the Strategic Report and the Directors’ Report:
• we have not identified material misstatements in those reports; and • in our opinion, those reports have been prepared in accordance with the Companies Act 2006.
Premier Foods plc Annual report and accounts for the financial period ended 2 April 2016

5 We have nothing to report on the disclosures of principal risksBased on the knowledge we acquired during our audit, we have nothing material to add or draw attention to in relation to:
• the Directors’ statement of longer-term viability on page 29, concerning the principal risks, their management, and, based on that, the Directors’ assessment and expectations of the Group’s continuing in operation over the three years to 2019; or
• the disclosures in note 2 of the financial statements concerning the use of the going concern basis of accounting.
6 We have nothing to report in respect of the matters on which we are required to report by exception Under ISAs (UK and Ireland) we are required to report to you if, based on the knowledge we acquired during our audit, we have identified other information in the annual report that contains a material inconsistency with either that knowledge or the financial statements, a material misstatement of fact, or that is otherwise misleading.
In particular, we are required to report to you if:
• we have identified material inconsistencies between the knowledge we acquired during our audit and the Directors’ statement that they consider that the annual report and financial statements taken as a whole is fair, balanced and understandable and provides the information necessary for shareholders to assess the Group’s position and performance, business model and strategy; or
• the Audit Committee report does not appropriately address matters communicated by us to the Audit Committee.
Under the Companies Act 2006 we are required to report to you if, in our opinion:
• adequate accounting records have not been kept by the parent company, or returns adequate for our audit have not been received from branches not visited by us; or
• the parent company financial statements and the part of the Directors' Remuneration report to be audited are not in agreement with the accounting records and returns; or
• certain disclosures of Directors’ remuneration specified by law are not made; or• we have not received all the information and explanations we require for our audit.
Under the Listing Rules we are required to review:
• the Directors’ statements, set out on pages 68 and 29 in relation to going concern and longer-term viability; and • the part of the Corporate Governance Statement on page 42 relating to the company’s compliance with the eleven provisions of the 2014 UK Corporate
Governance Code specified for our review.
We have nothing to report in respect of the above responsibilities.
Scope and responsibilitiesAs explained more fully in the Directors’ Responsibilities Statement set out on page 68, the Directors are responsible for the preparation of the financial statements and for being satisfied that they give a true and fair view. A description of the scope of an audit of financial statements is provided on the Financial Reporting Council’s website at www.frc.org.uk/auditscopeukprivate. This report is made solely to the company’s members as a body and is subject to important explanations and disclaimers regarding our responsibilities, published on our website at www.kpmg.com/uk/auditscopeukco2014a, which are incorporated into this report as if set out in full and should be read to provide an understanding of the purpose of this report, the work we have undertaken and the basis of our opinions.
Richard Pinckard (Senior Statutory auditor) for and on behalf of KPMG LLP, Statutory auditor Chartered Accountants 15 Canada Square London E14 5GL
16 May 2016
INTRODUCTION STRATEGIC REPORT GOVERNANCE FINANCIAL STATEMENTS 73

74
Note
52 weeks ended 2 Apr 2016
£m
Period ended 4 Apr 2015
£m
Continuing operations
Revenue 4 771.7 964.3
Cost of sales (476.2) (630.8)
Gross profit 295.5 333.5
Selling, marketing and distribution costs (128.4) (135.2)
Administrative costs (112.6) (242.4)
Operating profit/(loss) 5 54.5 (44.1)
Operating profit before impairment and loss on disposal of operations 68.1 45.8
Impairment of goodwill and property, plant and equipment 13 – (83.9)
Impairment of investments in associates 13, 15 (13.6) –
Loss on disposal of operations 11 – (6.0)
Finance cost 7 (48.1) (82.5)
Finance income 7 2.5 1.8
Net movement on fair valuation of interest rate financial instruments 7 0.7 (1.2)
Share of loss from associates 15 (22.6) (9.6)
Loss before taxation from continuing operations (13.0) (135.6)
Taxation credit 8 47.0 42.9
Profit/(loss) after taxation from continuing operations 34.0 (92.7)
Loss from discontinued operations 10 (4.8) (30.9)
Profit/(loss) for the period attributable to owners of the parent 29.2 (123.6)
Basic and diluted earnings/(loss) per share
From continuing operations (pence) 9 4.1 (12.7)
From discontinued operations (pence) 9 (0.6) (4.2)
From profit/(loss) for the period 3.5 (16.9)
Adjusted Earnings per Share1
From continuing operations (pence) 9 8.1 9.0
1 Adjusted Earnings per Share is defined as trading profit less net regular interest, less a notional tax charge at 20% (2014/15: 21.4%) divided by the weighted average number of ordinary shares of the Company.
The notes on pages 79 to 130 form an integral part of the consolidated financial statements.
Consolidated statement of profit or loss
Premier Foods plc Annual report and accounts for the financial period ended 2 April 2016

Note
52 weeks ended 2 Apr 2016
£m
Period ended 4 Apr 2015
£m
Profit/(loss) for the period 29.2 (123.6)
Other comprehensive income, net of tax
Items that will never be reclassified to profit or loss
Remeasurements of defined benefit liability 24 344.8 379.3
Deferred tax charge 8 (65.9) (75.8)
Items that are or may be reclassified to profit or loss
Exchange differences on translation (0.4) (0.6)
Other comprehensive income, net of tax 278.5 302.9
Total comprehensive income attributable to owners of the parent 307.7 179.3
The notes on pages 79 to 130 form an integral part of the consolidated financial statements.
Consolidated statement of comprehensive income
INTRODUCTION STRATEGIC REPORT GOVERNANCE FINANCIAL STATEMENTS 75

76
Note
As at 2 Apr 2016
£m
As at 4 Apr 2015
£m
ASSETS:
Non-current assets
Property, plant and equipment 12 187.8 183.3 Goodwill 13 649.8 646.0 Other intangible assets 14 496.0 528.4 Retirement benefit assets 24 550.9 241.6 Investments in associates 15 – 35.2 Deferred tax assets 8 25.9 41.9
1,910.4 1,676.4 Current assets
Inventories 18 63.2 68.8 Trade and other receivables 19 100.5 123.5 Cash and cash equivalents 27 8.0 44.7 Derivative financial instruments 22 1.6 –
173.3 237.0 Total assets 2,083.7 1,913.4 LIABILITIES:
Current liabilities
Trade and other payables 20 (204.7) (212.6)Financial liabilities
– short-term borrowings 21 (0.4) (42.0)– derivative financial instruments 22 (2.0) (3.7)Provisions for liabilities and charges 23 (6.3) (8.6)Current income tax liabilities (0.7) (0.7)
(214.1) (267.6)Non-current liabilities
Financial liabilities – long-term borrowings 21 (541.8) (587.6)Retirement benefit obligations 24 (420.0) (453.4)Provisions for liabilities and charges 23 (47.3) (51.6)Other liabilities 25 (12.0) (13.0)
(1,021.1) (1,105.6)Total liabilities (1,235.2) (1,373.2)Net assets 848.5 540.2 EQUITY:
Capital and reserves
Share capital 26 82.7 82.6 Share premium 26 1,406.6 1,406.4 Merger reserve 26 351.7 351.7 Other reserves 26 (9.3) (9.3)Profit and loss reserve 26 (979.3) (1,291.2)
Capital and reserves attributable to owners of the parent 852.4 540.2 Non-controlling interest 17 (3.9) –Total equity 848.5 540.2
The notes on pages 79 to 130 form an integral part of the consolidated financial statements.
The financial statements on pages 74 to 130 were approved by the Board of directors on 16 May 2016 and signed on its behalf by:
Gavin Darby Alastair MurrayChief Executive Officer Chief Financial Officer
Consolidated balance sheet
Premier Foods plc Annual report and accounts for the financial period ended 2 April 2016

Note
52 weeks ended 2 Apr 2016
£m
Period ended 4 Apr 2015
£m
Cash generated from operations 27 137.1 62.5
Interest paid (44.2) (60.9)
Interest received 2.5 1.8
Cash generated from operating activities 95.4 3.4
Sale of businesses – 8.3
Cash outflow on business combination (0.2) –
Loan notes issued – (15.7)
Purchases of property, plant and equipment (23.0) (34.1)
Purchases of intangible assets (6.9) (7.9)
Sale of property, plant and equipment – 1.7
Cash used in investing activities (30.1) (47.7)
Repayment of borrowings (58.0) (771.0)
Proceeds from borrowings – 500.0
Movement in securitisation funding programme (19.7) (100.3)
Financing fees and other costs of finance – (58.3)
Proceeds from share issue 0.3 353.4
Share issue costs – (13.3)
Purchase of shares to satisfy share awards (1.8) (1.5)
Cash used in financing activities (79.2) (91.0)
Net decrease in cash and cash equivalents (13.9) (135.3)
Cash, cash equivalents and bank overdrafts at beginning of period 21.7 157.0
Cash, cash equivalents and bank overdrafts at end of period 27 7.8 21.7
The notes on pages 79 to 130 form an integral part of the consolidated financial statements.
Consolidated statement of cash flows
INTRODUCTION STRATEGIC REPORT GOVERNANCE FINANCIAL STATEMENTS 77

78
Consolidated statement of changes in equity
Note
Share capital
£m
Share premium
£m
Merger reserve
£m
Other reserves
£m
Profit and loss reserve
£m
Non-controlling
interest£m
Total equity
£m
At 1 January 2014 24.0 1,124.7 404.7 (9.3) (1,526.3) 0.1 17.9
Loss for the period – – – – (123.6) – (123.6)
Remeasurements of defined benefit schemes 24 – – – – 379.3 – 379.3
Deferred tax charge 8 – – – – (75.8) – (75.8)
Exchange differences on translation – – – – (0.6) – (0.6)
Other comprehensive income – – – – 302.9 – 302.9
Total comprehensive income – – – – 179.3 – 179.3
Shares issued 58.6 295.0 – – – – 353.6
Cost of shares issued – (13.3) – – – – (13.3)
Share-based payments – – – – 4.3 – 4.3
Shares purchased to satisfy share awards – – – – (1.5) – (1.5)
Disposal of non-controlling interest – – – – – (0.1) (0.1)
Realisation of merger reserve – – (53.0) – 53.0 – –
At 4 April 2015 82.6 1,406.4 351.7 (9.3) (1,291.2) – 540.2
At 4 April 2015 82.6 1,406.4 351.7 (9.3) (1,291.2) – 540.2
Profit for the period – – – – 29.2 – 29.2
Remeasurements of defined benefit schemes 24 – – – – 344.8 – 344.8
Deferred tax charge 8 – – – – (65.9) – (65.9)
Exchange differences on translation – – – – (0.4) – (0.4)
Other comprehensive income – – – – 278.5 – 278.5
Total comprehensive income – – – – 307.7 – 307.7
Shares issued 0.1 0.2 – – – – 0.3
Share-based payments – – – – 4.1 – 4.1
Shares purchased to satisfy share awards – – – – (1.8) – (1.8)
Deferred tax movements on share-based payments – – – – 1.9 – 1.9
Non-controlling interest on change of ownership – – – – – (3.9) (3.9)
At 2 April 2016 82.7 1,406.6 351.7 (9.3) (979.3) (3.9) 848.5
The notes on pages 79 to 130 form an integral part of the consolidated financial statements.
Premier Foods plc Annual report and accounts for the financial period ended 2 April 2016

Notes to the financial statements
1. General informationPremier Foods plc (the 'Company') is a public limited company incorporated and domiciled in England and Wales, registered number 5160050, with its registered office at Premier House, Centrium Business Park, Griffiths Way, St Albans, Hertfordshire AL1 2RE. The principal activity of the Company and its subsidiaries (the 'Group') is the manufacture and distribution of branded and own label food and beverage products. Copies of the annual report and accounts are available from the above address.
These Group consolidated financial statements were authorised for issue by the Board of directors on 16 May 2016.
2. Accounting policiesThe principal accounting policies applied in the preparation of these consolidated financial statements are set out below. These policies have been consistently applied to all the periods presented, unless otherwise stated.
2.1 Basis of preparation The consolidated financial statements of the Company have been prepared in accordance with International Financial Reporting Standards ('IFRS') as adopted by the European Union (EU) ('adopted IFRS') in response to IAS regulation (EC1606/2002), related interpretations and the Companies Act 2006 applicable to companies reporting under IFRS, and on the historical cost basis, with the exception of derivative financial instruments which are incorporated using fair value. Amounts are presented to the nearest £0.1m.
The preparation of financial statements in conformity with adopted IFRS requires the use of certain critical accounting estimates. It also requires management to exercise its judgement in the process of applying the Group’s accounting policies. The areas involving a higher degree of judgement or complexity, or areas where assumptions and estimates are significant to the consolidated financial statements are disclosed in note 3.
The following accounting standards and interpretations, issued by the International Accounting Standards Board ('IASB') or IFRIC (as endorsed by the EU), are effective for the first time in the current financial period and have been adopted by the Group:
International Financial Reporting Standards
Amendments to IFRS 2 Share-based PaymentsAmendments to IFRS 3 Business CombinationsAmendments to IFRS 8 Operating SegmentsAmendments to IFRS 13 Fair Value MeasurementAmendments to IAS 16 Property, plant and equipmentAmendments to IAS 19 Defined Benefit Plans: Employee ContributionsAmendments to IAS 24 Related party disclosuresAmendments to IAS 38 Intangible Assets
There has been no material impact on the Group’s results, net assets, cash flows and disclosures on adoption of new or revised standards in the period.
The following amendments to published standards, effective for periods on or after 1 January 2016, have been endorsed by the EU:
International Financial Reporting Standards
Amendments to IFRS 5 Non-current assets held for sale and discontinued operationsAmendments to IFRS 7 Financial instrumentsAmendments to IFRS 10, IFRS 11 and IFRS 12 Transition guidanceAmendments to IFRS 11 Accounting for Acquisitions of Interests in Joint OperationsAmendments to IAS 1 Disclosure initiativeAmendments to IAS 34 Interim financial reportingAmendments to IAS 16 and IAS 38 Clarification of Acceptable Methods of Depreciation and Amortisation Amendments to IAS 16 and IAS 41 Bearer PlantsAmendments to IAS 19 Employee benefitsAmendments to IAS 27 Equity Method in Separate Financial Statements
INTRODUCTION STRATEGIC REPORT GOVERNANCE FINANCIAL STATEMENTS 79

80
Notes to the financial statements
2. Accounting policies continuedThe following standards and amendments to published standards, effective for periods on or after 1 January 2016, have not been endorsed by the EU:
International Financial Reporting Standards
Amendments to IFRS 10 and IAS 28 Sale or Contribution of Assets between an Investor and its Associate or Joint Venture
Amendments to IFRS 10, IFRS 12 and IAS 28 Investment entities: Applying the Consolidation Exception
Amendments to IAS 7 Disclosure Initiative
Amendments to IAS 12 Recognition of Deferred Tax Assets for Unrealised Losses
IFRS 9 Financial Instruments
IFRS 14 Regulatory Deferral Accounts
IFRS 15 Revenue from Contracts with Customers
Amendments to IFRS 15 Effective date of IFRS 15
IFRS 16 Leases
The Group is currently assessing the impact of the above new standards that are not yet effective and is yet to quantify the potential impact.
Basis for preparation of financial statements on a going concern basisThe Group’s revolving credit facility includes net debt/EBITDA and EBITDA/interest covenants. In the event these covenants are not met then the Group would be in breach of its financing agreement and, as would be the case in any covenant breach, the banking syndicate could withdraw funding to the Group. The Group was in compliance with its covenant tests as at 2 October 2015 and 2 April 2016. The Group’s forecasts, taking into account reasonably possible changes in trading performance, show that the Group should be able to operate within the level of its current facilities including covenant tests. The directors have a reasonable expectation that the Group has adequate resources to continue in operational existence for the next 12 months. The Group therefore continues to adopt the going concern basis in preparing its consolidated financial statements.
2.2 Basis of consolidation(i) Subsidiaries The consolidated financial statements include the financial statements of Premier Foods plc and entities controlled by the Company (its subsidiaries). Control is achieved where the Company is exposed to or has rights to variable returns from involvement with an investee and has the ability to affect those returns through its power over the investee.
The results of subsidiaries acquired or disposed of during the period are included in the consolidated statement of profit or loss from the effective date of acquisition or up to the effective date of disposal, as appropriate. In addition, comparatives are also restated to reclassify material disposed businesses into discontinued operations where appropriate.
Accounting policies of subsidiaries have been changed where necessary to ensure consistency with the policies adopted by the Group.
All intra-Group transactions, balances, income and expenses are eliminated on consolidation.
Premier Foods plc Annual report and accounts for the financial period ended 2 April 2016

2. Accounting policies continued(ii) AssociatesAssociates are all entities over which the Group has significant influence but not control. Investments in associates are accounted for using the equity method of accounting, under which the investment is initially recognised at cost and the carrying amount is increased or decreased to recognise the Group’s share of the profit or loss of the investee after the date of acquisition. The Group’s share of post-acquisition profit or loss is recognised in the statement of profit or loss.
2.3 RevenueRevenue comprises the invoiced value for the sale of goods net of sales rebates, discounts, value added tax and other taxes directly attributable to revenue and after eliminating sales within the Group. Revenue is recognised when the outcome of a transaction can be measured reliably and when it is probable that the economic benefits associated with the transaction will flow to the Group. Revenue is recognised on the following basis:
(i) Sale of goodsSales of goods are recognised as revenue on transfer of the risks and rewards of ownership, which typically coincides with the time when the merchandise is delivered to customers and title passes.
(ii) Sales rebates and discountsSales related discounts comprise:
• Long-term discounts and rebates, which are sales incentives to customers to encourage them to purchase increased volumes and are related to total volumes purchased and sales growth.
• Short-term promotional discounts, which are directly related to promotions run by customers.
Sales rebates and discount accruals are established at the time of sale based on management’s best estimate of the amounts necessary to meet claims by the Group’s customers in respect of these rebates and discounts. Accruals are made for each individual promotion or rebate arrangement and are based on the type and length of promotion and nature of customer agreement. At the time an accrual is made the nature and timing of the promotion is typically known. Estimation is required for sales volumes/activity and the amount of product sold on promotion.
(iii) Commercial incomeCommercial income received from suppliers through rebates and discounts are recognised within cost of sales over the period(s) to which the underlying contract or agreement relates. Accrued income is recognised for rebates on contracts covering the current period, for which no cash was received at the balance sheet date. Deferred income is recognised for rebates that were received from suppliers at the balance sheet date but relate to contracts covering future periods.
2.4 Segmental reportingOperating segments are reported in a manner consistent with the internal reporting provided to the Chief Operating Decision Maker ('CODM'). The CODM is responsible for allocating resources and assessing performance of the operating segments. See note 4 for further details.
2.5 Share-based paymentsThe Company operates a number of equity-settled and cash-settled share-based compensation plans. The fair value of the employee services received in exchange for the grant of shares or options is recognised as an expense over the vesting period. The total amount to be expensed over the vesting period is determined by reference to the fair value of shares or options granted, excluding the impact of any non-market vesting conditions (for example, profitability and sales growth targets). Non-market vesting conditions are included in assumptions about the number of shares or options that are expected to vest. At each balance sheet date, the Group revises its estimates of the number of shares or options that are expected to vest and recognises the impact of the revision to original estimates, if any, in the statement of profit or loss, with a corresponding adjustment to equity.
2.6 Foreign currency translationTransactions in foreign currencies are recorded at the rate of exchange at the date of the transaction. Monetary assets and liabilities denominated in foreign currencies are translated into the functional currency of the subsidiaries, at rates of exchange ruling at the end of the financial period.
The results of overseas subsidiaries with functional currencies other than in sterling are translated into sterling at the average rate of exchange ruling in the period. The balance sheets of overseas subsidiaries are translated into sterling at the closing rate. Exchange differences arising from retranslation at the period end exchange rates of the net investment in foreign subsidiaries are recorded as a separate component of equity in reserves. When a foreign operation is sold exchange differences previously taken to equity are recognised in the statement of profit or loss as part of the gain or loss on sale.
Goodwill and fair value adjustments arising on the acquisition of a foreign entity are treated as assets and liabilities of the foreign entity and translated at the closing rate.
All other exchange gains or losses are recorded in the statement of profit or loss.
INTRODUCTION STRATEGIC REPORT GOVERNANCE FINANCIAL STATEMENTS 81

82
2. Accounting policies continued2.7 Property, plant and equipment ('PPE')Property, plant and equipment is stated at historical cost less accumulated depreciation and impairment.
PPE is initially recorded at cost. Cost includes the original purchase price of the asset and the costs attributable to bringing the asset to its working condition for its intended use. Subsequent expenditure is added to the carrying value of the asset when it is probable that incremental future economic benefits will transfer to the Group. All other subsequent expenditure is expensed in the period it is incurred.
Differences between the cost of each item of PPE and its estimated residual value are written off over the estimated useful life of the asset using the straight-line method. Reviews of the estimated remaining useful lives and residual values of individual productive assets are performed annually, taking account of commercial and technological obsolescence as well as normal wear and tear. Freehold land is not depreciated. The useful economic lives of owned assets range from 15 to 50 years for buildings, 5 to 30 years for plant and equipment and 10 years for vehicles.
All items of PPE are reviewed for impairment when there are indications that the carrying value may not be fully recoverable.
Assets under construction represent the amount of expenditure recognised in the carrying amount of an item of PPE in the course of its construction. Directly attributable costs that are capitalised as part of the PPE include the employee costs and an appropriate portion of relevant overheads. When the item of PPE is brought into use, it is depreciated.
The cost and depreciation relating to disposed assets is written off to profit or loss on disposal of PPE.
2.8 Business combinations and goodwill Business combinations are accounted for using the acquisition method. The consideration for each acquisition is measured at the aggregate of the acquisition date fair values of assets given, liabilities incurred or assumed and equity instruments issued by the Group in exchange for control of the acquiree. Identifiable assets acquired and liabilities and contingent liabilities assumed in a business combination are measured at their fair values at the acquisition date, irrespective of the extent of any non-controlling interest. Acquisition related costs are recognised in profit or loss as incurred.
Where the measurement of the fair value of identifiable net assets is incomplete at the end of the reporting period in which a business combination occurs, the Group will report provisional fair values. Fair values are determined within a year of the acquisition date and retrospectively applied.
For the purpose of impairment testing, goodwill acquired in a business combination is allocated to each of the cash-generating units ('CGUs'), or groups of CGUs, that is expected to benefit from the synergies of the combination. Each unit or group of units to which the goodwill is allocated represents the lowest level within the entity at which the goodwill is monitored for internal management purposes. Goodwill is monitored at the operating segment level.
The Group has applied IFRS 3 (Revised) Business Combinations to business combinations after 1 July 2009. The accounting for business combinations transacted prior to this date have not been restated.
2.9 Intangible assetsIn addition to goodwill, the Group recognises the following intangible assets:
Acquired intangible assetsAcquired brands, trademarks and licences that are controlled through custody or legal rights and that could be sold separately from the rest of the business are capitalised, where fair value can be reliably measured. All of these assets are considered to have finite lives and are amortised on a straight-line basis over their estimated useful economic lives that range from 20 to 40 years for brands and trademarks and 10 years for licences.
Research and developmentResearch expenditure is charged to the statement of profit or loss in the period in which it is incurred.
SoftwareDevelopment costs that are directly attributable to the design and testing of identifiable and unique software products controlled by the Group are recognised as intangible assets when the project or process is technically and commercially feasible. Directly attributable costs that are capitalised as part of the software product include the software development employee costs and an appropriate portion of relevant overheads.
Software development costs are amortised over their estimated useful lives on a straight-line basis over a range of 3 to 10 years.
The useful economic lives of intangible assets are determined based on a review of a combination of factors including the asset ownership rights acquired and the nature of the overall product life cycle. Reviews of the estimated remaining useful lives and residual values of individual intangible assets are performed annually.
Notes to the financial statements
Premier Foods plc Annual report and accounts for the financial period ended 2 April 2016

2. Accounting policies continued2.10 Impairment The carrying value of non-financial assets, other than goodwill and inventories, are reviewed at least annually to determine whether there is an indication of impairment. Assets that are subject to amortisation are reviewed for impairment whenever events or changes in circumstances indicate that the carrying amount may not be recoverable. Non-financial assets, other than goodwill, that have suffered an impairment loss are reviewed for possible reversal of the impairment at each reporting date.
Where an indication of impairment exists, the recoverable amount is estimated based on the greater of its value in use and its fair value less costs to sell. In assessing value in use, the estimated future cash flows, adjusted for the risks specific to each asset, are discounted to their present value using a discount rate that reflects current market assessment of the time value of money and the general risks affecting the food manufacturing industry.
Impairment losses are recognised in the statement of profit or loss in the period in which they occur.
For the purpose of impairment testing, assets are grouped together into the smallest group of assets that generates cash inflows from continuing use that are largely independent of the cash flows of other assets.
2.11 Financing cost and incomeFinance costBorrowing costs are accounted for on an accruals basis in the statement of profit or loss using the effective interest method.
Finance incomeFinance income is recognised on a time proportion basis, taking into account the principal amounts outstanding and the interest rates applicable, taking into consideration the interest element of derivatives.
2.12 LeasesAssets held under finance leases, where substantially all the risks and rewards of ownership are transferred to the Group, are capitalised and included in property, plant and equipment at the lower of the present value of future minimum lease payments or fair value. Each asset is depreciated over the shorter of the lease term or its estimated useful life on a straight-line basis. Obligations relating to finance leases, net of finance charges in respect of future periods, are included under borrowings. The interest element of the rental obligation is allocated to accounting periods during the lease term to reflect a constant rate of interest on the remaining balance of the obligation for each accounting period.
Leases in which a significant portion of risks and rewards of ownership are retained by the lessor are classified as operating leases. Rental costs under operating leases, net of any incentives received from the lessor, are charged to the statement of profit or loss on a straight-line basis over the lease period.
2.13 InventoriesInventory is valued at the lower of cost and net realisable value. Where appropriate, cost includes production and other attributable overhead expenses as described in IAS 2 Inventories. Cost is calculated on a first-in, first-out basis by reference to the invoiced value of supplies and attributable costs of bringing the inventory to its present location and condition. Net realisable value is the estimated selling price in the ordinary course of business less estimated costs of completion and the estimated costs necessary to make the sale.
All inventories are reduced to net realisable value where the estimated selling price is lower than cost.
Provision is made for slow moving, obsolete and defective inventory where appropriate.
2.14 TaxationIncome tax on the profit or loss for the period comprises current and deferred tax.
Current taxIncome tax is recognised in the statement of profit or loss except to the extent that it relates to items recognised directly in other comprehensive income ('OCI') in which case it is recognised in equity. Current tax is the expected tax payable on the taxable income for the period, using tax rates enacted or substantively enacted at the reporting date, and any adjustment to tax payable in respect of previous periods.
INTRODUCTION STRATEGIC REPORT GOVERNANCE FINANCIAL STATEMENTS 83

84
2. Accounting policies continuedDeferred taxDeferred taxation is accounted for in respect of temporary differences between the carrying amount of assets and liabilities in the financial statements and the corresponding tax bases used in computation of taxable profit. Deferred taxation is not provided on the initial recognition of an asset or liability in a transaction, other than in a business combination, if at the time of the transaction there is no effect on either accounting or taxable profit or loss.
Deferred tax is measured at the tax rates that are expected to apply in the periods in which the asset or liability is settled based on tax rates (and tax laws) that have been enacted or substantively enacted at the balance sheet date. It is recognised in the statement of profit or loss except when it relates to items credited or charged directly to other comprehensive income, in which case the deferred tax is also recognised in equity.
Deferred tax assets are recognised to the extent that it is probable that future taxable profit will be available against which the temporary difference can be utilised. Their carrying amount is reviewed at each balance sheet date on the same basis.
Deferred tax assets and liabilities are offset when they relate to income taxes levied by the same taxation authority and when the Group intends to settle its current tax assets and liabilities on a net basis.
2.15 Employee benefitsGroup companies provide a number of long-term employee benefit arrangements, primarily through pension schemes. The Group has both defined benefit and defined contribution plans.
Defined benefit plansA defined benefit plan is a pension plan that defines the amount of pension benefit that an employee will receive on retirement, usually dependent on factors such as age, years of service and compensation.
The liability recognised in the balance sheet in respect of defined benefit pension plans is the present value of the defined benefit obligation at the balance sheet date less the fair value of plan assets, together with adjustments for remeasurement and past service costs. Defined benefit obligations are calculated using assumptions determined by the Group with the assistance of independent actuaries using the projected unit credit method. The present value of the defined benefit obligation is determined by discounting the estimated future cash outflows using yields of high-quality corporate bonds that are denominated in the currency in which the benefits will be paid, and that have terms to maturity approximating to the terms of the related pension liability.
Remeasurement arising from experience adjustments and changes in actuarial assumptions are charged or credited to the statement of comprehensive income in the period in which they arise.
Past service costs, administration costs, and the net interest on the net defined benefit liability are recognised immediately in the statement of profit or loss.
Curtailments are recognised as a past service cost when the Group makes a significant reduction in the number of employees covered by a plan or amends the terms of a defined benefit plan so that a significant element of future service by current employees no longer qualifies or qualify for amended benefits.
Defined contribution plansA defined contribution plan is a pension plan under which the Group pays fixed contributions into a separate entity, which then invests the contributions to buy annuities for the pension liabilities as they become due based on the value of the fund. The Group has no legal or constructive obligations to pay further contributions.
Obligations for contributions to defined contribution pension plans are recognised as an expense in the statement of profit or loss as they fall due. Differences between contributions payable in the period and contributions actually paid are recognised as either accruals or prepayments in the balance sheet.
2.16 ProvisionsProvisions (for example restructuring or property exit costs) are recognised when the Group has present legal or constructive obligations as a result of past events, it is probable that an outflow of resources will be required to settle the obligations and a reliable estimate of the amount can be made. In the case of where the Group expects a provision to be reimbursed, for example under an insurance contract, the reimbursement is recognised as a separate asset when the reimbursement is virtually certain. Where material, the Group discounts its provisions using a pre-tax rate that reflects current market assessments of the time value of money and the risks specific to the liability. Where discounting is used, the increase in the provision due to the passage of time is recognised as a finance expense.
Notes to the financial statements
Premier Foods plc Annual report and accounts for the financial period ended 2 April 2016

2. Accounting policies continued2.17 Contingent liabilities and contingent assetsA contingent liability is a possible obligation that arises from past events and the existence of which will only be confirmed by the occurrence or non-occurrence of one or more uncertain future events not wholly within the control of the Group or the amount of obligation cannot be measured reliably. A contingent liability is not recognised but is disclosed in the notes to the financial statements. When an outflow becomes probable, it is recognised as a provision.
A contingent asset is a possible asset that arises from past events and the existence of which will be confirmed only by the occurrence or non-occurrence of one or more uncertain events not wholly within the control of the Group. Contingent assets are not recognised but are disclosed in the notes to the financial statements when an inflow of economic benefits is probable. When inflow is virtually certain an asset is recognised.
2.18 Financial instrumentsFinancial assets and financial liabilities are recognised on the Group’s balance sheet when the Group becomes a party to the contractual provisions of the instrument.
Trade and other receivablesTrade and other receivables are initially measured at fair value and subsequently measured at amortised cost less any provision for impairment. A provision is made for impairment when there is objective evidence that the Group will not be able to collect all amounts due according to the terms of the receivables. Trade and other receivables are discounted when the time value of money is considered material.
Cash and cash equivalentsCash and cash equivalents, with original maturities at inception of less than 90 days, comprise cash in hand and demand deposits, and other short-term highly liquid investments that are readily convertible to a known amount of cash and are subject to an insignificant risk of changes in value.
For the purpose of the statement of cash flows, cash and cash equivalents comprise cash at bank, cash in hand, short-term deposits with an original maturity of three months or less held for the purpose of meeting short-term cash commitments and bank overdrafts.
Financial liabilities and equityFinancial liabilities and equity instruments issued by the Group are classified according to the substance of the contractual arrangements entered into and the definitions of a financial liability and an equity instrument. An equity instrument is any contract that evidences a residual interest in the assets of the Group after deducting all of its liabilities. The accounting policies adopted for specific financial liabilities and equity instruments are set out below.
Bank borrowingsInterest-bearing bank loans and overdrafts are measured initially at fair value and subsequently at amortised cost, using the effective interest rate method. Any difference between the proceeds (net of transaction costs and inclusive of debt issuance costs) and the settlement or redemption of borrowings is recognised over the term of the borrowings in accordance with the Group’s accounting policy for borrowing costs.
Trade and other payables Trade and other payables are initially measured at fair value and subsequently measured at amortised cost. Trade payables and other liabilities are discounted when the time value of money is considered material.
Equity instrumentsEquity instruments issued by the Company are recorded at the amount of the proceeds received, net of directly attributable issue costs.
Derivative financial instruments Derivatives embedded in other financial instruments or other host contracts are treated as separate derivatives when their risk and characteristics are not closely related to those of the host contracts and the host contracts are not carried at fair value, with unrealised gains or losses reported in the statement of profit or loss. Derivatives are initially recognised at fair value on the date a derivative contract is entered into and are subsequently re-measured at their fair value. Movements in fair value of foreign exchange derivatives are recognised within operating profit and those relating to interest rate swaps are recorded within the net movement on fair valuation of interest rate financial instruments.
2.19 Deferred incomeDeferred income is recognised and released over the period to which the relevant agreement relates.
INTRODUCTION STRATEGIC REPORT GOVERNANCE FINANCIAL STATEMENTS 85

86
3. Critical accounting policies, estimates and judgementsThe following are areas of particular significance to the Group’s financial statements and include the use of estimates and the application of judgement, which is fundamental to the compilation of a set of financial statements.
3.1 Employee benefitsThe present value of the Group’s defined benefit pension obligations depends on a number of actuarial assumptions. The primary assumptions used include the discount rate applicable to scheme liabilities, the long-term rate of inflation and estimates of the mortality applicable to scheme members.
At each reporting date, and on a continuous basis, the Group reviews the macro-economic, Company and scheme specific factors influencing each of these assumptions, using professional advice, in order to record the Group’s ongoing commitment and obligation to defined benefit schemes in accordance with IAS 19 (Revised). Key assumptions used are mortality rates, discount rates and inflation set with reference to bond yields. Each of the underlying assumptions is set out in more detail in note 24.
3.2 Goodwill and other intangible assetsImpairment reviews in respect of goodwill are performed annually unless an event indicates that an impairment review is necessary. Impairment reviews in respect of intangible assets are performed when an event indicates that an impairment review is necessary. Examples of such triggering events include a significant planned restructuring, a major change in market conditions or technology, expectations of future operating losses, or a significant reduction in cash flows. The recoverable amounts of CGUs are determined based on the higher of net realisable value and value in use calculations. These calculations require the use of estimates.
The Group has considered the impact of the assumptions used on the calculations and has conducted sensitivity analysis on the impairment tests of the CGUs carrying values. See note 13 for further details.
Acquired brands, trademarks and licences are considered to have finite lives that range from 20 to 40 years for brands and trademarks and 10 years for licences. The determination of the useful lives takes into account certain quantitative factors such as sales expectations and growth prospects, and also many qualitative factors such as history and heritage, and market positioning, hence the determination of useful lives are subject to estimates and judgement. For further details see note 14.
3.3 Advertising and promotion costsSales rebates and discounts are accrued on each relevant promotion or customer agreement and are charged to the statement of profit or loss at the time of the relevant promotional buy-in as a deduction from revenue. Accruals for each individual promotion or rebate arrangement are based on the type and length of promotion and nature of customer agreement. At the time an accrual is made the nature and timing of the promotion is typically known. Areas of estimation are sales volume/activity and the amount of product sold on promotion.
For short-term promotions, the Group performs a true up of estimates where necessary on a monthly basis, using real time sales information where possible and finally on receipt of a customer claim which typically follows 1-2 months after the end of a promotion. For longer term discounts and rebates the Group uses actual and forecast sales to estimate the level of rebate. These accruals are updated monthly based on latest actual and forecast sales.
Expenditure on advertising is charged to the statement of profit or loss when incurred, except in the case of airtime costs when a particular campaign is used more than once. In this case they are charged in line with the airtime profile.
3.4 Deferred tax assetsWhen assessing whether the recognition of a deferred tax asset can be justified, and if so at what level, the directors take into account the following:
• Projected profits or losses included in the latest Board approved forecast and other relevant information that allow profits chargeable to corporation tax to be derived
• The total level of recognised and unrecognised losses that can be used to reduce future forecast taxable profits• The period over which there is sufficient certainty that profits can be made that would support the recognition of an asset
Further disclosures of the amounts recognised (and unrecognised) are contained within note 8.
3.5 AssociatesAssociates are all entities over which the Group has significant influence but not control.
Judgement is sometimes required when assessing whether the Group has significant influence or control. Control is illustrated by the power over relevant activities and the exposure to the variability of returns. In determining whether the Group has the practical ability to direct relevant activities, factors such as voting rights, financial and operational dependency and any special relationships are taken into consideration.
In addition, the carrying value of investments is assessed for impairment with reference to current and future projections of profitability and cash generation.
Notes to the financial statements
Premier Foods plc Annual report and accounts for the financial period ended 2 April 2016

4. Segmental analysisIFRS 8 requires operating segments to be determined based on the Group’s internal reporting to the Chief Operating Decision Maker ('CODM'). The CODM has been determined to be the Executive Leadership Team as it is primarily responsible for the allocation of resources to segments and the assessment of performance of the segments.
The Group’s operating segments are defined as 'Grocery', 'Sweet Treats' and 'International'. The Grocery segment primarily sells savoury ambient food products and the Sweet Treats segment sells sweet ambient food products. The International segment has been aggregated within the Grocery segment for reporting purposes, in accordance with the criteria set out in IFRS 8.
The CODM uses Divisional contribution as the key measure of the segments’ results. Divisional contribution is defined as gross profit after selling, marketing and distribution costs. Divisional contribution is a consistent measure within the Group and reflects the segments’ underlying trading performance for the period under evaluation.
The Group uses trading profit to review overall group profitability. Trading profit is defined as operating profit before amortisation of intangible assets impairment, fair value movements on foreign exchange and other derivative contracts, restructuring costs, profits and losses associated with divestment activity and net interest on pensions and administrative costs.
The segment results for the 52 weeks ended 2 April 2016 and for the period ended 4 April 2015 and the reconciliation of the segment measures to the respective statutory items included in the consolidated financial statements are as follows:
52 weeks ended 2 Apr 2016
Grocery£m
Sweet Treats£m
Continuing operations
£m
Revenue 548.6 223.1 771.7
Divisional contribution 142.1 25.0 167.1
Group and corporate costs (38.3)
Trading profit 128.8
Amortisation of intangible assets (37.6)
Fair value movements on foreign exchange and other derivative contracts 2.6
Restructuring costs (11.2)
Net interest on pensions and administrative expenses (14.5)
Operating profit before impairment and loss on disposal of operations 68.1
Impairment of investments in associates (13.6)
Operating profit 54.5
Finance cost (48.1)
Finance income 2.5
Net movement on fair valuation of interest rate financial instruments 0.7
Share of loss from associates (22.6)
Loss before taxation from continuing operations (13.0)
Depreciation (8.2) (7.9) (16.1)
INTRODUCTION STRATEGIC REPORT GOVERNANCE FINANCIAL STATEMENTS 87

88
4. Segmental analysis continuedPeriod ended 4 Apr 2015
Grocery£m
Sweet Treats£m
Continuing operations
£m
Revenue 699.6 264.7 964.3 Divisional contribution 179.6 16.8 196.4 Group and corporate costs (46.2)Trading profit 150.2 Amortisation of intangible assets (47.6)Fair value movements on foreign exchange and other derivative contracts (0.6)Restructuring costs (8.2)Net interest on pensions and administrative expenses (48.0)Operating profit before impairment and loss on disposal of operations 45.8 Impairment of goodwill and property, plant and equipment (83.9)Loss on disposal of operations (6.0)Operating loss (44.1)Finance cost (82.5)Finance income 1.8 Net movement on fair valuation of interest rate financial instruments (1.2)Share of loss from associates (9.6)Loss before taxation from continuing operations (135.6)
Depreciation (10.1) (8.4) (18.5)
Revenues in the 52 weeks ended 2 April 2016, on a continuing basis, from the Group’s four principal customers, which individually represent over 10% of total revenue, are £164.7m, £124.1m, £92.8m and £92.4m (Period ended 4 April 2015: £224.4m, £161.2m, £122.4m and £113.6m).
Inter-segment transfers or transactions are entered into under the same terms and conditions that would be available to unrelated third parties.
The Group primarily supplies the UK market, although it also supplies certain products to other countries in Europe and the rest of the world. The following table provides an analysis of the Group’s revenue, which is allocated on the basis of geographical market destination, and an analysis of the Group’s non-current assets by geographical location.
Revenue – continuing operations52 weeks ended
2 Apr 2016£m
Period ended 4 Apr 2015
£m
United Kingdom 735.5 925.0
Other Europe 18.8 23.4
Rest of world 17.4 15.9
Total 771.7 964.3
Non-current assets
As at 2 Apr 2016
£m
As at 4 Apr 2015
£m
United Kingdom 1,910.4 1,676.4
Notes to the financial statements
Premier Foods plc Annual report and accounts for the financial period ended 2 April 2016

5. Operating profit/(loss) for continuing operations5.1 Analysis of costs by nature
52 weeks ended 2 Apr 2016
£m
Period ended 4 Apr 2015
£m
Employee benefits expense (note 6) (147.6) (170.5)
Depreciation of property, plant and equipment (note 12) (16.1) (18.5)
Amortisation of intangible assets (note 14) (37.6) (47.6)
Impairment of property, plant and equipment (note 12) – (16.0)
Impairment of goodwill (note 13) – (67.9)
Impairment of investment in associates (note 13, 15) (13.6) –
Loss on disposal of non-current assets (1.8) (2.5)
Loss on disposal of operations (note 11) – (6.0)
Operating lease rental payments (4.0) (6.7)
Repairs and maintenance expenditure (23.7) (27.4)
Research and development costs (6.9) (6.7)
Restructuring costs (11.2) (8.2)
Auditor remuneration (note 5.2) (0.6) (0.9)
Operating lease commitments are further disclosed in note 28.
5.2 Auditor remuneration
52 weeks ended 2 Apr 2016
£m
Period ended 4 Apr 2015
£m
Fees payable to the Group’s auditor for the audit of the consolidated and parent company accounts of Premier Foods plc (0.4) (0.3)
Fees payable to the Group’s auditor and its associates for other services:
– The audit of the Group’s subsidiaries, pursuant to legislation (0.1) (0.1)
– Services relating to corporate finance transactions (0.1) (0.5)
Total auditor remuneration (0.6) (0.9)
Following a competitive tender process KPMG LLP ('KPMG') were appointed as the Group’s auditor for the 52 weeks ended 2 April 2016. This appointment will be put to shareholders at the Annual General Meeting on 21 July 2016.
PricewaterhouseCoopers served as the Group's auditor for the period ended 4 April 2015. Remuneration of the Group’s auditor in respect of the 52 weeks ended 2 April 2016 was payable to KPMG while in respect of the period ended 4 April 2015 remuneration was payable to PricewaterhouseCoopers.
The total operating profit charge for auditors’ remuneration was £0.6m (2014/15: £0.7m).
INTRODUCTION STRATEGIC REPORT GOVERNANCE FINANCIAL STATEMENTS 89

90
6. Employees 52 weeks ended
2 Apr 2016£m
Period ended 4 Apr 2015
£m
Employee benefits expense – continuing operations
Wages and salaries (124.7) (141.1)
Social security costs (11.9) (15.1)
Termination benefits (1.5) (2.6)
Share options granted to directors and employees (4.1) (4.7)
Contributions to defined contribution schemes (note 24) (5.4) (7.0)
Total – continuing operations (147.6) (170.5)
Employee benefits expense – discontinued operations
Wages and salaries – (36.4)
Social security costs – (4.1)
Termination benefits – (0.5)
Share options granted to directors and employees – (0.9)
Contributions to defined contribution schemes (note 24) – (1.5)
Total – discontinued operations – (43.4)
Total – Group (147.6) (213.9)
Notes to the financial statements
Premier Foods plc Annual report and accounts for the financial period ended 2 April 2016

6. Employees continuedAverage monthly number of people employed (including executive and non executive directors):
2015/16Number
2014/15Number
Average monthly number of people employed – continuing operations
Management 611 600
Administration 419 382
Production, distribution and other 2,842 2,866
Total – continuing operations 3,872 3,848
Average monthly number of people employed– discontinued operations1
Management – 604
Administration – 234
Production, distribution and other – 3,065
Total – discontinued operations – 3,903
Total – continuing and discontinued operations 3,872 7,751
1 Discontinued operations employee numbers relate to the period prior to disposal of the Bread business on 26 April 2014.
Directors’ remuneration is disclosed in the audited section of the directors Remuneration Report on pages 50 to 66, which form part of these financial statements.
INTRODUCTION STRATEGIC REPORT GOVERNANCE FINANCIAL STATEMENTS 91

92
7. Finance income and costs52 weeks ended
2 Apr 2016£m
Period ended 4 Apr 2015
£m
Interest payable on bank loans and overdrafts (5.1) (7.8)
Interest payable on term facility – (7.2)
Interest payable on senior secured notes (30.8) (32.3)
Interest payable on revolving facility (5.9) (7.0)
Interest payable on interest rate derivatives (1.2) (2.9)
Other interest (payable)/receivable (0.3) 0.3
Amortisation of debt issuance costs (4.4) (4.3)
Deferred fees1 – (6.7)
(47.7) (67.9)
Write off of financing costs2 (0.4) (14.6)
Total finance cost (48.1) (82.5)
Interest receivable on bank deposits 2.5 1.8
Total finance income 2.5 1.8
Movement on fair valuation of interest rate derivative financial instruments 0.7 (1.2)
Net finance cost (44.9) (81.9)
1 Relates to accrual of deferred interest relating to the Group's previous financing arrangements.
2 Relates to the write-off of debt issuance costs relating to the Group's previous financing arrangements in 2014/15 and securitisation facility in 52 weeks ended 2 April 2016, which terminated in January 2016.
The net movement on fair valuation of interest rate financial instruments relates to a £0.7m favourable movement on interest rate swaps held (2014/15: £1.2m adverse).
Notes to the financial statements
Premier Foods plc Annual report and accounts for the financial period ended 2 April 2016
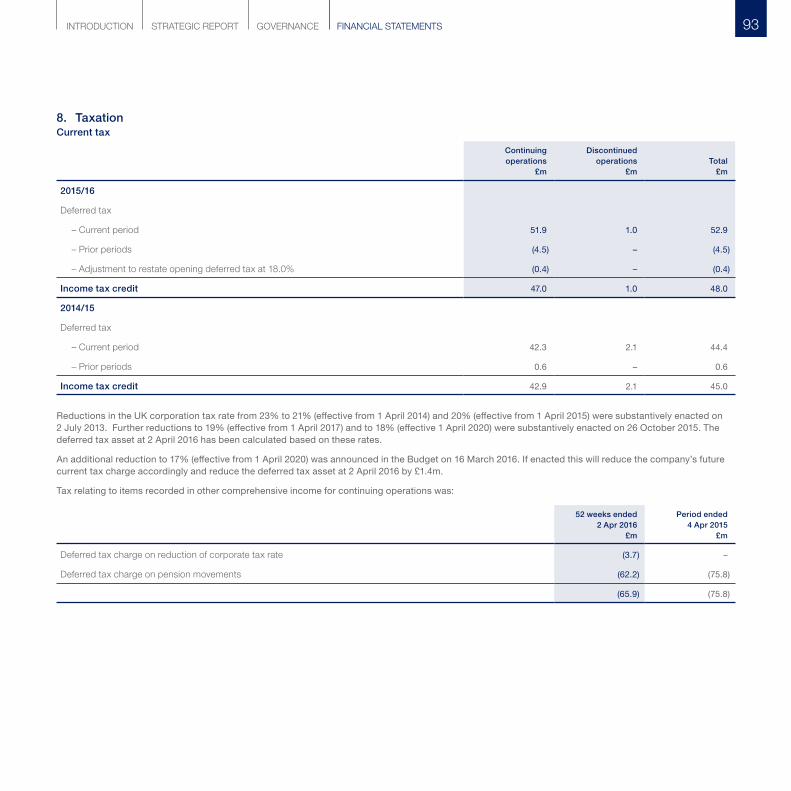
8. TaxationCurrent tax
Continuing operations
£m
Discontinued operations
£mTotal
£m
2015/16
Deferred tax
– Current period 51.9 1.0 52.9
– Prior periods (4.5) – (4.5)
– Adjustment to restate opening deferred tax at 18.0% (0.4) – (0.4)
Income tax credit 47.0 1.0 48.0
2014/15
Deferred tax
– Current period 42.3 2.1 44.4
– Prior periods 0.6 – 0.6
Income tax credit 42.9 2.1 45.0
Reductions in the UK corporation tax rate from 23% to 21% (effective from 1 April 2014) and 20% (effective from 1 April 2015) were substantively enacted on 2 July 2013. Further reductions to 19% (effective from 1 April 2017) and to 18% (effective 1 April 2020) were substantively enacted on 26 October 2015. The deferred tax asset at 2 April 2016 has been calculated based on these rates.
An additional reduction to 17% (effective from 1 April 2020) was announced in the Budget on 16 March 2016. If enacted this will reduce the company’s future current tax charge accordingly and reduce the deferred tax asset at 2 April 2016 by £1.4m.
Tax relating to items recorded in other comprehensive income for continuing operations was:
52 weeks ended 2 Apr 2016
£m
Period ended 4 Apr 2015
£m
Deferred tax charge on reduction of corporate tax rate (3.7) –
Deferred tax charge on pension movements (62.2) (75.8)
(65.9) (75.8)
INTRODUCTION STRATEGIC REPORT GOVERNANCE FINANCIAL STATEMENTS 93

94
8. Taxation continuedThe tax credit for the period differs from the standard rate of corporation tax in the UK of 20.0% (2014/15: 21.4%). The reasons for this are explained below:
52 weeks ended 2 Apr 2016
£m
Period ended 4 Apr 2015
£m
Loss before taxation for continuing operations (13.0) (135.6)
Tax credit at the domestic income tax rate of 20.0% (2014/15: 21.4%) 2.6 29.0
Tax effect of:
Non-deductible items (1.0) (1.0)
Other disallowable items – (1.3)
Impairment of goodwill – (14.5)
Share of loss from associates (4.6) (2.1)
Previously unrecognised advanced capital allowances – (9.6)
Adjustment for share-based payments (0.9) (1.0)
Previously unrecognised losses utilised 0.1 7.3
Adjustment due to current period deferred tax being provided at 18.0% (2014/15: 20%) 0.4 (1.1)
Movements in losses recognised 55.3 36.6
Adjustment to restate opening deferred tax at 18% (2014/15: 20%) (0.4) –
Adjustments to prior periods (4.5) 0.6
Income tax credit 47.0 42.9
Deferred taxDeferred tax is calculated in full on temporary differences using the tax rate appropriate to the jurisdiction in which the asset/(liability) arises and the tax rates that are expected to apply in the periods in which the asset or liability is settled. In all cases this is 18.0% (2014/15: 20.0%) except for an asset of £0.3m (2014/15: £2.0m) relating to Irish retirement benefit obligations where the local rate of 12.5% has been used.
2015/16£m
2014/15£m
At 5 April 2015 / 1 January 2014 41.9 72.7
Credited to the statement of profit or loss 48.0 45.0
Charged to other comprehensive income (65.9) (75.8)
Credited to equity 1.9 –
At 2 April 2016 / 4 April 2015 25.9 41.9
The Group has recognised a deferred tax asset based on future taxable profits, derived from the latest Board approved forecasts.
Notes to the financial statements
Premier Foods plc Annual report and accounts for the financial period ended 2 April 2016

8. Taxation continuedDue to the level of taxable profits anticipated the Group has not recognised deferred tax assets of £nil (2014/15: £43.0m) relating to UK corporation tax losses. In addition, the Group has losses of £22.4m (2014/15: £24.9m) relating to ACT and of £13.4m (2014/15: £14.9m) relating to capital losses. Under current legislation these losses can generally be carried forward indefinitely.
Deferred tax liabilitiesIntangibles
£m
Retirement benefit obligation
£mOther
£mTotal
£m
At 1 January 2014 (73.0) – (4.0) (77.0)
Current period credit 3.1 – – 3.1
Prior period credit 0.1 – – 0.1
At 4 April 2015 (69.8) – (4.0) (73.8)
Prior period restatement of opening balances
– To income statement 7.0 – 0.4 7.4
Current period credit 2.1 – – 2.1
Prior period (charge)/credit (0.7) – 3.4 2.7
Charged to other comprehensive income – (23.8) – (23.8)
At 2 April 2016 (61.4) (23.8) (0.2) (85.4)
INTRODUCTION STRATEGIC REPORT GOVERNANCE FINANCIAL STATEMENTS 95

96
8. Taxation continued
Deferred tax assets
Accelerated tax depreciation
£m
Retirement benefit obligation
£m
Share based payments
£m
Financial instruments
£mLosses
£mOther
£mTotal
£m
At 1 January 2014 25.5 120.7 1.0 2.5 – – 149.7
Prior period credit
– To statement of profit or loss 0.2 0.1 0.2 – – – 0.5
– To other comprehensive income – 0.8 – – – – 0.8
Current period (charge)/credit (5.0) (2.0) (0.4) 0.4 41.9 4.3 39.2 Charged to other comprehensive income – (76.6) – – – – (76.6)
Deferred tax credit on discontinued activities 2.1 – – – – – 2.1
At 4 April 15 22.8 43.0 0.8 2.9 41.9 4.3 115.7
Prior period restatement of opening balances
– To income statement (2.2) (0.5) (0.1) (0.3) (4.2) (0.4) (7.7)
- To equity – (3.7) – – – – (3.7)
Current period credit/(charge) 14.2 0.8 0.3 (0.6) 36.3 (0.2) 50.8
Prior period charge
– To statement of profit or loss (1.2) (1.2) (0.1) – (4.5) (1.3) (8.3)
Charged to other comprehensive income – (38.4) – – – – (38.4)
Credited to equity – – 1.9 – – – 1.9
Deferred tax credit on discontinued activities – – – – 1.0 – 1.0
At 2 April 2016 33.6 – 2.8 2.0 70.5 2.4 111.3
Net deferred tax asset £m
At 2 April 2016 25.9
At 4 April 2015 41.9
Where there is a legal right of offset and an intention to settle as such, deferred tax assets and liabilities may be presented on a net basis. This is the case for most of the Group’s deferred tax balances and therefore they have been offset in the tables above. Substantial elements of the Group’s deferred tax assets and liabilities, primarily relating to the defined benefit pension obligation, are greater than one year in nature.
Notes to the financial statements
Premier Foods plc Annual report and accounts for the financial period ended 2 April 2016

9. Earnings/(loss) per shareBasic earnings/(loss) per share has been calculated by dividing the profits attributable to owners of the parent of £29.2m (2014/15: £123.6m loss) by the weighted average number of ordinary shares of the Company.
Weighted average shares
2015/16Number
(000s)
2014/15Number
(000s)
Weighted average number of ordinary shares for the purpose of basic earnings/(loss) per share 826,017 731,390
Effect of dilutive potential ordinary shares:
– Share options 1,005 1,907
Weighted average number of ordinary shares for the purpose of diluted earnings/(loss) per share 827,022 733,297
Earnings per Share calculation
52 weeks ended 2 Apr 2016 Period ended 4 Apr 2015
Basic
Dilutive effect of share options Diluted Basic
Dilutive effect of share options Diluted
Continuing operations
Earnings/(Loss) after tax (£m) 34.0 34.0 (92.7) (92.7)
Earnings/(Loss) per share (pence) 4.1 0.0 4.1 (12.7) – (12.7)
Discontinued operations
Loss after tax (£m) (4.8) (4.8) (30.9) (30.9)
Loss per share (pence) (0.6) 0.0 (0.6) (4.2) – (4.2)
Total
Earnings/(Loss) after tax (£m) 29.2 29.2 (123.6) (123.6)
Earnings/(Loss) per share (pence) 3.5 0.0 3.5 (16.9) – (16.9)
Dilutive effect of share optionsThe dilutive effect of share options is calculated by adjusting the weighted average number of ordinary shares outstanding to assume conversion of all dilutive potential ordinary shares. The only dilutive potential ordinary shares of the Company are share options. A calculation is performed to determine the number of shares that could have been acquired at fair value (determined as the average annual market share price of the Company’s shares) based on the monetary value of the subscription rights attached to the outstanding share options.
No adjustment is made to the profit or loss in calculating basic and diluted Earnings per Share.
There is no dilutive effect of share options calculated in the prior period as the Group made a loss.
Adjusted Earnings per Share ('Adjusted EPS')Adjusted Earnings per Share is defined as trading profit less net regular interest, less a notional tax charge at 20.0% (2014/15: 21.4%) divided by the weighted average number of ordinary shares of the Company.
Net regular interest is defined as net finance costs after excluding write-off of financing costs, fair value movements on interest rate financial instruments and other interest.
Trading profit and Adjusted EPS have been reported as the directors believe these provide an alternative measure by which the shareholders can better assess the Group’s underlying trading performance.
INTRODUCTION STRATEGIC REPORT GOVERNANCE FINANCIAL STATEMENTS 97

98
9. Earnings/(loss) per share continued52 weeks ended
2 Apr 2016£m
Period ended 4 Apr 2015
£m
Trading profit 128.8 150.2
Less net regular interest (44.9) (66.4)
Adjusted profit before tax 83.9 83.8
Notional tax at 20.0%/21.4% (16.8) (17.9)
Adjusted profit after tax 67.1 65.9
Average shares in issue (m) 826.0 731.4
Adjusted EPS (pence) 8.1 9.0
Net regular interest
Net finance cost (44.9) (81.9)
Exclude fair value movements on interest rate financial instruments (0.7) 1.2
Exclude write-off of financing costs 0.4 14.6
Exclude other interest 0.3 (0.3)
Net regular interest (44.9) (66.4)
Notes to the financial statements
Premier Foods plc Annual report and accounts for the financial period ended 2 April 2016

10. Discontinued operationsIncome and expenditure incurred on discontinued operations during the period comprises costs relating to the previously disposed Bread business.
52 weeks ended 2 Apr 2016
£m
Period ended 4 Apr 2015
£m
Revenue – 177.5
Operating expenses (4.3) (188.6)
Operating loss before impairment and loss on disposal of operations (4.3) (11.1)
Impairment – (10.9)
Loss on disposal of operations – (8.6)
Operating loss (4.3) (30.6)
Finance cost (1.5) (2.4)
Loss before taxation (5.8) (33.0)
Taxation credit 1.0 2.1
Loss after taxation from discontinued operations (4.8) (30.9)
During the period, discontinued operations contributed to a net outflow of £3.7m (2014/15: £7.8m outflow) to the Group’s operating cash flows, a net inflow of £nil (2014/15: £5.7m inflow) to investing activities and £nil (2014/15: £nil) to financing activities.
11. Disposal of businessesOn 26 April 2014 the Group completed the transaction with the Gores Group which led to the disposal of the Group’s majority share in the Bread business. The Bread business was classified as a discontinued operation for the prior period up to the date of sale and the prior period loss on disposal is included in discontinued operations. The investment in associates of £14.4m was recognised at the fair value of the 49% retained share in the Bread business, based on the initial cash consideration of £15.0m being received for 51% of the business. The fair value was increased further by the issue of a loan note in the period which was reclassified to investments in associates, as described in note 15.
On 28 June 2014 the Group completed the transaction with Specialty Powders Holdings Limited which led to the disposal of the Group’s majority share in the Powdered Beverages and Desserts business. This was not a discontinued operation as it was previously integrated and reported as part of the Grocery business. The prior period loss on disposal was included within continuing operations. The investment in associates and loans to associates totalling £13.1m was recognised at the fair value of the assets that transferred to the associate as part of the disposal transaction. A loss on disposal of £6.0m was recognised in 2014/15.
INTRODUCTION STRATEGIC REPORT GOVERNANCE FINANCIAL STATEMENTS 99

100
12. Property, plant and equipmentLand and buildings
£m
Vehicles, plant and equipment
£m
Assets under construction
£mTotal
£m
Cost
At 1 January 2014 179.8 412.1 26.7 618.6
Additions 0.7 4.5 31.6 36.8
Disposals (82.2) (201.3) (3.8) (287.3)
Transferred into use – 25.4 (25.4) –
At 4 April 2015 98.3 240.7 29.1 368.1
Additions 0.2 14.6 5.5 20.3
Disposals – (4.9) – (4.9)
Acquisition of subsidiary 2.4 – – 2.4
Transferred into use 0.8 24.2 (25.0) –
At 2 April 2016 101.7 274.6 9.6 385.9
Aggregate depreciation and impairment
At 1 January 2014 (111.9) (307.6) (2.8) (422.3)
Depreciation charge (2.7) (15.8) – (18.5)
Disposals 79.4 192.6 – 272.0
Impairment charge (0.4) (15.6) – (16.0)
At 4 April 2015 (35.6) (146.4) (2.8) (184.8)
Depreciation charge (1.9) (14.2) – (16.1)
Disposals – 2.8 – 2.8
At 2 April 2016 (37.5) (157.8) (2.8) (198.1)
Net book value
At 31 December 2013 67.9 104.5 23.9 196.3
At 4 April 2015 62.7 94.3 26.3 183.3
At 2 April 2016 64.2 116.8 6.8 187.8
The Group’s borrowings are secured on the assets of the Group including property, plant and equipment.
Notes to the financial statements
Premier Foods plc Annual report and accounts for the financial period ended 2 April 2016

12. Property, plant and equipment continuedImpairment chargeThere has been no impairment charge recognised in 2015/16.
An impairment charge of £16.0m was recognised in the first half of 2014/15 against property, plant and equipment relating to a reduction in the recoverable value of certain assets in the Grocery business.
13. GoodwillAs at
2 Apr 2016£m
As at 4 Apr 2015
£m
Carrying value
Opening balance 646.0 713.9
Acquisition of subsidiary 3.8 –
Impairment charge – (67.9)
Closing balance 649.8 646.0
Goodwill attached to each of the Group’s CGUs is as follows:
As at 2 Apr 2016
£m
As at 4 Apr 2015
£m
Grocery1 649.8 646.0
Net carrying value of goodwill 649.8 646.0
1 Goodwill attributable to the Grocery CGU includes amounts recognised on gaining control of Knighton
Impairment tests for goodwillGoodwill is tested annually for impairment or more frequently if there are indications that goodwill may be impaired. The recoverable amount of a CGU is determined based on value in use calculations or fair value less costs to sell, depending on the way in which the value of the CGU is expected to be recovered. The Group has three CGUs; Grocery, Sweet Treats & International. It performs impairment testing on the CGUs, to the extent there is goodwill attached to these CGUs. The International business has no attributable goodwill or intangible assets.
Key assumptionsThe key assumptions for calculating value in use are cash flows, long-term growth rate and discount rate.
Cash flow assumptionsThe cash flows used in the value in use calculation are pre-tax cash flows based on the latest Board approved forecasts in respect of the following three years, the first of which being the Board approved budget. An estimate of capital expenditure required to maintain these cash flows is also made.
The key assumptions when forecasting cash flows are revenue growth and gross profit percentage.
Revenue growth is forecast based on known or forecast customer sales initiatives, including, to the extent agreed, customer business plans or agreements for the next period, current and forecast New Product Development, promotional and marketing strategy, and specific category or geographical growth. External factors, including the consumer environment, are also taken into account in the more short-term forecasts. The compound annual growth rate over the three year forecast period is 2.2%.
Gross profit percentage is forecast based on the projected mix of branded and non-branded sales, manufacturing costs, raw material input costs and purchasing initiatives.
INTRODUCTION STRATEGIC REPORT GOVERNANCE FINANCIAL STATEMENTS 101

102
13. Goodwill continuedLong-term growth rate assumptionsFor the purpose of impairment testing the three year Board approved forecasts are extrapolated into perpetuity using growth assumptions relevant for the business sector. The growth rate applied of 2.50% (2014/15: 2.20%) is based on the long-term growth in UK GDP as the directors expect food consumption to follow GDP growth. This is not considered to be higher than the average long-term industry growth rate. The long-term growth rate is common to all CGUs.
Discount rate assumptionsThe discount rate applied to the cash flows is calculated using a pre-tax rate based on the weighted average cost of capital ('WACC') which would be anticipated for a market participant investing in the Group. The directors believe it is appropriate to use a single common discount rate for all impairment testing as each CGU shares similar risk profiles.
The Group has considered the impact of the current economic climate in determining the appropriate discount rate to use in impairment testing. At 2 April 2016, the pre-tax rate used to discount the forecasted cash flows has been determined to be 9.5% (2014/15: 10.4%).
Sensitivity analysisAn illustration of the sensitivity to reasonably possible changes in key assumptions in the impairment test for the Grocery CGU is as follows:
Reasonably possible change in assumption Impact on value in use
Revenue growth Increase/decrease by 2.0% Increase/decrease by £153.7m/£145.1m
Gross profit percentage Increase/decrease by 2.0% Increase/decrease by £98.6m/£93.3m
Long-term growth rate Increase/decrease by 0.4% Increase/decrease by £83.5m/£74.5m
Discount rate Increase/decrease by 0.5% Decrease/increase by £108.3m/£124.9m
Impairment chargeThere has been no goodwill or intangible asset impairment recognised in 2015/16. A total impairment charge of £13.6m was recognised during the period relating to the Group’s investments in Hovis Holdings Limited ('Hovis') (£9.3m) and Knighton Foods Investments Limited ('Knighton') (£4.3m). The impairment relating to Hovis reflects the highly competitive bread industry and the significant losses in the period to date. The impairment relating to Knighton reflects the challenging market conditions faced by the Knighton business.
In 2014/15, a total impairment charge of £83.9m was recognised in continuing operations, comprising goodwill allocated to the Sweet Treats CGU (£67.9m) and property, plant and equipment relating to a reduction in the recoverable value of certain assets in the Grocery business (£16.0m). A total impairment charge of £10.9m was recognised in discontinued operations in 2014/15 due to the write down of software (£6.8m) and inventory (£4.1m) associated with the Bread business.
Notes to the financial statements
Premier Foods plc Annual report and accounts for the financial period ended 2 April 2016

14. Other intangible assets
Software£m
Brands/ trademarks/ licences
£m
Customer relationships
£m
Assets under construction
£mTotal
£m
Cost
At 1 January 2014 139.8 853.2 134.8 9.1 1,136.9
Additions 0.1 – – 9.8 9.9
Disposals (32.9) (160.0) – – (192.9)
Transferred into use 7.8 – – (7.8) –
At 4 April 2015 114.8 693.2 134.8 11.1 953.9
Additions 2.9 – – 2.3 5.2
Transferred into use 10.6 – – (10.6) –
At 2 April 2016 128.3 693.2 134.8 2.8 959.1
Accumulated amortisation and impairment
At 1 January 2014 (81.9) (346.6) (132.9) – (561.4)
Disposals 30.3 160.0 – – 190.3
Amortisation charge (13.3) (32.4) (1.9) – (47.6)
Impairment charge (6.8) – – – (6.8)
At 4 April 2015 (71.7) (219.0) (134.8) – (425.5)
Amortisation charge (11.6) (26.0) – – (37.6)
At 2 April 2016 (83.3) (245.0) (134.8) – (463.1)
Net book value
At 31 December 2013 57.9 506.6 1.9 9.1 575.5
At 4 April 2015 43.1 474.2 – 11.1 528.4
At 2 April 2016 45.0 448.2 – 2.8 496.0
All amortisation is recognised within administrative costs.
Included in the assets under construction additions for the period are £0.8m (2014/15: £6.5m) of internal costs.
The Group’s borrowings are secured on the assets of the Group including other intangible assets.
INTRODUCTION STRATEGIC REPORT GOVERNANCE FINANCIAL STATEMENTS 103

104
14. Other intangible assets continuedImpairment chargeThere has been no intangible asset impairment charge recognised in 2015/16.
An impairment charge of £6.8m was recognised in discontinued operations in 2014/15 due to the write down of software associated with the Bread business.
The material brands held on the balance sheet are as follows:
Carrying value at 4 April 2015
£m
Estimated useful life remaining
Years
Bisto 125.8 21
Oxo 83.4 31
Batchelors 65.7 21
Sharwoods 59.4 21
Mr Kipling 48.8 21
15. AssociatesDuring 2014/15, the Group disposed of its majority interest in the Bread business and the Powdered Beverages and Desserts business, as disclosed in note 11. The Group’s 49% retained interest in the share capital of these businesses was recognised as an investment in associate and the carrying value of these investments are given in the table below.
The Group issued a loan note to Hovis for £15.7m on 26 April 2014. As part of the Powdered Beverages and Desserts business disposal transaction, the Group held a promissory note from Knighton of £3.5m. These loans were reclassified to investments in associates during the period, in order to reflect the fact that in substance they form part of the carrying value of the Group’s respective investments, in accordance with 'IAS 28 Investments in Associates and Joint Ventures'.
Refer to note 13 for details of impairment charges.
Hovis
£mKnighton
£mTotal
£m
At 1 January 2014 – – –
Additions 30.1 13.1 43.2
Interest receivable 1.4 0.2 1.6
Share of loss from associates (8.9) (0.7) (9.6)
At 4 April 2015 22.6 12.6 35.2
Interest receivable 0.8 0.2 1.0
Share of loss from associates (14.1) (8.5) (22.6)
Impairment charge (9.3) (4.3) (13.6)
At 2 April 2016 – – –
Notes to the financial statements
Premier Foods plc Annual report and accounts for the financial period ended 2 April 2016

16. InvestmentsIn accordance with Section 409 of the Companies Act 2006 and The Large and Medium-sized Companies and Groups (Accounts and Reports) Regulations 2008, as amended by The Companies, Partnerships and Groups (Accounts and Reports) Regulations 2015, a full list of subsidiary undertakings, associate undertakings and joint operations (showing the country of incorporation and effective percentage of equity shares held) as at 2 April 2016 is disclosed below.
Company Country% Held by Parent Company
of the Group % held by Group companies,
if different Share Class
Premier Foods Investments No.1 Limited England & Wales 100% N/A £1.00 Ordinary shares
Premier Foods Investments Limited England & Wales 0% 100% £1.00 Ordinary shares
Premier Foods Finance plc England & Wales 0% 100% £1.00 Ordinary shares
RHM Limited England & Wales 0% 100% £0.001 Ordinary-a shares
RHM Group Holding Limited England & Wales 0% 100% £0.10 Ordinary shares
RHM Group Two Limited England & Wales 0% 100% £0.01 Ordinary shares
RHM Group Three Limited England & Wales 0% 100% £0.01 Ordinary shares
Premier Foods Group Services Limited England & Wales 0% 100% £0.01 Ordinary shares
Premier Foods Group Limited England & Wales 0% 100% £0.25 Ordinary shares
British Bakeries Limited England & Wales 0% 100% £1.00 Ordinary shares
Centura Foods Limited England & Wales 0% 100% £1.20 Ordinary shares
London Superstores Limited England & Wales 0% 100% £1.00 Ordinary shares
RHM Food Solutions Limited England & Wales 0% 100% £1.00 Ordinary shares
RHM Foodbrands+ Limited England & Wales 0% 100% £1.00 Ordinary shares
Manor Bakeries Limited England & Wales 0% 100% £1.00 Ordinary shares
Premier Foods (Holdings) Limited England & Wales 0% 100% £1.00 Ordinary shares
Citadel Insurance Company Limited Isle of Man 0% 100% £1.00 Ordinary Shares
H.L. Foods Limited England & Wales 0% 100% £1.00 Ordinary shares
Hillsdown Europe Limited England & Wales 0% 100% £2.90 Ordinary shares
Diamond Foods Lebensmittelhandel GmbH Germany 0% 100% €0.5113 Ordinary shares
Premier Brands Foods Limited England & Wales 0% 100% £1.00 Ordinary shares
Premier Financing Limited England & Wales 0% 100% £1.00 Ordinary shares
CH Old Co Limited England & Wales 0% 100% £1.00 Ordinary shares
Hillsdown Ambient Foods Group Limited England & Wales 0% 100% £1.00 Ordinary shares
Hillsdown International Limited England & Wales 0% 100% £1.00 Ordinary shares
BCL Old Co Limited England & Wales 0% 100% £1.00 Ordinary shares
Hillsdown Investments Limited England & Wales 0% 100% £1.00 Ordinary shares
MF Old Co Limited England & Wales 0% 100% £1.00 Ordinary shares
Premier Ambient Products (UK) Limited England & Wales 0% 100% £1.00 Ordinary shares
Premier Brands Limited Scotland 0% 100% £1.00 Ordinary shares
Premier International Foods UK Limited England & Wales 0% 100% £1.00 Ordinary shares
Premier Grocery Products Limited England & Wales 0% 100% £1.00 Ordinary shares
Premier Foods, Inc. United States 0% 100% USD$0.01 Common Stock shares
Premier Grocery Products Ireland Limited Ireland 0% 100% €1.00 Ordinary shares
Premier Foods Ireland Manufacturing Limited Ireland 0% 100% €1.26 Ordinary shares
RH Oldco Limited England & Wales 0% 100% £1.00 Ordinary shares
Alpha Cereals Unlimited England & Wales 0% 100% £0.05 Ordinary shares
RHM Frozen Foods Limited England & Wales 0% 100% £1.00 Ordinary shares
RHM Overseas Limited England & Wales 0% 100% £1.00 Ordinary shares
Hovis Holdings Limited England & Wales 0% 49% £0.01 Ordinary shares
Knighton Foods Investments Limited England & Wales 0% 49% £1.00 Ordinary shares
INTRODUCTION STRATEGIC REPORT GOVERNANCE FINANCIAL STATEMENTS 105

106
17. Ownership of subsidiaries/businessesOn 1 April 2016, the Group gained control (as defined under IFRS 10) of Knighton, in which the Group already held 49% of the ordinary share capital and associated voting rights. The Group considers that it had power to control Knighton as the company became financially and operationally dependent upon the Group, with the Group taking operational decisions over the relevant activities of the company.
On acquiring such control, the Group was required to consolidate Knighton.
At 2 April 2016, the Group owned 49% of the ordinary share capital.
Goodwill of £3.8m is attributable to the intellectual property of Knighton and synergies which arise on acquisition.
Given the proximity of the transfer of control to period end the fair values of all the assets and liabilities are provisional.
The following table summarises the consideration for Knighton, and the amounts of the assets acquired and liabilities assumed.
Provisional values on acquisition
£m
Recognised amounts of identifiable assets acquired and liabilities assumed
Property, plant & equipment 2.4
Inventories 7.0
Trade and other receivables 9.2
Trade and other payables (16.2)
Cash and cash equivalents (0.2)
Financial liabilities – borrowings and other loans (9.9)
Total identifiable net liabilities (7.7)
Non-controlling interest 3.9
Goodwill 3.8
Total consideration –
Pro-forma consolidated resultsThe pro-forma consolidated results of the Group, as if control of Knighton had been gained at the beginning of the period, would include revenue from continuing operations of £801.3m (compared with Group revenue of £771.7m) and underlying losses before taxation of £21.9m (compared with underlying losses before taxation of £13.0m).
In preparing the pro-forma results, revenue and costs have been included as if the businesses were acquired on 5 April 2015 and the inter-company transactions have been eliminated.
Contribution since acquisition has had no material impact on Group results.
Subsidiaries with significant non-controlling interestsThe Group has one subsidiary company which has a material non-controlling interest of 51%, Knighton. Summary financial information in relation to Knighton is shown above.
Notes to the financial statements
Premier Foods plc Annual report and accounts for the financial period ended 2 April 2016

18. InventoriesAs at
2 Apr 2016£m
As at 4 Apr 2015
£m
Raw materials 12.2 11.0
Work in progress 3.4 1.8
Finished goods and goods for resale 47.6 56.0
Total inventories 63.2 68.8
Inventory write-offs in the period amounted to £2.0m (2014/15: £7.9m).
The borrowings of the Group are secured against all the assets of the Group including inventories.
19. Trade and other receivablesAs at
2 Apr 2016£m
As at 4 Apr 2015
£m
Trade receivables 102.8 134.2
Trade receivables provided for (19.8) (29.5)
Net trade receivables 83.0 104.7
Prepayments 12.5 10.1
Other tax and social security receivable 4.4 7.7
Other receivables 0.6 1.0
Total trade and other receivables 100.5 123.5
The borrowings of the Group are secured against all the assets of the Group including trade and other receivables. The Group terminated its existing securitisation programme in January 2016.
20. Trade and other payablesAs at
2 Apr 2016£m
As at 4 Apr 2015
£m
Trade payables (137.8) (140.2)
Commercial accruals (35.9) (44.2)
Tax and social security payables (4.8) (5.1)
Other payables and accruals (26.2) (23.1)
Total trade and other payables (204.7) (212.6)
INTRODUCTION STRATEGIC REPORT GOVERNANCE FINANCIAL STATEMENTS 107

108
21. Bank and other borrowingsAs at
2 Apr 2016£m
As at 4 Apr 2015
£m
Current:
Bank overdrafts (0.2) (23.0)
Securitisation facility – (19.7)
Transaction costs – 0.7
Finance lease obligations (0.2) –
Total borrowings due within one year (0.4) (42.0)
Non-current:
Secured senior credit facility – revolving (55.0) (113.0)
Transaction costs 6.9 8.3
(48.1) (104.7)
Bank term loan (1.5) –
(1.5) –
Senior secured notes (500.0) (500.0)
Transaction costs 14.2 17.1
(485.8) (482.9)
Securitisation facility (6.4) –
(6.4) –
Total borrowings due after more than one year (541.8) (587.6)
Total bank and other borrowings (542.2) (629.6)
Revolving credit facilityThe revolving credit facility of £272m is due to mature in March 2019 and attracts an initial bank margin of 3.50% above LIBOR. Banking covenants of net debt / EBITDA and EBITDA / interest are in place and are tested biannually.
The Group entered into a three year floating to fixed interest rate swap in June 2014, with a nominal value of £150m amortising to £50m, attracting a swap rate of 1.44%.
Notes to the financial statements
Premier Foods plc Annual report and accounts for the financial period ended 2 April 2016

21. Bank and other borrowings continuedTerm loanThe term loan at the period end relates to that of Knighton and matures in October 2018, priced at 2.75% above LIBOR.
Securitisation facility The Group’s existing debtor’s securitisation facility was terminated in January 2016. The securitisation facility drawn at the period end relates to that of Knighton and matures in October 2018, priced at 2.25% above LIBOR.
Senior secured notesThe senior secured notes totalling £500m are split between fixed and floating tranches. The fixed note of £325m matures in March 2021 and attracts an interest rate of 6.50%. The floating note of £175m matures in March 2020 and attracts an interest rate of 5.00% above LIBOR.
22. Financial instrumentsThe Group’s activities expose it to a variety of financial risks: market risk (arising from adverse movements in foreign currency, commodity prices and interest rates), credit risk and liquidity risk. The Group uses a variety of derivative financial instruments to manage certain of these risks. The management of these risks, along with the day-to-day management of treasury activities is performed by the Group Treasury function. The policy framework governing the management of these risks is defined by the Board. The framework for management of these risks is incorporated into a policies and procedures manual.
The Group also enters into contracts with suppliers for its principal raw material requirements, some of which are considered commodities, diesel and energy. These commodity and energy contracts are part of the Group’s normal purchasing activities. Some of the risk relating to diesel is mitigated with the use of derivative financial instruments. The Treasury Risk Management Committee monitors and reviews the Group’s foreign currency exchange, commodity price and energy price exposures and recommends appropriate hedging strategies for each.
(a) Market riski) Foreign exchange riskThe Group’s main operating entities’ functional currency and the Group’s presentation currency is sterling although some transactions are executed in non-sterling currencies, including euros and US dollars. The transactional amounts realised or settled are therefore subject to the effect of movements in these currencies against sterling. Management of these exposures is centralised and managed by the Group’s Treasury Function. It is the Group’s policy to manage the exposures arising using forward foreign currency exchange contracts and currency options. Hedge accounting is not sought for these transactions.
The Group generates some of its profits in non-sterling currencies and has assets in non-sterling jurisdictions, principally the euro.
The principal foreign currency affecting the translation of subsidiary undertakings within the Group financial statements is the euro. The rates applicable are as follows:
Principal rate of exchange: euro/sterling 52 weeks ended
2 Apr 2016Period ended
4 Apr 2015
Period ended 1.2536 1.3678
Average 1.3584 1.2636
The majority of the Group’s assets and liabilities are denominated in the functional currency of the relevant division or subsidiary.
INTRODUCTION STRATEGIC REPORT GOVERNANCE FINANCIAL STATEMENTS 109

110
22. Financial instruments continuedThe table below shows the Group’s currency exposures as at 2 April 2016 and 4 April 2015 that gave rise to net currency gains and losses recognised in the consolidated statement of profit or loss as a result of monetary assets and liabilities that are not denominated in the functional currency of the subsidiaries involved.
Functional currency of subsidiaries
Sterling£m
As at 2 April 2016
Net foreign currency monetary assets:
– Euro (3.3)
– US dollar 0.1
Total (3.2)
As at 4 April 2015
Net foreign currency monetary assets:
– Euro (7.5)
– US dollar 0.1
Total (7.4)
In addition the Group also has forward foreign currency exchange contracts outstanding at the period end in order to manage the exposures above but also to hedge future transactions in foreign currencies. The sterling nominal amounts outstanding are as follows:
As at 2 Apr 2016
£m
As at 4 Apr 2015
£m
Euro (21.9) (26.8)
US dollar (0.6) (3.6)
Total (22.5) (30.4)
Sensitivities are disclosed below using the following reasonably possible scenarios:
If the US dollar were to weaken against sterling by 20 US dollar cents, with all other variables held constant, profit after tax would decrease by £nil (2014/15: £0.4m decrease).
If the US dollar were to strengthen against sterling by 20 US dollar cents, with all other variables held constant, profit after tax would increase by £0.1m (2014/15: £0.5m increase).
If the euro were to weaken against sterling by 10 euro cents, with all other variables held constant, profit after tax would decrease by £1.2m
2014/15: £1.0m decrease).
If the euro were to strengthen against sterling by 10 euro cents, with all other variables held constant, profit after tax would increase by £1.4m (2014/15: £1.1m increase).
This is primarily driven by the effect on the mark to market valuation of the foreign exchange derivatives of the Group where the hedged rates differ from the spot rate.
Notes to the financial statements
Premier Foods plc Annual report and accounts for the financial period ended 2 April 2016

22. Financial instruments continued(ii) Commodity price riskThe Group purchases a variety of commodities for use in production and distribution which can experience significant price volatility, which include, inter-alia, dairy, wheat, cocoa, edible oils, diesel and energy. The price risk on these commodities is managed by the Group through the Treasury Risk Management Committee. It is the Group’s policy to minimise its exposure to this volatility by adopting an appropriate forward purchase strategy or by the use of derivative instruments where they are available.
(iii) Interest rate riskThe Group’s borrowing facilities comprise senior secured notes and a revolving facility, principally in sterling. Interest is charged at floating rates plus a margin on the amounts drawn down, and at 40% for the non-utilised portion of the facility, hence the borrowings are sensitive to changes in interest rates.
The Group then seeks to mitigate the effect of adverse movements in interest rates by entering into derivative financial instruments that reduce the level of exposure to floating rates. The target of fixed/capped debt is defined in the Group Treasury policy and procedures, however, the amount hedged can be amended subject to agreement by the Board. Hedge accounting is not sought for these transactions.
The gross cash flows on the interest rate derivatives are sensitive to changes in interest rates as they are driven by three month LIBOR which is reset on a quarterly basis. As at 2 April 2016 the reset rate was 0.5875% (2014/15: 0.564%).
The weighted average interest rate for these derivative financial instruments is as follows:Weighted average interest rate
%
As at 2 April 2016 1.4
As at 4 April 2015 1.4
Fixed rate derivative financial liabilities constitute two (2014/15: two) floating to fixed interest rate swaps with a notional value of £50m each and a total notional value of £100m (2014/15: £150m). These mature in December 2017.
Cash and deposits earn interest at floating rates based on banks’ short-term treasury deposit rates. Short-term trade and other receivables are interest-free.
At 2 April 2016, for every 50 basis points reduction in rates below the last floating reset rate of 0.5875% (2014/15: 0.564%) (based on three month LIBOR) with all other variables held constant, annualised net interest expense would decrease by £0.5m (2014/15: £0.6m decrease).
INTRODUCTION STRATEGIC REPORT GOVERNANCE FINANCIAL STATEMENTS 111

112
22. Financial instruments continuedAt 2 April 2016, if interest rates were 200 basis points higher than the last floating reset rate of 0.5875% (2014/15: 0.564%) (based on three month LIBOR), with all other variables held constant, annualised net interest expense would increase by £2.1m (2014/15: £2.2m increase).
The Group’s other financial assets and liabilities are not exposed to material interest rate risk.
(b) Credit riskThe Group’s principal financial assets are cash and cash deposits and trade and other receivables.
Cash and cash equivalents are deposited with high-credit quality financial institutions and although a significant amount of sales are to a relatively small number of customers these are generally the major grocery retailers whose credit risk is considered low.
At 2 April 2016, trade and other receivables of £18.5m (2014/15: £16.0m) were past due but not impaired. These relate to customers with whom there is no history of default.
The ageing of trade and other receivables was as follows:
Past due
Fully performing
£m1-30 days
£m31-60 days
£m61-90 days
£m91-120 days
£m120+ days
£mTotal
£m
Trade and other receivables
As at 2 April 2016 65.1 7.6 3.4 3.0 1.1 3.4 83.6
As at 4 April 2015 89.7 1.6 7.2 – 3.0 4.2 105.7
At 2 April 2016, trade and other receivables of £19.8m (2014/15: £29.5m) were determined to be specifically impaired and provided for. The total includes receivables from customers which are considered to be experiencing difficult economic situations.
The Group does not hold any collateral as security against its financial assets.
Movements in the provision for impairment of trade receivables are as follows:2015/16
£m2014/15
£m
At 5 April 2015 / 1 January 2014 29.5 29.4
Receivables written off during the period as uncollectable (15.2) (13.0)
Acquisition of subsidiary 0.5 –
Provision for receivables impairment raised 5.0 13.1
As at 2 April 2016 / 4 April 2015 19.8 29.5
The Group cancelled its previous securitisation programme in January 2016 which allowed it to borrow against trade receivable balances.
(c) Liquidity riskThe Group manages liquidity risk through both the treasury and finance functions. Cash flow forecasts are prepared and reviewed on a weekly basis, normally covering a period of three months.
In addition, cash flow forecasts are prepared as part of the Group’s overall budgeting and forecasting processes and performance is monitored against this each month. This is intended to give the Board sufficient forward visibility of debt levels.
The Group’s net debt level can vary from month to month and there is some volatility within months. This reflects seasonal trading patterns, timing of receipts from customers and payments to suppliers, patterns of inventory holdings and the timing of the spend on major capital and restructuring projects. For these reasons the debt levels at the period end date may not be indicative of debt levels at other points throughout the period.
Notes to the financial statements
Premier Foods plc Annual report and accounts for the financial period ended 2 April 2016

22. Financial instruments continuedThe following table analyses the Group’s financial liabilities into relevant maturity groupings based on the contractual undiscounted cash flows.
Within 1 year£m
1 and 2 years£m
2 and 3 years£m
3 and 4 years£m
4 and 5 years£m
Over 5 years£m
Total£m
At 2 April 2016
Trade and other payables (199.9) – – – – – (199.9)
Bank overdraft (0.2) – – – – – (0.2)
Bank term loan - – (1.5) – – – (1.5)
Senior secured notes – fixed – – – – (325.0) – (325.0)
Senior secured notes – floating – – – (175.0) – – (175.0)
Secured senior credit facility – revolving – – (55.0) – – – (55.0)
Finance lease obligations (0.2) – – – – – (0.2)
Securitisation facility – - (6.4) – – – (6.4)
At 4 April 2015
Trade and other payables (207.5) – – – – – (207.5)
Bank overdraft (23.0) – – – – – (23.0)
Senior secured notes – fixed – – – – – (325.0) (325.0)
Senior secured notes – floating – – – – (175.0) – (175.0)
Secured senior credit facility – revolving – – – (113.0) – – (113.0)
Securitisation facility – (19.7) – – – – (19.7)
The senior secured notes – floating and secured senior credit facility – revolving are re-priced quarterly to LIBOR, and other liabilities are not re-priced before the maturity date.
At 2 April 2016 the Group had £201.8m (2014/15: £120.8m) of facilities not drawn expiring between two and three years (2014/15: three and four years).
The borrowings are secured by a fixed and floating charge over all the assets of the Group.
The following table analyses the contractual undiscounted cash flows of interest on the floating rate debt to maturity (based on the last fixed rate reset of 0.5875% (2014/15: 0.564%) plus applicable margin).
Within 1 year£m
1 and 2 years£m
2 and 3 years£m
3 and 4 years£m
4 and 5 years£m
Over 5 years£m
Total£m
At 2 April 2016 12.1 10.0 9.8 9.8 – – 41.7
At 4 April 2015 14.1 12.0 10.0 9.7 9.7 – 55.5
INTRODUCTION STRATEGIC REPORT GOVERNANCE FINANCIAL STATEMENTS 113
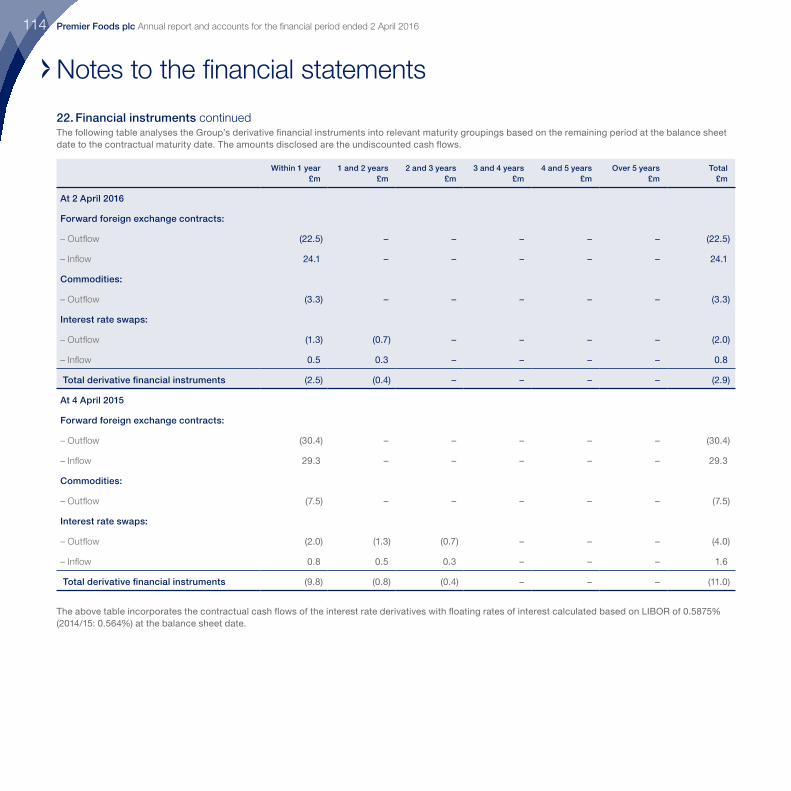
114
22. Financial instruments continuedThe following table analyses the Group’s derivative financial instruments into relevant maturity groupings based on the remaining period at the balance sheet date to the contractual maturity date. The amounts disclosed are the undiscounted cash flows.
Within 1 year£m
1 and 2 years£m
2 and 3 years£m
3 and 4 years£m
4 and 5 years£m
Over 5 years£m
Total£m
At 2 April 2016
Forward foreign exchange contracts:
– Outflow (22.5) – – – – – (22.5)
– Inflow 24.1 – – – – – 24.1
Commodities:
– Outflow (3.3) – – – – – (3.3)
Interest rate swaps:
– Outflow (1.3) (0.7) – – – – (2.0)
– Inflow 0.5 0.3 – – – – 0.8
Total derivative financial instruments (2.5) (0.4) – – – – (2.9)
At 4 April 2015
Forward foreign exchange contracts:
– Outflow (30.4) – – – – – (30.4)
– Inflow 29.3 – – – – – 29.3
Commodities:
– Outflow (7.5) – – – – – (7.5)
Interest rate swaps:
– Outflow (2.0) (1.3) (0.7) – – – (4.0)
– Inflow 0.8 0.5 0.3 – – – 1.6
Total derivative financial instruments (9.8) (0.8) (0.4) – – – (11.0)
The above table incorporates the contractual cash flows of the interest rate derivatives with floating rates of interest calculated based on LIBOR of 0.5875% (2014/15: 0.564%) at the balance sheet date.
Notes to the financial statements
Premier Foods plc Annual report and accounts for the financial period ended 2 April 2016

22. Financial instruments continued(d) Fair valueThe following table shows the carrying amounts (which approximate to fair value except as noted below) of the Group's financial assets and financial liabilities. Fair value is the price that would be received to sell an asset or paid to transfer a liability in an orderly transaction between market participants at the measurement date. Set out below is a summary of methods and assumptions used to value each category of financial instrument.
As at 2 Apr 2016 As at 4 Apr 2015
Carrying amount£m
Fair value£m
Carrying amount£m
Fair value£m
Loans and receivables:
Cash and cash equivalents 8.0 8.0 44.7 44.7
Trade and other receivables 83.6 83.6 105.7 105.7
Financial assets at fair value through profit or loss:
Derivative financial instruments
– Forward foreign currency exchange contracts 1.6 1.6 – –
Financial liabilities at fair value through profit or loss:
Derivative financial instruments
– Forward foreign currency exchange contracts – – (0.9) (0.9)
– Commodity and energy derivatives (1.0) (1.0) (1.1) (1.1)
– Interest rate swaps (1.0) (1.0) (1.7) (1.7)
Financial liabilities at amortised cost:
Trade and other payables (199.9) (199.9) (207.5) (207.5)
Senior secured notes (500.0) (511.7) (500.0) (497.9)
Senior secured credit facility – revolving (55.0) (55.0) (113.0) (113.0)
Bank term loan (1.5) (1.5) – –
Bank overdraft (0.2) (0.2) (23.0) (23.0)
Finance lease obligations (0.2) (0.2) – –
Securitisation facility (6.4) (6.4) (19.7) (19.7)
The following table presents the Group’s assets and liabilities that are measured at fair value using the following fair value measurement hierarchy:
• Quoted prices (unadjusted) in active markets for identical assets or liabilities (level 1).• Inputs other than quoted prices included within level 1 that are observable for the asset or liability, either directly (that is, as prices) or indirectly (that is,
derived from prices) (level 2).• Inputs for the asset or liability that are not based on observable market data (that is, unobservable inputs) (level 3).
INTRODUCTION STRATEGIC REPORT GOVERNANCE FINANCIAL STATEMENTS 115

116
22. Financial instruments continued
As at 2 Apr 2016 As at 4 Apr 2015
Level 1£m
Level 2£m
Level 1£m
Level 2£m
Financial assets at fair value through profit or loss:
Derivative financial instruments
– Forward foreign currency exchange contracts – 1.6 – –
Financial liabilities at fair value through profit or loss:
Derivative financial instruments
– Forward foreign currency exchange contracts – – – (0.9)
– Commodity derivatives – (1.0) – (1.1)
– Interest rate swaps – (1.0) – (1.7)
Financial liabilities at amortised cost:
Senior secured notes (511.7) – (497.9) –
Fair value estimationDerivativesForward exchange contracts are marked to market using prevailing market prices. Hedge accounting has not been applied to forward contracts and as a result the movement in the fair value of £2.5m has been credited to the statement of profit or loss in the period (2014/15: £0.8m credit).
Commodity derivatives are marked to market using prevailing prices and are also not designated for hedge accounting. As a result the fair value movement of £0.1m has been credited to the statement of profit or loss (2014/15: £1.4m charge).
Interest rate swaps are marked to market using prevailing market prices. Interest rate swaps are also not designated for hedge accounting. As a result the movement in the fair value of £0.7m has been credited to the statement of profit or loss in the period (2014/15: £1.2m charge).
Short and long-term borrowings, loan notes and interest payableFair value is calculated based on discounted expected future principal and interest rate cash flows. The fair value of the floating rate debt approximates the carrying value above.
Trade and other receivables/payablesThe carrying value of receivables/payables with a remaining life of less than one year is deemed to reflect the fair value given their short maturity. The fair values of non-current receivables/payables are also considered to be the same as the carrying value due to the size and nature of the balances involved.
(e) Capital risk managementThe Group’s objectives when managing capital are to safeguard the Group’s ability to continue as a going concern in order to provide returns for shareholders and benefits for other stakeholders and to maintain an optimal capital structure to reduce the cost of capital.
In order to maintain or adjust the capital structure, the Group may return capital to shareholders, issue new shares, or sell assets to reduce debt.
The directors do not recommend the payment of a dividend for the 52 weeks ended 2 April 2016 (2014/15: £nil).
Consistent with others in the industry, the Group monitors capital on the basis of the gearing ratio. This ratio is calculated as net debt divided by total capital. Net debt is calculated as total borrowings less cash and cash equivalents. Total capital is calculated as equity plus net debt.
Notes to the financial statements
Premier Foods plc Annual report and accounts for the financial period ended 2 April 2016

22. Financial instruments continuedThe gearing ratios at the balance sheet date were as follows:
As at 2 Apr 2016£m
As at 4 Apr 2015£m
Total borrowings (542.2) (629.6)
Less cash and cash equivalents 8.0 44.7
Net debt (534.2) (584.9)
Total equity (848.5) (540.2)
Total capital (1,382.7) (1,125.1)
Gearing ratio 39% 52%
The decrease in gearing in 2015/16 was primarily due to the deleveraging in the period and the increase in the RHM Pension Scheme surplus which increases total equity.
Under the Group’s financing arrangement, the Group is required to meet two covenant tests which are calculated and tested on a 12 month rolling basis at the half year and full year, each year. The Group has complied with these tests at 2 October 2015 and 2 April 2016.
(f) Financial compliance riskRiskThe Group continues to operate with a high level of net debt of £534.2m (2014/15: £584.9m) and is subject to operating within banking covenants set out in its re-financing agreement agreed with its bank syndicate, which include net debt/EBITDA and EBITDA/interest covenant tests. In the event these covenants are not met then the Group would be in breach of its financing agreement and, as would be the case in any covenant breach, the banking syndicate could withdraw their funding to the Group.
In addition to covenant compliance the Group must ensure that it manages its liquidity such that it has sufficient funds to meet its obligations as they fall due.
It also supports three defined benefit pension schemes in the UK; two of the three schemes have significant technical funding deficits which could have an adverse impact on the financial condition of the Group.
MitigationThe Group has financing arrangements which provide funding until 2021.
The Group reviews its performance on an ongoing basis and formally tests and reports on covenant compliance to the Group’s banking syndicate at each reporting date. In the event of a forecast covenant breach the Group would seek a covenant waiver or amendment from its banking syndicate.
The Group manages liquidity risk through both the Treasury and Finance functions. Cash flow forecasts are prepared and reviewed on a weekly basis, normally covering a period of three months. In addition, cash flow forecasts are prepared as part of the Group’s overall budgeting and forecasting processes and performance is monitored against this each month.
Funding agreements have been reached with the trustees of the pension schemes which fixes deficit contributions until 2019, subject to amendment in the event that the Company recommences payment of dividends. The Group continues to monitor the pension risks closely, working with the trustees to ensure a collaborative approach.
INTRODUCTION STRATEGIC REPORT GOVERNANCE FINANCIAL STATEMENTS 117

118
23. Provisions for liabilities and chargesRestructuring provisions at 2 April 2016 and 4 April 2015 primarily relate to provisions for non-operational leasehold properties. Other provisions at 2 April 2016 and 4 April 2015 primarily relate to insurance claims, dilapidations against leasehold properties and environmental liabilities. The costs relating to certain non-operational leasehold properties and dilapidation provisions will be incurred over a number of years in accordance with the length of the leases. These provisions have been discounted at rates between 0.61% and 2.32%. The unwinding of the discount is charged to the statement of profit or loss under interest payable.
Restructuring £m
Other£m
Total£m
At 1 January 2014 (30.7) (41.5) (72.2)
Utilised during the period 8.2 5.8 14.0
Additional charge in the period (1.6) (3.6) (5.2)
Unwind of discount (2.1) (0.5) (2.6)
Released during the period 2.5 3.3 5.8
Reclassifications (2.2) 2.2 –
At 4 April 2015 (25.9) (34.3) (60.2)
Utilised during the period 2.3 1.9 4.2
Additional charge in the period (4.1) (0.6) (4.7)
Unwind of discount (1.5) (0.1) (1.6)
Acquisition of subsidiary – (0.1) (0.1)
Released during the period 3.6 5.2 8.8
Reclassifications (0.8) 0.8 –
At 2 April 2016 (26.4) (27.2) (53.6)
Analysis of total provisions:As at
2 Apr 2016£m
As at 4 Apr 2015
£m
Non-current (47.3) (51.6)
Current (6.3) (8.6)
Total (53.6) (60.2)
Notes to the financial statements
Premier Foods plc Annual report and accounts for the financial period ended 2 April 2016

24. Retirement benefit schemesDefined benefit schemesThe Group operates a number of defined benefit schemes under which current and former employees have built up an entitlement to pension benefits on their retirement. These are as follows:
(a) The Premier schemes, which comprise:Premier Foods Pension Scheme ('PFPS') Premier Grocery Products Pension Scheme ('PGPPS') Premier Grocery Products Ireland Pension Scheme ('PGPIPS') Chivers 1987 Pension Scheme Chivers 1987 Supplementary Pension Scheme.
(b) The RHM schemes, which comprise:RHM Pension SchemePremier Foods Ireland Pension Scheme
The most recent triennial actuarial valuation of the PFPS, the PGPPS and RHM pension schemes was carried out on 31 March 2013 / 5 April 2013 to establish ongoing funding arrangements. Deficit recovery plans have been agreed with the Trustees of each of the schemes. The current triennial valuations as at 31 March 2016 / 2 April 2016 are ongoing but will not affect deficit recovery contributions until after 2019. Actuarial valuations for the schemes based in Ireland took place during the course of 2014. The Premier Foods Ireland pension scheme is a triennial scheme.
The exchange rates used to translate the overseas euro based schemes are £1.00 = €1.3584 for the average rate during the period, and £1.00 = €1.2536 for the closing position at 2 April 2016.
All defined benefit plans are held separately from the Company under Trusts. Trustees are appointed to operate the schemes in accordance with their respective governing documents and pensions law. The schemes meet the legal requirement for member nominated trustees representation on the trustee boards and the UK schemes have appointed a professional independent Trustee as Chair of the boards. The members of the trustee boards undertake regular training and development to ensure that they are equipped appropriately to fulfil their function as trustees. In addition each trustee board has appointed professional advisers to give them the specialist expertise they need to support them in the areas of investment, funding, legal, covenant and administration.
The trustee boards of the UK schemes generally meet at least four times a year to conduct their business. To support these meetings the Trustees have delegated certain aspects of the schemes’ operation to give specialist focus (e.g. investment, administration and compliance) to committees for which further meetings are held as appropriate throughout the year. These committees regularly report to the full trustee boards.
The schemes invest through investment managers appointed by the trustees in a broad range of assets including UK and Global equities and Corporate and Government bonds. The plan assets do not include any of the Group’s own financial instruments, nor any property occupied by, or other assets used by, the Group. The pension schemes hold a security over the assets of the Group which rank pari passu with the banks in the event of insolvency, up to a cap.
The main risks to which the Group is exposed in relation to the funded pension schemes are as follows:
• Liquidity risk – all schemes have significant technical funding deficits which could have an adverse impact on the financial condition of the Group. The current Schedule of Contributions in place following the 2013 actuarial valuations fixes the deficit contributions from 1 January 2014 until 31 December 2019. The Group continues to monitor the pension risks closely working with the trustees to ensure a collaborative approach.
• Mortality risk – the assumptions adopted make allowance for future improvements in life expectancy. However, if life expectancy improves at a faster rate than assumed, this would result in greater payments from the schemes and consequently increases in the schemes liabilities. The trustees review the mortality assumption on a regular basis to minimise the risk of using an inappropriate assumption.
• Yield risk – a fall in government bond yields will increase both the schemes assets and liabilities. However, the liabilities may grow by more in monetary terms, thus increasing the deficit in the scheme.
• Inflation risk – the majority of the schemes liabilities increase in line with inflation and so if inflation is greater than expected, the liabilities will increase.
The schemes can limit or hedge their exposure to the yield and inflation risks described above by investing in assets that move in the same direction as the liabilities in the event of a fall in yields, or a rise in inflation. The RHM pension scheme has fully hedged inflation exposure and largely hedged interest rate exposure to the extent of its funding level. The PFPS is increasing its hedging from 30% to 40% of its liabilities over the course of 2016 and has put in place a plan to further increase hedging over time as its funding level improves.
The liabilities of the schemes are approximately 47% in respect of former active members who have yet to retire and approximately 53% in respect of pensioner members already in receipt of benefits. The mean duration of the liabilities is approximately 19 years.
INTRODUCTION STRATEGIC REPORT GOVERNANCE FINANCIAL STATEMENTS 119

120
24. Retirement benefit schemes continuedAt the balance sheet date, the combined principal actuarial assumptions were as follows:
Premier
schemesRHM
schemes
At 2 April 2016
Discount rate 3.55% 3.55%
Inflation – RPI 3.00% 3.00%
Inflation – CPI 1.90% 1.90%
Expected salary increases n/a n/a
Future pension increases 2.00% 2.00%
At 4 April 2015
Discount rate 3.30% 3.30%
Inflation – RPI 3.00% 3.00%
Inflation – CPI 1.90% 1.90%
Expected salary increases n/a n/a
Future pension increases 2.00% 2.00%
For the smaller overseas schemes the discount rate used was 1.85% (2014/15: 1.40%) and future pension increases were 1.50% (2014/15: 1.50%).
The mortality assumptions are based on standard mortality tables and allow for future mortality improvements. The assumptions are as follows:
Premier
schemesRHM
schemes
Life expectancy at 2 April 2016
Male pensioner, currently aged 65 87.8 86.2
Female pensioner, currently aged 65 90.0 88.4
Male non-pensioner, currently aged 45 89.1 87.5
Female non-pensioner, currently aged 45 91.5 89.9
Life expectancy at 4 April 2015
Male pensioner, currently aged 65 87.8 86.4
Female pensioner, currently aged 65 90.1 88.6
Male non-pensioner, currently aged 45 89.2 87.7
Female non-pensioner, currently aged 45 91.6 90.1
A sensitivity analysis on the principal assumptions used to measure the scheme liabilities at the period end is as follows:
Change in assumption Impact on scheme liabilities
Discount rate Increase/decrease by 0.1% Decrease/increase by £69m/£71m
Inflation Increase/decrease by 0.1% Increase/decrease by £29m/£29m
Assumed life expectancy at age 60 (rate of mortality) Increase by 1 year Increase by £171m
Notes to the financial statements
Premier Foods plc Annual report and accounts for the financial period ended 2 April 2016

24. Retirement benefit schemes continuedThe sensitivity information has been derived using projected cash flows for the Schemes valued using the relevant assumptions and membership profile as at 2 April 2016. Extrapolation of these results beyond the sensitivity figures shown may not be appropriate.
The fair values of plan assets split by type of asset are as follows:Premier
schemes£m
% of total%
RHM schemes
£m% of total
%Total
£m% of total
%
Assets with a quoted price in an active market at 2 April 2016:
UK equities 1.4 0.2 0.5 0.0 1.9 0.1
Global equities 18.5 3.1 385.0 10.2 403.5 9.3
Government bonds 22.7 3.9 452.1 12.0 474.8 10.9
Corporate bonds – – 1.9 0.1 1.9 0.0
Property 8.2 1.4 284.1 7.6 292.3 6.7
Absolute return products 368.3 63.1 859.3 22.9 1,227.6 28.2
Cash 8.7 1.5 318.2 8.5 326.9 7.5
Other 156.1 26.7 2.5 0.1 158.6 3.7
Assets without a quoted price in an active market at 2 April 2016:
Infrastructure funds – – 228.0 6.1 228.0 5.2
Swaps – – 862.5 22.8 862.5 20.0
Private equity – – 259.4 6.9 259.4 6.0Other 0.3 0.1 105.2 2.8 105.5 2.4
Fair value of scheme assets as at 2 April 2016 584.2 100 3,758.7 100 4,342.9 100
Assets with a quoted price in an active market at 4 April 2015:
UK equities 0.9 0.1 51.7 1.4 52.6 1.2
Global equities 21.4 3.5 274.5 7.5 295.9 7.0
Government bonds 21.4 3.5 526.1 14.5 547.5 12.9
Corporate bonds 4.4 0.7 325.4 8.9 329.8 7.8
Property 7.5 1.3 252.5 7.0 260.0 6.1
Absolute return products 391.0 63.8 941.9 25.9 1,332.9 31.4
Cash 13.8 2.3 280.6 7.7 294.4 6.9
Other 152.1 24.8 – – 152.1 3.6
Assets without a quoted price in an active market at 4 April 2015:
Infrastructure funds – – 196.6 5.4 196.6 4.6
Swaps – – 430.0 11.9 430.0 10.1
Private equity – – 250.9 6.9 250.9 5.9Other – – 105.8 2.9 105.8 2.5
Fair value of scheme assets as at 4 April 2015 612.5 100 3,636.0 100 4,248.5 100
The RHM scheme invests directly in interest rate and inflation swaps to protect from fluctuations in interest rates and inflation.
INTRODUCTION STRATEGIC REPORT GOVERNANCE FINANCIAL STATEMENTS 121

122
24. Retirement benefit schemes continuedThe amounts recognised in the balance sheet arising from the Group’s obligations in respect of its defined benefit schemes are as follows:
Premier schemes
£m
RHM schemes
£mTotal
£m
At 2 April 2016
Present value of funded obligations (1,004.2) (3,207.8) (4,212.0)
Fair value of plan assets 584.2 3,758.7 4,342.9
(Deficit)/surplus in schemes (420.0) 550.9 130.9
At 4 April 2015
Present value of funded obligations (1,065.9) (3,394.4) (4,460.3)
Fair value of plan assets 612.5 3,636.0 4,248.5
(Deficit)/surplus in schemes (453.4) 241.6 (211.8)
The aggregate deficit of £211.8m has moved to a surplus of £130.9m in the current period. This movement of £342.7m (2014/15: £391.5m decrease) is primarily due to asset performance in the RHM schemes and the impact of an increase in the discount rate on the defined benefit obligations.
Changes in the present value of the defined benefit obligation were as follows:
Premier schemes
£m
RHM schemes
£mTotal
£m
Defined benefit obligation at 1 January 2014 (916.9) (2,904.8) (3,821.7)
Current service cost (0.1) – (0.1)
Interest cost (49.4) (156.5) (205.9)
Remeasurement losses (149.4) (521.5) (670.9)
Exchange differences 6.6 3.5 10.1
Benefits paid 43.3 184.9 228.2
Defined benefit obligation at 4 April 2015 (1,065.9) (3,394.4) (4,460.3)
Interest cost (33.7) (109.3) (143.0)
Remeasurement gains 63.0 162.2 225.2
Exchange differences (4.6) (2.5) (7.1)
Benefits paid 37.0 136.2 173.2
Defined benefit obligation at 2 April 2016 (1,004.2) (3,207.8) (4,212.0)
Notes to the financial statements
Premier Foods plc Annual report and accounts for the financial period ended 2 April 2016

24. Retirement benefit schemes continuedChanges in the fair value of plan assets were as follows:
Premier schemes
£m
RHM schemes
£mTotal
£m
Fair value of plan assets at 1 January 2014 531.4 2,687.0 3,218.4
Interest income on plan assets 28.5 145.4 173.9
Remeasurement gains 81.7 968.5 1,050.2
Administrative costs (7.8) (8.1) (15.9)
Contributions by employer 28.2 31.1 59.3
Exchange differences (6.2) (3.0) (9.2)
Benefits paid (43.3) (184.9) (228.2)
Fair value of plan assets at 4 April 2015 612.5 3,636.0 4,248.5
Interest income on plan assets 18.7 117.4 136.1
Remeasurement (losses)/gains (19.4) 139.0 119.6
Administrative costs (2.6) (5.0) (7.6)
Contributions by employer 7.6 5.3 12.9
Exchange differences 4.4 2.2 6.6
Benefits paid (37.0) (136.2) (173.2)
Fair value of plan assets at 2 April 2016 584.2 3,758.7 4,342.9
The reconciliation of the net defined benefit (deficit)/surplus over the period is as follows:
Premier schemes
£m
RHM schemes
£mTotal
£m
Deficit in schemes at 1 January 2014 (385.5) (217.8) (603.3)
Amount recognised in profit or loss (28.8) (19.2) (48.0)
Remeasurements recognised in other comprehensive income (67.7) 447.0 379.3
Contributions by employer 28.2 31.1 59.3
Exchange rate gains 0.4 0.5 0.9
(Deficit)/surplus in schemes at 4 April 2015 (453.4) 241.6 (211.8)
Amount recognised in profit or loss (17.6) 3.1 (14.5)
Remeasurements recognised in other comprehensive income 43.6 301.2 344.8
Contributions by employer 7.6 5.3 12.9
Exchange rate losses (0.2) (0.3) (0.5)
(Deficit)/surplus in schemes at 2 April 2016 (420.0) 550.9 130.9
INTRODUCTION STRATEGIC REPORT GOVERNANCE FINANCIAL STATEMENTS 123

124
24. Retirement benefit schemes continuedRemeasurements recognised in the consolidated statement of comprehensive income are as follows:
Premier schemes
£m
RHM schemes
£mTotal
£m
2015/16
Remeasurement gain on plan liabilities 63.0 162.2 225.2
Remeasurement (loss)/gain on plan assets (19.4) 139.0 119.6
Net remeasurement gain for the period 43.6 301.2 344.8
2014/15
Remeasurement loss on plan liabilities (149.4) (521.5) (670.9)
Remeasurement gain on plan assets 81.7 968.5 1,050.2
Net remeasurement (loss)/gain for the period (67.7) 447.0 379.3
The actual return on plan assets was a £255.7m gain (2014/15: £1,224.1m gain), which is £119.6m more (2014/15: £1,050.2m more) than the interest income on plan assets of £136.1m (2014/15: £173.9m) at the start of the relevant periods.
The remeasurement gain on liabilities of £225.2m (2014/15: £670.9m loss) comprises a gain due to member experience of £15.5m (2014/15: £1.8m gain), a gain due to demographic assumptions of £49.8m (2014/15: £5.3m gain) and a gain due to changes in financial assumptions of £159.9m (2014/15: £678.0m loss).
The net remeasurement gain taken to the consolidated statement of comprehensive income was £344.8m (2014/15: £379.3m gain). This gain was £278.9m (2014/15: £303.4m gain) net of taxation (with tax at 18% for UK schemes, and 12.5% for Irish schemes).
The Group expects to contribute approximately £8-10m to its defined benefit plans in 2016/17 in relation to expenses and government levies and £48m of additional contributions to fund the scheme deficits.
The Group has an unconditional right to a refund of any surplus in the RHM Pension Scheme and so the asset has not been restricted and no additional liability has been recognised.
Notes to the financial statements
Premier Foods plc Annual report and accounts for the financial period ended 2 April 2016
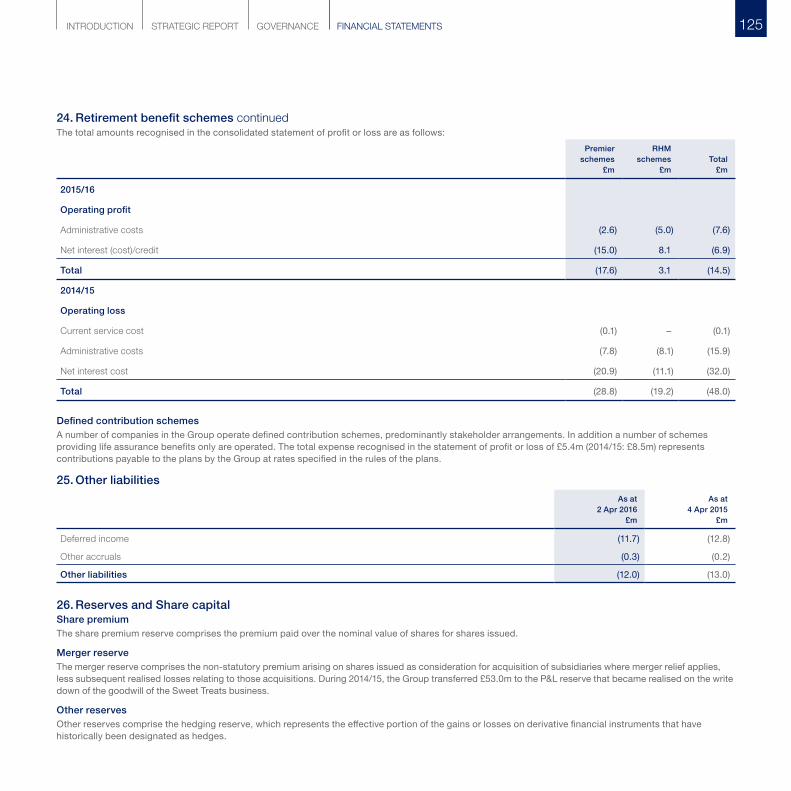
24. Retirement benefit schemes continuedThe total amounts recognised in the consolidated statement of profit or loss are as follows:
Premier schemes
£m
RHM schemes
£mTotal
£m
2015/16
Operating profit
Administrative costs (2.6) (5.0) (7.6)
Net interest (cost)/credit (15.0) 8.1 (6.9)
Total (17.6) 3.1 (14.5)
2014/15
Operating loss
Current service cost (0.1) – (0.1)
Administrative costs (7.8) (8.1) (15.9)
Net interest cost (20.9) (11.1) (32.0)
Total (28.8) (19.2) (48.0)
Defined contribution schemesA number of companies in the Group operate defined contribution schemes, predominantly stakeholder arrangements. In addition a number of schemes providing life assurance benefits only are operated. The total expense recognised in the statement of profit or loss of £5.4m (2014/15: £8.5m) represents contributions payable to the plans by the Group at rates specified in the rules of the plans.
25. Other liabilitiesAs at
2 Apr 2016£m
As at 4 Apr 2015
£m
Deferred income (11.7) (12.8)
Other accruals (0.3) (0.2)
Other liabilities (12.0) (13.0)
26. Reserves and Share capitalShare premiumThe share premium reserve comprises the premium paid over the nominal value of shares for shares issued.
Merger reserveThe merger reserve comprises the non-statutory premium arising on shares issued as consideration for acquisition of subsidiaries where merger relief applies, less subsequent realised losses relating to those acquisitions. During 2014/15, the Group transferred £53.0m to the P&L reserve that became realised on the write down of the goodwill of the Sweet Treats business.
Other reservesOther reserves comprise the hedging reserve, which represents the effective portion of the gains or losses on derivative financial instruments that have historically been designated as hedges.
INTRODUCTION STRATEGIC REPORT GOVERNANCE FINANCIAL STATEMENTS 125

126
26. Reserves and Share capital continuedProfit and loss reserveThe profit and loss reserve represents the cumulative surplus or deficit and the own shares reserve which represents the cost of shares in Premier Foods plc, purchased in the market and held by the Employee Benefit Trust on behalf of the Company in order to satisfy options and awards under the Company’s incentive schemes. 34,336 shares in Premier Foods plc were held by the Employee Benefit Trust at 2 April 2016, with a market value of £19,486 (2014/15: 12,286 shares with a market value of £5,129).
Share capital
Number of shares
Ordinary shares£m
Share premium£m
Total£m
At 1 January 2014 239,828,166 24.0 1,124.7 1,148.7
Shares issued under share schemes 2,154,468 0.2 – 0.2
Share placement 76,923,077 7.7 92.3 100.0
Rights issue 506,835,545 50.7 202.7 253.4
Cost of shares issued – – (13.3) (13.3)
At 4 April 2015 825,741,256 82.6 1,406.4 1,489.0
Shares issued under share schemes 825,807 0.1 0.2 0.3
At 2 April 2016 826,567,063 82.7 1,406.6 1,489.3
Share award schemesThe Company’s share award schemes are summarised as follows:
1. A CEO Co-Investment Award ('CEO Co-Investment Award'). The scheme is structured as a share matching plan and was specifically created to facilitate the recruitment of Gavin Darby as CEO in 2013. Gavin Darby is required to commit and retain a significant amount of capital in the form of Premier Foods shares. These awards are equity-settled and the outstanding award will vest on 1 May 2016. No further awards will be made under this plan.
2. A Long Term Incentive Plan ('LTIP') for executive directors and senior managers, approved by shareholders in 2011. The LTIP comprises two elements; performance shares and matching shares.
For Performance Shares, participants have the right to subscribe for ordinary shares at nil cost. These awards are equity-settled and have a maximum term of three years. There are no matching awards outstanding at 2 April 2016.
The vesting of the 2013, 2014 and 2015 Performance Share awards are conditional on achievement of a combination of absolute adjusted earnings per share targets and average share price targets.
3. A Restricted Stock Plan ('RSP') which provides specific ad hoc share awards to managers. Awards are normally subject only to continued employment. These awards may be equity-settled or cash-settled and normally have a retention term of two to three years for senior management.
4. A Share Incentive Plan ('SIP') for all employees. Employees can be granted free shares and matching shares by the Company under this HMRC tax-advantaged plan. An employee must enter into a savings and share purchase agreement for partnership shares before the Company can grant matching shares, up to a ratio of 2:1. Free or Matching shares are held by a trustee for a minimum of three years. Subject to continuing employment, participants may elect to remove shares from the trust after this three year holding period, however, there are tax and National Insurance advantages for the employee should the shares be left in the trust for over five years. To date the Company has only made Free Shares available to employees.
Given the share based payment charge is not material in the current 52 week period or the prior period, details of the individual share awards have not been disclosed.
Notes to the financial statements
Premier Foods plc Annual report and accounts for the financial period ended 2 April 2016

27. Notes to the cash flow statementReconciliation of loss before tax to cash flows from operating activities
52 weeks ended 2 Apr 2016
£m
Period ended 4 Apr 2015
£m
Continuing operations
Loss before taxation (13.0) (135.6)
Net finance cost 44.9 81.9
Share of loss from associates 22.6 9.6
Operating profit/(loss) 54.5 (44.1)
Depreciation of property, plant and equipment 16.1 18.5
Amortisation of intangible assets 37.6 47.6
Loss on disposal of businesses – 6.0
Loss on disposal of non-current assets 1.8 2.5
Impairment of property, plant and equipment – 16.0
Impairment of investments in associates 13.6 –
Impairment of goodwill – 67.9
Fair value movements on foreign exchange and other derivative contracts (2.6) 0.6
Equity settled employee incentive schemes 4.1 3.4
Decrease/(Increase) in inventories 12.7 (11.2)
Decrease in trade and other receivables 26.2 23.6
Decrease in trade and other payables and provisions (24.8) (53.4)
Movement in retirement benefit obligations 1.6 (7.1)
Cash generated from continuing operations 140.8 70.3
Discontinued operations (3.7) (7.8)
Cash generated from operating activities 137.1 62.5
INTRODUCTION STRATEGIC REPORT GOVERNANCE FINANCIAL STATEMENTS 127

128
27. Notes to the cash flow statement continuedReconciliation of cash and cash equivalents to net borrowings
52 weeks ended 2 Apr 2016
£m
Period ended 4 Apr 2015
£m
Net outflow of cash and cash equivalents (13.9) (135.3)
Increase in finance leases (0.2) –
Decrease in borrowings 69.8 401.7
Other non-cash movements (5.0) (20.5)
Decrease in borrowings net of cash 50.7 245.9
Total net borrowings at beginning of period (584.9) (830.8)
Total net borrowings at end of period (534.2) (584.9)
Analysis of movement in borrowings
As at 4 Apr 2015£m
Cash flows£m
Cash flows on acquisition
£m
Other non-cash movements
£m
As at 2 Apr 2016
£m
Bank overdrafts (23.0) 23.0 (0.2) – (0.2)
Cash and bank deposits 44.7 (36.7) – – 8.0
Net cash and cash equivalents 21.7 (13.7) (0.2) – 7.8
Borrowings – term facilities – – (1.5) – (1.5)
Borrowings – revolving credit facilities (113.0) 58.0 – – (55.0)
Borrowings – senior secured notes (500.0) – – – (500.0)
Finance lease obligations – – (0.2) – (0.2)
Securitisation facility (19.7) 19.7 (6.4) – (6.4)
Gross borrowings net of cash1 (611.0) 64.0 (8.3) – (555.3)
Debt issuance costs 26.1 – – (5.0) 21.1
Total net borrowings1 (584.9) 64.0 (8.3) (5.0) (534.2)
1 Borrowings exclude derivative financial instruments.
The Group has the following cash pooling arrangements in sterling, euros and US dollars, where both the Group and the bank have a legal right of offset.
As at 2 Apr 2016 As at 4 Apr 2015
Offset asset Offset liability Net offset asset Offset asset Offset liability Net offset asset
Cash, cash equivalents and bank overdrafts 134.7 (126.9) 7.8 149.6 (127.9) 21.7
Notes to the financial statements
Premier Foods plc Annual report and accounts for the financial period ended 2 April 2016

28. Operating lease commitmentsThe Group has lease agreements in respect of property, plant and equipment, for which future minimum payments extend over a number of years.
Leases primarily relate to the Group’s properties, which principally comprise offices and factories. Lease payments are typically subject to market review every five years to reflect market rentals, but because of the uncertainty over the amount of any future changes, such changes have not been reflected in the table below. Within our leasing arrangements there are no significant contingent rentals, renewal, purchase or escalation clauses.
The future aggregate minimum lease payments under non-cancellable operating leases for continuing operations are as follows:
As at 2 Apr 2016 As at 4 Apr 2015
Property£m
Plant and Equipment£m
Property£m
Plant and Equipment£m
Within one year 2.7 2.5 4.9 1.7
Between 2 and 5 years 5.5 4.0 10.2 4.0
After 5 years 4.8 – 4.5 –
Total 13.0 6.5 19.6 5.7
The Group has made provision for the aggregate minimum lease payments under non-cancellable operating leases for discontinued operations, as described in note 23.
The Group sub-lets various properties under non-cancellable lease arrangements. Sub-lease receipts of £0.7m (2014/15: £1.7m) were recognised in the statement of profit or loss during the period. The total future minimum sub-lease payments at the period end is £0.8m (2014/15: £0.7m).
29. Capital commitmentsCapital expenditure for continuing operations contracted for at the end of the reporting period but not yet incurred is as follows:
As at 4 Apr 2016
£m
As at 4 Apr 2015
£m
Intangible assets – 0.1
Property, plant and equipment 1.3 8.6
Total capital commitments 1.3 8.7
30. ContingenciesThere were no material contingent liabilities at 2 April 2016 (2014/15: none). Other contingencies and guarantees in respect of the Parent Company are described in note 9 of the Parent Company financial statements.
31. Related party transactionsThe following transactions were carried out with related parties:
(a) Key management compensationKey management personnel of the Group are considered to be the executive and non-executive directors and the Executive Leadership Team. Details of their remuneration are set out below in aggregate for each of the categories specified in IAS 24 Related Party Disclosures. Further information about the remuneration of individual directors is provided in the audited section of the directors Remuneration Report on pages 50 to 66.
INTRODUCTION STRATEGIC REPORT GOVERNANCE FINANCIAL STATEMENTS 129

130
31. Related party transactions continued52 weeks ended
2 Apr 2016£m
Period ended 4 Apr 2015
£m
Short-term employee benefits 5.6 6.3
Post employment benefits 0.1 0.1
Share-based payments 1.5 3.2
Total 7.2 9.6
(b) Transactions with associatesThe Group’s associates are considered to be related parties. Transactions relating to Knighton are those up to the date of consolidation. Transactions with associates are set out below:
52 weeks ended 2 Apr 2016
£m
Period ended 4 Apr 2015
£m
Sale of goods:
– Hovis 0.4 0.3
Sale of services:
– Hovis 0.8 4.9
– Knighton – 0.8
Total sales 1.2 6.0
Purchase of goods:
– Hovis 12.5 11.2
– Knighton 18.2 20.6
Total purchases 30.7 31.8
(c) Loans to associatesAll investments in associates which included any loans were written off in the year.
(d) Other related partiesAs at 2 April 2016 the following are considered to be related parties under the Listing Rules due to their shareholdings exceeding 10% of the Group’s total issued share capital:
• Nissin Foods Holdings Co., Ltd. ('Nissin') is considered to be a related party to the Group by virtue of its 19.9% (2014/15: 0%) equity shareholding in the Premier Foods plc and of its power to appoint a member to the Board of directors. There have been no transactions with Nissin during the period.
32. Subsequent eventsOn 22 April 2016, a Relationship agreement was entered into with Nissin Foods Holdings Co., Ltd. ('Nissin') on terms and conditions that are customary for a substantial shareholding of this nature. Nissin will have right to appoint a non-executive director to the Board of Premier Foods plc.
Notes to the financial statements
Premier Foods plc Annual report and accounts for the financial period ended 2 April 2016

The following statements reflect the financial position of the Company, Premier Foods plc as at 2 April 2016 and 4 April 2015. These financial statements were prepared in accordance with Financial Reporting Standard 101 Reduced Disclosure Framework (FRS 101) and the UK Companies Act 2006. The directors have taken advantage of the exemption available under section 408 of the Companies Act 2006 and not presented a Company profit and loss account.
Balance sheet
Note
As at 2 Apr 2016
£m
As at 4 Apr 2015
£m
Fixed assets
Investments in Group undertakings 3 6.5 3.1
Current assets
Debtors 4 1,261.4 1,016.7
Deferred tax assets 6 2.0 1.8
Cash at bank and in hand 0.7 0.5
Total assets 1,270.6 1,022.1
Creditors: amounts falling due within one year 5 (314.3) (85.2)
Net current assets 949.8 933.8
Total assets less current liabilities 956.3 936.9
Capital and reserves
Called up share capital 7 82.7 82.6
Share premium account 1,406.6 1,406.4
Profit and loss account (533.0) (552.1)
Total shareholders' funds 956.3 936.9
The financial statements on pages 131 to 136 were approved by the Board of directors on 16 May 2016 and signed on its behalf by:
Gavin Darby Alastair Murray
Chief Executive Officer Chief Financial Officer
Company financial statements
INTRODUCTION STRATEGIC REPORT GOVERNANCE FINANCIAL STATEMENTS 131

132
Called up share capital
£m
Share premium account
£m
Profit and loss account
£mTotal
£m
At 1 January 2014 24.0 1,124.7 (565.8) 582.9
Profit for the period – – 9.4 9.4
Share-based payments – – 4.3 4.3
Shares issued 58.6 295.0 – 353.6
Cost of shares issued – (13.3) – (13.3)
At 4 April 2015 82.6 1,406.4 (552.1) 936.9
Profit for the period – – 15.0 15.0
Share-based payments – – 4.1 4.1
Shares issued 0.1 0.2 – 0.3
At 2 April 2016 82.7 1,406.6 (533.0) 956.3
Statement of Changes in Equity
Premier Foods plc Annual report and accounts for the financial period ended 2 April 2016

1. Accounting policiesBasis of preparation These financial statements were prepared in accordance with Financial Reporting Standard 101 Reduced Disclosure Framework ('FRS 101').
In preparing these financial statements, the Company applies the recognition, measurement and disclosure requirements of International Financial Reporting Standards as adopted by the EU ('Adopted IFRSs'), but makes amendments where necessary in order to comply with Companies Act 2006 and where advantage of certain disclosure exemptions available under FRS 101 have been taken, as the Group financial statements contains equivalent disclosures. Disclosure exemptions are as follows:
• Cash flow statements and related notes;• Presentation of comparative period reconciliations;• Share based payments;• Financial instruments and capital management;• Standards not yet effective;• Disclosures in respect of compensation of key management personnel.
The directors have taken advantage of the exemption available under section 408 of the Companies Act 2006 and not presented a profit and loss account for the Company. The profit for the period of £15.0m (2014/15: £9.4m profit) is recorded in the accounts of Premier Foods plc.
In the transition from UK Generally Accepted Accounting Principles to FRS 101, the Company has applied IFRS 1 First-time Adoption of International Financial Reporting Standards, whilst ensuring that its assets and liabilities are measured in compliance with FRS 101. There were no material measurement or recognition adjustments to previously reported amounts as a result of applying FRS 101. The financial statements have been prepared under the historical cost convention.
The preparation of the financial statements requires the directors to make estimates and assumptions that affect the reported amounts of revenues, expenses, assets and liabilities, and the disclosure of contingent liabilities at the date of the financial statements. The key estimates and assumptions are set out in the accounting policies below, together with the related notes to the accounts.
The directors consider that the accounting policies set out below are the most appropriate and have been consistently applied.
The Company is exempt as permitted under Financial Reporting Standard 101 from disclosing related party transactions with entities that are wholly owned subsidiaries of the Premier Foods plc Group.
Fixed asset investmentsInvestments held as fixed assets are stated at cost less any provision for impairment in their value.
TaxationTax on the profit or loss for the period comprises current and deferred tax. Tax is recognised in the profit and loss account except to the extent that it relates to items recognised directly in equity or other comprehensive income, in which case it is recognised directly in equity or other comprehensive income.
Current tax is the expected tax payable or receivable on the taxable income or loss for the period, using tax rates enacted or substantively enacted at the balance sheet date, and any adjustment to tax payable in respect of previous periods.
Deferred tax is provided on temporary differences between the carrying amounts of assets and liabilities for financial reporting purposes and the amounts used for taxation purposes. The amount of deferred tax provided is based on the expected manner of realisation or settlement of the carrying amount of assets and liabilities, using tax rates enacted or substantively enacted at the balance sheet date.
A deferred tax asset is recognised only to the extent that it is probable that future taxable profits will be available against which the temporary difference can be utilised.
Cash and liquid resourcesShort-term cash deposits, which can be called on demand without any material penalty, are included within cash balances in the balance sheet.
Notes to the Company financial statements
INTRODUCTION STRATEGIC REPORT GOVERNANCE FINANCIAL STATEMENTS 133

134
Notes to the Company financial statements
1. Accounting policies continuedShare based paymentsThe Company operates a number of equity-settled and cash-settled share-based compensation plans. The fair value of employee share option plans is calculated using an option valuation model, taking into account the terms and conditions upon which the awards were granted. In accordance with International Financial Reporting Standard 2, Share-Based Payment ('IFRS 2'), the resulting expense is charged to the profit and loss account over the vesting period of the options for employees employed by the Parent Company, or treated as an investment in subsidiaries in respect of employees employed by the subsidiaries where the expense is recharged. The value of the charge is adjusted to reflect expected and actual levels of options vesting.
The total amount to be expensed over the vesting period is determined by reference to the fair value of the share awards/options granted, excluding the impact of any non-market vesting conditions (for example, profitability and sales growth targets). Non-market vesting conditions are included in assumptions about the number of share awards/options that are expected to vest. At each balance sheet date, the Group revises its estimates of the number of share awards/options that are expected to vest and recognises the impact of the revision to original estimates, if any, in profit and loss, with a corresponding adjustment to equity.
DividendsDividend distributions to the Company shareholders is recognised as a liability in the Company’s financial statements in the period in which the dividends are approved by the Company’s shareholders, and for interim dividends in the period in which they are paid.
Operating lease agreementsLeases in which a significant portion of risks and rewards of ownership are retained by the lessor are classified as operating leases. Rental costs under operating leases, net of any incentives received from the lessor, are charged to the profit and loss account on a straight-line basis over the lease period.
Financial guaranteesWhere the Company enters into financial guarantee contracts to guarantee the indebtedness of other companies within its group, the company considers these to be insurance arrangements and accounts for them as such. In this respect, the company treats the guarantee contract as a contingent liability until such time as it becomes probable that the company will be required to make a payment under the guarantee.
2. Operating profitAudit fees in respect of the Company are £nil (2014/15: £nil). Note 5.2 of the Group consolidated financial statements provides details of the remuneration of the Company's auditors on a Group basis.
At 2 April 2016, the Company had two employees (2014/15: two). Directors' emolument disclosures are provided in the Single Figure Table on page 52 of this annual report.
3. Investments in Group undertakings2015/16
£m2014/15
£m
Cost
At 5 April 2015 / 1 January 2014 1,762.4 1,759.3
Additions 3.4 3.1
At 2 April 2016 / 4 April 2015 1,765.8 1,762.4
Accumulated impairment
At 5 April 2015 / 1 January 2014 (1,759.3) (1,759.3)
At 2 April 2016 / 4 April 2015 (1,759.3) (1,759.3)
NBV at 2 April 2016 / 4 April 2015 6.5 3.1
In 2015/16 a capital contribution of £3.4m (2014/15: £3.1m) was given in the form of share incentive awards to employees of subsidiary companies which were reflected as an increase in investments. Refer to note 16 in the Group financial statements for a full list of the undertakings.
Premier Foods plc Annual report and accounts for the financial period ended 2 April 2016

4. Debtors
As at2 Apr 2016
£m
As at4 Apr 2015
£m
Amounts owed by Group undertakings 1,261.4 1,016.7
Amounts owed by Group undertakings are unsecured, have no fixed date of repayment, are repayable on demand and are not subject to interest rate risk as they are interest free, with the exception of £361.9m (2014/15: £344.7m) which attracted interest at a rate of LIBOR plus 4.0% (2014/15: LIBOR plus 3.75%). Carrying value approximates fair value.
5. Creditors: amounts falling due within one year
As at2 Apr 2016
£m
As at4 Apr 2015
£m
Amounts owed to Group undertakings (294.3) (65.2)
Group relief payable (20.0) (20.0)
Total creditors falling due within one year (314.3) (85.2)
Amounts owed to Group undertakings are unsecured, have no fixed date of repayment, are repayable on demand and are not subject to interest rate risk as they are interest free, with the exception of £28.3m (2014/15: £27.0m) which attracted interest at a rate of LIBOR plus 4% (2014/15: LIBOR plus 3.75%). Carrying value approximates fair value.
6. Deferred Tax2015/16
£m2014/15
£m
At 5 April 2015 / 1 January 2014 1.8 1.1
Credited to the profit and loss account 0.2 0.7
At 2 April 2016 / 4 April 2015 2.0 1.8
The deferred tax asset relates to share-based payments.
7. Called up share capital and other reserves(a) Called up share capital
As at2 Apr 2016
£m
As at4 Apr 2015
£m
Issued and fully paid
826,567,063 (2014/15: 825,741,256) ordinary shares of 10 pence each 82.7 82.6
(b) Share-based paymentsThe costs reflect the Company’s share option schemes in operation. Further details are available in note 26 of the Group’s consolidated financial statements.
The charge relating to employees of the Company amounted to £0.7m (2014/15: £1.5m). Further details of these schemes can be found in the directors Remuneration Report on page 50 to 56.
INTRODUCTION STRATEGIC REPORT GOVERNANCE FINANCIAL STATEMENTS 135

136
Notes to the Company financial statements
8. Operating lease commitmentsThe Company has total future minimum lease payments under non-cancellable operating leases in respect of land and buildings as follows:
As at2 Apr 2016
£m
As at4 Apr 2015
£m
Within one year 0.7 0.7
Between 2 and 5 years 1.0 1.7
After 5 years – –
Total operating lease commitments 1.7 2.4
The lease expense has been borne by a subsidiary company. The restatement of prior period balances reflects the adoption of new standards under FRS 101.
9. Contingencies and guaranteesPremier Foods plc has provided guarantees to third parties in respect of borrowings of certain subsidiary undertakings. The maximum amount guaranteed at 2 April 2016 is £0.8bn (2014/15: £0.9bn).
10. Subsequent eventsThere were no subsequent events.
11. FRS 101 Reduced Disclosure FrameworkThe Financial Reporting Council has issued FRS 100 Application of Financial Reporting Requirements, FRS 101 Reduced Disclosure Framework and FRS 102 The Financial Reporting Standard applicable in the UK and Ireland. These standards are applicable to all companies and entities in the UK and Republic of Ireland, other than listed groups which continue to report under IFRS, for accounting periods beginning on or after 1 January 2015.
FRS 100 sets out the overall financial reporting framework for companies in the UK and Ireland. FRS 101 applies to the individual financial statements of subsidiaries and ultimate parents, allowing them to apply the same accounting policies as in their listed group accounts, but with fewer disclosures. FRS 102 is a single financial reporting standard that applies to the financial statements of entities that are not applying IFRS, FRS 101 or the FRSSE. The primary statements of entities applying FRS 101 or FRS 102 would continue to follow the requirements of the Companies Act 2006.
The Company has adopted the accounting requirements of the reduced disclosure framework under FRS 101 in these financial statements, with a transition date of 1 January 2014. Given that the Company previously applied the fair value provisions of historic UK GAAP, the adoption of FRS 101 had no material impact to previously reported amounts in profit or equity.
The Company’s financial statements still meet the requirements of the Companies Act 2006 including giving a true and fair view of the Company’s assets, liabilities, financial position and profit or loss. This means the Company will therefore always be required to include in its accounts all information relevant to shareholders and necessary to show a true and fair view.
The Company is required to inform its shareholders and to provide a reasonable opportunity for its shareholders to object to the use of disclosure exemptions available under FRS 101. A shareholder or shareholders holding in aggregate 5% or more of the total allotted shares in Premier Foods plc Group may object to the Company applying the FRS 101 Reduced Disclosure Framework to its individual financial statements. No objections were received by the notification date of 24 March 2016.
In relation to the 52 weeks ending 1 April 2017, should shareholders have any objections to the use of disclosure exemptions available under FRS 101, these should be received in writing by 30 September 2016.
Premier Foods plc Annual report and accounts for the financial period ended 2 April 2016

Manage your shares The Company’s Register of Members is maintained by our registrar, Equiniti. Shareholders with queries relating to their shareholding should contact Equiniti directly using the details given below:
Equiniti, Aspect House, Spencer Road, Lancing, BN99 6DA.
Telephone – 0371 384 2030 (or +44 121 415 7047 if calling from outside the UK).
Calls to this number are charged at a national rate. Lines are open 8.30 am to 5.30 pm Monday to Friday, excluding UK public holidays.
Or visit Equiniti’s Shareview website:www.shareview.co.uk
TrademarksThe Company’s trademarks are shown in italics throughout this annual report. The Company has an exclusive worldwide licence to use the Loyd Grossman name on certain products and an exclusive worldwide licence to use the Paul Hollywood name on certain products. The Company has an exclusive licence to use the Cadbury trademark in the UK (and other specified territories) on a variety of ambient cake products. Cadbury is a trademark of Mondelez International, Inc.
Cautionary StatementThe purpose of this annual report is to provide information to shareholders of Premier Foods plc ('the Company'). The Company, its directors, employees and advisers do not accept or assume responsibility to any other person to whom this document is shown or into whose hands it may come and any such responsibility or liability is expressly disclaimed. It contains certain forward-looking statements with respect to the financial condition, results, operations and businesses of the Company. These statements and forecasts involve risk and uncertainty because they relate to events and depend upon circumstances that will occur in the future. There are a number of factors that could cause actual results or developments to differ materially from those expressed or implied by these forward-looking statements and forecasts. Nothing in this annual report should be construed as a profit forecast.

Premier Foods plc
Premier HouseCentrium Business ParkGriffiths WaySt AlbansHertfordshireAL1 2RE
T: 01727 815850
Registered in England and Wales No. 5160050
www.premierfoods.co.uk
Prem
ier Foo
ds p
lc Annual rep
ort fo
r the 52 week p
eriod
ended
2 Ap
ril 2016
ANNUAL REPORT 2015/16
Investing in success