premier’s collaborative research program (2005- 2008)
TRANSCRIPT

Premier’s Collaborative Research Program (2005-2008)
Characterising Treated Wastewater For Drinking Purposes Following Reverse Osmosis Treatment
Technical Report

Project Partners
Organisation Authors/Representatives
Department of Health
Paul Van Buynder, Richard Lugg, Clemencia Rodriguez
Department of Water
Melissa Bromly
Department of Environment & Conservation
Jane Filmer
Water Corporation
Palenque Blair, Mark Handyside, Simon Higginson, Nick Turner
National Measurement Institute
Oana Lord
Chem Centre
Peter Taylor, Karyn Courtney, Clare Newby
Curtin Water Quality Research Centre
Anna Heitz, Kathryn Linge, Justin Blythe, Francesco Busetti
University of Western Australia
Clemencia Rodriguez
CSIRO Water for a Healthy Country
Simon Toze, Simon Higginson

Approved for final release:
Date: 23 November 2009
Project Director Dr Richard Lugg
Organisation Department of Health
Published by Department of Health, Western Australia
Copyright © 2009 Department of Health, Western Australia
ISBN 978-0-9807477-0-6

ii
Contents
Tables......................................................................................................................... iii
Figures........................................................................................................................ iv
Executive Summary.....................................................................................................1
1 Introduction..............................................................................................................5
2 Objectives..............................................................................................................10
3 Methods ................................................................................................................12
3.1 Sample Locations .............................................................................................................12 3.2 Selection of Analytes ........................................................................................................20 3.3 Screening health risk assessment methodology..............................................................21 3.4 Sampling...........................................................................................................................23 3.4.1 Sampling Programme........................................................................................................23 3.4.2 Sampling Points.................................................................................................................26 3.4.3 Sampling Equipment and Procedures ..............................................................................30 3.4.4 Sample Collection .............................................................................................................30 3.4.5 Sampling Quality Assurance/Quality Control (QA/QC).....................................................34 3.4.6 Contingencies....................................................................................................................35 3.4.7 Operational Conditions during Sampling ..........................................................................36 3.4.8 Laboratories & Samples Analysed....................................................................................37 3.5 Analytical Methods............................................................................................................42 3.6 Data Management ............................................................................................................43 3.7 Data Analysis....................................................................................................................43 3.8 Statistical Methods............................................................................................................44
4 Analytical Quality Assurance/Quality Control (QA/QC) .........................................47
4.1 Sampling QA.....................................................................................................................47 4.2 Analytical QA ....................................................................................................................49 4.3 Inter-laboratory Testing ....................................................................................................50
5 Standard Wastewater Characteristics ...................................................................58
5.1 Introduction .......................................................................................................................58 5.2 Methods ............................................................................................................................59 5.3 Quality assurance/ Quality control....................................................................................59 5.4 Results & Discussion........................................................................................................60

iii
Tables
Table 3.1.1: Beenyup MF/RO pilot plant specifications and operational conditions........................15
Table 3.1.2: KWRP Plant specifications and operational conditions ..............................................17
Table 3.4.1: Sampling Dates for the PCRP Project........................................................................24
Table 3.4.2: KWRP RO CIPs prior to sample days ........................................................................37
Table 3.4.3: Participating Laboratories and samples analysed ......................................................38
Table 3.5.1: Type of analytical method used to analyse each chemical group...............................42
Table 4.3.1: Results of inter-laboratory testing of Antibiotics and Hormones. ................................52
Table 4.3.2: Nitrosamine proficiency test results............................................................................54
Table 4.3.3: Inter-Laboratory round robin results for N-Nitrosamines (Event 6) .............................56
Table 5.4.1: Beenyup Pilot Plant Operating Conditions .................................................................67
Table 5.4.2: Standard parameters with guideline levels, percentage removal by the BPP;
Beenyup WWTP secondary wastewater and Pilot Plant product water mean
and standard deviation; all values in mg/L except turbidity. n= number of
samples..................................................................................................................71
Table 5.4.3: Additional parameters that characterise treatment efficiency, percentage
removal by the BPP. Beenyup WWTP and Pilot Plant mean (mg/L) and
standard deviation – all values in mg/L except colour. n= number of samples ........72
Table 5.4.4: Subiaco WWTP secondary wastewater nutrients, anions, cations and standard
parameters data with respect to guideline levels (AGWR or ADWG).
Operational data from January 2005 – December 2008, mean, standard
deviation and number of samples. PCRP data from May 2007 and April 2008. ......76
Table 5.4.5: Standard parameters with guideline levels, percentage removal by MF/RO
treatment. Woodman Point WWTP and KWRP product water mean and
standard deviation – all values in mg/L except turbidity. n= number of samples.
Data is PCRP data except where n>15, in which case operational data from
2005 to end of 2008 was used................................................................................82
Table 5.4.6: Additional parameters that characterise treatment, percentage removal by
MF/RO. Woodman Point WWTP and KWRP product water mean and
standard deviation – all values in mg/L. n= number of samples. .............................83

iv
Figures Figure 3.1.1: Location of WWTPs and their catchments in the Perth metropolitan area
Beenyup, Subiaco and Woodman Point WWTPs are the three with existing
ocean outfalls. ........................................................................................................13
Figure 3.1.2: Process flow diagram of the Beenyup Pilot MF/RO plant & sample locations ...........18
Figure 3.1.3: Process flow diagram of the Kwinana Water Reclamation Plant including
instrumentation & sample panel locations...............................................................19
Figure 3.3.1: Flow chart indicating the three-tiered approach, with RQ, risk quotient; MC,
measured concentration; GV guideline value; HV, health value; TTC, threshold
of toxicological concern ..........................................................................................22
Photos 3, 4,5 and 6: Grab and composite sample points in the BPP .............................................27
Photos 7, 8 and 9: Grab and composite sample points in the KWRP plant. ...................................28
Photos 10 and 11: Raw water sample points in the Wanneroo Groundwater Treatment Plant.......29
Photos 12 and 13: Autosamplers used to collect composite samples: refrigerated Isco 4700
sampler and non-refrigerated sampler used to collect RO permeate samples
at KWRP only. ........................................................................................................32
Photo 14: Stainless steel weir used to provide continuous flow for sampling by the
autosampler (photo and diagram). ..........................................................................32
Figure 3.8.1: Box plot example representing the median, lower quartile (Q1), upper quartile
(Q3), minimum and maximum values .....................................................................45
Figure 3.8.2: Bland-Altman scatter plot example representing a random scatter of points. The
line in the middle corresponds to the mean, the upper line corresponds to the
95% confidence interval (CI) and the lower line corresponds to the 5% (CI). ..........46
Figure 5.4.1: Beenyup WWTP secondary treated wastewater operational data and PCRP
collected data; time series for ammonia, nitrate and combined nitrate and
nitrite, all as mg/L as nitrogen. ................................................................................62
Figure 5.4.2: Beenyup WWTP secondary treated wastewater operational data and PCRP
collected data; time series for total and dissolved phosphorus (in mg/L as
phosphorus). ..........................................................................................................63
Figure 5.4.3: Beenyup WWTP suspended solids in secondary treated wastewater; online
data from 2 probes monitoring the product of 2 pairs of treatment modules,
operational laboratory data and PCRP collected data (red). Time series.
Sample dates are identified in light blue..................................................................63

v
Figure 5.4.4: Beenyup WWTP secondary wastewater time series of Dissolved Oxygen
average across 27 probes in all aeration tanks. Also dissolved oxygen as
measured in feed water to the Pilot plant on PCRP sample days............................64
Figure 5.4.5: Beenyup WWTP time series of BOD5 of secondary treated wastewater,
operational and PCRP data (zero values represent less than LOD; <5mg/L)..........64
Figure 5.4.6: Beenyup WWTP time series of Alkalinity of secondary treated wastewater,
operational and PCRP data ....................................................................................65
Figure 5.4.7: Beenyup WWTP time series of Conductivity of secondary treated wastewater,
operational and PCRP data, and PCRP data post MF/RO treatment in BPP ..........65
Figure 5.4.8: Beenyup Pilot plant time series of feedwater turbidity. ..............................................67
Figure 5.4.9: Online BPP product water time series of electrical conductivity (µS/cm) – not
normalised, and PCRP sample data analysed by the laboratory (CCWA)...............68
Figure 5.4.10: BPP product water time series of electrical conductivity (µS/cm) – as
normalised for feed water characteristics (pressure and temperature), and
PCRP collected data analysed on site in the field and by the laboratory. ................69
Figure 5.4.11: Subiaco WWTP secondary treated wastewater time series of suspended
solids (operational and PCRP data) and sampling events (mg/L). ..........................74
Figure 5.4.12: Subiaco WWTP secondary wastewater time series of BOD5 with and without
filtration and sampling events. BOD5 Filtered was frequently below the limit of
reporting of 2mg/L; this plots as zero prior to, and 2mg/L after, June 2006. ............74
Figure 5.4.13: Subiaco WWTP time series of average dissolved oxygen in aeration tanks
(mg/L); average of 9 probes and PCRP sample dates. ...........................................75
Figure 5.4.14: Subiaco WWTP time series of secondary treated wastewater ammonia and
nitrate content – operational and PCRP data and sampling events, all as mg/L
as nitrogen..............................................................................................................75
Figure 5.4.15: Turbidity of secondary treated wastewater feed to KWRP time series of on-line
and laboratory operational data and PCRP data.....................................................78
Figure 5.4.16: Time series of BOD5 of secondary treated wastewater feed to KWRP;
operational laboratory data and PCRP data. All data at 2.5mg/L is below the
limit of reporting of 5mg/L .......................................................................................78
Figure 5.4.17: Time series of Nitrate and ammonia content of secondary treated wastewater
feed to KWRP - operational data and PCRP data, all as mg/L as nitrogen. ............79
Figure 5.4.18: Time series of Alkalinity of Woodman Point secondary treated wastewater –
feed to KWRP - operational data and PCRP data, as mg/L as CaCO3....................79
Figure 5.4.18: KWRP RO permeate time series of flow rate (kL/hour) ...........................................80

vi
Figure 5.4.19: KWRP time series of conductivity of feed water (Panel 1) and after treatment
(Panel 7), operational data and PCRP data. Units are microSiemens per cm.........81
Figure 5.4.20: KWRP time series of conductivity of treated water (Panel 7). Online
operational data, laboratory operational data and PCRP data. Units are
microSiemens per cm. ............................................................................................81

1
Executive Summary
This report details the first comprehensive research conducted in Western Australia to determine the feasibility of augmenting drinking water supplies through groundwater replenishment. The Premiers Collaborative Research Program project “Characterising Treated Wastewater for Drinking Purposes Following Reverse Osmosis Treatment” was conducted over a period of three years. Partnering the Department of Health in the project were the Department of Water, the Department of Environment and Conservation, the Water Corporation, the University of Western Australia, Curtin University of Technology, the National Measurement Institute, CSIRO and the Chemistry Centre of Western Australia.
The aims of the project were to:
• Characterise the microbial and chemical constituents of the three large metropolitan Wastewater Treatment Plants (WWTPs).
• Analyse the permeate to assess the performance of micro-filtration and reverse osmosis (MF/RO) treatment at the Kwinana Water Reclamation Plant (KWRP) and the specially constructed Beenyup Pilot Plant (BPP), to consistently produce water meeting health and environmental requirements.
• Use the research results to develop and refine health and environmental guidelines.
This research was conducted to determine the feasibility of using MF/RO treatment to provide water to supplement groundwater supplies. There are now plans to assess this proposal further in a groundwater replenishment trial (GWRT). The objective of the GWRT is to treat the secondary wastewater from the Beenyup WWTP using advanced treatment (MF/RO and ultraviolet disinfection) and inject up to 5 ML/day into the confined Leederville aquifer at a depth of approximately 200 metres for a trial period of three years. The recycled water is planned to be injected in a P3 drinking water source protection area (about 3 kms from drinking water abstraction bores) with the water quality being such that there will be negligible risks to the environment or human health.
Chemical characterisation
Chemicals were selected for analysis based on being:
• currently or previously available for use in Western Australia;
• of toxicological concern; and/or

2
• recorded elsewhere in wastewaters above guideline levels (Australian Drinking Water Guidelines (ADWG), Australian Guidelines for Water Recycling (AGWR) (Phase 2) Augmentation of Drinking Water Supplies (2008)
Almost 400 chemicals were tested during the project including pesticides, metals, pharmaceuticals, industrial chemicals, endocrine disruptors, and persistent organic pollutants such as dioxins, furans and PCBs among others.
The chemical groups analysed include a broad range of parameters with different chemical characteristics and toxic effects.
This research is a comprehensive chemical, physical and microbiological characterisation of secondary wastewater and recycled water quality after MF/RO treatment.
Key Chemical results
• The MF/RO treatment process resulted in recycled water quality of the required health and environmental standards for augmentation of drinking water supplies.
• The majority of chemicals analysed were detected in secondary wastewater, of which approximately 25% were also detected after MF/RO at very low concentration levels, below health significance.
• The water quality achieved after the MF/RO treatment complies with ADWG (2004) and with the AGWR (Phase 2): Augmentation of Drinking Water Supplies (2008) values except occasionally for N-nitrosodimethylamine (NDMA), a disinfection-by-product.
• NDMA was routinely detected in secondary wastewater. After MF/RO treatment NDMA was occasionally above the AGWR (Phase 2): Augmentation of Drinking Water Supplies (2008) guideline value of 10 ng/L. However, this guideline value is very stringent, being a tenth of the 100 ng/L limit in the WHO Guidelines for Drinking-Water Quality (2008) and proposed for the ADWG, which was never exceeded. The average concentration of NDMA did not exceed 10 ng/L, that is particularly relevant as post-treatment maximum concentrations will be smoothed by retention in groundwater for months to years.
• A total of nine N-nitrosamines, including NDMA, were analysed. The potential toxicological contributions from all detected N-nitrosamines were added to produce a combined hazard quotient (HQ) (where the guideline value is 1). The calculated average HQ value in post-RO water was 0.7 at BPP (compared to 1.5 at KWRP, where N-nitrosamines were more commonly detected).
• The research has resulted in the development of reliable methods to characterise recycled water quality following secondary and MF/RO treatment. Research outcomes led to the identification of chemical indicators for the validation and verification monitoring of the GWRT.

3
• This research provides confidence to proceed with the GWRT. The research indicates a high degree of safety associated with undertaking the proposed Groundwater Replenishment Trial for a period of three years.
Microbial characterisation and virus challenge test
The microbiological quality of the secondary wastewater was characterised at Beenyup WWTP and Subiaco WWTP. In secondary wastewater thermotolerant coliforms and enterococci were always detectable. Coliphages, often used as indicators of viral contamination, were detected in 95% of the Subiaco and 100% of the Beenyup samples. Adenovirus were detected in 68% of the Subiaco and in all of the Beenyup wastewater samples. No microbial parameters were detected after MF/RO treatment.
Two challenge tests were undertaken at BPP using the coliphage MS2 as an indicator of enteric viruses to assess the capacity of the RO membranes to exclude such viruses. The results showed that the RO membranes alone were able to achieve at least a 4 log removal (i.e. 99.99% removal) of virus.
Recommendations of the Department of Water and the Department of Environment and Conservation
The Department of Water and the Department of Environment and Conservation support the GWRT as a means of obtaining site-specific information on transport and attenuation of contaminants which will be used to conduct a detailed environmental risk assessment for a future full scale groundwater replenishment scheme. The trial will also help to identify possible policy and regulatory areas requiring further development.
The Department of Water and the Department of Environment and Conservation recommend the monitoring of water quality using integrated whole of effluent toxicity (WET) tests. The Department of Water and Water Corporation, with other partners, are currently conducting a project to provide more specific recommendations regarding use of WET testing for environmental risk assessment of groundwater replenishment in WA.
Recommendations of the Department of Health
The DoH considers the results of this research provide the necessary confidence to proceed to the GWRT over a three year trial period. It is of the view that the GWRT will build on these results so as to:
• Assist in obtaining additional data on N-nitrosamines
• Validate the selected chemical and microbial indicators.

4
• Highlight policy and regulatory areas requiring further development with a view to enabling a large groundwater replenishment scheme to proceed in the future.
Therefore, the GWRT will be closely monitored to see whether it provides confirmation of the conclusions of this initial research, and in particular to observe the behaviour of NDMA and other disinfection byproducts during the advanced treatment and in the aquifer.
The Department of Health supports the implementation of the three year GWRT proposed by the Water Corporation, subject to:
• documentation and implementation to the satisfaction of the Department of Health of a comprehensive risk management framework, as used in drinking water management, to ensure that only water meeting strict specifications is able to enter the aquifer; and
• validation and verification monitoring of the advanced water treatment plant to the satisfaction of the Department of Health, using chemical and microbial indicators based on this research.

5
1 Introduction
Background
The south-west of Western Australia has been experiencing water shortages exacerbated in recent years by both rapid population growth and by the effects of a drying climate. The capital of W.A. , Perth, sits on the Swan Coastal Plain with a population of approximately 1.5 million, that is projected to increase to 2.4 million by 2051 (ABS, 2005). This population growth poses increased demand for potable water, which is projected to be 155 to 170 kL per capita/yr during the next eight years (Water Corporation, 2008).
In recent years Perth has experienced a significant reduction in water available from dams and groundwater. Declining rainfall has reduced stream flow into dams by two-thirds over the past 30 years (Water Corporation, 2005), and the average runoff declined even further to about 30% of the previous average in the last 7 years (Blair & Turner, 2004). This drying climate effect is also having a profound impact on ground water levels, consequently severely impacting wetlands and groundwater-dependent ecosystems (EPA WA, 2005). This pattern of declining precipitation is expected to continue (Bates et al, 2008). The Swan Coastal Plain is underlain by 3 major aquifers that are used for drinking water, irrigation water and storm water management. Groundwater levels are falling due to decreased infiltration of water from rainfall and over abstraction. The implications for a reliable water supply are serious, considering that over 50% of the drinking water supplied to Perth comes from groundwater sources (Water Corporation, 2008).
Population growth, decreases in traditional drinking water sources and climate variability mean that Perth needs to increasingly look at using water more efficiently and to develop new water sources. One of several government strategies to meet Perth’s increased water demand and to secure water supply in the face of a drying climate is through recycling of treated wastewater.
Policy context
In 2003, the State Government developed the “State Water Strategy for Western Australia”. The Strategy recommended that some of the State’s water requirements should be met through using recycled water and subsequently proposed that this be investigated as part of a multi-faceted approach to water management.
The State Water Strategy (2003) set a target of recycling 20% of treated wastewater by 2012 through large scale schemes for a range of uses, including possible residential uses (Government of WA 2003). The Strategy recognised that augmenting depleted groundwater levels through injection or infiltration of highly treated wastewater (recycled water) had the potential to provide the greatest triple bottom line benefit. More recently the State Water Plan (Government of Western Australia 2007) set a target of 30% recycling of wastewater by 2030.

6
In April 2005 the Water Corporation released its Source Development Plan for the Integrated Water Supply Scheme (Water Corporation, 2005) which recognised that storing high quality recycled water in groundwater supplies could provide a drinking water source option in the future. This option is now known as groundwater replenishment.
More recently, water reuse was again identified in the Water Corporation’s “Water Forever” project as an integral part of water management for WA. A key initiative of the strategy is 30% reuse of treated wastewater in the metropolitan area by 2030. Among the strategic objectives are to achieve significant advances in water reuse and encourage ‘fit for purpose’ water consumption through the substitution of potable supplies with recycled water. A major initiative identified to help reach this target was the replenishment of aquifers with highly treated recycled water (Managed Aquifer Recharge) beneath the Swan Coastal Plain (EPA WA, 2005).
The Water Corporation Board agreed that early work towards the potential future implementation of indirect potable water recycling should be carried out, in a Board Paper of March 2004. One of the key areas of research outlined in that paper is comprehensive testing of the quality of recycled water produced by reverse osmosis of treated wastewater such as at the Kwinana Water Reclamation Plant (KWRP). The water produced by this plant for industrial use, is produced in a similar way and from a similar product as that which would be used for aquifer recharge in an indirect potable water recycling scheme. Thus, comprehensive assessment of the quality of this water will be a useful tool to satisfy Water Corporation staff, Health Department and eventually the community that the water is safe to drink.
Project objectives
The Premiers Collaborative Research Project aims to characterise the secondary effluent of the three major WWTPs in Perth and to evaluate the recycled water quality after advanced treatment using Microfiltration (MF) and Reverse Osmosis Treatment (RO) in order to develop and refine health and environmental guidelines for groundwater replenishment.
The chemicals of concern for indirect potable reuse are different to and more numerous than those that are typically regulated for drinking water (AGWR, 2008). No work has previously been done in Western Australia in investigating the potential chemicals of concern present in treated wastewater for aquifer recharge. Work on indirect potable reuse has been completed elsewhere. Singapore has shown through “Verification Monitoring” that the NEWater is of higher quality than that outlined in the US EPA and WHO drinking water guidelines and is of better quality than normal Singapore drinking water (Law, 2008). Orange County Water District has also conducted extensive research. However in order to conduct local risk assessment of indirect potable reuse, local water quality information is essential. It is also expected that the local community will want to see local results to accept large scale indirect potable water recycling via groundwater replenishment.

7
Environmental risk assessment of treated wastewater has been completed in WA for secondary treated wastewater in the marine environment to a very high level of certainty (PLOOM, Water Corporation). However no work has been completed for impacts on the groundwater dependent freshwater ecosystems on the Swan Coastal Plain, or for wastewater treated to a higher level. In order to complete risk assessment for this new management approach, significantly more data was required.
Using recycled water as a drinking water source may allow for new expensive water source developments to be deferred, water that currently goes to waste to be reclaimed, and high quality recycled water to be retained for high-value uses. The option to use recycled water as a drinking water source also has the potential to restore water levels in lakes, rivers and wetlands and provide water for vegetation (WRC, DEP, DoH, 2002).
The Premier’s Collaborative Research Foundation awarded a grant in 2005 to the Dept of Health, Dept of Environment, Water Corporation, Curtin University, Chemistry Centre of WA, CSIRO and the National Measurement Institute to complete the project “Characterising Treated Wastewater For Drinking Purposes Following Reverse Osmosis Treatment” on recycled water quality in the context of potential managed aquifer recharge for indirect potable reuse.
This research will inform on a possible technology (aquifer recharge) to economically provide an alternative water supply. If recharged water is re-allocated for drinking water, this should allow deferment of alternate potable scheme water developments.
Benefits include: not impacting further on water table levels and groundwater dependent ecosystems; minimising impact on climate and greenhouse gas production by replacing an energy intensive new water source (from distant source or from desalination); understanding the potential extent of environmental risks associated with recycled water use. The social benefits of providing a recycled water supply via the aquifer, include satisfying the community demand for sustainability in water supply.
Multiple Barrier Approach for indirect potable reuse
The multiple barrier approach is the foundation for ensuring safe drinking water. The treatment of wastewater for drinking water augmentation purposes requires a multiple barrier approach for removal of chemicals and pathogens as no single barrier is effective against all hazards or is completely effective all of the time (AGWR, 2008). For groundwater replenishment the expected barriers are: contaminant source control in the wastewater catchment, biological wastewater treatment, membrane filtration (MF, such as microfiltration or ultrafiltration), reverse osmosis (RO), UV disinfection, and storage and attenuation if required in the groundwater aquifer. Online performance monitoring of critical barriers will ensure continuous safe operation.

8
Contaminant source control is already implemented for many wastewater contaminants. Trade waste control measures are in place in Western Australia for industrial and hospital contributions to the wastewater system. Strict regulation ensures that radioactive substances and human body parts from health care settings are not disposed to sewer. There is a system in place for unused pharmaceutical collection, in both hospitals and from the community via pharmacies for incineration (Return Unwanted Medicines Project, Commonwealth Dept of Health & Ageing), as well as community education programs to promote this. In WA, an average of 3767 medications were collected monthly during the fiscal year 2008-2009 as part of this program.
Contaminants from stormwater are not an issue in Perth as there is an unusually low level of stormwater introduction into the sewer system (by world standards). This is because the stormwater system relies on local infiltration to groundwater and there are few flooding problems.
MF and RO are together expected to provide a very effective barrier for pathogens and chemicals and therefore are the subject of this study. MF and RO treatment following biological wastewater treatment are the processes used by the Kwinana Water Reclamation Plant (KWRP) to provide high quality water for industrial use. KWRP therefore provides a good opportunity to test quality of wastewater through an operational scale advanced water treatment plant.
Perth’s wastewater treatment plants
The Perth Metropolitan wastewater system serves urban, commercial and some industrial developments. Water Corporation has three main wastewater treatment plants: Beenyup, Subiaco and Woodman Point. These plants treat 85% of the wastewater produced while 15% is served by individual on-site septic tanks and 6 small treatment facilities. The Beenyup WWTP serves the north of the city, which is mainly residential. The plant has a capacity of 135 mega litres per day (ML/day), servicing a population of up to 750,000 people. The Subiaco WWTP services the Perth central area and has a capacity of 55 ML/day. This plant receives the effluent of several hospitals in the area. The Woodman Point WWTP treats up to 130 ML/day and serves the south metropolitan region, which also has some industrial developments.
The three metropolitan wastewater treatment plants (Beenyup, Subiaco and Woodman Point) receive their water from varied sources. The Woodman Point catchment, the source water to KWRP, is a more industrialised catchment than the Beenyup and Subiaco catchment which are predominantly urban, and the contaminants present in the wastewater vary accordingly. However all WWTPs have low industrial loading by international standards.

9
Perth’s advanced wastewater treatment plants
KWRP is the only operational MF/RO plant treating wastewater run by the Water Corporation and water quality outcomes were expected to be similar and provide a worst case to inform on risk assessment for groundwater replenishment (MAR).
Recycled water quality after the advanced treatment using MF and RO was evaluated at two plants: the operational plant located at KWRP and a pilot plant located at Beenyup referred to as the Beenyup pilot plant (BPP), which was installed during the project to treat water produced by the Beenyup WWTP.

10
2 Objectives
The research project: Characterising Treated Wastewater for Drinking Purposes Following Reverse Osmosis Treatment aims to complete a three year assessment of water quality achieved by very high levels of tertiary treatment of treated wastewater, including membrane filtration and reverse osmosis. Findings will be incorporated into guidelines on aquifer recharge of treated wastewater for indirect potable reuse on the Swan Coastal Plain.
More specifically:
• Analyse the final treated wastewaters from the Corporation’s 3 large Metropolitan wastewater treatment plants to characterise their microbial and chemical constituents and understand any seasonal and catchment differences in trace contaminants of concern in relation to human health and health of the environment;
• Analyse the permeate characteristics to assess the performance of the existing micro-filtration/reverse osmosis (MF/RO) treatment process at the Kwinana Water Reclamation Plant (KWRP) to consistently produce water of the required standard from treated wastewater from the Woodman Point Wastewater Treatment Plant;
• Analyse the permeate characteristics to assess the effectiveness of MF/RO treatment to remove target contaminants present in treated wastewater from the Corporation’s other Metropolitan WWTPs (Subiaco and Beenyup);
• Use the research output to develop and refine health and environmental guidelines for aquifer recharge of recycled water for indirect potable reuse on the Swan Coastal Plain.
This project will determine the key contaminants of concern (COCs) in Perth’s treated wastewater which need to be monitored and managed, and the effectiveness of MF/RO treatment processes to remove them. The aim is to ensure that any recycled water schemes developed will not pose a risk to human health or health of the environment.
Aquifer recharge with highly treated recycled water may be useful to augment drinking water supplies or to provide environmental benefits (augmenting water flows for wetlands and groundwater dependent ecosystems). Close collaboration between the Departments of Health, Water and Environment and Conservation is a crucial aim of this project. The three departments will determine the COCs relevant to WA which may pose public health and/or environmental risks. They will determine the health and environmental limits, if these compounds are not consistently fully removed by treatment.
The Departments of Health, Water and Environment and Conservation will work together, supported by the Water Corporation, Chemistry Centre, NMI, CSIRO and

11
Curtin University, to acquire locally relevant scientific knowledge and to address research gaps in order to be able to effectively regulate and manage reuse schemes to ensure they are safe, and to address community concerns.
The three Departments will lead a communication program developed by the Project team, to inform the community and stakeholders of the project and its findings and implications. The Departments will also liaise and consult with a group of eminent national and international scientists who have agreed to be involved in this project. The ‘on call’ knowledge and skills relate to their experience of COCs in wastewater in other jurisdictions, health and environmental impacts of COCs, analytical methods for trace contaminants, and application of MF/RO technology to treat wastewater.

12
3 Methods
3.1 Sample Locations
The Water Corporation operates three large wastewater treatment plants (WWTPs) in the Perth metropolitan area, Beenyup, Subiaco and Woodman Point WWTP that between them treat about 80% of Western Australia’s wastewater (See Figure 3.1.1 for plant locations). Currently the majority of this wastewater is discharged to ocean. Reuse of water sourced from these wastewater treatment plants has been identified as a potential new climate-independent drinking water source following reverse osmosis treatment and recharge to aquifers. This source option has been termed Groundwater Replenishment.
In the long term all three major wastewater treatment plants could provide sources for Groundwater Replenishment schemes, hence it was important to characterise the wastewater source from all three treatment plants. It was also important to compare this to an existing bulk drinking water source to allow assessment of relative health risks. The drinking water source chosen was combined bulk groundwater treated at the Wanneroo Water Treatment Plant.
The treatment of wastewater for drinking water augmentation purposes requires a multiple barrier approach for removal of chemicals and pathogens. For groundwater replenishment the expected barriers are: contaminant source control in the wastewater catchment, biological wastewater treatment, membrane filtration (such as microfiltration MF, or ultrafiltration, UF), reverse osmosis (RO), UV disinfection, and storage and attenuation if required in the groundwater aquifer. Online performance monitoring of critical barriers will ensure continuous safe operation. MF and RO are together expected to provide a very effective barrier for pathogens and chemicals and were therefore the subject of this study. MF and RO treatment following biological wastewater treatment are the processes used by the Kwinana Water Reclamation Plant (KWRP) to provide high quality water for industrial use. KWRP therefore provides an opportunity to test quality of wastewater through an operational scale advanced water treatment plant (and a ‘worst case’ study as the plant is designed for non-potable reuse).
As the most accessible suitable groundwater recharge locations are to the north of central Perth, the Beenyup WWTP will be the first location for trialling a Groundwater Replenishment water source option. Therefore testing the quality of Beenyup treated wastewater through an advanced treatment plant was the priority for this project. A pilot scale microfiltration and reverse osmosis (MF/RO) treatment plant, referred to as the Beenyup pilot plant (BPP), was installed to treat water produced by the Beenyup WWTP.

13
Figure 3.1.1: Location of WWTPs and their catchments in the Perth metropolitan area Beenyup, Subiaco and Woodman Point WWTPs are the three with existing ocean outfalls.

14
BEENYUP WWTP
The Beenyup WWTP is an advanced secondary treatment plant. Capacity is currently 120 megalitres per day (ML/day) that serves a population of about 600,000 with planned upgrade to treat 200 ML/day. The plant process involves screening, grit removal, activated sludge treatment with aerated and anoxic zones (designed for denitrification) and clarification.
The Beenyup WWTP is located on Ocean Reef Road in Craigie. The Treatment Plant serves Perth’s rapidly developing northern suburbs from Quinn’s Rock through to Scarborough and inland through Dianella and Bayswater to the foothills east of Midland (Figure 3.1.1).
Beenyup wastewater is predominantly sourced from households. The majority of non-residential wastewater is sourced from food manufacture, processing or retail (restaurant) industries. Industrial waste forms 2% of sewage in the catchment. It is estimated that 0.025% of sewage is sourced from hospitals in the Beenyup WWTP catchment, of which 47% is medical waste. Medical waste consists of liquid waste from operating theatres, laboratories, radiology, and mortuary streams. Strict regulation ensure radioactive substances, unused pharmaceuticals and human body parts are not disposed to sewer.
Like other wastewater treatment plants across the state, the Beenyup WWTP is subject to regulation and licensing by the Department of Environment and Conservation.
BEENYUP PILOT PLANT (BPP)
A pilot MF/RO plant was installed in a sea container at the Beenyup WWTP to treat about 96 kL/day of secondary treated wastewater to produce about 67 kL/day of RO permeate. Specifications for this plant are shown in Table 3.1.1. The treatment process consists of coarse screening (1 mm), pressurised continuous microfiltration cartridges and full two-stage RO using 4 inch membranes, without recirculation. Chloramination (ammonia and hypochlorite dosing) and pH control by sulfuric acid dosing occur after coarse screening but prior to microfiltration (see Figure 3.1.2 for process diagram). The anti-scalant Hydrex 4101 is dosed prior to the RO pre-filters. The product water is used for research purposes only.
The pilot plant design was reviewed by two technical reviewers expert in treatment for indirect potable reuse: Ian Law (IBL Solutions, NSW) and Greg Leslie (UNSW). Through the design process it was determined that the 4 kL/h design flow was the minimum required for the pilot plant to produce water of sufficiently similar quality to that of a large scale treatment plant for groundwater replenishment. The plant was initially operated at about 70% recovery. Prior to the final sampling event this was increased to close to 80%. The average flux rate of the RO membranes was 19.7 L/m2/hr, with an estimated flux decline of 7% per year.

15
Table 3.1.1: Beenyup MF/RO pilot plant specifications and operational conditions
Parameter Value
Production Volume (kL/hr) 2.8 kilolitres per hour
Coarse Screen AMIAD 1000
500 micron, self-cleaning
MF Membranes Memcor CMF-L 6L10V
Continuous Microfiltration hollow fibre membranes
material PVDF
RO Membranes Hydranautics ESPA-2 4040
4 inch, spiral wound
material Composite polyamide
RO Membrane flux - average 19.7 L/m2/hr
Recovery: Commissioning to 12 May 2008
69-70%
Recovery: post 12 May 2008 79-80%
Operating Parameter Value Required Procedure outside criteria
Influent Turbidity <20 ntu Shut off MF
RO Feed pH <6.1 Alarm
RO Feed pH 5.5-6.4 Shut-down
RO Feed ORP 200-600 mV Shut-down
Chloramine dose rate 1-2 mg/L

16
SUBIACO WWTP
The Subiaco WWTP is an advanced secondary treatment plant. Capacity is about 61 ML/day, which serves a population of about 300,000. The plant process involves screening, grit removal, activated sludge treatment with aerated and anoxic zones (designed for denitrification) and clarification.
The Subiaco WWTP is located on the corner of Brockway Road and Lemnos Street in Subiaco. The plant serves Perth’s central area including the Central Business District and most of Perth’s major hospitals (Figure 3.1.1).
Subiaco wastewater is predominantly sourced from households. The majority of non-residential wastewater is sourced from food manufacture, processing or retail (restaurant) industries. Industrial waste forms 6% of wastewater in the catchment. It is estimated that 0.34% of wastewater is sourced from hospitals in the Subiaco catchment, of which only 36% is actually medical waste.
KWINANA WATER RECLAMATION PLANT (KWRP)
The Kwinana Water Reclamation Plant (KWRP) treats wastewater sourced from Woodman Point WWTP via MF and RO to produce high quality industrial process water for industries in Kwinana. Woodman Point is Perth’s largest wastewater treatment plant with a capacity of 160 ML/day (serving a population of about 800,000). The plant process involves screening, grit removal and activated sludge treatment via sequencing batch reactor. This process conducts activated sludge treatment in batches that are subject to aeration and non-aeration periods (designed for nitrification and denitrification) followed by decanting the clarified wastewater. The treated wastewater leaving the Woodman Point WWTP is discharged into a 45 ML capacity plastic-lined uncovered holding pond before discharge to the ocean outfall line.
The Woodman Point WWTP receives wastewater from a large catchment that extends from Kalamunda and Dandalup in the east, to the coast (Figure 3.1.1). Wastewater entering Woodman Point WWTP is predominantly sourced from households. The majority of non-residential wastewater is sourced from food manufacture, processing or retail (restaurant) industries. Industrial waste forms 6% of wastewater in the catchment. It is estimated that 0.071% of wastewater is sourced from hospitals in the Woodman Point catchment, of which only 43% is actually medical waste.
KWRP treats up to 24 ML/day of wastewater to produce about 17 ML/day of product water. The plant process involves initial screening, chloramination and pH adjustment, continuous MF with a low pressure hollow fibre membrane system. This is followed by antiscalant dosing and RO membrane treatment, prior to storage in a covered storage dam and delivery to industry (see Figure 3.1.3 for a process diagram and Table 3.1.2 for Details of KWRP plant specifications and operational conditions).

17
Table 3.1.2: KWRP Plant specifications and operational conditions
Parameter Value
Production Volume 16.7ML/day
Coarse Screen Absolute Filters - Model - 723
2mm, self-cleaning
MF Membranes Memcor CMF S10T
Continuous Microfiltration - hollow fibre membranes
material Polypropylene membrane
RO Membranes Dow Flimtec BW30-400-FR
8 inch, spiral wound
material Composite polyamide
Recovery: 70%
Operating Parameter Value Required Procedure outside criteria
Influent Turbidity 0 - 30 NTU Shut off MF at 50 NTU
RO Feed pH <5.8 Alarm
RO Feed pH >6.4 Shut-down
RO Feed ORP 380-650 mV Shut-down
Chloramine dose rate 1-2 mg/L (Target 1.65 mg/L)

18
Figure 3.1.2: Process flow diagram of the Beenyup Pilot MF/RO plant & sample locations
Backwash to Drain RO Stage 2
Raw Feedwater (Secondary Treated Wastewater)
Basket Strainer Micro-filtration RO Feed Tank RO Stage 1
Sample Point 1
Chemical Dosing (Hypochlorite, Ammonia, Acid)
Sample Point 5
Turb,
Backwash to Drain Sample Point 3
Sample Point 6
Sample Point 7
Cond, temp, pH
Concentrate to Drain Sample Point 4
Return to Outfall
Anti-scalant Hydrex 4101

19
Figure 3.1.3: Process flow diagram of the Kwinana Water Reclamation Plant including instrumentation & sample panel locations
Backwash to Drain
RO Stage 2
Raw Feedwater (Secondary Treated Wastewater)
Screen Micro-filtration RO Feed Tank RO Stage 1
Panel 1 pH, NH3,
Turb, Cond, Flow
Chemical Dosing (Hypochlorite, Ammonia, Sulfuric Acid)
pH, TCL, ORP
Panel 6
Turb, ORP, NH3, Cond,
TCL
Panel 8
Flow, pres, pH,
temp, Cond, TCL,
Backwash to Drain
MF Feed Tank
Degasser &
Storage tank
Panel 7
TCL, pH
Concentrate to Drain
Chemical Dosing (Hypochlorite, Sodium hydroxide)
Dams
Cond.
Custo
mers
Hypochlorite
TCl, ORP
Anti-scalant PC-191T

20
3.2 Selection of Analytes
Urban wastewater is contaminated water, with many pollutants which represent a wide range of residential, industrial, and agricultural origins and uses. The increasing sensitivity of analytical techniques and their wider application permits detection of increasing numbers of chemicals of potential health and environmental concern in water and wastewaters. At the same time, there is a rising public demand for knowledge of the risks to which they may be exposed.
The first task in the project was to conduct a literature search to identify potential hazards in secondary treated wastewater and after MF/RO treatment to inform the selection of the target analytes.
A preliminary sampling was conducted in June 2005, before the commencement of the PCRP. The preliminary sampling event was conducted at Beenyup WWTP, Woodman Point WWTP and KWRP product water and the results are presented in Appendix 1. This sampling event also informed the selection of parameters for analysis.
The criteria for the selection of parameters for risk assessment were based on the following:
• Contaminant occurrence in water (from literature review; mainly for analytes known or anticipated to occur in wastewater, but also considering influence of MF/RO treatment and contaminants relevant to groundwater after injection of advanced treated water and drinking water).
• Known or anticipated toxicity from animal experimental studies and/or epidemiological studies
• Persistence in the environment
• Existence of drinking water guidelines
• Volume of use (using data from Western Australia if available).
• Public concern
• Available analytical methods or capacity to develop methods during the project timeframe
Given the considerable number of chemicals in the initial list and time and resource constraints, it was necessary to remove some of the analytes during the project. A prioritisation process was undertaken on chemicals for which methods were not locally available, based on health risk. Chemicals with relatively low health toxicity or chemicals less likely to be present in concentrations of health concern were removed from the initial list. Chemicals for which analytical method development would be difficult or not feasible during the time frame of the project were also excluded. The list of excluded analytes and the reasons for their removal is presented in Appendix 2

21
3.3 Screening health risk assessment methodology
Concerns have been raised regarding potential adverse human health effects of recycled water from IPR because membrane technologies are not 100% proficient in the removal of all chemical contaminants. Moreover treatment efficiency varies depending on characteristics of both the membranes and the water being treated. There is also speculation that trace organic chemicals may potentially be biologically active at low concentrations, and not much is known about the potential adverse health effects of long term chronic consumption of these contaminants.
In order to evaluate the potential human health effects of chemicals of concern in secondary treated wastewater and in post-RO water, a screening health risk assessment (SHRA) was conducted. Risk quotients (RQ) were calculated as the ratio between the observed concentration and the health value. Health values were assigned or calculated following a three tiered approach (Rodriguez, 2007) that is consistent with the AGWR Phase 2 (2008) and resulted in RQ calculation as represented in Figure 3.4.1. Parameters with existing guideline values were classified in Tier 1. The guidelines used in order of priority were the ADWG, WHO, USEPA and the California Title 22 code of regulations. Parameters with toxicological information available for the derivation of health values in drinking water were classified in Tier 2. For those chemicals without guideline values or toxicological information, health values were calculated using the threshold of toxicological concern (TTC) approach (Renwick, 2005; Kroes, 2005; Kroes, 2004}. Risk quotients were calculated using data collected from both before and after the MF/RO treatment. RQs were calculated for secondary wastewater and post-RO water using both maximum and median concentrations from the whole dataset to consider both the worst case and most representative concentration scenarios given the log-normal distribution of chemical concentrations.
For chemicals with toxicity information and classified in Tier 2, standard equations (ADWG, 2004; AGWR, 2008) were used to determine the highest exposure that will not cause toxicity in humans. Chemicals in Tier 2 were then classified according to their toxic mechanisms as threshold and non-threshold chemicals. For chemicals with threshold mechanisms (i.e. that do not act as genotoxic carcinogens) the no-observed-effect level (NOEL) is determined from long-term animal experiments and information from human exposure if available. The NOEL given as mg/kg of bodyweight per day, (mg/kg bw/day) is used to calculate the acceptable daily intake (ADI) or ‘tolerable’ daily intake (TDI), for toxic materials.
The ADI or TDI is calculated by dividing the NOEL by a safety factor - usually 100 including 10 for intra-species and 10 for interspecies variation. Additional safety factor (SF) values apply for database deficiency, severity of effects or sub-chronic to chronic extrapolation and the default values attributed are

22
generally of 3 to 10. Drinking water guidelines generally do not exceed a SF of 10,000. For example, the maximum SF applied by California was 3000 while by the WHO was 1000. As there is no specific guidance regarding the use of specific numeric values for the SFs, Ritter at al (2007) proposed a decision tree approach for the selection of appropriate safety factors.
Chemicals with non-threshold toxicity mechanisms are parameters where any exposure is correlated with a certain dose-dependent risk (i.e. carcinogens). For the genotoxic group of carcinogens, the convention is to assume a linear relationship between the dose and the carcinogenic response. The dose notionally associated with a 1 in 100,000 or 1 in 1,000,000 lifetime risk (95% upper confidence level) of causing cancer in humans is then calculated mostly based on animal data. This calculated value is taken to be a sufficiently ‘safe’ dose to be used as the limit for lifelong human exposure.
For chemicals without toxicity information and classified in Tier 3, the TTC approach was used for the establishment of health protective limits in drinking water. The TTC approach is based on evaluation of the known toxicity of chemicals which share similar structural characteristics. Details of the method can be found elsewhere (AGWR, 2008; Kroes, 2002; Renwick, 2005; Rodriguez, 2007). The TTC software used for the classification of the chemicals based on Cramer classes was Toxtree v1.3 (Ideaconsult, 2008).
Figure 3.3.1: Flow chart indicating the three-tiered approach, with RQ, risk quotient; MC, measured concentration; GV guideline value; HV, health value; TTC, threshold of toxicological concern
The SHRA conducted is very conservative as it assumes a lifetime of human exposure to the evaluated chemicals when it is often only for a limited time. In addition the SHRA was conducted assuming the end product for public
Is a drinking water standard available for the compound?
Tier 1: RQ=MC/ GV
Yes
Yes
Tier 2: RQ=MC/ HV
No
Tier 3: RQ=MC/ TTC
Is toxicity information available for the compound?
No
23
consumption was the post-RO water. Additional treatment barriers will occur as the product water will be diluted with other water sources and stored in the aquifer before being recovered to receive conventional treatment for drinking water supply. Additional steps will decrease and attenuate the concentration of any remaining wastewater-derived contaminants of concern and therefore the risk to human health.
3.4 Sampling
3.4.1 Sampling Programme
Quarterly sampling was planned, with several replicates in each quarter to be taken on different days of the week (see Work Instruction and Reporting-WIR Appendix 3). Table 3.4.1 details the sampling dates at all sampling points during the PCRP project. These dates were planned by the PCRP Technical Committee as detailed in the WIR document. Event 2 was significantly later than originally planned due to some maintenance works on the MF units at KWRP that was likely to affect water quality outcomes. In circumstances when sampling events had to be postponed (because for example plant, pumps or autosamplers were not operating correctly), these dates were replaced with equivalent dates.

24
Table 3.4.1: Sampling Dates and sample points for the PCRP Project
BWWTP Beenyup Pilot Plant KWRP SWWTP Wanneroo GWTP
Advanced Secondary
Effluent
Feed Pre Cl Inlet
(Pre MF) Post MF Post RO Pre MF Post MF
Post RO
Post RO
Pump Station
Advanced Secondary
Effluent
Pinjar Line
Wanneroo Line
(Raw 4)
Sampling Event
BWW2 BSP1 BSP6 BSP7 KP1 KP6 KP7 KP8 SWW1 W1 W2
Wed
29/11/06 Wed
29/11/06 Wed
29/11/06 Wed
29/11/06
Sun
03/12/06
Sun 03/12/06
Sun 03/12/06
Tues
05/12/06
Tues 05/12/06
Tues 05/12/06
Event 1 December
2006
Thurs
14/12/06
Thurs 14/12/06
Thurs 14/12/06
Thurs 24/05/07
Thurs
24/05/07 Thurs
24/05/07 Thurs
24/05/07
Wed
30/05/07 Wed
30/05/07 Wed
30/05/07
Mon
04/06/07 Mon
04/06/07 Mon
04/06/07
Thurs
07/06/07 Thurs
07/06/07 Thurs
07/06/07
Tues 12/06/07
Tues
12/06/07
Event 2 May/June
2007
Thurs 19/06/07
Thurs
19/06/07 Thurs
19/06/07 Thurs
19/06/07
Fri
21/09/07 Fri
21/09/07 Fri
21/09/07
Mon
24/09/07
Mon 24/09/07
Tues
25/09/07
Tues 25/09/07
Event 3 September
2007
Wed
26/09/07 Wed
26/09/07 Wed
26/09/07

25
Thurs
27/09/07
Thurs 27/09/07
Fri
28/09/07
Fri 28/09/07
Mon
21/01/08
Mon 21/01/08
Tues
22/01/08
Tues 22/01/08
Wed
23/01/08 Wed
23/01/08
Thurs
24/01/08
Thurs 24/01/08
Fri 25/01/08 Fri
25/01/08
Event 4 January 2008
Mon
28/01/08
Mon 28/01/08
Mon
31/03/08
Mon 31/03/08
Tues
01/04/08 Tues
01/04/08 Tues
01/04/08
Thurs
03/04/08
Thurs 03/04/08
Thurs
03/04/08
Fri
04/04/08
Fri 04/04/08
Event 5 March/April
2008
Wed
09/04/08
Wed 09/04/08
Thurs
05/06/08 Thurs
05/06/08 Thurs
05/06/08
Fri
06/06/08 Fri
06/06/08 Fri
06/06/08
Sun
08/06/08 Sun
08/06/08 Sun
08/06/08
Mon
09/06/08
Mon 09/06/08
Event 6
June 2008
Tues
10/06/08 Tues
10/06/08 Tues
10/06/08

26
Table 3.4.1 cont: Sampling Dates and sample points for the PCRP Project Event 7
Beenyup WWTP Beenyup Pilot Plant
Primary Effluent
Advanced Secondary
Effluent
Feed Pre Cl Inlet (Pre MF)
MF Reject RO Reject Post Cl/Pre MF Post MF Post RO Sampling Event
BWW1 BWW2 BSP1 BSP3 BSP4 BSP5 BSP6 BSP7
Mon
06/10/2008
Mon
06/10/2008
Mon
06/10/2008
Mon
06/10/2008
Mon
06/10/2008
Mon
06/10/2008
Mon
06/10/2008
Mon
06/10/2008 Event 7
N-nittrosamine Sampling
October 2008 Wed
08/10/08
Wed
08/10/08
Wed
08/10/08
Wed
08/10/08
Wed
08/10/08
Wed
08/10/08
Wed
08/10/08
3.4.2 Sampling Points
Beenyup Wastewater Treatment Plant
Two locations were sampled at Beenyup WWTP; primary and secondary wastewater, sampled using composite samplers. Photos 1 and 2 show samplers used.
Photos 1 and 2: composite samplers used to sample Beenyup WWTP primary and secondary wastewater.
Beenyup Pilot Plant (BBP)
Three sample points were sampled during Events 3 to 6. These were secondary wastewater feed to the pilot plant (SP1), post-MF filtrate (SP6) and post-RO water (SP7). During the last sampling event focussed on N-nitrosamine analysis (Event 7), sampling occurred at 3 additional locations, being the feed water after screening and chemical dosing (ammonia,

27
hypochlorite and sulphuric acid), but prior to MF (SP5), reject water from MF (SP3) and reject water from RO (SP4). Process flow diagram and sampling points at BPP are illustrated in Figure 3.1.1.
Photos 3, 4,5 and 6: Grab and composite sample points in the BPP
Kwinana Water Reclamation Plant (KWRP)
Sampling occurred at 4 locations within KWRP: Raw Feed (Secondary Treated Wastewater – Panel 1), Post-MF (Panel 6), Post-RO (Panel 7), and RO Permeate following covered storage dams (Panel 8). The majority of samples were taken from Panel 1 and Panel 7 representing before and after treatment.
SP6
Auto Samplers
SP1
SP7

28
Photos 7, 8 and 9: Grab and composite sample points in the KWRP plant.
Subiaco WWTP (SWWTP)
Samples were taken of secondary treated wastewater from the existing refrigerated composite sampler on three occasions.
Wanneroo Groundwater Treatment Plant
Samples were taken at Wanneroo Groundwater Treatment Plant to compare groundwater used for drinking water purposes prior to treatment with the final product water from RO treatment. Grab samples were taken from 2 influent lines to the plant on 3 occasions. The influent lines sampled were the Pinjar Borefield Line (W1) and the Wanneroo Borefield Line (W2).
SP6
SP1
SP7

29
Photos 10 and 11: Raw water sample points in the Wanneroo Groundwater Treatment Plant.
Raw water Pinjar Line

30
3.4.3 Sampling Equipment and Procedures
Sampling forms were prepared by the Water Corporation with input from the appropriate laboratory and distributed to all project partners for review. CSIRO used these sheets to order the required bottles (with preservative) from each laboratory. Bottles were then labelled with the laboratory, sample name, date, and analysis, and placed in separate bags or boxes based on the sampling point. The sample sheets were also used as Chain of Custody forms.
All sampling equipment was well rinsed with deionised water before the field trip and sampling beaker and funnels were autoclaved. The probe for measuring the physical parameters was calibrated as per the manufacturer’s specification in the laboratory before sampling began.
Upon arrival at the plant all sample locations were confirmed and sample bottles placed at each sample point. All sample bottles were checked that they were the correct analysis and at the correct sampling point.
3.4.4 Sample Collection
All samples were collected by personnel from CSIRO Land and Water, using appropriate techniques for each analysis (as per NMI Guidelines for Collection and Preservation of Samples, and Australian standards AS/NZS 5667.1, Standards Australia, 1998). The bottles, fill levels and preservation agents were detailed on the sampling sheet and are given in section 3.4.8.
Physical Parameters
Field physical parameters (pH, electrical conductivity, dissolved oxygen, water and ambient temperature and oxidation reduction potential (ORP) were measured using an In-situ Troll 9500 multiparameter probe by passing the flowing water through a flow cell. Once these parameters gave stable readings sampling would commence. This period allowed sampling taps to be flushed prior to collection. Physical parameters could not be taken on samples from autosamplers.
Measurements for total chlorine, free ammonia, chloramine and monochloramine were taken by the Water Corporation during sampling Events 3 to 6 and at a similar time to sample collection from each location. These measurements were conducted using Hach colorimetric methods.

31
Online Parameters
Online parameters varied at different locations throughout each treatment plant. If available, values were recorded at the same time as the field measurements.
Grab Samples
Grab samples were taken from two types of sampling points; sampling taps and manual samples through an autosampler. When samples were collected from taps, the taps were flushed for several minutes before sampling (usually completed during the process of measuring the field parameters). Samples were collected by tilting the bottles underneath the sampling tap to prevent turbulent flow and bottles filled to the required level (shoulder, top, or no headspace). Care was taken not to overflow bottles with a preservative added.
Occasionally, when there was no sample tap available, grab samples were taken using an autosampler. This was the case for secondary wastewater samples at Subiaco WWTP and for some secondary wastewater samples at Beenyup. The occasions were when composite samples were required of secondary treated wastewater as well as MF and RO treated water from the pilot plant, therefore all wastewater samples (composite and grab) were taken from the Beenyup secondary wastewater autosampler. This occurred on 26th September 2007 and 1st April 2008 samplings at Beenyup. The volumes collected by the autosampler in each ‘manual grab sample’ ranged from 200 mL – 600 mL. The sample was collected into a clean, rinsed glass beaker and carefully decanted into the sample bottles.
Composite Samples
Isco Autosamplers were used to collect a set volume every hour over a 24 hour period. Refrigerated autosamplers were used when available to help preserve the samples, with refrigeration at about 3 ˚C. No preservative was added to the bottle prior to sample collection, and as such composite samples were only used for relatively stable analytes. If a refrigerated autosampler was not available, ice bricks were packed around the 20 L sample bottle immediately prior to the first of the sample collections. However, using a maximum-minimum thermometer it was determined that this only marginally reduced the temperature in the sampler. All secondary wastewater samples at KWRP from Event 2 onwards before and after MF were taken with a refrigerated autosampler while RO product water (Panel 7) samples were always taken with a non-refrigerated composite sampler. The collected composite sample was carefully decanted into a clean, rinsed glass beaker and then decanted into the sample bottles. Photos 9 and 10 show the refrigerated ISCO 4700 autosampler and non-refrigerated ISCO 6712 autosampler used respectively.
The autosamplers collected sample through a Teflon-line from a continuous-flow stainless-steel weir arrangement designed to minimise contamination of the sample

32
(Photo 11). The sample weir arrangement was devised as the autosamplers do not easily collect sample from a pressurised line under variable pressure.
Photos 12 and 13: Autosamplers used to collect composite samples: refrigerated Isco 4700 sampler and non-refrigerated sampler used to collect RO permeate samples at KWRP only.
Photo 14: Stainless steel weir used to provide continuous flow for sampling by the autosampler (photo and diagram).
Stainless steel weir
Sample continuous flow through
Teflon sample line
Overflow

33
Sample Preservation
Where preservation agents were required to preserve the analyte prior to analysis, they were added to the bottle (by the laboratory) prior to sample collection (or in the case of composite samples, prior to sub-sample collection). The details of the preservation agents are given in Table 3.4.3 (section 3.4.8) and were according to standard procedures. For bottles containing preservation agent great care was taken not to overfill the bottle and thereby lose preservative.
Comparison of grab and composite samples was made where appropriate to determine whether sample process impacted on measured concentrations. This data is presented in Chapter 6 in Bland-Altman plots. Quenching agent could not be added to the composite samples because they were to be sub-sampled for multiple analytical methods, therefore grab samples were taken where differences were observed between grab and composite samples.
Microbiological Samples
Bottles for microbiological samples were autoclaved by CSIRO Land and Water. Prior to collection the tap was sterilised. This involved flushing the line and tap with sample water to remove any stagnant water (however this was completed through measuring physical measurements and the collection of previous samples). The tap was then turned off and heated using a propane-butane torch to boil any remaining water in the tap. The tap was turned back on to cool the tap and the samples collected. Sample containers were opened immediately prior to collection and care taken to ensure hands or sampling equipment did not touch the interior or lid of the container.
Occupational Health and Safety (OHS)
All OHS requirements were maintained by the CSIRO samplers. Full personal protective equipment (Long Pants, Long Sleeve Shirt, Safety Glasses, Helmets, Steel Capped Boots) were worn as required during each sampling event. Nitrile gloves were worn by samplers at all times during the collection of water and operating of taps, hoses and valves. Samplers were immunised for Hepatitis A and B, Polio, Tetanus and Diphtheria. After sampling had been completed the samplers washed their hands and forearms with an anti-bacterial wash, and clothes were washed separately from private laundry.

34
3.4.5 Sampling Quality Assurance/Quality Control (QA/QC)
The collection of QA/QC samples is essential to ensure the data collected is valid, and to identify any sources of contamination, bias or variability during the collection, handling and analysis of the samples. The following samples and measures were performed as part of the QA/QC program:
Blanks
Field and trip blanks were used on each sampling occasion to determine if there was any contamination through the sampling process, storage and transport. A field blank assesses if there is contamination due to the sampling process. The field blank was either pre-filled with deionised water and was opened at each sampling location, or an empty bottle was filled with deionised water at the points of collection of the most contaminated water (e.g. secondary treated wastewater or primary treated wastewater).
Trip blanks determine if the samples have been affected by gross contamination through transport and storage. These blanks were handled in the same way as all other samples and field blanks, however they were pre-filled with deionised water at the laboratory and not opened until analysed.
Replicates/Spikes
Replicates are multiple samples taken simultaneously with its associated sample, using the same sampling procedure. These samples are seen to be identical and give information regarding the heterogeneity and reproducibility of sampling. Replicate samples were analysed from each sampling point during the project.
Spiked samples are collected at the same time as its associated sample using the same sampling procedure. These samples have a spike mixture of a known concentration added to the collected sample to assess the degradation or formation of the target analyte after collection. Spiked samples were analysed for some pharmaceuticals and for N-nitrosamine compounds.
Chain of Custody (CoC)
CoC forms track the possession and handling of a sample from collection through to analysis. The sampling forms acted as CoC forms. After sampling had concluded, all sample bottles were accounted for, and copies of the sampling sheets were delivered

35
to each laboratory with samples. These were signed by the receiving laboratory confirming delivery.
Storage and Transport
Samples that required being stored at 4 °C were packed into an esky with frozen ice bricks. Samples that did not require immediate cold storage were packed into boxes and kept in the shade. All bottles were packed with bubble wrap or cardboard to help prevent damage. Samples were generally delivered to the laboratories on the afternoon of collection. In circumstances when samples could not be delivered on the day of collection, they were stored overnight in the CSIRO cool room at 4 °C, and delivered the following day.
RO Microbiological Challenge Sampling
A challenge test on the RO membranes was performed on 9th January 2008 at the BPP to test the integrity of the membranes. This involved adding approximately 105-106 plaque forming units (pfu/mL) of the coliphage MS2, to the RO Feed Tank. Coliphage is a virus that can infect bacteria and is used as an indicator on how human viruses would behave through membrane treatment. Samples were taken from the RO Feed Tank, post-RO water and the secondary treated wastewater was sampled initially to test for presence or absence of phage entering the Pilot Plant.
Aseptic sampling methods were used with the sampling tap being sterilised by flaming, prior to each sample been taken and gloves being changed after every sample was collected. The person adding the coliphage to the RO feed tank had no involvement with the sampling to prevent any possible contamination (see Appendix 4 for details). Grab samples from before and after treatment were taken by different people to prevent any cross contamination. The RO feed tank sample was a direct sample from the tank, the bottle was submerged at least 10 cm below the water surface, and the bottle gently tilted to allow the bottle to fill. Samples were taken at timed intervals after the phage were added, with field blanks being opened as each sample was collected.
3.4.6 Contingencies
All attempts were made to ensure sampling occurred smoothly, however unforseen situations occurred which resulted in sampling difficulties. In some situations this resulted in delaying of sampling, and project partners were informed and involved in re-scheduling. In less severe circumstances samplers used their judgement on how to proceed.
On occasions the feed water pump station or the treatment plant were not operating. Samplers contacted plant operators to attempt to rectify the situation. However at times autosamplers had not collected full 24 hour composite samples. The volume

36
collected dictated how the sample event progressed. If sufficient sample was collected the event continued with notes made on volume collected and any analysis missed or samples not collected as required (i.e. rinsing did not occur). On 1 occasion due to plant failure, the event was delayed several days.
Situations occurred where bottles were broken. If a spare bottle was available a replacement sample was taken. An incident occurred when transporting samples to CCWA where the majority of pesticide samples were damaged due to a near car accident. CCWA were informed when the remaining bottles were delivered, and replacement pesticide samples were collected several days later.
Lids were dropped during sampling at times. This was documented on the sampling sheet and the lids were thoroughly rinsed with the sample water. This process was not used for microbiological samples. If there was any possibility of contamination of microbiological samples having occurred then replacement bottles were used.
3.4.7 Operational Conditions during Sampling
Beenyup WWTP & Pilot Plant
Beenyup WWTP was operating normally and near capacity, with sludge retention times in the range of 10-15 days most of the time.
BPP RO recovery was initially set at about 70% during commissioning. This was maintained in operation until 12th May 2008, when recoveries were increased to just under 80%.
Control of chloramination at the Pilot plant was not tight, as there was no feedback based on influent ammonia concentrations. Hypochlorite dose levels were set manually, and with plant operator attendance usually only twice per week, this meant that the plant was more frequently stopped due to ORP out of specification than would be normal.
Operational data for Beenyup WWTP and BPP is reported in Chapter 5.
Subiaco WWTP
Subiaco WWTP was operating normally during the sample events (see Chapter 5 for report of operational data).
Woodman Point WWTP
Woodman Point WWTP was operating normally during the sample events (see Chapter 5 for report of operational data).

37
KWRP
KWRP was operating normally during the sample events. There were some periods of low customer demand during the sampling period, so in order to allow composite sampling to be conducted, storage dam levels had to be dropped to allow continuous plant running during sample events.
Sample Event 2 was conducted later than initially planned as there were upgrade works occurring on the MF system. This upgrade work involved re-coating of the MF tanks, and may well have resulted in significant increases in related chemicals in the treatment plant atmosphere and indeed in the water being treated. Event 2 was scheduled and coincided with a weeks break in the work.
RO clean in place (CIP) events occurred at KWRP at the dates before sample events outlined in Table 3.4.2.
Table 3.4.2: KWRP RO CIPs prior to sample days
Sample Event 1: 2006 2: 2007 3: 2007 4: 2008 5: 2008 6: 2008
Sample Dates 29/11 3,5,14/12
30/05 4,7/06
21, 24, 28/09
22, 24/01 31/03 04/04
6, 9/06
Date of previous CIP
6/11/06 21/05 23/05
20/09 11/01/08 18/03 30/05
Character of CIP
Caustic Acid & Caustic
Caustic & EDTA
Caustic Caustic Caustic
3.4.8 Laboratories & Samples Analysed
Six different laboratories received samples for analysis of different parameters, or for QA/QC procedures occasionally the same parameters were analysed by more than one laboratory. The analysing laboratories were Curtin University analysing organic chemicals; Chemistry Centre WA analysing metals and pesticides; SGS analysing nutrients, major ions and physical parameters; National Measurement Institute analysing cyanide, hexavalent chromium and dioxins as well as QA/QC analyses; CSIRO analysing microbiological parameters; ARPANSA and Radiation Health WA analysing gross alpha and gross beta particle activity. Water Corporation and

38
CSIRO conducted field analyses. UWA organised samples for a bioassay for cytotoxicity and genotoxicity assessment to be conducted by the Australian Water Quality Centre (AWQC) in Adelaide (see Chapter 7). For each laboratory, the samples collected are tabulated in the following tables (Table 3.4.3). The details of the specific analytes quantified are given in the appropriate Results chapter. Details of sample preservation are given in the methods detailed in Appendix 4 but were generally added to sample bottles (or composite sub-sample bottles) prior to sample collection.
Table 3.4.3: Participating Laboratories and samples analysed
Curtin
Analysis Type Volume
(mL) Container Rinse Fill Preservation
Pharmaceuticals Comp 1 x 4000 Glass No Top 100 mg/L
sodium azide
Nitrosamines Grab 1 x 1000 Glass No No
Headspace 20 mg/L
ascorbic acid
Complexing Agents
Comp 1 x 250 Glass No Top 1% methanol
(2.5 mL)
Phenols Comp 1 x 60 Glass No Top 50 mg/L
sodium sulfite
PAHs Comp 1 x 60 Glass No No
Headspace 10% methanol
(6 mL)
VOCs and THMS Grab 1 x 40 Glass No No
Headspace 25 mg/L
sodium sulfite Halogenated DBPs -Other
Grab 1 x 60 Glass No No
Headspace 50 mg/L
ascorbic acid Halogenated DBPs - HAAs
Grab 1 x 60 Glass No No
Headspace 25 mg/L
sodium sulfite Dioxane and
MTBE Grab 1 x 40 Glass No
No Headspace
Nil
Inorganic DBPs (Anions)
Grab 1 x 130 Plastic No Top Nil
Acrolein and Acrylamide
Comp 1 x 60 Glass No No
Headspace Nil
Hormones Comp 1 x 1000 Glass No Top 100 mg/L
sodium azide

39
SGS
Analysis Type Volume
(mL) Container Rinse Fill Preservation
Comp 1000 LDPE Yes x 3 Top Chilled Nutrients; FRP
Comp 125 LDPE Yes x 3 Top Filtered 0.45 µm; chilled
Bromide Comp 125 LDPE Yes x 3 Shoulder Chilled Fluoride Comp 125 LDPE Yes x 3 Shoulder Nil
Comp 500 LDPE Yes x 3 No
Headspace Chilled
Major Ions; Phosphate; TOC; TSS Comp 125 LDPE Yes x 3 Shoulder Chilled
BOD5; COD Comp 1000 LDPE Yes x 3 Shoulder Chilled
NMI
Analysis Type Volume
(mL) Container Rinse Fill Preservation
PCBs-Dioxins Comp 1000 Glass No Top Nil
Cyanide Comp 500 Black Plastic
No Top Add 2 Pearls of NaOH (for H2S)
Chromium total & hexavalent
Grab 125 Plastic No Top Acid
QA/QC: erythromycin, roxythromycin,
sulfamethoxazole, nonylphenol, octylphenol,
Estriol, Ethinyl
estradiol, 17β- estradiol, Estrone
Grab 2000 Glass Nil
CCWA
Analysis Type Volume
(mL) Container Rinse Fill Preservation
Metals -Unfiltered
Comp 1 x 250 Plastic No Top Nil
Pesticides Comp 1 x 4000 Glass No Top Nil
Mercury - Filtered
Comp 1 x 250 Glass No Top Dichromate + Nitric, Filtered

40
ARPANSA
Analysis Type Volume
(mL) Container Rinse Fill Preservation
Radiation: Gross
alpha and beta
Grab 1 x 1000 Plastic No Top Nitric Acid
Radiation Health WA
Analysis Type Volume
(mL) Container Rinse Fill Preservation
Radiation: Gross
alpha and beta
Grab 1 x 1000 Plastic No Top Nitric Acid
Water Corporation
Analysis Type Volume
(mL) Container Method Preservation
TCl (mg/L) Grab n/a n/a Hach Chlorine
Pocket Colorimeter n/a
Free NH3 Grab n/a n/a
Hach Monochloramine and
Free Ammonia Pocket Colorimeter
n/a
Mono-chloramine
Grab n/a n/a
Hach Monochloramine and
Free Ammonia Pocket Colorimeter
n/a
UWA/AWQC
Analysis Type Volume
(mL) Container Rinse Fill Preservation
Bioassays Grab 200 Winchester glass bottle
Yes x 3
Top 20 mg/L
Ascorbic Acid; Chilled

41
CSIRO
Microbiological Parameters
Analysis Type Volume
(mL) Container Rinse Fill Preservation
Enteric Viruses Grab 5000 HDPE No Top Autoclaved,
Chilled Thermotolerant
Coliforms Grab 500 Glass No Top
Autoclaved, Chilled
Enterococci faecalis
Grab 500 Glass No Top Autoclaved,
Chilled
Bacteriophage Grab 10000 HDPE No Top Autoclaved,
Chilled
CSIRO
Field Parameters
Analysis Type Volume
(mL) Container Probe Fill Preservation
Temperature (°C)
Grab Flow Cell
n/a In-situ Troll 9500
n/a n/a
pH Grab Flow Cell
n/a In-situ Troll 9500
n/a n/a
DO (µg/L) Grab Flow Cell
n/a In-situ Troll 9500
n/a n/a
Electrical Conductivity
(µS/cm) Grab
Flow Cell
n/a In-situ Troll 9500
n/a n/a
ORP (mV) Grab Flow Cell
n/a In-situ Troll 9500
n/a n/a
Ambient Temperature
(°C) Grab
Flow Cell
n/a In-situ Troll 9500
n/a n/a

42
Each laboratory reported data with a limit associated with the analytical method, but three different approaches were used. Chemistry Centre and NMI reported data with a limit of reporting (LOR). Curtin reported data with a limit of detection (LOD) except for the pharmaceuticals group which was reported with a limit of quantitation (LOQ).
3.5 Analytical Methods
Analytical methods were developed for analysis of each chemical group by each laboratory as outlined in Table 3.5.1. A summary of the analytical method is outlined in the relevant Results Chapter for each chemical group, and a full method outline is given in Appendix 4. Some analytical methods were available as NATA accredited methods, but most were not, so significant levels of quality assurance/quality control sampling and analysis were entered into to validate the methods (See Chapter 4).
Table 3.5.1: Type of analytical method used to analyse each chemical group.
Laboratory Analyte Method
Curtin University VOCs Purge and trap GC-MS
Halogenated DBPs -Trihalomethanes Purge and trap GC-MS
Halogenated DBPs - Haloacetic acids LLE and derivitisation GC-MS
Halogenated DBPs - Other LLE-GC-MS
Inorganic DBPs (Anions) IC
N-nitrosamines SPE-GC-MS
PAHs SBSE-GC-MS
Phenols Derivitisation and SBSE-GC-MS
Hormones SPE-LC-MS/MS
Complexing Agents LLE and derivitisation GC-MS
Pharmaceuticals SPE-LC-MS/MS (4 methods)
Miscellaneous SPME-GC-MS, SBSE-GC-MS, LLE and derivitisation GC-MS, Derivitisation and SBSE-GC-MS
NMI Dioxins HRGC/HRMS
PCBs HRGC/HRMS
Metals ICP-OES; colorimetric
Total cyanide Acid distillation/colorimetric
Selected hormones and antibiotics for comparison with Curtin results
LC-MS
Estrogens PFPA Derivitisation followed by Electron Impact-Selected Ion Monitoring
Chemistry Centre Pesticides GC-ECD/NPD or GC-MS

43
Mercury Cold vapour generation atomic absorption (CVAAS)
Metals Inductively coupled plasma atomic emission spectroscopy (ICPAES) or inductively coupled plasma mass spectrometry (ICPMS).
Radiation Preparation
Radiation Health WA Gross α and gross β particle activity Gas flow proportional counting
ARPANSA Gross α and gross β particle activity Gas flow proportional counting ERH_RAS_SOP_0100
SGS Standard wastewater parameters Various see Appendix 4
3.6 Data Management
Electronic and hard copies of all raw instrumental and quantification data were stored by the analysing laboratory. Both Electronic and hard copies of the final sample results were sent to DoH and UWA who entered it into a database and periodically forwarded the database to Water Corporation for back-up. The database and hard copy data was retained in two separate locations, one at the Department of Health and the other at the Water Corporation. Towards the end of the project, data was audited either in full or randomly. Additional focus was given to any specific anomalies picked up during data analysis.
3.7 Data Analysis
All data was entered in Excel and analysed in Stata version 10 (Stata Corp, 2007). After excluding trip blanks, field blanks and replicated samples, samples were analysed and results are presented in Chapter 6. When grab and composite samples were collected during the same date and location, composite samples were selected for the analysis as they represent the average chemical concentration of the day. For the May-June 2007 sampling event, no samples were taken from the secondary treated wastewater but instead samples were taken after MF. Therefore, analytes detected after MF were included in the analysis of the wastewater characterisation as the analyses were of the dissolved fraction of the wastewater, and these analytes were not removed or were only partially removed by MF.
Data is presented for each chemical group as percentage detection and median concentrations in wastewater and post-RO water. Analysis by WWTP and by season was also conducted. Different chemical groups were measured with different analytical equipment which had different levels of sensitivity, and therefore the lowest concentration detectable varied between chemicals. Analytical method limit of detection influenced percentage detection calculations as well as other statistics. Calculation of median concentrations incorporated all data points including samples

44
<LOD which were assumed to be equal to the LOD for the purposes of the calculation.
Treatment efficiency was calculated for analytes detected in the secondary effluent. Samples taken before and after RO were matched for plant, date, and type of sample (grab or composite) to calculate the removal efficiency for each analyte. Treatment efficiency was calculated as a percentage of removal from secondary treated wastewater (WW) using the concentration detected after reverse osmosis ([RO]), as seen in the equation below. For those parameters reported below LOD (or LOR or LOQ) after RO, the efficiency was calculated assuming a concentration equal to half the LOD as a conservative estimate. In these cases efficiency calculation will be strongly influenced by the concentration measured in secondary wastewater. Where concentrations in secondary wastewater were close to the LOD then the calculated removal is likely to be a significant underestimate.
% Removal =
Efficiency is reported using box-plots which are explained below in the statistical methods section.
Treatment efficiency was used to identify chemical indicators of RO treatment performance. Following Drewes et al. (2008), in this study an indicator has been defined as an individual chemical occurring at quantifiable level, which represents certain physicochemical and biodegradable characteristics of trace constituents relevant to fate and transport during treatment. Indicators can be used to regularly validate treatment performance without the need to monitor all chemicals of concern. Indicators were selected considering percentage detection in secondary wastewater, concentration and percentage removal by MF/RO treatment.
Screening health risk assessment was conducted by calculating risk quotients for secondary wastewater and post-RO water. RQ(max) used the maximum concentration measured for each analyte, while RQ(median) uses the median concentration measured for each analyte, including all non-detects which were reported as the LOD. In the case where a chemical was never detected RQ(median) was calculated based on the LOD or the median LOD where there was different LODs for different sampling events.
3.8 Statistical Methods
Median concentration (rather than the ADWG standard of average) is reported for all analytes unless otherwise specified because it is less affected by extreme values (outliers) and because most of the parameters did not follow a normal distribution. The presentation of a median value is also more representative than an average could be for parameters that were not always detected but were detected more than 50% of the time. Analyte concentrations comparison between plants was performed
[W W ] - [R O ]
[W W ]
x 1 0 0[W W ] - [R O ]
[W W ]
x 1 0 0

45
using Kruskal Wallis, a non-parametric test, and proportions (% detections) were analysed using the Chi square test. The significant level of all statistical tests was set at 5% (K-Wallis p<0.05).
Treatment efficiency is illustrated using box plots. The box plot displays the median, the upper and lower quartiles and the minimum and maximum data values as depicted in Figure 3.8.1.
Figure 3.8.1: Box plot example representing the median, lower quartile (Q1), upper quartile (Q3), minimum and maximum values
Bland-Altman scatter plots were used for the analysis of agreement (Altman, 1983). The x axis shows the mean of the results of the 2 methods or measurements ([A+B]/2), whereas the y axis represents the difference between the 2 methods or measurement (B-A). Figure 3.8.2 represents a Bland-Altman plot with a random scatter of points between the upper and lower confidence limits, indicating that the 2 measures are measuring the same thing in an unbiased way. If there is a pattern to the points, there might be some bias associated with the measures. The level of agreement between grab and composite samples was analysed matching by date, location and sampling point and the results are illustrated using Bland-Altman plots.
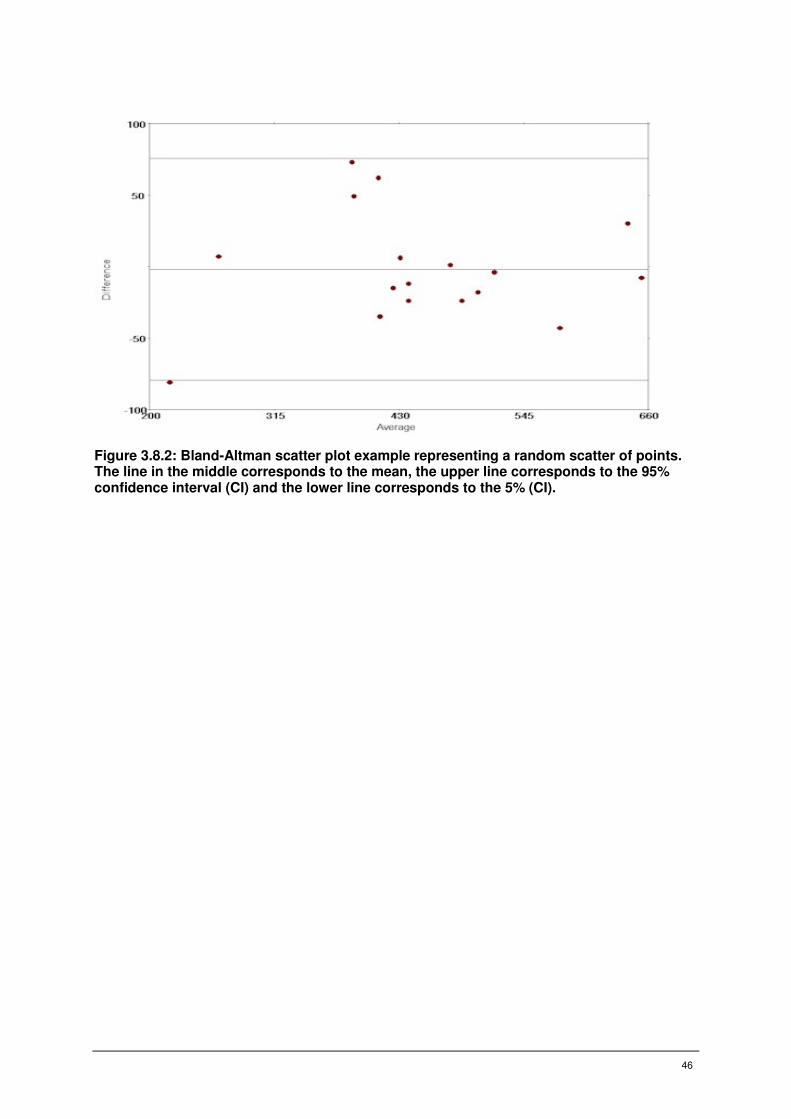
46
Figure 3.8.2: Bland-Altman scatter plot example representing a random scatter of points. The line in the middle corresponds to the mean, the upper line corresponds to the 95% confidence interval (CI) and the lower line corresponds to the 5% (CI).
47
4 Analytical Quality Assurance/Quality Control (QA/QC)
A Quality Assurance (QA) program was implemented to ensure data produced by the project was reliable and of good quality. NMI provided the QA/QC coordination to the project. A number of publications and guidelines were taken into consideration and applied for the benefit of the project, including Australian Standards for test methods (Standards-Australia, 1990) and laboratory operation (Standards-Australia, 2005), and standard methods for the analysis of water and wastewater (Eaton et al., 2005).
Typically a QA program might include: a quality system, a suitable laboratory environment, trained and skilled staff, training procedures and records, suitably maintained and calibrated equipment, quality control procedures, documented and validated methods, traceability and measurement uncertainty, checking and reporting procedures, preventive and corrective actions, proficiency testing, internal audit and review procedures, and complaints procedures.
The PCRP QA program incorporated both sampling and analytical procedures and included:
• Identification of contamination by the inclusion of trip, field and laboratory blanks.
• Estimation of sample homogeneity and sampling reproducibility by the inclusion of field replicates.
• Estimation of analytical accuracy and analyte recovery using appropriate methods (e.g. external calibration, internal standard addition, laboratory performance check samples, analysis of spiked samples)
• Validation of analytical methods using accepted quality control procedures and inter-laboratory testing
• Provision of basic measures of data quality including Limits of Detection and Quantitation, and method precision.
4.1 Sampling QA
Sample Bottles
Bottles for sampling were cleaned by methods appropriate for each analytical method. Sample preservatives were added to some containers in order to preserve specific analytes against degradation before analysis. The details of the preservatives used are in Section 3.4.8. Specific details of sample bottles used by

48
Curtin are listed in CWQRC Sampling Standard Operating Procedure (SOP) 01 (WQSP01-1a), in Appendix 4. Specific details of the preservatives, sampling and bottles were provided by NMI are listed in the document “Guidelines for Collection and Preservation of Samples”, also in Appendix 4. Details of CCWA sample containers and preservatives are detailed in each individual method (Appendix 4), while bottles for analytes measured by SGS were provided by CSIRO.
Field and Trip Blanks
Field and trip blanks monitor contamination during sampling and were collected during each sampling event. Trip blanks are sealed bottles of water that are transported along the field trip to each site but are not opened. Field blanks are treated in the same manner as samples, but bottles are filled with water, instead of sample on site.
Preparation for field blanks
One field blank was taken at each sample site, for each analytical method. Field blanks were routinely analysed alongside samples and used to if any contamination has occurred in the field or during transportation of the empty sample bottles. Curtin provided filled field blanks bottles for all Curtin analysis and for pesticide samples by CCWA. The ultra-pure water provided by Curtin was purified by ion exchange, and then polished using reverse osmosis, UV light and microfiltration. Pre-filled field blanks were opened at the pre-micro filtration sampling locations. For all other analytes, bottles, cleaned and prepared in the same manner as the sampling bottles, were filled on site with de-ionised (DI) water purified by ion exchange, supplied from CSIRO, and transported in clean pre-rinsed 20 L glass containers.
Preparation of trip blanks
One trip blank was collected for each trip, for each analysis method. Trip blanks were not routinely analysed, but are instead kept as a back up monitor, should either field blanks or samples demonstrate unreasonably high analyte concentrations or persistent contamination. Sampling bottles for analytes by Curtin and pesticides analysed by CCWA were supplied pre-filled by Curtin, using ultra-pure water. All other samples analysed by CCWA were filled with deionised water, purified by ion exchange, and supplied by CCWA. Sampling bottles for NMI and SGS were filled with de-ionised water from CSIRO, and then sealed and transported along side the samples during the field trip. The trip blank bottles were not opened during the trip.
Sample Homogeneity
To ensure that comparison of trends in different chemical parameters is valid, it is important that all sub-samples delivered to individual analytical laboratory are representative of the original bulk sample. Composite samples were collected in

49
either a single 20 L container or four 10 L containers, over a twenty-four hour period. Sample homogeneity before sub-sampling was ensured by swirling the container.
Grab samples were collected for those analytes in which concentration is time dependent and therefore unsuitable for composite sampling. Sampling occurred directly from the sampling port, with each bottle filled in succession. While it is possible that there were temporal changes to the water during this time, generally sampling in this manner took about 10 minutes (or 25 minutes if duplicate samples were being taken), which is a short timescale compared to the processes occurring within the plant. Therefore the samples are considered representative snapshot, whilst also ensuring minimal analyte loss.
Field Replicates
Field replicates are two or more samples taken simultaneously at the same site, representative of the same environmental conditions. They provide information about environmental heterogeneity and the reproducibility of field sampling. Unfortunately replicate sampling of all samples was impractical because of the total number of samples and analytes collected, as well as limitations on the total volume of sample collected by the compositing autosamplers. Replicate samples were, however, taken in Events 4, 5 and 6 of both secondary wastewater (12% of samples) and post-RO water (8% of samples), and at both BPP and KWRP.
Although they were not true replicates, there was some overlap in sample results when: both grab and composite samples were analysed for a particular sample location and day; when secondary wastewater and post-MF samples were both analysed for dissolved parameters not affected by chloramination; and when during sample Event 1 treated water was sampled and analysed from both of Panels 7 and 8 at KWRP. Panels 7 and 8 monitor treated water before and after storage, but can largely be expected to give similar quality.
4.2 Analytical QA
NMI is NATA accredited laboratory, while SGS uses NATA-accredited methods and therefore already have QA programs in place for the analyses they undertook for the project. During the project Curtin and CCWA developed an in-house QA program for its analytical methods, which were all developed specifically for the project. In addition to concentration data, each laboratory calculated method uncertainty, limits of reporting, precision, and bias or accuracy.
Method Validation
Some analytical methods used during the project were already NATA accredited and therefore were validated in accordance with NATA requirements for accreditation.

50
However, some methods, particularly those used by Curtin and CCWA, were developed specifically for the project and did not achieve accreditation during the lifetime of the project. While accreditation was not undertaken, all methods underwent validation during the project, which incorporated:
• Documentation in a Standard Operation Method (SOM), which reports on acceptable criteria for method precision (repeatability) and bias (recovery), the range of linearity, method detection limits and uncertainty budgets. The robustness of the method, the effect of variations in certain parameters, and method sensitivity and selectivity may also be incorporated.
• Where appropriate capabilities exist, methods were tested by inter-laboratory testing for validation. The inter-laboratory testing schemes are documented in section 4.3.
Curtin also ensured that developed methods are scrutinized through appropriate peer review processes including consultation with leading international experts and publication of methods in peer reviewed journals, as listed in Appendix 7.
Ongoing Quality Control
As well as initial method validation, all project partners provided data quality including limits of reporting, and method precision, and bias for results for individual sampling events.
Typical quality control measures included in each analytical batch included:
• Use of certified and in-house reference materials;
• Regular inclusion of blanks, spiked samples, duplicates and check samples
• Routine linearity and calibration checks for all instruments;
• Careful and appropriate preparation and storage of all reference standards.
• Recoveries processed with analytical batches;
• Use of surrogate standards to monitor analytical performance, matrix effects and method specificity.
4.3 Inter-laboratory Testing
Inter-laboratory testing was used to aid method validation where possible. Inter-laboratory tests were organised by Curtin during Event 2 (May-June 2007) for selected antibiotics and pharmaceuticals. A NATA-accredited proficiency test for 3 N-nitrosamines, a group identified to be of particular interest during the project, was

51
undertaken through Proficiency Testing Australia in March 2008. This test was limited, however, because the sample supplied had a deionised water matrix and analyte concentrations about 3 orders of magnitude greater than those measured in the PCRP project. An additional N-nitrosamine inter-laboratory test was therefore organised by Curtin and undertaken during PCRP Sampling Event 6 (June 2008) for measurement of realistic concentrations in wastewater and RO water, with participation of 2 external laboratories, Queensland Health Scientific Services, and the Australian Water Quality Research Centre (SA). An inter-laboratory test for the DBP anions (chlorate, chlorite and bromate) was also organised by Curtin for Event 6, and involved Curtin University, NMI and CCWA. However, instrumental difficulties at both NMI and CCWA in the week of sampling meant that analysis was delayed and results were compromised because of analyte degradation.
Further details of each test follow.
Sampling Event 2 (June 2007): Inter-laboratory Testing for Pharmaceuticals and
Antibiotics
Participants:
Curtin Water Quality Research Centre (Curtin), National Measurement Institute (NMI), and DVGW-Technologiezentrum Wasser, Karlsruhe, Germany (Sacher).
Method:
QA/QC samples (selected samples from Event 2) were received by Curtin. Samples were preserved with sodium at a final concentration of ~100 mg/L, added to bottles immediately after sample collection. Aliquots (1 L) were then forwarded to NMI and Sacher. Samples were wrapped in aluminium foil to exclude light and packed in insulated containers with ice packs to ensure samples remain as cool as possible during transit. Up to eight antibiotics and four hormones were measured. Analytes measurable by all three participants were: three antibiotics (erythromycin-H2O,
roxythromycin, and sulfamethoxazole) and three hormones (ethinyl estradiol, 17β-estradiol, and estrone)
Results:
The concentrations measured by the three groups are presented anonymously in the tables below. Results from Curtin are identified as laboratory 2. While there is insufficient data to perform a statistical analysis, generally there was very good agreement between results. Limits of detection varied because of differences in sample preparation and instrumentation used by each participating laboratory.

52
Table 4.3.1: Results of inter-laboratory testing of Antibiotics and Hormones.
K=KWRP, W1=groundwater, B=Beenyup, S=Subiaco WW=secondary wastewater, P6=post-MF,
P7=post-RO, Comp=composite, G=grab
Antibiotics
Azithromycin Clarithromycin Erythromycin-H2O
Lab 1 Lab 2 Lab 3 Lab 1 Lab 2 Lab 3 Lab 1 Lab 2 Lab 3
Sample ID ng/L ng/L ng/L ng/L ng/L ng/L ng/L ng/L ng/L
W1_G_240507 < 50 ND ---- < 50 <50 ---- < 50 <50 <25
K_P6_G_040607 < 50 ND ---- 110 268 ---- 290 360 340
K_P7_G_040607 < 20 ND ---- < 20 <20 ---- < 20 <20 <25
K_P6_G_070607 < 50 ND ---- 110 224 ---- 330 397 340
K_P7_G_070607 < 10 ND ---- < 10 <20 ---- < 10 <20 <25
B_WW_Comp_120607 68 ND ---- 170 282 ---- 1000 932 750
S_WW_Comp_190607 160 ND ---- 200 289 ---- 1100 928 920
K_P6_Comp_300507 ---- ND ---- ---- 208 ---- ---- 332 320
K_P7_Comp_300507 ---- ND ---- ---- <20 ---- ---- <20 <25
Sulfamethoxazole Clindamycin Metronidazol
Lab 1 Lab 2 Lab 3 Lab 1 Lab 2 Lab 3 Lab 1 Lab 2 Lab 3
Sample ID ng/L ng/L ng/L ng/L ng/L ng/L ng/L ng/L ng/L
W1_G_240507 < 50 <50 <2 < 50 <45 ---- < 50 <25 ----
K_P6_G_040607 680 576 390 < 50 <45 ---- < 50 <25 ----
K_P7_G_040607 < 20 <5 <2 < 20 <5 ---- < 20 <15 ----
K_P6_G_070607 620 666 380 < 50 <45 ---- < 50 <25 ----
K_P7_G_070607 < 10 <5 <2 < 10 <5 ---- < 10 <15 ----
B_WW_Comp_120607 390 397 320 62 52 ---- 51 61 ----
S_WW_Comp_190607 540 543 440 65 49 ---- 74 71 ----
K_P6_Comp_300507 ---- 491 410 ---- <45 ---- ---- <25 ----
K_P7_Comp_300507 ---- <5 <2 ---- <5 ---- ---- <15 ----
Roxithromycin Trimethoprim
Lab 1 Lab 2 Lab 3 Lab 1 Lab 2 Lab 3
Sample ID ng/L ng/L ng/L ng/L ng/L ng/L
W1_G_240507 < 50 <50 <50 < 25 <25 ----
K_P6_G_040607 220 375 370 290 326 ----
K_P7_G_040607 < 20 <1 <50 < 10 <5 ----
K_P6_G_070607 240 386 340 310 402 ----
K_P7_G_070607 < 10 <1 <50 < 5 <5 ----
B_WW_Comp_120607 240 299 290 140 168 ----
S_WW_Comp_190607 340 346 380 420 486 ----
K_P6_Comp_300507 ---- 341 310 ---- 454 ----
K_P7_Comp_300507 ---- <1 <50 ---- <5 ----

53
Hormones
Ethinyl estradiol (EE2) 17ββββ-estradiol (E2)
Lab 1 Lab 2 Lab 3 Lab 1 Lab 2 Lab 3
Sample ID ng/L ng/L ng/L ng/L ng/L ng/L
W1_G_240507 < 5 <50 <10 < 5 <20 <10
K_P6_G_040607 < 5 <50 <10 < 5 <20 <10
K_P7_G_040607 < 1 <5 … < 1 <2.5 …
K_P6_G_070607 < 5 <50 <10 < 5 <20 <10
K_P7_G_070607 < 1 <5 … < 1 <2.5 …
B_WW_Comp_120607 < 5 <50 <10 < 5 <20 <10
S_WW_Comp_190607 < 5 <50 <10 < 5 <20 <10
Estrone (E1) Estriol (E3)
Lab 1 Lab 2 Lab 3 Lab 1 Lab 2 Lab 3
Sample ID ng/L ng/L ng/L ng/L ng/L ng/L
W1_G_240507 < 5 <20 <10 < 5 <20 …
K_P6_G_040607 < 5 <20 <10 < 5 <20 …
K_P7_G_040607 < 1 <2.5 … < 1 <2.5 …
K_P6_G_070607 11 <20 <10 < 5 <20 …
K_P7_G_070607 < 1 <2.5 … < 1 <2.5 …
B_WW_Comp_120607 < 5 <20 <10 < 5 <20 …
S_WW_Comp_190607 < 5 <20 14 < 5 <20 …
PT:A Nitrosamine Proficiency Test (March 2008)
Curtin University participated in Proficiency Testing Australia (PT:A) Waters Proficiency Testing Sub-program 99 'Nitrosamines' in March 2008. Full details of the results can be found in PT:A report number 573 (PTA, 2008).
Three N-nitrosamines were tested; N-nitrosodimethylamine (NDMA), N-nitroso-n-propylamine (NDPA) and N-Nitrosodiphenylamine (NDPhA), using a water sample provided to PT:A by the New York State Department of Health (NYDoH), Wadsworth Centre for Laboratories and Research. The ampoule provided to Curtin required
1000-fold dilution with reagent grade water before analysis for µg/L levels. A total of 12 Australian laboratories and 1 overseas laboratory took part in the program. PT:A provided a list of summary statistics, including the z-score, which gives a measure of how far a result is from the consensus value (i.e., the median of all reported results). Ideally the z-score should lie as close to 0 as possible. Any z-score with an absolute value greater than 3 is considered an outlier.
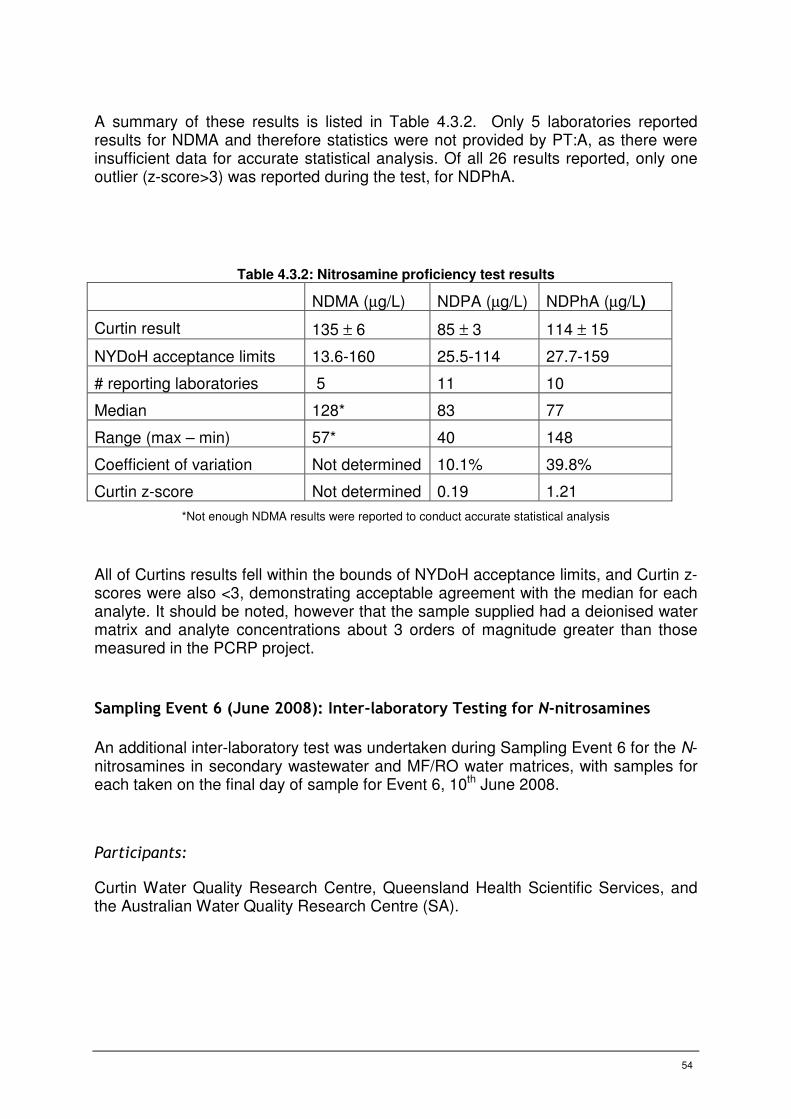
54
A summary of these results is listed in Table 4.3.2. Only 5 laboratories reported results for NDMA and therefore statistics were not provided by PT:A, as there were insufficient data for accurate statistical analysis. Of all 26 results reported, only one outlier (z-score>3) was reported during the test, for NDPhA.
Table 4.3.2: Nitrosamine proficiency test results
NDMA (µg/L) NDPA (µg/L) NDPhA (µg/L)
Curtin result 135 ± 6 85 ± 3 114 ± 15
NYDoH acceptance limits 13.6-160 25.5-114 27.7-159
# reporting laboratories 5 11 10
Median 128* 83 77
Range (max – min) 57* 40 148
Coefficient of variation Not determined 10.1% 39.8%
Curtin z-score Not determined 0.19 1.21
*Not enough NDMA results were reported to conduct accurate statistical analysis
All of Curtins results fell within the bounds of NYDoH acceptance limits, and Curtin z-scores were also <3, demonstrating acceptable agreement with the median for each analyte. It should be noted, however that the sample supplied had a deionised water matrix and analyte concentrations about 3 orders of magnitude greater than those measured in the PCRP project.
Sampling Event 6 (June 2008): Inter-laboratory Testing for N-nitrosamines
An additional inter-laboratory test was undertaken during Sampling Event 6 for the N-nitrosamines in secondary wastewater and MF/RO water matrices, with samples for each taken on the final day of sample for Event 6, 10th June 2008.
Participants:
Curtin Water Quality Research Centre, Queensland Health Scientific Services, and the Australian Water Quality Research Centre (SA).

55
Method:
Bulk (4 L) grab samples were taken from Beenyup WWTP. Two samples were taken at SP1 (secondary wastewater) and one sample was taken at SP7 (tertiary wastewater, treated by MF/RO), as well field and trip blanks. Samples were preserved with ascorbic acid at a final concentration of ~20 mg/L, added to bottles before sample collection. Upon delivery to Curtin, sub-samples were taken from each bulk 4 L sample and poured into 1 L amber bottles. At their request, Queensland Health samples had additional preservation added (80 mg/L Na2S2O3 final concentration) to each 1 L bottle before the sample was added. One of the duplicate SP1 samples was spiked with a stock N-nitrosamine standard for a final concentration of ~100 ng/L. The volume in the 4 L Winchester was not exact, but is estimated to be 4.15 - 4.25 L, making final spike concentration between 114 and 120 ng/L.
Participating laboratories received four samples: a field blank (B_FB_100608), as secondary wastewater (B_SP1Grab_100608) a spiked secondary wastewater (B_SP1GrabS_100608) and a tertiary wastewater, treated by MF/RO (B_SP7Grab_100608). Samples were sent by overnight delivery, wrapped in aluminium foil to exclude light and packed in insulated containers with ice packs to ensure samples remained as cool as possible during transit. While up to 9 different N-nitrosamines were measured, the only one measured by all three laboratories was NDMA
Results:
The concentrations measured by the three laboratories are presented anonymously in the table below. Results from Curtin are presented as Laboratory 1. Generally, N-nitrosamine concentrations in unspiked samples collected for the inter-laboratory trial were lower than for previous sampling events. While using secondary and tertiary treated wastewater samples should provide a realistic overview of analytical capabilities, the large number of analytes at, or close to, the detection limit meant relatively few data were available to assess proficiency. It may be better if future round robin comparisons used water from KWRP where N-nitrosamines have been consistently higher both pre and post RO than at Beenyup WWTP. Spiking samples with realistic concentrations of N-nitrosamines would also ensure concentrations will be above detection limits and can provide a mechanism for calculating accuracy.

56
Table 4.3.3: Inter-Laboratory round robin results for N-Nitrosamines (Event 6)
NDMA NEMA NDEA NDPA NDBA NPIP NPYR NMOR NDPhA
Health Value 10 2 10 10 2 90 3 1 14000
Sample ID Required LOD 1 0.2 1 1 0.2 9 0.3 0.1 1400
ng/L ng/L ng/L ng/L ng/L ng/L ng/L ng/L ng/L
BSP1G_100608 PT Lab 1 12 <0.6 9 6 <1.4 <0.4 <1.1 8 <34
Lab 2 4* 3* 3* 4* 1*
Lab 3 4.7
BSP1GS_100608 PT Lab 1 129 101 115 108 96 97 115 128 97
Lab 2 82 62 58 87 90
Lab 3 93
BSP7G100608 PT Lab 1 2 <0.6 <1 <1.4 <1.4 <0.4 <1.1 <1.2 <34
Lab 2 2* 3* 5* 0.7* 0
Lab 3 7.0
BFB100608 PT Lab 1 <1.1 <0.6 <1 <1.4 <1.4 <0.4 <1.1 <1.2 <34
Lab 2 0 0 0.6* 2.1* 0
Lab 3 0.3
* Denotes Lab 2 results below reporting value of 5 ng/L

57
The limited number of participants in the round robin means that statistical analysis of the results was not possible. There was general agreement between laboratories for unspiked wastewater (BSP1G_100608) and MF/RO water (BSP7_100608) samples, although the variation in measured values highlights the challenge to analytical laboratories required to measure N-nitrosamines below guideline values determined for recycled water. In future, replicate analysis by participating laboratories would indicate whether within laboratory variation was similar to or less than between laboratory variation and also whether the variation observed was from random or systematic errors.
For the spiked sample, Curtin produced concentrations closest to the estimated spike concentration of 114-120 ng/L. However, further information is required to determine whether the differences measured were significant. It is noted that the range of NDMA results reported (47 ng/L, or about 51% of the median) is only marginally
greater than the range reported in the PT:A proficiency test (57 µg/L, or 44% of the median) in which NDMA concentrations were approximately 1000 times higher. All samples were preserved with ascorbic acid, as used by Curtin University, however it is also noted that both AWQC and Qld Heath typically use sodium thiosulphate for N-nitrosamine preservation. Qld Health reported 10% suppression in the presence of ascorbic acid for their N-nitrosamine method. Consistency in preservation methods may need to be addressed for future trials. Further proficiency tests would benefit from an increased number of replicate and spiked samples, as well as the recruitment of additional laboratories undertaking trace N-nitrosamine analysis. The practical implications of providing multiple 1 L samples for such an expanded comparison will need to be addressed.

58
5 Standard Wastewater Characteristics
5.1 Introduction
The three objectives of this chapter are:
• To characterise the operation of the three wastewater treatment plants based on operational data to determine whether project sampling occurred during times of normal operation;
• To characterise the operation of the MF/RO plants at KWRP and Beenyup based on operational data and PCRP data to determine whether project sampling occurred during times of normal operation; and
• To characterise the removal of standard wastewater and other general water quality parameters through MF/RO treatment, and where relevant compare with drinking water guideline levels.
Nutrients and physical parameters are key indicators for wastewater treatment plant (WWTP) operation and system health. Wastewater treatment by the activated sludge process is designed to remove the majority of the organic material, measured as biological oxygen demand (BOD5), and in many cases (such as Beenyup), nitrogen. It is uncommon for there to be much phosphorus removal without additional treatment. Solids separation from the water is the other key indicator of proper wastewater treatment operation. This is achieved by coarse screening for rags, primary sedimentation to remove grit and sand and finally, after biological treatment of the organic matter, by secondary sedimentation tanks (SSTs). The nutrients and other chemical and physical parameters can be analysed to characterise the efficiency of the wastewater treatment plant operation.
Electrical conductivity is a common parameter to assess proper operation of a reverse osmosis membrane filtration plant. Electrical conductivity (EC) provides a measure of total ionic content of the water and can be analysed online. Removal of EC and specific ions is used to characterise the efficiency of RO treatment plant operation.
Some inorganic parameters are regulated for drinking water consumption, such as the ions: sodium, sulphate, fluoride, chloride, bromide and ammonia. However, only some of these have health-based values (sulphate, fluoride and bromide), the remainder are aesthetic drinking water guidelines.
The general parameters measured were: nitrogen (Kjeldahl), nitrogen (as NO2+NO3), nitrite, nitrate, ammonia (as N), phosphorus (total and dissolved) nitrogen (organic), nitrogen (total), fluoride, sulphate, bromide, phosphate, chloride, turbidity, TSS, TDS, sodium, calcium, potassium, magnesium, silicon, alkalinity (as CaCO3), bicarbonate, hardness (as CaCO3), aluminium, iron, manganese, colour, BOD5, TOC, COD, DOC, carbonate, total filterable solids (by summation), chlorine, chloramine, temperature - water, temperature - ambient, pH, dissolved oxygen,

59
electrical conductivity, conductivity of metals (aluminium, manganese, iron, silicon, scandium, magnesium, cyanide), ORP.
5.2 Methods
Sampling was conducted during PCRP sampling events for nutrients, anions, cations, alkalinity, organic carbon and other common parameters to characterise the water. Both PCRP and operational samples were collected over a 24 hour period using a refrigerated composite sampler. Wastewater treatment plant samples were flow-weighted composite samples, whereas those collected from influent and product water of the advanced water treatment plant were hourly time-weighted composite samples. Samples were analysed by SGS according to standard methods as given in Appendix 4.
Operational data was also available from the wastewater treatment plants and advanced water treatment plants. The WWTP operational data consisted of weekly analyses (by the same lab, SGS, and by the same method) for nutrients, daily analyses for suspended solids (conducted at the WWTP laboratory), weekly analysis for total chlorine and monochloramine, as well as some online data within the WWTP (dissolved oxygen in the aeration tanks, suspended solids on the treated wastewater produced by modules of clarifiers (or SSTs). Online data analysed from the AWTPs included influent turbidity and pH and product water conductivity. At KWRP there was also operational data for some of the ions.
Nutrients and physical parameters data was analysed to characterise the operation of the wastewater treatment plant during sampling events. Conductivity and ions were analysed to characterise the operation of the advanced water treatment plants.
5.3 Quality assurance/ Quality control
Generally there was good agreement between replicate sample results for general characteristics parameters.
There were also some replicate analyses made by alternate laboratories and/or methods. Electrical conductivity was analysed by SGS and CCWA and on site by CSIRO with a probe and flow-through cell immediately prior to sampling. There was also online operational data for some parameters for some sample points available from the treatment plants. The online data available included:
• Oxidation reduction potential (ORP) and pH from Post-MF sample point equivalent.
• ammonia from secondary wastewater sample point equivalent

60
• chloramine from post-MF sample point equivalent, on site analyses were also conducted.
• Conductivity from post-RO sample point equivalent
• Turbidity from secondary wastewater sample point equivalent.
• Suspended solids from secondary wastewater sample point equivalent from WWTP outlet.
For some parameters these multiple sources of information provided useful corroboration of results from each source (e.g. conductivity), but for other parameters the different data sources did not correlate well (e.g. ORP, pH). For these parameters online operational data was used in preference to laboratory data because of the advantage of a much greater data volume due to the high frequency of analyses. Where multiple data sources existed they are each reported in figures, for calculation of removal if possible data from the same source before and after treatment is used. CCWA conductivity data was used in preference to SGS data or field data. Field data was relied on for reporting DO, chlorine, chloramine and pH.
5.4 Results & Discussion
Beenyup WWTP
When the activated sludge process is operating well at Beenyup WWTP, the treated wastewater produced is nitrified, with low levels of ammonia. Operational data over the full period of sampling of the PCRP project indicates that during each sampling event the WWTP was operating normally (Figure 5.4.1). The operational data indicates reasonably consistent denitrification, with some loss of performance of nitrification in September 2007 and July 2008. However according to project data during the June 2008 sampling event full nitrification was not being achieved. This doesn’t match well with operational data collected over the same week. A significant factor contributing to this is that nutrient data is only collected weekly and frequently not on the same day as PCRP sampling, so significant variation from the operational data may be expected.
Phosphorus detected in the secondary wastewater consisted of almost entirely dissolved reactive phosphorus (analogous to orthophosphate), as indicated by Figure 5.4.2. Concentrations remain consistent at around 10 mg/L, indicating a treated wastewater quality that is typical for a large WWTP that does not employ chemical or biological phosphorus removal.
Figure 5.4.4 shows average dissolved oxygen (DO) in the activated sludge aeration tanks during wastewater treatment. The results demonstrate a generally healthy and well operated activated sludge system, as DO concentrations are neither too low
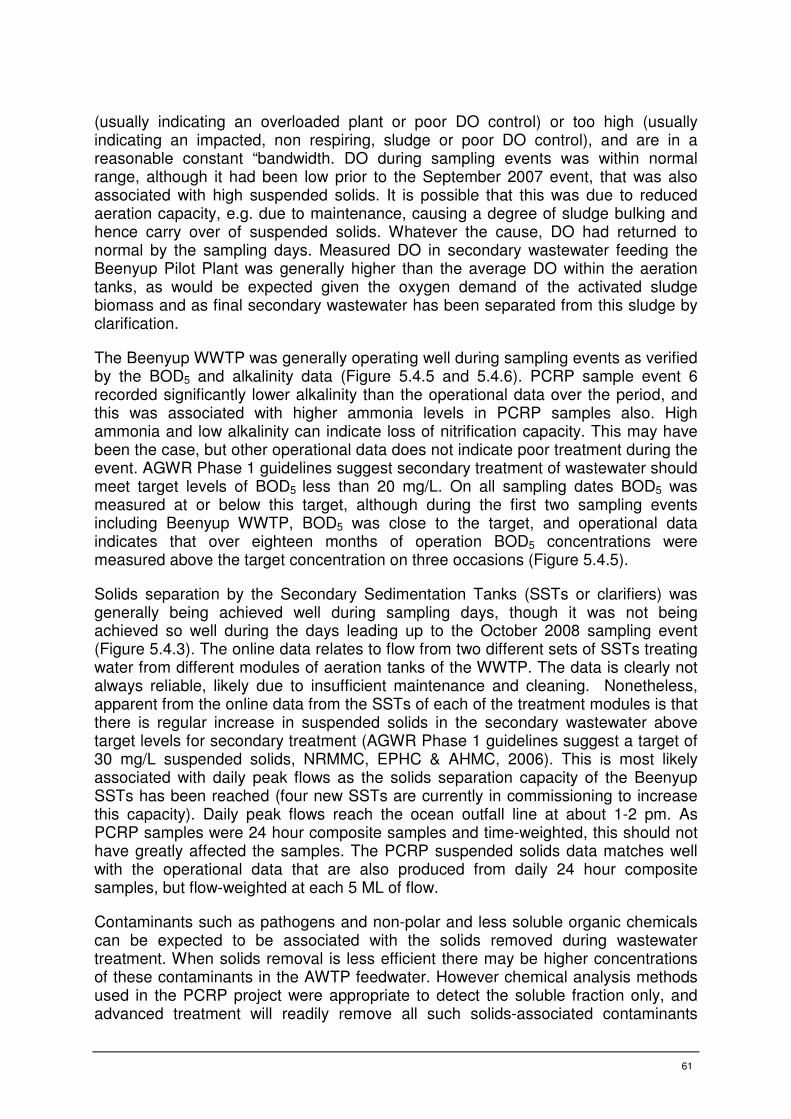
61
(usually indicating an overloaded plant or poor DO control) or too high (usually indicating an impacted, non respiring, sludge or poor DO control), and are in a reasonable constant “bandwidth. DO during sampling events was within normal range, although it had been low prior to the September 2007 event, that was also associated with high suspended solids. It is possible that this was due to reduced aeration capacity, e.g. due to maintenance, causing a degree of sludge bulking and hence carry over of suspended solids. Whatever the cause, DO had returned to normal by the sampling days. Measured DO in secondary wastewater feeding the Beenyup Pilot Plant was generally higher than the average DO within the aeration tanks, as would be expected given the oxygen demand of the activated sludge biomass and as final secondary wastewater has been separated from this sludge by clarification.
The Beenyup WWTP was generally operating well during sampling events as verified by the BOD5 and alkalinity data (Figure 5.4.5 and 5.4.6). PCRP sample event 6 recorded significantly lower alkalinity than the operational data over the period, and this was associated with higher ammonia levels in PCRP samples also. High ammonia and low alkalinity can indicate loss of nitrification capacity. This may have been the case, but other operational data does not indicate poor treatment during the event. AGWR Phase 1 guidelines suggest secondary treatment of wastewater should meet target levels of BOD5 less than 20 mg/L. On all sampling dates BOD5 was measured at or below this target, although during the first two sampling events including Beenyup WWTP, BOD5 was close to the target, and operational data indicates that over eighteen months of operation BOD5 concentrations were measured above the target concentration on three occasions (Figure 5.4.5).
Solids separation by the Secondary Sedimentation Tanks (SSTs or clarifiers) was generally being achieved well during sampling days, though it was not being achieved so well during the days leading up to the October 2008 sampling event (Figure 5.4.3). The online data relates to flow from two different sets of SSTs treating water from different modules of aeration tanks of the WWTP. The data is clearly not always reliable, likely due to insufficient maintenance and cleaning. Nonetheless, apparent from the online data from the SSTs of each of the treatment modules is that there is regular increase in suspended solids in the secondary wastewater above target levels for secondary treatment (AGWR Phase 1 guidelines suggest a target of 30 mg/L suspended solids, NRMMC, EPHC & AHMC, 2006). This is most likely associated with daily peak flows as the solids separation capacity of the Beenyup SSTs has been reached (four new SSTs are currently in commissioning to increase this capacity). Daily peak flows reach the ocean outfall line at about 1-2 pm. As PCRP samples were 24 hour composite samples and time-weighted, this should not have greatly affected the samples. The PCRP suspended solids data matches well with the operational data that are also produced from daily 24 hour composite samples, but flow-weighted at each 5 ML of flow.
Contaminants such as pathogens and non-polar and less soluble organic chemicals can be expected to be associated with the solids removed during wastewater treatment. When solids removal is less efficient there may be higher concentrations of these contaminants in the AWTP feedwater. However chemical analysis methods used in the PCRP project were appropriate to detect the soluble fraction only, and advanced treatment will readily remove all such solids-associated contaminants

62
anyway, therefore solids removal by the WWTP is not expected to be strongly associated with chemical contaminant detection in this project.
Figure 5.4.1: Beenyup WWTP secondary treated wastewater operational data and PCRP collected data; time series for ammonia, nitrate and combined nitrate and nitrite, all as mg/L as nitrogen.
Beenyup WWTP Nitrate as N and Ammonia as N Data - operational & PCRP data
0
2
4
6
8
10
12
14
16
18
9/03/2007 7/06/2007 5/09/2007 4/12/2007 3/03/2008 1/06/2008 30/08/2008 28/11/2008
Date
Co
nc
en
tra
tio
n (
mg
/L a
s N
)
NO2+NO3 (ODSS) NO2 + NO3 (PCRP) Nitrate (ODSS) Ammonia (ODSS) Ammonia (PCRP)

63
Figure 5.4.2: Beenyup WWTP secondary treated wastewater operational data and PCRP collected data; time series for total and dissolved phosphorus (in mg/L as phosphorus).
Figure 5.4.3: Beenyup WWTP suspended solids in secondary treated wastewater; online data from 2 probes monitoring the product of 2 pairs of treatment modules, operational laboratory data and PCRP collected data (red). Time series. Sample dates are identified in light blue.
Beenyup WWTP Total Phosphorus (TP)
0
2
4
6
8
10
12
14
16
18
9/03/2007 7/06/2007 5/09/2007 4/12/2007 3/03/2008 1/06/2008 30/08/2008 28/11/2008
Date
Co
ncen
trati
on
(m
g/L
)
TP (ODSS) TP (PCRP) Phosphate (FRP, PCRP)
Beenyup WWTP Total Suspended Solids
0.00
30.00
60.00
90.00
120.00
150.00
180.00
210.00
08/Apr/2007 07/Jun/2007 06/Aug/2007 05/Oct/2007 04/Dec/2007 02/Feb/2008 02/Apr/2008 01/Jun/2008 31/Jul/2008 29/Sep/2008
Date/Time
TS
S (
mg
/L)
Module 1+2 SSTs Module 3+4 SSTs Combined Daily (ODSS) Pilot Plant Influent (PCRP) Sampling Days

64
Figure 5.4.4: Beenyup WWTP secondary wastewater time series of Dissolved Oxygen average across 27 probes in all aeration tanks. Also dissolved oxygen as measured in feed water to the Pilot plant on PCRP sample days.
Figure 5.4.5: Beenyup WWTP time series of BOD5 of secondary treated wastewater, operational and PCRP data (zero values represent less than LOD; <5mg/L)
Beenyup WWTP Average Dissolved Oxygen in Aeration Tanks & Product water
0.00
1.00
2.00
3.00
4.00
5.00
6.00
09/Mar/2007 07/Jun/2007 05/Sep/2007 04/Dec/2007 03/Mar/2008 01/Jun/2008 30/Aug/2008 28/Nov/2008
Date/Time
DO
(m
g/L
)
BWWTP Avg DO PCRP Field Data Sampling Dates
Beenyup WWTP Secondary WW Biochemical Oxygen Demand
0
5
10
15
20
25
30
35
40
7/02/07 8/05/07 6/08/07 4/11/07 2/02/08 2/05/08 31/07/08 29/10/08
Date
Co
ncen
trati
on
(m
g/L
)
BOD (ODSS) BOD (PCRP) Sampling Days

65
Figure 5.4.6: Beenyup WWTP time series of Alkalinity of secondary treated wastewater, operational and PCRP data
Figure 5.4.7: Beenyup WWTP time series of Conductivity of secondary treated wastewater, operational and PCRP data, and PCRP data post MF/RO treatment in BPP
Beenyup WWTP Secondary WW Alkalinity
0
20
40
60
80
100
120
140
160
180
200
7/02/07 8/05/07 6/08/07 4/11/07 2/02/08 2/05/08 31/07/08 29/10/08
Date
Co
nce
ntr
ati
on
(m
g/L
)
Alkalinity (ODSS) Alkalinity (PCRP) Sample Days
Beenyup WWTP Secondary WW Conductivity
0
20
40
60
80
100
120
140
160
180
200
7/02/07 8/05/07 6/08/07 4/11/07 2/02/08 2/05/08 31/07/08 29/10/08
Date
Co
nd
ucti
vit
y (
mS
/m)
Conductivity (ODSS) Conductivity (PCRP) Sampling Days Post-RO Conductivity (PCRP)

66
Beenyup Pilot Plant (BPP)
Pilot plant RO recovery was initially set at about 70% during commissioning. This was maintained in operation until the 12th May 2008, when recoveries were increased to just under 80%. RO membrane flux set points were maintained constant at 19.7 L/m2/hr.
Unfortunately problems with both the datalogger and the turbidity meter significantly reduced the period over which online operational data was available. Over a four month period in autumn and winter 2008 BPP received secondary treated wastewater of 5.8 ntu on average (Table 5.4.1). However this was skewed by some very high values; median turbidity was 2.7 ntu. The shutdown criteria for ceasing taking of water for MF treatment was exceeded at least 20 times over the four month period (Figure 5.4.8).
On average feedwater to the BPP met the required operating criteria (Table 5.4.1), however the large standard deviations indicate there were exceedances in some instances. The parameters monitored, except permeate conductivity, are primarily intended to assure that design specifications of the MF/RO processes are met. Therefore exceedances might affect the warranty and lifetime of certain treatment process components, but will not necessarily affect treatment performance at the time.
Permeate conductivity of the product water was most frequently in the range of 20 to 30 micro Siemens per cm (µS/cm). However, due to some increases during seal failures on two occasions associated with membrane cleaning, the average was over 30 µS/cm. The average conductivity of 10 minutely datataker record (March – December 2008) was 28.2 µS/cm (± 7.0 µS/cm std dev). The permeate conductivity average during sampling events was 24.5 µS/cm (± 5.8 µS/cm std dev).
Monochloramine (‘chloramine’) levels after RO were very variable presumably reflecting variability in their formation through chloramination to protect the RO membranes from biofouling. The variable formation was due to a lack of control on chloramination based on influent ammonia concentrations. Hypochlorite and ammonia dosing rates were manually set (up to twice weekly) to achieve required chloramine concentrations and ORP levels, but did not respond automatically to changes in feedwater ammonia levels that as seen in Figure 5.4.1 are quite variable from Beenyup WWTP. Chloramine is known to be particularly effective at passing through RO systems (Drewes et al., 2008)
ORP is monitored to ensure that no water containing free chlorine is allowed to pass onto the RO membranes, as free chlorine rapidly degrades RO membranes. The plant was shut down if the ORP alarm level was exceeded and this occurred relatively frequently (see ORP std dev, Table 5.4.1). Plant shutdown based on ORP alarm was due to the lack of automated control of the hypochlorite and ammonia dosing system. Re-start following shutdown required operator attendance that was generally twice weekly unless a sampling event was imminent. This experience strongly reinforces the need for adequate control systems for chloramination based on inline measures of ammonia, ORP and chloramine for any operating plant.

67
Table 5.4.1: Beenyup Pilot Plant Operating Conditions
Operating Parameter Value Required Median Average std dev
Influent Turbidity <20ntu 2.7 5.8 8.8
RO Feed pH - Target 5.5-6.4
Target <6.1
5.97 6.03 0.54
RO Feed ORP 200-600mV
Target 470-510mV
486 472 83
Monochloramine concentration (sample data of product water, n=7)
1 - 1.5 mg/L winter
1.5 - 2 mg/L summer
0.46 0.78 0.75
Permeate Conductivity (µS/cm)
<75 28.5 30.9 10.4
Figure 5.4.8: Beenyup Pilot plant time series of feedwater turbidity.
Over the 13 month sampling period on the BPP, the conductivity gradually trended upwards as would be expected as membranes age (Figure 5.4.9). Conductivity data on RO plants is generally normalised to account for feed water pressure and temperature. From ‘daily’ normalised data (Figure 5.4.10) the increasing conductivity trend still exists but is less pronounced than it would appear from the non-normalised conductivity data.
Beenyup Pilot Plant Raw Water Turbidity (ntu)
[50 ntu is maximum reading on instrument]
0
10
20
30
40
50
60
5/09/2007
5/10/2007
4/11/2007
4/12/2007
3/01/2008
2/02/2008
3/03/2008
2/04/2008
2/05/2008
1/06/2008
1/07/2008
31/07/2008
30/08/2008
29/09/2008
29/10/2008
Date & Time
Tu
rbid
ity
(n
tu)
Online Data
Lab Data

68
There were 2 significant failures of the pilot plant that occurred in association with the first RO clean in place (CIP) events (Figure 5.4.10). Large increases in conductivity allowed identification that ‘O’ rings separating and sealing the RO membranes had rolled and therefore MF treated feed water was leaking into the product water line. The cause of this event was flushing associated with the first two CIP events providing too high a pressure on the membrane spacer seals. This resulted in modification of the CIP protocol for subsequent CIPs.
The higher resolution of data available from online sources shows frequent spikes in the online product water conductivity (Figure 5.4.9) indicating the frequency of shutdowns based on automatic alarms. Abnormal conductivity results were associated with shutdown situations (as previously discussed, particularly based on ORP) and insufficient flushes prior to shut-down. These pilot plant shutdowns did not occur during or immediately prior to sampling events as an operator was always in attendance to ensure that the plant was operating smoothly prior to sampling.
Figure 5.4.9: Online BPP product water time series of electrical conductivity (µS/cm) – not normalised, and PCRP sample data analysed by the laboratory (CCWA).
Beenyup Pilot Plant Permeate Conductivity
0
10
20
30
40
50
60
70
80
90
100
5/09/2007 4/11/2007 3/01/2008 3/03/2008 2/05/2008 1/07/2008 30/08/2008 29/10/2008 28/12/2008
Time
Co
nd
uc
tivit
y (
uS
/cm
)
Permeate Conductivity Conductivity PCRP

69
Figure 5.4.10: BPP product water time series of electrical conductivity (µS/cm) – as normalised for feed water characteristics (pressure and temperature), and PCRP collected data analysed on site in the field and by the laboratory.
Removal of Water Quality Parameters by Pilot-scale RO (BPP)
General parameters regulated by drinking water guidelines and their guideline levels and percentage removals by MF/RO treatment are tabulated in Table 5.4.2. Ammonia, nitrate, turbidity, TDS and sodium are all parameters with average concentrations in Beenyup secondary treated wastewater that exceed guideline levels. All of these parameters are removed by MF/RO treatment to below guideline levels. Also tabulated is the mean and standard deviation for each parameter along with the quantity of data on which the statistics were calculated.
Removal of ammonia is recorded as particularly variable. Ammonia is dosed at the pilot plant to achieve chloramination to minimise biofouling of the membranes and thus prevent them clogging too rapidly. As previously discussed, a consistent chloramine residual concentration was not maintained and at times the ammonia in the product water was higher than in feed water. This lack of control based on influent concentrations was also reflected in the variable chloramine levels post-RO.
Removal of most ions with drinking water guidelines was close to or above 90%, except for nitrite that was particularly poorly removed but remained below guideline levels. However it should be noted that the nitrite levels were always very low and close to the LOD even before treatment
Beenyup Pilot Plant Conductivity
0
30
60
90
120
150
180
210
16-Aug-2007 15-Oct-2007 14-Dec-2007 12-Feb-2008 12-Apr-2008 11-Jun-2008 10-Aug-2008 9-Oct-2008
Date
Co
nd
ucti
vit
y (
uS
/cm
)
Pilot On-line Sampling On-line Sampling Field Sampling Lab
Damaged "O" Ring
Damaged "O" Ring
Plant in Shut-Down
Plant in Shut-Down

70
Removal of typical wastewater treatment indicator parameters by advanced treatment (Table 5.4.3) was very effective, with a minimum of 70% removal of chemical oxygen demand, up to 99.9% removal of phosphate (or filterable reactive phosphorus, FRP).

71
Table 5.4.2: Standard parameters with guideline levels, percentage removal by the BPP;
Beenyup WWTP secondary wastewater and Pilot Plant product water mean and standard
deviation; all values in mg/L except turbidity. n= number of samples
Parameter Guideline value
Beenyup Secondary WW
Beenyup Pilot Plant Post-RO
Removal by MF/RO
ADWG & AGWR (mg/L)
Mean Std Dev
n Mean Std Dev
n Average
%
Fluoride 1.5 0.85 0.05 11 0.11 0.096 10 87.5
Chloride 250 222 26.8 12 2.4 1.2 12 99.0
Bromide 7* 0.28 0.05 12 <0.02 0 11 96.4 a
Iodide 0.1 No Data No Data
Cyanide 0.08 <0.01 - 14 <0.01 - 3
Nitrate (plus nitrite as N)
11 11.5 2.8 13 0.7 0.25 12 93.0
Nitrite as N 0.67 0.24 0.11 4 0.23 0.21 5 4.2
Sulfate 250 104 63 12 0.3 0.7 11 99.6
Ammonia
(Ops Data)†
0.5 2.15
(1.1)
3.04
(1.2)
13
(81) 0.27 0.07 12 -1300 - 97
TDS
500 735^ 44 15
No Data
<5 99.7
a
Turbidity (ntu)
1 3.5 2.9 12 0.1 0.08 12 85.0
Sodium 180 184 21 12 4.3 1.0 12 97.7
† Operational data not used in removal calculations
* AGWR 2008 Guideline level only
a Removal % based on half the LOR in product water
^ Beenyup WWTP operational data from 2004-2005

72
Table 5.4.3: Additional parameters that characterise treatment efficiency, percentage
removal by the BPP. Beenyup WWTP and Pilot Plant mean (mg/L) and standard deviation –
all values in mg/L except colour. n= number of samples
Parameter Beenyup Secondary WW Beenyup Pilot Plant Post-RO
Removal by MF/RO
Mean Std Dev n Mean Std Dev n Average %
Alkalinity 108 48 12 6.0 2.6 12 91.8
Suspended Solids
18.3 13.0 12 3.1 2.2 12 70.9
Organic Nitrogen
3.2 1.2 109 No Data
TKN 4.1 2.4 13 0.49 0.46 12 82.6
Phosphate 9.3 0.7 13 0.01 0.01 12 99.9
Total Phosphorus
10.1 1.1 13 0.06 0.08 12 99.4
Calcium 37.2 4.0 12 0.07 0.06 12 99.8
Potassium 22.7 2.3 12 0.34 0.09 12 98.5
Magnesium 11.5 1.1 12 <0.1 - 12 99.6 a
Silica 17 2.2 12 <2.2 - 12 93.5 a
Chem. Oxygen Demand
39.6 20.8 11 8.2 6.0 11 70.2
BOD5
(Ops Data) †
5.4
Median <5
(12.8)
6.1
(8.5)
11
(218) <5 - 11 80.5
a
Total Organic Carbon
9.2 2.9 12 0.4 0.37 12 95.7
Dissolved Organic Carbon
8.1 0.6 12 0.23 0.13 12 97.2
Oil & Grease 12.6 27.3 9 No Data
Colour (TCU) 34.6 3.6 12 <1 - 12 98.5 a
Conductivity (µS/cm) (Ops data)
b
1271
(1292)
128
(94.4)
14
(16702)
24.1
(28.2)
5.5
(7.0)
12
(16702)
98.1
(97.8)
pH - in situ c
(Ops data)b
6.94
(5.90)
0.12
(0.50)
11
(16702) 5.53 0.90 11
Dissolved Oxygen
c
3.8 1.2 11 5.6 2.2 11
Chlorine c 0.05 0.05 12 0.87 0.78 12
Chloramine c 0.05 0.05 12 0.67 0.60 12
† Operational data used in % removal calculation
a Removal % based on half the LOR in product water

73
b Operational data is 10 minutely record while RO system operational: 18/3/08 to 23/12/08
c Measures taken on site either with a probe or Hach chemical method
Subiaco WWTP
Subiaco WWTP is a very similar treatment process to the Beenyup WWTP. It generally discharges wastewater that is reasonably well nitrified (although the level of nitrification is variable as can be seen in Figure 5.4.14).
During PCRP sampling events, secondary treated wastewater suspended solids and BOD5 data indicates that the plant was operating well (Figures 5.4.11 and 5.4.12). BOD5 was always at or below the suggested AGWR Phase 1 guideline of 20 mg/L. Suspended solids were also at or below the suggested target of 30 mg/L during sampling events, however at other times this concentration was frequently exceeded. The average dissolved oxygen in the aeration tanks was also normal during sample days, although there was a small spike in DO over the sample day on the 23rd May 2007 (Figure 5.4.13). This doesn’t seem to be associated with any other upset in the wastewater treatment plant, but it may explain the higher level of nitrification recorded (high nitrate and very low ammonia) on this date (Figure 5.4.14).
Comparison of ammonia and total nitrogen concentrations with Beenyup data indicates significantly more reliable nitrification/denitrification at Beenyup. Indeed, full conversion of ammonia to nitrate is rarely achieved at Subiaco. This is not important for current discharge arrangements, as Subiaco discharge is rather less environmentally sensitive than Beenyup, however, it would be a consideration if indirect potable reuse were to be considered from Subiaco WWTP in the future. However it should be noted that due to the need for chloramination in MF/RO treatment, it is advantageous to operate the preceding wastewater treatment plant with incomplete nitrification.
The anions, cations and physical parameters that have drinking water guidelines are identified in Table 5.4.4. Where there is sufficient data average and standard deviation are calculated with the data count. The Guideline levels reported are AGWR 2008 or ADWG 2004 guideline levels as indicated. Only ammonia and total dissolved solids average exceeded their guideline levels, although no data was available for iodide or turbidity. Suspended solids concentration has some relationship to turbidity and it is likely that the drinking water guideline for turbidity would also be exceeded given the secondary wastewater suspended solids concentration.

74
Figure 5.4.11: Subiaco WWTP secondary treated wastewater time series of suspended solids (operational and PCRP data) and sampling events (mg/L).
Subiaco WWTP Secondary Wastewater BOD Timeseries
0
5
10
15
20
25
08/01/2005 09/07/2005 07/01/2006 08/07/2006 06/01/2007 07/07/2007 05/01/2008 05/07/2008 03/01/2009
Date
BO
D (
mg
/L)
BOD BOD Filtered Sample
Figure 5.4.12: Subiaco WWTP secondary wastewater time series of BOD5 with and without filtration and sampling events. BOD5 Filtered was frequently below the limit of reporting of 2mg/L; this plots as zero prior to, and 2mg/L after, June 2006.
Subiaco WWTP Suspended Solids
0
20
40
60
80
100
120
140
29-Dec-04 29-Jun-05 28-Dec-05 28-Jun-06 27-Dec-06 27-Jun-07 26-Dec-07 25-Jun-08 24-Dec-08
Date
SS
(m
g/L
)
Suspended Solids Sample SS (PCRP)

75
Subiaco WWTP Average Dissolved Oxygen in Aeration tanks
0.00
0.50
1.00
1.50
2.00
2.50
3.00
3.50
4.00
8-Jan-05 9-Jul-05 7-Jan-06 8-Jul-06 6-Jan-07 7-Jul-07 5-Jan-08 5-Jul-08 3-Jan-09
Date
D.O
. (m
g/L
)
Average DO Sample
Figure 5.4.13: Subiaco WWTP time series of average dissolved oxygen in aeration tanks (mg/L); average of 9 probes and PCRP sample dates.
Subiaco WWTP Nitrogen Species
0
2
4
6
8
10
12
14
4-Mar-06 2-Jul-06 30-Oct-06 27-Feb-07 27-Jun-07 25-Oct-07 22-Feb-08 21-Jun-08 19-Oct-08 16-Feb-09 16-Jun-09
Date
Co
nc
en
tra
tio
n (
mg
/L)
NH3 from ODSS NO3 From ODSS Sample NO3 + NO2 PCRP NH3 PCRP NO3 + NO2 ODSS
Figure 5.4.14: Subiaco WWTP time series of secondary treated wastewater ammonia and nitrate content – operational and PCRP data and sampling events, all as mg/L as nitrogen.

76
Table 5.4.4: Subiaco WWTP secondary wastewater nutrients, anions, cations and standard
parameters data with respect to guideline levels (AGWR or ADWG). Operational data from
January 2005 – December 2008, mean, standard deviation and number of samples. PCRP
data from May 2007 and April 2008.
Parameter Guideline value Subiaco Secondary WW
ADWG & AGWR
(mg/L) Mean Std Dev
n (# of samples)
Fluoride 1.5 0.95 - 1
Chloride 250 206 - 1
Bromide 7* 0.22 - 1
Iodide 0.1 No data
Cyanide 0.08 <0.01 - 4
Nitrate as N 11 6.23 1.95 220
Nitrite as N 0.67 0.33 0.27 219
Sulfate 250 72 - 1
Ammonia 0.5 2.44 2.13 250
TDS 500 813 316 203
Turbidity (ntu) 1 No data – see Suspended Solids
Sodium 180 170 - 1
Alkalinity 140 20 181
Suspended Solids 19 14.8 1626
Organic Nitrogen 3.3 5.3 44
TKN 5.1 3.2 250
Phosphate 0.11 - 1
Total Phosphorus 8.7 3.0 250
Calcium 35 - 1
Potassium 23 - 1
Magnesium 11 - 1
Silicon 17 - 1
Chemical Oxygen Demand 40 10 2
Biological Oxygen Demand
6.4 3.3 202
Total Organic Carbon 9 - 1
Dissolved Organic Carbon 8 - 1
Oil & Grease 13.2 21.3 14
* AGWR 2008 Guideline level only

77
Woodman Point WWTP
Woodman Point WWTP is a sequencing batch reactor (SBR) that conducts activated sludge treatment in batches that are subject to aeration and non-aeration periods followed by decanting to waste. Due to the SBR configuration greater nitrogen removal might be expected from the Woodman Point WWTP than other plants, however this was not the case and ammonia levels were relatively high indicating that nitrification was incomplete (Figure 5.4.17). The Woodman Point WWTP has operated with only three of its four basins fully operational for much of the period of this project due to maintenance and upgrade activities. Therefore the biological treatment would not have been operating optimally. The relatively high and stable alkalinity indicates that this is likely associated with general overloading of treatment rather than specific failure in nitrification and denitrification of the plant.
The wastewater leaving the Woodman Point WWTP is discharged into a plastic-lined, uncovered holding pond where there is both capacity for greater settling of solids and the potential for solids introduction from wind-blown debris, access by fauna or algal growth. Storage in this pond is generally less than 12 hours. This pond is regularly flushed by the WWTP staff, during which the KWRP plant does not take water from the Sepia Depression Ocean Outfall Line (SDOOL). KWRP takes water from the SDOOL about 2.5 hours travel time and 12 kms down the line from the WWTP holding pond.
Biological oxygen demand, turbidity and nutrient data indicate that on days of sampling that the Woodman Point WWTP was operating normally (Figures 5.4.15, 5.4.16 and 5.4.17). BOD5 was at or below the AGWR Phase 1 target concentration for secondary treatment of 20 mg/L during all sampling events, and was only recorded above the target concentration on four occasions over a two year period (Figure 5.4.16). Suspended solids was measured weekly on the feed water to KWRP and was at or below the AGWR Phase 1 target concentration for secondary treatment of 30 mg/L during sampling events, except potentially for one day during Event 1. Over the two year sampling period, six samples (3.3%) were above the 30 mg/L target. The much less clear pattern of nitrification of secondary wastewater would be influenced by the intermittent nature of operation of the SBR, operating with only three aeration basins, such that the plant is overloaded.

78
Figure 5.4.15: Turbidity of secondary treated wastewater feed to KWRP time series of on-line and laboratory operational data and PCRP data.
Figure 5.4.16: Time series of BOD5 of secondary treated wastewater feed to KWRP; operational laboratory data and PCRP data. All data at 2.5mg/L is below the limit of reporting of 5mg/L
KWRP Feed Water Turbidity
0
5
10
15
20
25
30
35
40
45
10-Oct-06 8-Jan-07 8-Apr-07 7-Jul-07 5-Oct-07 3-Jan-08 2-Apr-08 1-Jul-08 29-Sep-08 28-Dec-08
Date
Tu
rbid
ity (
ntu
)
Feed Online Feed Lab Feed PCRP Sample
KWRP Feed Water Biological Oxygen Demand
0
5
10
15
20
25
30
35
40
45
10-Oct-06 8-Jan-07 8-Apr-07 7-Jul-07 5-Oct-07 3-Jan-08 2-Apr-08 1-Jul-08 29-Sep-08 28-Dec-08
Date
BO
D (
mg
/L)
BOD (Ops) BOD (PCRP) Sample

79
KWRP influent from Woodman Point WWTP Nitrate as N and Ammonia as N - Operational & PCRP
0
2
4
6
8
10
12
14
16
18
20
2/07/06 31/12/06 1/07/07 30/12/07 29/06/08 28/12/08
Date
Co
nc
en
tra
tio
n (
mg
/L)
NO2 + NO3 (PCRP) Nitrate(ODSS) Ammonia(ODSS) Ammonia(PCRP)
Figure 5.4.17: Time series of Nitrate and ammonia content of secondary treated wastewater feed to KWRP - operational data and PCRP data, all as mg/L as nitrogen.
Woodman Point Treated Wastewater Alkalinity
0
50
100
150
200
250
300
10-Oct-06 8-Jan-07 8-Apr-07 7-Jul-07 5-Oct-07 3-Jan-08 2-Apr-08 1-Jul-08 29-Sep-08 28-Dec-08
Date
Alk
alin
ity
(m
g/L
)
Operations PCRP Sample
Figure 5.4.18: Time series of Alkalinity of Woodman Point secondary treated wastewater – feed to KWRP - operational data and PCRP data, as mg/L as CaCO3.
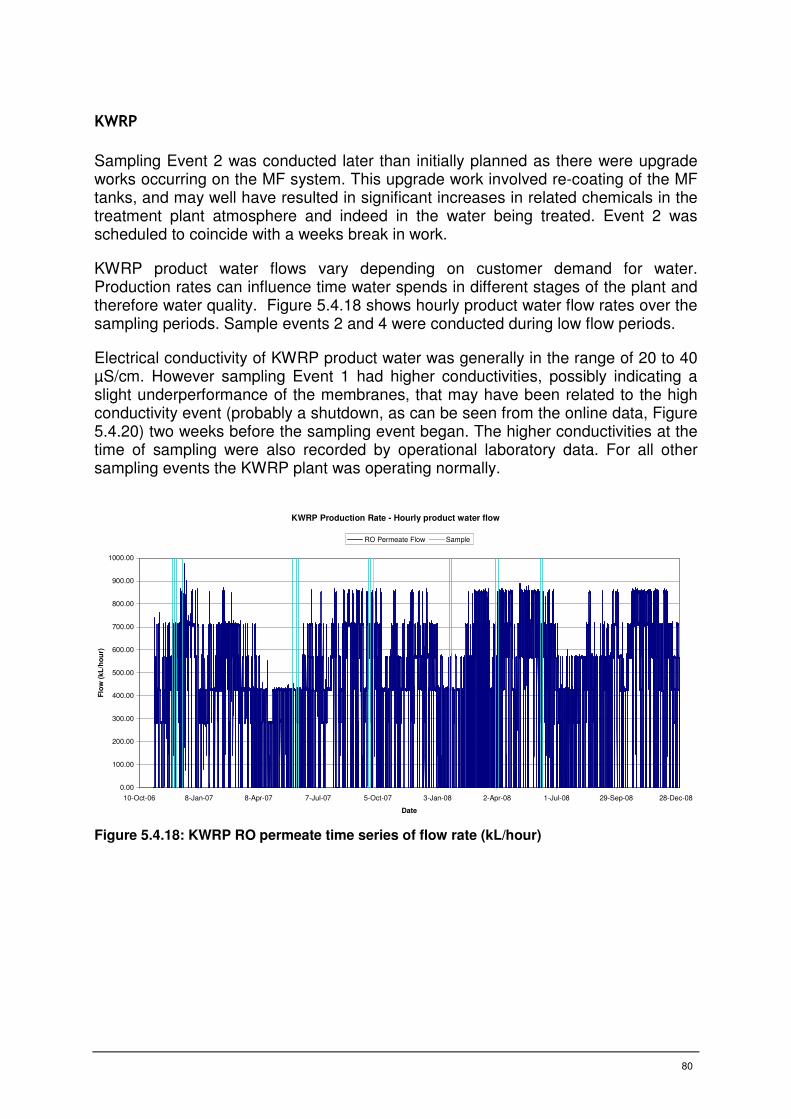
80
KWRP
Sampling Event 2 was conducted later than initially planned as there were upgrade works occurring on the MF system. This upgrade work involved re-coating of the MF tanks, and may well have resulted in significant increases in related chemicals in the treatment plant atmosphere and indeed in the water being treated. Event 2 was scheduled to coincide with a weeks break in work.
KWRP product water flows vary depending on customer demand for water. Production rates can influence time water spends in different stages of the plant and therefore water quality. Figure 5.4.18 shows hourly product water flow rates over the sampling periods. Sample events 2 and 4 were conducted during low flow periods.
Electrical conductivity of KWRP product water was generally in the range of 20 to 40 µS/cm. However sampling Event 1 had higher conductivities, possibly indicating a slight underperformance of the membranes, that may have been related to the high conductivity event (probably a shutdown, as can be seen from the online data, Figure 5.4.20) two weeks before the sampling event began. The higher conductivities at the time of sampling were also recorded by operational laboratory data. For all other sampling events the KWRP plant was operating normally.
Figure 5.4.18: KWRP RO permeate time series of flow rate (kL/hour)
KWRP Production Rate - Hourly product water flow
0.00
100.00
200.00
300.00
400.00
500.00
600.00
700.00
800.00
900.00
1000.00
10-Oct-06 8-Jan-07 8-Apr-07 7-Jul-07 5-Oct-07 3-Jan-08 2-Apr-08 1-Jul-08 29-Sep-08 28-Dec-08
Date
Flo
w (
kL
/ho
ur)
RO Permeate Flow Sample
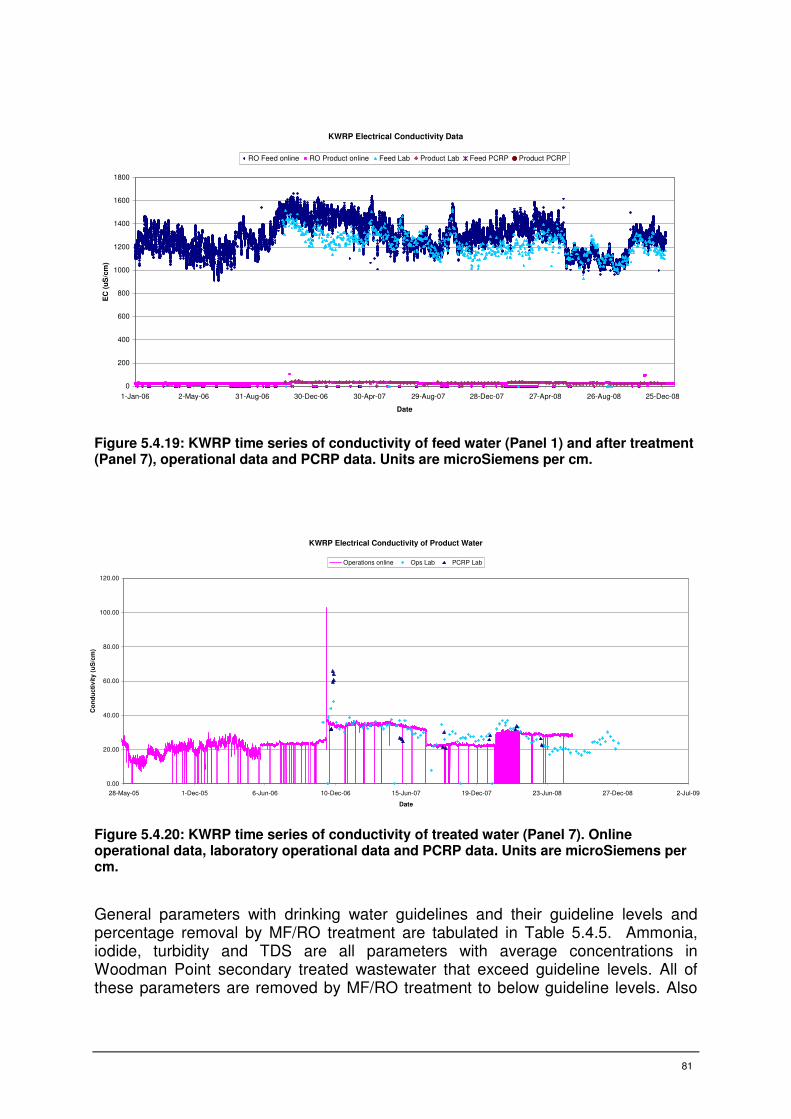
81
Figure 5.4.19: KWRP time series of conductivity of feed water (Panel 1) and after treatment (Panel 7), operational data and PCRP data. Units are microSiemens per cm.
Figure 5.4.20: KWRP time series of conductivity of treated water (Panel 7). Online operational data, laboratory operational data and PCRP data. Units are microSiemens per cm.
General parameters with drinking water guidelines and their guideline levels and percentage removal by MF/RO treatment are tabulated in Table 5.4.5. Ammonia, iodide, turbidity and TDS are all parameters with average concentrations in Woodman Point secondary treated wastewater that exceed guideline levels. All of these parameters are removed by MF/RO treatment to below guideline levels. Also
KWRP Electrical Conductivity Data
0
200
400
600
800
1000
1200
1400
1600
1800
1-Jan-06 2-May-06 31-Aug-06 30-Dec-06 30-Apr-07 29-Aug-07 28-Dec-07 27-Apr-08 26-Aug-08 25-Dec-08
Date
EC
(u
S/c
m)
RO Feed online RO Product online Feed Lab Product Lab Feed PCRP Product PCRP
KWRP Electrical Conductivity of Product Water
0.00
20.00
40.00
60.00
80.00
100.00
120.00
28-May-05 1-Dec-05 6-Jun-06 10-Dec-06 15-Jun-07 19-Dec-07 23-Jun-08 27-Dec-08 2-Jul-09
Date
Co
nd
ucti
vit
y (
uS
/cm
)
Operations online Ops Lab PCRP Lab

82
tabulated is the mean and standard deviation for each parameter along with the quantity of data on which the statistics were calculated.
Removal of ammonia in the MF/RO plant was much less variable than that recorded at the BPP. This will be due to ammonia dosing being properly controlled based on influent concentration, so dosing is responsive to influent concentration, unlike at the pilot plant. In addition the level of removal of ammonia was high at over 94%.
Removal of most ions of health concern was demonstrated at close to or above 90%, except for cyanide for which this could not be demonstrated as all values were below the limit of detection and below the guideline value. It should be noted that nitrite was well removed by treatment at KWRP and that this was based on more data than was available at BPP.
Removal of typical wastewater treatment indicator parameters by advanced treatment was very effective, with a minimum of 90% removal of chemical oxygen demand, up to 99.8% removal of calcium (Table 5.4.6). Removal efficiencies below 90% for BOD5 and suspended solids were due to the limitation imposed by the LODs for the analyses.
Table 5.4.5: Standard parameters with guideline levels, percentage removal by MF/RO
treatment. Woodman Point WWTP and KWRP product water mean and standard deviation
– all values in mg/L except turbidity. n= number of samples. Data is PCRP data except
where n>15, in which case operational data from 2005 to end of 2008 was used
Parameter Guideline
value
Woodman Point Secondary WW
(KWRP influent)
KWRP Post-RO Removal by MF/RO
ADWG & AGWR (mg/L)
Mean Std Dev
n Mean Std Dev
n Average
%
Fluoride 1.5 0.88 0.04 9 0.08 0.04 9 90.6
Chloride 250 181.7 16.1 3 1.3 1.4 3 99.3
Bromide 7* 0.27 0.10 9 <0.02 - 9 96.3 a
Iodide 0.1 10.0 1.3 2 0.34+ 0.28
+ 3 94.5-99.9
Cyanide 0.08 <0.01 - 6 <0.01 - 6 -
Nitrate as N 11 4.4 3.6 13 0.10 0.05 14 96.5
Nitrite as N 0.67 0.29 0.21 10 0.002 0.002 12 98.9
Sulfate 250 63.7 4.2 3 0.2 0 3 99.7
Ammonia
(Ops Data) 0.5
6.8
(5.0)
3.8
(3.0)
13
(173) 0.29 0.06 12 94.3
TDS 500 678 84 162 5 0 3 99.3
Turbidity 1 8.8 6.8 525 0.07 0.05 1129 99.2
Sodium 180 153.3 2.9 3 4.6 0 3 97.0

83
* AGWR 2008 Guideline level only
+ All less than limit of reporting, LOR<1 in 2 sample events and <0.02 in one sample event. Statistics calculated based on 50% of the LOR
a Removal % based on half the LOR in product water
Table 5.4.6: Additional parameters that characterise treatment, percentage removal by
MF/RO. Woodman Point WWTP and KWRP product water mean and standard deviation –
all values in mg/L. n= number of samples.
Parameter Woodman Point secondary WW
(KWRP influent)
KWRP Post-RO Removal by AWTP
Mean Std dev n Mean Std dev n Average %
Alkalinity 133 29 163 10.3 2.1 3 92.2
Suspended Solids
17.9 16.6 215 <5 - 3 86.0 a
Organic Nitrogen
3.0 2.6 121 <0.05 - 1 99.2 a
TKN (WWTP ops data)
8.78
(7.8)
5.26
(7.5)
13
(198) 0.30 0.23 14 93.1
Total N 13.7 3.6 14 0.45 0.21 14 96.5
Phosphate as P (FRP)
5.88 1.79 13 0.018 0.008 12 99.7
Total Phosphorus
6.8 2.0 458 0.05 0.04 457 99.3
Calcium 27.3 1.2 3 <0.1 - 3 99.8 a
Potassium 24.3 2.1 3 0.67 0.06 3 97.3
Magnesium 7.7 1.0 9 <0.1 - 9 99.3 a
Silica - SGS, & Ops, (2
nd line
CCWA)
11.3
(5.3)
1.3
(0.48)
4
(9)
0.02
(0.04)
0.05
(0.016)
387
(9)
99.8
(99.2)
Chemical Oxygen Demand*
50 35 13 <10 - 3 90.0 a
Biological Oxygen Demand
7.41
(Median:<5)
10
(Max: 45)
174
(70) <5 - 2 66.3
a
Total Organic Carbon
10.1 1.1 8 0.29 0.27 9 97.1
Dissolved Organic Carbon 10.4 1.2 4 0.37
Max 0.6
Min<0.2 3 96.4
Conductivity (µS/cm)
1033
(1151)
28.9
(147)
13
(16d)
21
(28.6)
1.7
(5.1)
3
(16d)
98.0
(97.5)

84
(Ops data)b
pH - in situ
(Ops data)b
7.0
(7.24)
0.6
(0.84)
10
(16d)
7.0
(6.9)
0.15
(0.28)
10
(16d)
Dissolved Oxygen
c
1.16 0.76 14 7.48 2.34 14
Chlorine c
(Ops - total Cl) 1.3
d 0.3
d 425
d
0.9
(1.1)
0.4
(0.3)
14
(424)
Mono-chloramine
c
0.49d 0.29
d 390
d 0.37 0.21 44
* Secondary WW data: 10 data points from 2009 Jan-March, 3 from PCRP project a Removal % based on half the LOR in product water
b Operations data as a 24 hour average of hourly data during the sampling days only
c Measures taken on site with a probe or reading of online instruments
d Operational data from Post-MF sample point