premio firenze university press tesi di dottorato – 1
TRANSCRIPT

premio firenze university presstesi di dottorato
– 1 –


Elisabetta Coppi
Purines as Transmitter Molecules
Electrophysiological Studies on Purinergic Signalling in Different Cell Systems
Firenze University Press2008

Progetto grafico di Alberto Pizarro Fernández
© 2008 Firenze University PressUniversità degli Studi di FirenzeFirenze University PressBorgo Albizi, 2850122 Firenze, Italyhttp://www.fupress.com/
Printed in Italy
Purines as Transmitter Molecules: Electrophysiological Studies on Purinergic Signalling in Different Cell Systems / Elisabetta Coppi. – Firenze : Firenze University Press, 2008.(Premio FUP. Tesi di dottorato ; 1)
http://digital.casalini.it/9788884539052
ISBN 978-88-8453-904-5 (print)ISBN 978-88-8453-905-2 (online)

A Marco,per la sua pazienza


Elisabetta Coppi, Purines as Transmitter Molecules: Electrophysiological Studies on Purinergic Signalling in Differ-ent Cell Systems, ISBN 978-88-8453-904-5 (print), ISBN 978-88-8453-905-2 (online) © 2008 Firenze University Press
Contents
Abbreviations XI
Introduction 11. Historical overview 12. Synthesis, release and catabolism of ATP 2
2.1 Vesicular release of ATP 32.2 Anion channel-mediated release of ATP 42.3 Connexin hemichannel-mediated ATP release 4
3. Synthesis, release and catabolism of adenosine. 63.1 Adenosine release 73.2 Synthesis of adenosine at extracellular level 8
Purinergicreceptors 91. P1 receptors 92. Pharmacology of P1 receptors 103. Distribution of P1 receptors. 11
3.1 Central Nervous System (CNS) 124. P2 receptors 135. P2X receptors 146. Pharmacology of P2X receptors 18
6.1 Agonists 186.2 Antagonists 19
7. P2Y receptors 208. Pharmacology of P2Y receptors. 22
8.1 Agonists 228.2 Antagonists 23
9. Distribution of P2 receptors 249.1 Neuronal localization of P2X receptors 269.2 Neuronal localization of P2Y receptors 27
Effectsofextracellularpurines 291. Role of P1 receptors 29
1.1 P1 receptors and neurotransmission. 301.1 P1 receptors and cerebral ischemia 32
2. Anoxic depolarization 35

3. Role of P2 receptors 383.1 P2 receptors and neurotransmission 393.2 P2 receptors and cerebral ischemia 433.3 P2 receptors and trophic effects 44
Aimofthestudy 46
Materialsandmethods 471. Extracellular recordings 47
1.1 Acute rat hippocampal slices preparation. 471.2 Experimental procedure 471.3 Protocols used 481.4 OGD conditions 48
2. Patch clamp recordings 493. Cell cultures 504. Solutions 515. Patch pipettes fabrication 516. Experimental procedures. 527. Voltage clamp protocols 538. Current clamp experiments. 549. Measurement of ATP release from hMSCs 5510. Chemicals 5511. Statistical analysis 61
RESULTS. Section 1ROLE OF PURINES IN CA1 HIPPOCAMPAL NEUROTRANSMISSION UNDER NORMOXIC CONDITIONS AND DURING OGD. EXTRACELLULAR RECORDINGS FROM RAT HIPPOCAMPAL SLICES
Chapter1RoleofA3adenosinereceptorsduringOGD 651. Historical background 652. Results 66
2.1 Experiments were performed on a total of 219 slices taken from 133 rats 66
3. Discussion 783.1 Role of adenosine receptor antagonists in depression and
disruption of CA1 hippocampal excitatory synaptic transmission during in vitro ischemia. 78
3.2 Therapeutic implications for the protective role of adenosine A3 receptor antagonists during prolonged ischemic conditions. 81
3.3 Role of adenosine receptor agonists in depression and disruption of CA1 hippocampal excitatory synaptic transmission during in vitro ischemia. 82
3.5 Conclusions 83

Chapter2RoleofP2purinergicreceptorsonhippocampalCA1neurotransmissionundernormoxicconditionsandduringOGD 851. Historical background 852. Results 86
2.1 Effects of ATP on CA1 hippocampal neurotransmission 862.2 Effects of ATPγS on CA1 hippocampal neurotransmission 902.3 Effects of ATP and ATPγS on PPF in the CA1 region of rat
hippocampus 932.4 Effects of different purinergic antagonists on OGD-evoked
disruption of neurotransmission in the CA1 region of rat hippocampal slices 94
3. Discussion 973.1 Role of P2 receptors in hippocampal neurotransmission under
normoxic conditions 973.2 Role of P2 receptors in hippocampal neurotransmission during
OGD 983.3 Conclusions 99
RESULTS. Section 2STUDIES ON P2 RECEPTOR MODULATION OF MEMBRANE IONIC CURRENTS BY PATCH CLAMP RECORDINGS
Chapter3RoleofP2Y1receptorstimulationinmediumspinyneuronsofratstriatalslices 1031. Historical background 1032. Results 104
2.1 P2Y1 receptor activation increases the outward currents elicited by a voltage ramp depolarization in striatal medium spiny neurons 104
2.2 Characterization of the P2Y1-activated conductance in striatal medium spiny neurones. 106
2.3 Single channel recordings show SK potassium channel opening following P2Y1 receptor activation 109
2.4 2MeS-ADP decreases the firing rate of medium spiny neurons recorded under the current-clamp mode in striatal slices 110
2.5 Spontaneous miniature synaptic currents are increased in amplitude during the application of 2meS-ADP. 112
3. Discussion 113
Chapter4RoleofpurinenucleotidesinculturedhMSCs:releaseofATPandactivationofP2receptors 1191. Historical background 1192. Results 120
2.1 Electrophysiological experiments 1212.2 Effects of exogenous ATP in potassium-free conditions 124

2.3 Effects of ATP in hMSCs in the perforated patch-clamp configuration 126
3. Discussion 1283.1 Conclusion 130
Chapter5PharmacologicalcharacterizationoftherecentlydeorphanizedGPR17receptortransfectedin1321N1astrocytomacells. 1311. Historical background 1312. Results 132
2.1 Exogenously applied UDP-glucose and UDP-galactose activate outward potassium currents in 1321N1 astrocytoma cell stably transfected with GPR17. 132
2.2 GPR17 receptor, stably transfected1321N1 astrocytoma cells, is also sensitive to leukotriene-related compounds 134
3. Discussion 137
Finalremarks 141
References 145

Elisabetta Coppi, Purines as Transmitter Molecules: Electrophysiological Studies on Purinergic Signalling in Differ-ent Cell Systems, ISBN 978-88-8453-904-5 (print), ISBN 978-88-8453-905-2 (online) © 2008 Firenze University Press
Abbreviations
AD anoxic depolarizationADA adenosine deaminaseABC ATP-binding cassette aCSF artificial cerebral spinal fluid ADP adenosine 5’ diphosphateAFM atomic force microscopyAK adenosine kinaseAMP adenosine 5’ monophosphateAOPCP ß-methylene-adenosine diphosphateAp4A diadenosine-tetraphosphateAR 132 N6-methyl-2-phenylethynyladenosineARC67085 2-propylthio-β,γ-dichloromethylene-D-ATPAR-C69931MX N6-(2-methylthioethyl)-2-(3,3,3-trifluoropropylthio)-β,γ-dichloromethyl-
ene ATPARL 67156 6-N,N-diethyl-D-β,γ-dibromomethylene ATPATL-146 4-3-[6-Amino-9-(5-ethylcarbamoyl-3,4-dihydroxy-tetrahydro-furan-2-yl)-
9H-purin-2-yl]-prop-2-ynyl-cyclohexanecarboxylic acidATP adenosine 5’ triphosphateATPγS adenosine 5’-O-(3-thiotriphosphate)AUC area under the curveαβ-meATP αβ-methylen ATPBBG Brilliant Blue GBK Big (conductance) potassium channelsBzATP 2,3-O- (4-benzoylbenzoyl)-ATP 5-Br-UDP 5-bromo-UDPcAMP cyclic adenosine monophosphateCCPA 2-Chloro-N6-cyclopentyladenosineCFTR cystic fibrosis transmembrane conductance regulator CGS 15943 9-chloro-2-(2-furyl)(1,2,4)triazolo(1,5-c)quinazolin-5-amineCGS 21680 2-p-(2-carboxyethyl)phenethylamino-5’-N-ethylcarboxamidoadenosine
hydrochloride CHO Chinese hamster ovaryC.L. confidential limitsCl-IB-MECA 1-[2-chloro-6[[(3-iodophenyl)methyl]amino]-9H-purin-9-yl]-1-deoxy-N-
methyl-ß-D-ribofuranuronamideCm membrane capacitanceCNS central nervous systemCNT concentrative nucleoside transporterCPA N6-CyclopentyladenosineCP 66713 4-amino [1, 2, 4] triazolo [4, 3a] quinoxaline CSC 8-(3-chlorostyryl)caffeine

Elisabetta CoppiXII
CysLT cysteinyl-leukotriene DC direct currentDPCPX 8-cyclopentyl-1,3-dipropylxanthineDRGN dorsal root ganglion neuronECoG cortical electrogramEGTA ethylene glycol-bis(β-aminoethylether)N,N,N’,N’-tetracetic acidENT equilibrative nucleoside transportere5’-NT extracellular 5’-nucleotidaseGABA γ-amino-butyric acid GAP-43 growth-associated protein-43 GIRK G protein-coupled inwardly rectifying potassium channelsGPCR G protein-coupled receptorsGRK GPCR related kinasesfEPSP field excitatory post-synaptic potentialFGF fibroblast growth factor[18F]CPFPX [18F]8-cyclopentyl-3-(3-fluoropropyl)-1-propylxanthine HEK cells human embryonic kidney cellshMSCs human mesenchymal stem cellsHSP70 heat shock protein 70HSP90 heat shock protein 90IB-MECA 1-deoxy-1-[6-[[(3-iodophenyl)-methyl]amino]-9H-purin-9-yl]-N-methyl-
beta-D-ribofuranuronamide IK Intermediate (conductance) potassium channelsIKCa Ca2+-activated K+ currentIKDR delayed rectifier K+ currentIL-1β interleukin-1β IMDM Iscove’s modified Dulbecco’s mediumINS37217 P1-(uridine 5')-P4-(2'-deoxycytidine-5')tetraphosphateIOS intrinsic optical signalISI inter-spike intervalKCNQ canali K+KGlu potassium gluconateKN-62 (1-[N,O-bis(5-isoquinolinesulfonyl)-N-methyl-L-tyrosyl]-4-phenylpipera-
zine)KN-04 (N-[1-[N-methyl-p-(5-isoquinolinesulfonyl)benzyl]-2-(4-phenylpiperazine)
ethyl]-5-isoquinolinesulfonamide)KW-6002 (E)-1,3-diethyl-8-(3,4-dimethoxystyryl)-7-methyl-3,7-dihydro-1H-purine-
2,6-dioneLPS lipopolysaccharideLTD4 leukotriene D4LTP long term potentiationLUF5835 2-amino-4-(3-hydroxyphenyl)-6-(1H-imidazol-2-ylmethylsulfanyl)pyridine
-3,5-dicarbonitrilemAHP medium afterhyperpolarization potentialmEPSC miniature excitatory postsynaptic currentsmGluR metabotropic glutamate receptorMRE 2029F20 N-benzo[1,3]dioxol-5-yl-2-[5-(2,6-dioxo-1,3-dipropyl-2,3,6,7-tetra
hydro-1H-purin-8-yl)-1-methyl-1H-pyrazol-3-yloxy]-acetamideMRS 1220 9-chloro-2-(2-furyl) [1,2,4]triazolo[1,5-c]quinazolin-5-phenylacetamideMRS 1523 5-propyl-2-ethyl-4-propyl-3-(ethylsulfanylcarbonyl)-6-phenylpyridine-5-
carboxylateMRS 1706 N-(4-acetylphenyl)-2-[4-(2,3,6,7-tetrahydro-2,6-dioxo-1,3-dipropyl-1H-pu-
rin-8-yl) phenoxy]acetamide

Abbreviations XIII
MRS 1754 1,3-dipropyl-8-[4-[((4-cyanophenyl)carbamoylmethyl)oxy]phenyl]xanthineMRS 2179 2’-deoxy-N6-methyladenosine 3’,5’-bisphosphate tetraammonium saltMRS2211 6-(2’-chloro-5’-nitro-azophenyl)-pyridoxal-α5-phosphateMRS2279 2-chloro-N6-methyl-(N)-methanocarba-2’-deoxyadenosine
3’,5’-bisphosphateMRS 2365 (N)-methanocarba-2-methylthio-ADPMRS2500 2-iodo-N6-methyl-(N)-methanocarba-2’-deoxyadenosine 3’,5’-bisphosphateMRS2567 1,2-di-(4-isothiocyanatophenyl)ethane; MRS 2578 1,4-di-[(3-isothiocyanato phenyl)-thioureido]butaneNANC non-adrenergic non-cholinergic NBMPR nitrobenzylthioinosineNECA 5’-N-ethylcarboxamidoadenosineNF023 8-(benzamido)naphthalene-1,3,5-trisulphonic acidNGF neuronal growth factorNMDA N-methyl-D-aspartate NR1 NMDA receptor subunit 1NO Azote monoxydeNR2A NMDA receptor subunit 2ANR2B NMDA receptor subunit 2BNMDG N-methyl-D-glucamineNTPDase nucleoside triphosphate diphosphohydrolase5’-NT 5’-nucleotidase OGD oxygen-glucose deprivationPBS phosphate buffer solutionPCR polymerase chain reactionPKA protein kinase A PKC protein kinase CPLA2 phospholipase A2PLC phospholipase CPLD phospholipase DPNS peripheral nervous systemPPADS pyridoxalphosphate-6-azophenyl-2’,4’-disulfonic acid tetrasodium saltP/S penicillin/streptomycinPSB-601 8-[4-(4-benzylpiperazide-1-sulfonyl)phenyl]-1-propylxanthine PSVT paroxysmal supraventricular tachycardiaRB2 reactive blue 2Rs series resistanceRm membrane resistanceRT-PCR reverse transcriptase polymerase chain reactionSAH S-adenosylhomocysteinSAHH S-adenosylhomocysteine hydrolase sAHP slow afterhyperpolarization potentialSCH 58261 7-(2-phenylethyl)-5-amino-2-(2-furyl)-pyrazolo-[4,3-e]-1,2,4-triazolol[1,5-
c]pyrimidineSD spreading depressions.e. standard errorSK Small (conductance) potassium channelsSuramin 8-(3-benzamido-4-methylbenzamido)naphthalene-1,3,5-trisulfonic acidTEA tetraethyl ammoniumTM transmembrane domainTNP-ATP 2’-3’-O-(2,4,6-trinitrophenyl)-ATPTTX tetrodotoxinTRP transient receptor potential

Elisabetta CoppiXIV
UDP uridine 5’ diphosphateUTP uridine 5’ triphosphateUTPγS uridine-(O-3-thiotriphosphate)VDACL volume -dependent large-conductance anion channelsVIP vasoactive intestinal polypeptideVR1 vanilloid receptor 1VT 72 N6-methoxy-2-phenylethynyladenosineVT 158 N6-methoxy-2-phenylethynyl-5’-N-methylcarboxamidoadenosine, VT 160 N6-methoxy-2-(2-pyridinyl)-ethynyl-5’-N-methylcarboxamidoadenosineVT 163 N6-methoxy-2-p-acetylphenylethynyl-5’-N-methylcarboxamidoadenosineVUF 5574 N-(2-methoxyphenyl)-N’-(2-(3-pyridyl)quinazolin-4-yl)ureaWSAB 5-[[(4-pyridyl)amino]carbonyl]amino-8-methyl-2-(2-furyl)-pyrazolo[4,3-
e]1 ,2,4-triazolo[1,5-c]pyrimidine hydrochloride ZM 241385 4-(-2-[7-amino-2-2-furyl1,2,4triazolo2,3-a
1,3,5triazin-5-yl-amino]ethyl)phenol

Elisabetta Coppi, Purines as Transmitter Molecules: Electrophysiological Studies on Purinergic Signalling in Differ-ent Cell Systems, ISBN 978-88-8453-904-5 (print), ISBN 978-88-8453-905-2 (online) © 2008 Firenze University Press
Introduction
1. Historical overview
The physiological role of adenosine triphosphate (ATP) has been historically linked to cell metabolism since ATP is a ubiquitous intracellular energy source in a number of enzymatic processes. However, in recent years, ATP has emerged as one of the most versatile molecules of biological systems, being implicated in a variety of cell processes, from platelet aggregation to neurotransmission.
The fact that high-energy phosphate bond containing molecules, such as ATP, which plays such a key role in all aspects of cell function, may also act as an extracellular chem-ical messenger, was initially met with considerable scepticism. The first evidence about a role for ATP acting at the extracellular level came from the cardiovascular field, with pioneer studies in the ‘30s demonstrating potent actions of extracellular ATP and ade-nosine on the heart and coronary blood vessels (Drury et al., 1929). Such effects (nega-tive chronotropic effect on the heart, dilatation of coronary vessels, muscular weakness, ataxia, sleepiness) were very complex and hard to interpreter, involving both peripheral and central mechanisms (for a general overview see: Green et al., 1950).
Additional work was made in the ‘70s, when a new branch of neurotransmis-sion, other than the classical adrenergic and cholinergic pathways, was discovered in the autonomic nervous system. This kind of neurotransmission, initially called non-adrenergic non-cholinergic (NANC), was firstly described in the guinea-pig taenia coli (Burnstock et al., 1963) as an inhibitory action of an unknown substance in the contractile activity of this intestinal muscle. Later studies described similar NANC ef-fects in different smooth muscles of the digestive and urinary apparata, with both ex-citatory and inhibitory effects being described (Martinson 1965). Various substances have been initially suggested to mediate NANC neurotransmission (VIP, substance P, NO) but ATP emerged as the most likely candidate since exogenous application of purine derivatives mimicked NANC effects (Burnstock et al., 1970) and a release of ATP was found after stimulation of NANC fibres (Su et al., 1971). From these stud-ies, the term ‘purinergic signalling’ was firstly introduced in the scientific literature by Burnstock (Burnstock 1972).
At about the same period, the idea that nerve terminals could release more than one neurotransmitter was gaining support, particularly in the autonomic nervous sys-tem (Burnstock 1976). This concept seemed to be particularly appropriate to support the hypothesis of purinergic transmission, in fact in those years several studies dem-onstrated that ATP was co-released with acetylcholine in the bladder (Burnstock et al., 1978) and with noradrenaline in the taenia coli (Su et al., 1971) and in the vas deferens (Westfall et al., 1978).

Elisabetta Coppi2
An implicit concept for sustaining the hypothesis of purinergic neurotransmission proposed in the ‘70s was the existence of purinergic receptors. The first evidence in this direction suggested the existence of two different subfamilies of such ‘purinoceptors’, identified as P1 and P2 receptors, selective for adenosine and ATP respectively (Burn-stock 1978). This distinction helped clarifying the incredible variety and complexity of purine-mediated effects observed till then and the ubiquitous presence of ecto-AT-Pases, enzymes catalysing extracellular nucleotides degradation. The presence of these enzyme on cell membranes incredibly complicated the scenario by forming ADP, AMP and adenosine from extracellular ATP (Zimmermann et al., 1998), so that some of the actions of ATP were directly due to P2 receptor activation, whereas others were due to the indirect action of adenosine on P1 receptors.
Both P1 and P2 subfamilies where later recognised to be further divided into dif-ferent subtypes. P1 receptors were initially distinguished into two classes (A1 and A2 re-ceptors) on the basis of their excitatory or inhibitory actions on adenylyl cyclase (van Calker et al., 1979). Later work defined four different subtypes of P1 receptors: A1, A2A, A2B and A3 (Fredholm et al., 2001). P2 receptors appeared to be more heterogeneous, with P2T, P2Z and P2U subtypes being proposed from different authors (Gordon 1986; O’Connor et al., 1991). Definitive classification came from Abbracchio and Burnstock (Abbracchio et al., 1994) who proposed that P2 purinoceptors should belong to two major families: P2X ligand-gated ion channel receptors and P2Y G-protein-coupled re-ceptors. Cloning experiments supported this classification and helped subdividing P2 receptors into 7 P2X and 8 P2Y subtypes (King et al., 2002; North 2002).
To date, it is well recognised that purinergic signalling plays a fundamental role in several biological systems, from invertebrates to mammals, and purinergic-mediated effects including both short-term (neurotransmission, endothelial-mediated vasodila-tation, platelet aggregation) and long-term (cell proliferation, differentiation, migra-tion and death) phenomenon have been demonstrated.
2. Synthesis, release and catabolism of ATP
The synthesis of ATP, whose molecular structure is shown in figure 1, comprises three independent metabolic pathways. The adenine ring (synthesized from the nucleic acid cycle) and the ribosium molecule (synthesized from glucide metabolism) lead to the formation of the nucleoside adenosine (figure 2), whose metabolism is described in the next section. Successive nucleoside phosphorylations by the enzyme adenylate kinase leads to the synthesis of adenosine mono-, di- and triphosphate (AMP, ADP and ATP) respectively. These enzymatic reactions are characterized by great activation energy, obtained from the oxidation cycle of tricarboxylic acids (citric cycle) of the Krebs cycle, during oxidative phosphorylation (aerobic oxidation) in mitochondria (for a review see: Kalckar 1969). A small amount of ATP is also synthesized in the cytosol during the breakdown of glucose to lactic acid (anaerobic glycolysis).
The ATP, so generated, is mainly used for a number of metabolic processes, from energy supply to phosphate donor in phosphorylation processes, allowing cell survival and contributing to the fine tuned equilibrium of intracellular ATP, ADP, AMP and ad-enosine that constitute the ‘purine pool’ of the living cell. Only a small fraction of the intracellular amount of ATP is devolved to purinergic transmission by various mech-anisms of release. The intracellular ATP levels are usually kept in the mM range (1-2 mM), whereas extracellular concentrations of adenine nucleotides are scarce, generally

Introduction 3
fluctuating in the low nanomolar range, (Melani et al., 2005; Phillis et al., 1993). In fact, nucleosides and nucleotides are hydrophilic molecules whose size and charge impede them from crossing the plasma membrane by simple diffusion (Chaudry 1982; Glynn 1968). For this reason, specialised transport systems are required for their movement into or out of cells.
18
lactic acid (anaerobic glycolysis).
Figure 1. Molecular structure of ATP.
The ATP, so generated, is mainly used for a number of metabolic processes, from energy supply to
phosphate donor in phosphorylation processes, allowing cell survival and contributing to the fine tuned
equilibrium of intracellular ATP, ADP, AMP and adenosine that constitute the ‘purine pool’ of the
living cell. Only a small fraction of the intracellular amount of ATP is devolved to purinergic
transmission by various mechanisms of release. The intracellular ATP levels are usually kept in the mM
range (1-2 mM), whereas extracellular concentrations of adenine nucleotides are scarce, generally
fluctuating in the low nanomolar range, (Melani et al., 2005; Phillis et al., 1993). In fact, nucleosides
and nucleotides are hydrophilic molecules whose size and charge impede them from crossing the plasma
membrane by simple diffusion (Chaudry 1982; Glynn 1968). For this reason, specialised transport
systems are required for their movement into or out of cells.
When the ‘purinergic hypothesis’ was firstly formulated, it was generally assumed that the main
source of ATP acting on purinoceptors was damaged or dying cells (Bodin et al., 2001). However, it is
now recognized that ATP is released from many cells in a physiological or pathophysiological way in
response to specific stimuli by numerous mechanisms, including vesicular exocytosis, voltage-
dependent anion channels and connexin hemichannels.
Vesicular release of ATP.
It has been known for a long time that some secretory vesicles of the autonomic nervous system
terminals contain, in addition to catecholamine or acetylcholine, large quantities of ATP (Douglas et al.,
1966; Dowdall et al., 1974). At first, it was thought that the principal role of ATP present in synaptic
vesicles was associated with the supply of energy needed for the storage and the membrane transport of
neurotransmitters, or with the process of vesicular exocytosis (Johnson 1987). However, the kinetics of
ATP and neurotransmitter release were shown to be of the same magnitude, suggesting that ATP was
OHHO
O
N
N
N
NH2
OOP
O O O-
-
OP
O
P
O
O-O-
Figure 1. Molecular structure of ATP.
When the ‘purinergic hypothesis’ was firstly formulated, it was generally assumed that the main source of ATP acting on purinoceptors was damaged or dying cells (Bo-din et al., 2001). However, it is now recognized that ATP is released from many cells in a physiological or pathophysiological way in response to specific stimuli by numerous mechanisms, including vesicular exocytosis, voltage-dependent anion channels and connexin hemichannels.
2.1 Vesicular release of ATP
It has been known for a long time that some secretory vesicles of the autonomic nervous system terminals contain, in addition to catecholamine or acetylcholine, large quanti-ties of ATP (Douglas et al., 1966; Dowdall et al., 1974). At first, it was thought that the principal role of ATP present in synaptic vesicles was associated with the supply of energy needed for the storage and the membrane transport of neurotransmitters, or with the process of vesicular exocytosis (Johnson 1987). However, the kinetics of ATP and neurotransmitter release were shown to be of the same magnitude, suggesting that ATP was likely released as a neurotransmitter itself (Silinsky 1975; Zimmermann et al., 1976). For instance, stimulation of the frog motor nerve at the neuromuscular junction implied that ATP was released synchronously together with acetylcholine with a brief latency characteristic of quantal release from synaptic vesicles (Silinsky et al., 1996).
The vesicular release of ATP is typical (even if not exclusive) of neuronal cells, and is triggered by specific stimuli. For example, it is mediated by K+-induced membrane depolarization (White 1978) in a TTX-sensitive (Kasakov et al., 1988) and Ca2+-de-pendent way (White et al., 1982). Electrical stimulation of nerve terminals is also able to induce the vesicular release of ATP. It has been demonstrated that brief, high-fre-quency burst stimulations (100 Hz for 50 ms duration every 2 s for 1 min: to mimic long term potentiation: LTP) of rat hippocampal CA1 pyramidal cells induces a more than nine fold increase in the basal ATP outflow, reaching a maximum 1 minute af-

Elisabetta Coppi4
ter stimulation onset (Cunha et al., 1996). The same authors demonstrated that a pro-longed, low-frequency train of stimulations (5 Hz, 900 pulses, to mimic long term de-pression: LTD) does not produce similar effects on ATP release. These observations suggested a potential role of ATP during intense synaptic activity or synaptic plasticity phenomena, in particular LTP, and this hypothesis has been largely confirmed in the following years (Fujii 2004; Wieraszko 1996).
2.2 Anion channel-mediated release of ATP
Experimental evidence indicates that, in some cases, ATP is released in a non-secre-tory fashion (Ferguson 1999). Since ATP cannot cross the cell membrane, it has to be assumed that a carrier membrane protein is involved. It is known that most ATP molecules exist in anionic form (ATP4-) at physiological pH, and that a number of Cl- channels exhibit significant permeability to large organic anions (Strange et al., 1996). Therefore, the possibility exists that some anion channels can also conduct ATP.
Firstly, the cystic fibrosis transmembrane conductance regulator (CFTR) has been reported as a possible candidate for this mechanism. CFTR is a member of the ATP-binding cassette (ABC) protein family, a group of membrane ATPases which can trans-port various substrates (inorganic anions, amino acids, polysaccharides, sugars and peptides) against their concentration gradient (Saurin et al., 1999). These membrane proteins are cAMP-dependent Cl- channels which have a fundamental role in promot-ing osmotic secretion of liquids into the lumen of airways epithelia, and whose impair-ment causes cystic fibrosis disease. It has been firstly demonstrated that CFTR may also function as an ATP-permeable channel, providing an efficacious mechanism of ATP release in the extracellular space (Reisin et al., 1994). However, the concept that some ABC proteins can transport or release ATP by acting as an ATP channel (the so called “CFTR=ATP channel hypothesis”) has been later confuted in a number of studies (Grygorczyk et al., 1996; Li et al., 1996). An alternative explanation for the anion channel-associated efflux of ATP came from studies of swelling-induced ATP release in a murine mammary cell line (C127i). In these cells, hypotonic-induced cel-lular swelling activates volume- and voltage-dependent large-conductance anion chan-nels (VDACL Cl- channels) which exhibit significant permeability to large organic ani-ons, such as glutamate and ATP. Patch-clamp studies clearly demonstrated that these Cl- channels are also permeable to ATP, with a PATP/PCl ratio of 0.08–0.1 (Sabirov et al., 2001), which is comparable to the value previously reported for CFTR-expressing cells (PATP/PCl=0.1-0.2: Cantiello et al., 1998). These works also clarified why the swelling-in-duced ATP efflux was inhibited by extracellularly applied Gd3+, which blocks VDACL but not CFTR channels.
2.3 Connexin hemichannel-mediated ATP release
Connexins are membrane proteins assembled in hexamers on the plasma membrane to form a ‘connexon’. This structure is a half of a gap junction, which forms a whole gap junction when tied together with an analogous connexon domain on the plasma mem-brane of an adjacent cell. The main role of gap junctions is electrical coupling between adjacent cells through the so called ‘electrical synapse’, but they are also permeable to ions and small molecules, such as Ca2+, fluorescent dyes and cAMP. In fact, fluorescent dye fluxes between cells in intact tissues have been used to ascertain the presence of gap junctions on adjacent cells. However, in addition to docking with connexins hexam-

Introduction 5
ers in neighbouring cells, connexons may form ‘hemichannels’ that exist independent-ly within an individual cell. In this case, connexons serve as transmembrane channels linking the cytoplasmic compartment to the extracellular space and providing a path-way for the release of small-sized molecules (Hofer et al., 1998; Zampighi et al., 1999).
The evidence that connexin hemichannels are also permeable to ATP came from studies on primary cultures of mouse astrocytes. Astrocytes, like multiple other cell types, are capable of widespread intercellular communication via propagated increases in intracellular Ca2+ concentration in a variety of circumstances, such as mechanical stimuli (Charles et al., 1991). Initial studies identified gap junctions as a pathway for intercellular Ca2+ wave propagation, supposing a direct passage of Ca2+ ions from one cell to the other (Charles et al., 1992). More recent studies demonstrated that an extra-cellular signalling pathway, involving ATP release and purinergic receptor activation, is required. In fact, in a recent study (Stout et al., 2002), mechanically-stimulated ATP release in astrocytes was enhanced by the connexin hemichannel activator quinine and by low extracellular Ca2+ (a manoeuvre known to induce the opening of hemichan-nels). In addition, Ca2+ waves were blocked by the ATP degradator apyrase and by the selective antagonist of P2 receptors, PPADS (Stout et al., 2002). Successive studies in different kinds of cells (corneal endothelial cells: Gomes et al., 2005a; inner ear: Zhao et al., 2005; human mesenchymal stem cells: Kawano et al., 2006) definitely demonstrat-ed that Ca2+ wave propagation is mediated by extracellular ATP released through con-nexin hemichannels and successive P2 receptor activation. This mechanism engages ATP in a number of developmental processes mediated by intercellular propagation of Ca2+ waves, such as neural progenitor stem cell proliferation in the subventricular zone (Weissman et al., 2004) or in the retinal pigmented epithelium (Pearson et al., 2005).
The cessation of ATP signalling is thinly regulated by enzymatic degradation of ex-tracellular nucleotides through membrane-bound ecto-ATPases and ecto-5’nucleotidas-es. These enzymes, widely expressed by several cell lines, are able to hydrolyze extracellu-lar purines with a very high efficacy, for example the time to eliminate a single quantum of released ATP by ecto-ATPases has been estimated to be between 50 and 100 ms.
Several metabolic pathways are responsible for ATP catabolism. The first step of the reaction is catalyzed by ecto-ATPases, or ecto-nucleoside triphosphate diphospho-hydrolases (NTPDases), that hydrolyze a single phosphate group from ATP and ADP leading respectively to ADP and AMP formation. This class of enzymes comprise differ-ent isoforms: NTPDase1, 2, 3 (and possibly 8: Sesti et al., 2003) are membrane-bound enzymes responsible for ATP catabolism at extracellular level, whereas NTPDase4,5,6 are soluble cytoplasmic isoforms that dephosphorylate intracellular nucleotides (Zim-mermann 2000). NTPDase1 hydrolyzes ATP and ADP equally well, while NTPDase2 and 3 present high and moderate ATP preference, respectively (Muller et al., 2006). Se-lective inhibitors of these enzymes, such as the ATP analogue ARL 67156 (Crack et al., 1995), have been recently developed since an excellent strategy to potentiate ATP sig-nalling is just inhibiting its catabolism, which also allows the experimenter to distin-guish ATP-mediated from adenosine-elicited effects. More selective and potent ecto-ATPase inhibitors have been recently developed by Müller and co-workers (Müller et al., 2006). This class of compounds, polyoxotungstate derivatives, includes different kinds of molecules which can selectively inhibit NTPDase 1, 2, 3, or all of them, with high affinity (Ki in the low micromolar range) without directly binding to P2 receptors. A variant of NTPDase enzymes in ATP catabolism is the ecto-apyrase, which removes two phosphate groups at once from an ATP molecule leading to the formation of AMP and pyrophosphate (PPi).

Elisabetta Coppi6
Successive steps of dephosphorylation are mediated by ecto-5’nucleotidases (e5’-NTs) that finally convert AMP to adenosine (for a general overview see: Zimmermann 1996). Also this class of enzymes possesses soluble cytosolic isoforms responsible for degradation of intracellular purines. E5’-NT are competitively inhibited by the nucle-otide analogue AOPCP, that is commonly used to block adenosine formation from ex-tracellular ATP. It should be noted that this compound does not prevent ATP degra-dation but leads to the accumulation of extracellular ADP, which is itself an agonist at some P2 receptors. Anyway, AOPCP is a useful tool for separating P2 from P1-medi-ated actions. NTPDase activity is enhanced by either Ca2+ or Mg2+, whereas e5’-NT is inhibited by extracellular ATP and ADP.
All these enzymes can catalyze the hydrolysis of purines with a very high efficacy, but they also possesses a lower affinity for a variety of other nucleotides, such as pyrimidines (UTP, UDP, UMP), that may function as substrates as well (Zimmermann 1996).
Several studies (James et al., 1993; Torres et al., 1990; Zimmermann 1986) dem-onstrated that the extracellular rate of ATP and ADP hydrolysis (operated by NTP-Dases1,2,3 and apyrase) is higher than that of AMP hydrolysis (catalyzed by e5’-NT). In fact, it has been reported that the T1/2 for ATP conversion to adenosine is approxi-mately 200 ms, and the last step in this pathway (transformation of AMP to adenosine by e5’NT) seems to be the rate-limiting step (Dunwiddie et al., 1997b). Thus, ATP half-life in the extracellular space is very short, in the range of a few ms, whereas AMP is a more long-lived molecule.
3. Synthesis, release and catabolism of adenosine.
The synthesis of adenosine is strictly linked to ATP metabolism, since ADP, AMP and adenosine are all products of ATP breakdown.
As shown in figure 2, intracellular adenosine is generated from AMP by intrac-ellularly localized 5’-nucleotidases (5’-NTs; a family of numerous enzyme isoforms) (Schubert et al., 1979) and from S-adenosylhomocysteine (SAH) by cytoplasmic S-ad-enosylhomocysteine hydrolase (SAHH) (Broch et al., 1980). Adenosine catabolism is due to the enzymes adenosine deaminase (ADA) and adenosine kinase (AK), which lead to the formation of inosine and AMP, respectively (for a review see: Borowiec et al., 2006).
Adenosine synthesis from AMP is strictly dependent on the energy balance of the cell. In fact, 5’-NT is inhibited by ATP itself and possesses a high affinity for the sub-strate AMP. For this reason, when the cell is supporting a high metabolic activity with a great breakdown of ATP and production of its catabolite AMP, the enzyme 5’-NT is in the ideal conditions to work, encountering a high concentration of the substrate (AMP) and a low level of the inhibitor (ATP) (Meghji et al., 1993). As a consequence, adenosine synthesis is greatly enhanced during periods of elevated metabolic activity or low energy supply, such as epileptic seizures or hypoxic and ischemic conditions. In agreement with these observations is the fact that adenosine appears to play a piv-otal role in balancing energy supply with energy demand in cell systems and has been termed a ‘retaliatory metabolite’.
Adenosine formation from SAH is only relevant in peripheral tissues (for example in the heart), whereas the low level of the enzyme SAHH in the central nervous system (CNS) is responsible for the small contribute of this reaction to the final intracellular concentration of adenosine (Latini et al., 1995).

Introduction 7
23
Figure 2. Molecular structure of adenosine.
As already mentioned for ATP, adenosine itself is a hydrophilic molecule that cannot cross the
plasma membrane. There are two pathways by which adenosine can gain access to the extracellular
compartment: it can be released through specific membrane transporters, or it can be synthesized
directly in the extracellular milieu from ATP catabolism operated by membrane ecto-nucleotidases and
ecto-ATPases. A third possibility would be the exocytotic release of adenosine. However, partly due to
technical reasons, the presence of adenosine in vesicles has yet to be proven.
Adenosine release
Bi-directional nucleoside transporters contribute to the fine-tuning of extracellular concentrations
of adenosine in the vicinity of adenosine receptors. Two classes of such molecules have been described:
equilibrative nucleosides transporters (ENTs) and concentrative nucleosides transporters (CNTs). The
first class consists of facilitated diffusion of adenosine on the basis of its concentration gradient, without
energy consumption, and is selectively blocked by nitrobenzylthioinosine (NBMPR) and dipyridamole.
The second class of adenosine transporters takes advantage of the Na+ concentration gradient across the
cell membrane to transport adenosine against its concentration gradient. This mechanism is called Na+-
dependent concentrative nucleoside transport (for a general review see: Griffith et al., 1996).
The fact that nucleoside transport inhibitors, for example dipyridamole (Phillis et al., 1979) or low
temperature (Dunwiddie et al., 2000), generally potentiate the actions of extracellular adenosine
demonstrates their predominant reuptake function. In fact, the main role of both classes of nucleoside
transporters is to rapidly clear adenosine once generated into the extracellular milieu (Baldwin et al.,
2004; Kong et al., 2004).
It has been demonstrated that hypoxic conditions down-regulate dipyridamole-sensitive adenosine
transporters (ENT1/2) thus increasing adenosine half-life in the extracellular space (Eltzschig et al.,
2005). This mechanism may contribute to the enhancement of extracellular adenosine concentrations, in
O
N
N
N
NH2
HO
OH OHFigure 2. Molecular structure of adenosine.
As already mentioned for ATP, adenosine itself is a hydrophilic molecule that can-not cross the plasma membrane. There are two pathways by which adenosine can gain access to the extracellular compartment: it can be released through specific membrane transporters, or it can be synthesized directly in the extracellular milieu from ATP ca-tabolism operated by membrane ecto-nucleotidases and ecto-ATPases. A third possi-bility would be the exocytotic release of adenosine. However, partly due to technical reasons, the presence of adenosine in vesicles has yet to be proven.
3.1 Adenosine release
Bi-directional nucleoside transporters contribute to the fine-tuning of extracellular concentrations of adenosine in the vicinity of adenosine receptors. Two classes of such molecules have been described: equilibrative nucleosides transporters (ENTs) and con-centrative nucleosides transporters (CNTs). The first class consists of facilitated diffu-sion of adenosine on the basis of its concentration gradient, without energy consump-tion, and is selectively blocked by nitrobenzylthioinosine (NBMPR) and dipyridamole. The second class of adenosine transporters takes advantage of the Na+ concentration gradient across the cell membrane to transport adenosine against its concentration gra-dient. This mechanism is called Na+-dependent concentrative nucleoside transport (for a general review see: Griffith et al., 1996).
The fact that nucleoside transport inhibitors, for example dipyridamole (Phillis et al., 1979) or low temperature (Dunwiddie et al., 2000), generally potentiate the actions of extracellular adenosine demonstrates their predominant reuptake function. In fact, the main role of both classes of nucleoside transporters is to rapidly clear adenosine once generated into the extracellular milieu (Baldwin et al., 2004; Kong et al., 2004).
It has been demonstrated that hypoxic conditions down-regulate dipyridamole-sensitive adenosine transporters (ENT1/2) thus increasing adenosine half-life in the extracellular space (Eltzschig et al., 2005). This mechanism may contribute to the en-hancement of extracellular adenosine concentrations, in concert with its augment-ed synthesis operated by intracellular 5’-NT previously described, during hypoxic-ischemic conditions.

Elisabetta Coppi8
3.2 Synthesis of adenosine at extracellular level
Adenosine synthesis can take place directly at the extracellular level, through the hy-drolysis of extracellular ATP operated by NTPDases and e5’-NTs, as already described. Hence, these enzymes have a dual function in modulating purinergic neurotransmis-sion: i) they rapidly interrupt ATP-mediated signalling by degrading extracellular nu-cleotides; ii) they synthesise extracellular adenosine, which activates P1 receptors. The increased adenosine concentrations reported in the extracellular space during patho-logical conditions and cell damage are likely due to increased release from the intrac-ellular compartment, but may also arise from conversion of extracellular ATP to ad-enosine by NTPDases and e5’-NTs. In this regard, it has been suggested that the close spatial correlation between adenosine P1 receptors and e5’-NTs suggests that the ad-enosine formed from ATP at the extracellular level may be of greater physiological rel-evance than the released nucleotide itself (Cunha et al., 1998). However, how much the released ATP contributes to the adenosine concentration in the extracellular milieu still needs to be clarified.
A schematic illustration of adenosine and ATP metabolic pathways is depicted in figure 3.
Figure 3. Metabolic pathways of purines nucleotides and nucleosides and the different mecha-nisms of release.

Elisabetta Coppi, Purines as Transmitter Molecules: Electrophysiological Studies on Purinergic Signalling in Differ-ent Cell Systems, ISBN 978-88-8453-904-5 (print), ISBN 978-88-8453-905-2 (online) © 2008 Firenze University Press
Purinergicreceptors
Purinergic receptors are subdivided into P1 and P2 receptors on the basis of their ag-onist profile: P1 receptors are activated by the adenine nucleoside (adenosine) while P2 receptors are activated by purine and pyrimidine nucleotides (ATP, ADP, UTP and UDP) (for a general review see: Ralevic and Burnstock 1998).
1. P1 receptors
Molecular cloning and pharmacological studies have identified four subtypes of ade-nosine P1 receptors: A1, A2A, A2B and A3 receptors (Fredholm et al., 2001). All of them have already been cloned at least from rat, mouse and human. Structural data report a close similarity between adenosine receptors of the same subtype among mammalian species, excepte for A3 receptors. This subtype is the most recently discovered one, be-ing cloned only in the last 15 years (Zhou et al., 1992), and presents the largest variabil-ity. For instance, almost 30% difference in the amino acid sequence is found between humans and rats (Fredholm et al., 2001).
All P1 receptors are metabotropic GPCR. Hence, A1 and A3 subtypes are associated with Gi activation, adenylyl cyclase inhibition and decrease of intracellular cAMP lev-els, while A2A and A2B receptors are linked to Gs proteins that activate the same enzyme increasing cAMP concentration in the cytosol. However, adenosine receptors have also been reported to couple to other G-proteins than Gs, modulating different second mes-senger systems (see table 1). For instance, in addition to their effects on adenylate cy-clase (and contrary to adenosine A2A receptors) adenosine A1, A2B and A3 receptors are also characterized by their stimulatory effect on phospholipase C (PLC) (Abbracchio et al., 1995a; Feoktistov et al., 1997). Furthermore, A1 and A3 receptors can also activate phospholipase D (PLD) (Fredholm et al., 2001). Several types of Ca2+ and K+ channels are also activated (either by a direct G protein-channel interaction or by second mes-senger systems) after adenosine receptor stimulation, such as the inward rectifier GIRK channel Kir3.0 that is positively modulated by adenosine A1 receptor activation (Taki-gawa et al., 2002).
A1 and A2A receptors present a particularly high affinity for the endogenous ligand, being activated by nanomolar concentrations of adenosine. On the other hand, the af-finity values of A2B and A3 receptors for adenosine in binding experiments are higher than 1 µM (Fredholm et al., 2001). For this reason, A2B and A3 subtypes are also called “low affinity receptors”. Under physiological conditions, extracellular adenosine con-centrations are estimated to be in the range of 30 to 200 nM (see: Latini et al., 2001). These levels are sufficient to activate A1 and A2A subtypes, but not “low affinity” A2B and
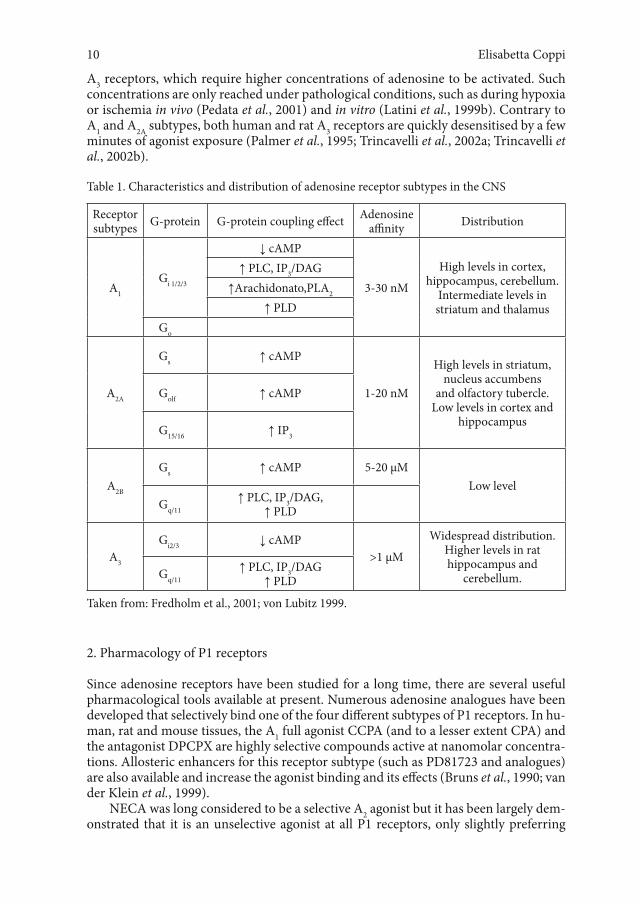
Elisabetta Coppi10
A3 receptors, which require higher concentrations of adenosine to be activated. Such concentrations are only reached under pathological conditions, such as during hypoxia or ischemia in vivo (Pedata et al., 2001) and in vitro (Latini et al., 1999b). Contrary to A1 and A2A subtypes, both human and rat A3 receptors are quickly desensitised by a few minutes of agonist exposure (Palmer et al., 1995; Trincavelli et al., 2002a; Trincavelli et al., 2002b).
Table 1. Characteristics and distribution of adenosine receptor subtypes in the CNS
Receptor subtypes G-protein G-protein coupling effect Adenosine
affinity Distribution
A1
Gi 1/2/3
↓ cAMP
3-30 nM
High levels in cortex, hippocampus, cerebellum.
Intermediate levels in striatum and thalamus
↑ PLC, IP3/DAG↑Arachidonato,PLA2
↑ PLDGo
A2A
Gs ↑ cAMP
1-20 nM
High levels in striatum, nucleus accumbens
and olfactory tubercle. Low levels in cortex and
hippocampus
Golf ↑ cAMP
G15/16 ↑ IP3
A2B
Gs ↑ cAMP 5-20 µMLow level
Gq/11↑ PLC, IP3/DAG,
↑ PLD
A3
Gi2/3 ↓ cAMP>1 µM
Widespread distribution. Higher levels in rat hippocampus and
cerebellum.Gq/11↑ PLC, IP3/DAG
↑ PLD
Taken from: Fredholm et al., 2001; von Lubitz 1999.
2. Pharmacology of P1 receptors
Since adenosine receptors have been studied for a long time, there are several useful pharmacological tools available at present. Numerous adenosine analogues have been developed that selectively bind one of the four different subtypes of P1 receptors. In hu-man, rat and mouse tissues, the A1 full agonist CCPA (and to a lesser extent CPA) and the antagonist DPCPX are highly selective compounds active at nanomolar concentra-tions. Allosteric enhancers for this receptor subtype (such as PD81723 and analogues) are also available and increase the agonist binding and its effects (Bruns et al., 1990; van der Klein et al., 1999).
NECA was long considered to be a selective A2 agonist but it has been largely dem-onstrated that it is an unselective agonist at all P1 receptors, only slightly preferring

Purinergic receptors 11
A2A subtypes (Fredholm et al., 2001). However, based on evidence that 2-substitution of NECA molecule increased selectivity, CGS 21680 was developed as an A2A selective agonist (Hutchison et al., 1989). This compound is less potent and selective in humans than in rats (Kull et al., 1999), but it has been replaced by another recently developed A2A agonist, ATL-146, which is 50 fold more potent than CGS 21680 at the human re-ceptor (Rieger et al., 2001). Among the numerous A2A antagonists, the most selective so far are SCH 58261 and the structurally related ZM 241385 (Poucher et al., 1995).
Potent A2B agonists with affinity values in the low nanomolar range have been lack-ing till recently, when a new class of non-adenosine compounds (pyridine derivatives) has been synthesised by Beukers and colleagues (Beukers et al., 2004). Among them, LUF5835 is a full agonist with an EC50 of 10 nM at human A2B receptor expressed in CHO cells. Unfortunately, its selectivity towards A1 and A2A receptors is not adequate to discriminate between them in native tissues. The situation is somewhat more favoura-ble for antagonists, as some potent and relatively selective compounds have been found among anilide derivatives of xanthines with Ki values in the low nanomolar range, such as MRS 1754 (Ji et al., 2001), that is over 200-fold selective for A2B versus all other P1 receptors (Kim et al., 2000). Another useful compound is MRE 2029F20, that acts as an inverse agonist to block A2B receptors (Varani et al., 2005). Finally, the more recently synthesised A2B antagonist is PSB-601 (Yan et al., 2006), a sulfophenylxanthine exhibits a Ki value of 3.6 nM for the human A2B receptor combined with high selectivity versus the other human adenosine receptor subtypes (575-fold versus A1, 134-fold versus A2A, and >278-fold versus A3).
An emblematic feature of the adenosine A3 receptor, the most recently discovered one, is its insensitivity to the antagonistic actions of methylxanthines, such as caffeine and theophylline, the traditional blockers of adenosine receptors (Fredholm 1995). Hence, most A3 antagonists are dihydropyridines, pyridines and flavonoids (Baraldi et al., 2000). Another class of highly selective compounds are isoquinoline and quinazo-line derivatives, such as VUF5574 that presents a Ki value of 4 nM versus human A3 re-ceptors but not versus the rat isoform (Muijlwijk-Koezen et al., 2000). In this regard, it is worth noticing that significant species differences in the affinity of adenosine A3 re-ceptor antagonists have been noted, as expected from the high structural inter-species variability already mentioned. The affinity values of several A3 blockers are typically more than 100-fold greater on human than rat receptors, as described for MRS 1220. The unique rat-selective compound is the A3 agonist MRS 1523. In contrast, the affin-ity of the most widely used A3 agonist, Cl-IB-MECA, does not vary beyond an order of magnitude between the species examined, at least among mammals. The high affinity (low nanomolar range) and selectivity (more than 100-fold versus A1 and A2A recep-tors) of this compound towards A3 receptors turns it into the most used pharmacologi-cal tool for investigating A3-mediated effects (Jeong et al., 2003).
3. Distribution of P1 receptors.
Receptor distribution provides helpful information on whether the endogenous ago-nist will exert significant effects in the intact organism. Thus, in this case, the rather low levels of adenosine present under basal physiological conditions and the 3-fold dif-ference in receptor affinity for the agonist between the four P1 subtypes might suggest adenosine acts as a tonic modulator of normal cell functions or whether its role only becomes relevant during pathological conditions. As reported in table 1, the highest levels of adenosine A1 receptors are present in the CNS (Dixon et al., 1996) with well

Elisabetta Coppi12
known regional distributions (Schindler et al., 2001) that will be examined in detail. High levels are also found in adrenal glands, eye and atria. Intermediate levels are also found in skeletal muscles, liver, kidney, adipose tissue, gastrointestinal smooth muscles and bronchi. Lung and pancreas present low level of A1 receptor expression (Fredholm et al., 2001).
A2A receptors are highly present in spleen, thymus, immune cells (leukocytes and granulocytes) and platelets. Lower levels are also found in the heart, lung and blood vessels. A2B subtype is particularly abundant in the gastrointestinal tract, mainly in cae-cum, colon and urinary bladder. Other regions are lung, blood vessels and adipose tissue.
The A3 subtype is mainly found in rat testis (Meyerhof et al., 1991) and mast cells, in accordance with the fact that for a long time the unique role assigned to this recep-tor have been mast cell degranulation and histamine release. Intermediate levels are also found in the lung, spleen, thyroid and liver (Linden et al., 1993; Salvatore et al., 1993). Low levels of A3 receptors are found in the brain (Dixon et al., 1996), as de-scribed below.
3.1 Central Nervous System (CNS)
There is much information on the distribution of the A1 and A2A receptors in the brain because excellent pharmacological tools, including radioligands, are available to exact-ly localise protein expression on cell membranes. In the case of A2B and A3 data are less impressive, and mostly related on the expression of the corresponding mRNAs that do not provide any information about the sub cellular districts of receptor distribution. It is true that mRNA expression and protein distribution often co localize, but occasion-ally do not exactly match. For example, in several brain regions, mRNA expression can-not be obviously detected even in areas where immunostaining for the receptor protein is observed. This is frequently due to the specialised expression of receptor proteins at nerve terminals, the protein synthesis taking place in the cell soma sometimes quite re-mote from the presynaptic region.
As already mentioned, the highest levels of A1 receptor expression are found in the CNS, suggesting a particularly important role of adenosine in brain functions. Recent-ly, by using [18F]8-cyclopentyl-3-(3-fluoropropyl)-1-propylxanthine ([18F]CPFPX) and PET imaging, A1 receptors were quantified in the human CNS (Meyer et al., 2005). The highest expression of A1 receptors has been found in the cortex, hippocampus, cerebel-lum and dorsal horn of the spinal cord; intermediate levels in basal ganglia structures including the striatum (mRNA encoding A1 receptors is present in large striatal cholin-ergic interneurones: (Dixon et al., 1996) globus pallidus, subthalamic nucleus and tha-lamus (Fredholm et al., 2001). An abundant expression of the adenosine A1 receptor protein also occurs in the trigeminal ganglia, a finding supporting a role of this receptor in pain regulation (Schindler et al., 2001). Neuronal A1 receptors are localized both pre- and postsynaptically (Deckert et al., 1988). In the hippocampus, a brain area in which A1 receptors are abundant, subcellular analysis of nerve terminals revealed that A1 receptor immunoreactivity is strategically located in the active zone of presynaptic terminals, as expected on the basis of the ability of A1 receptor agonists to depress neurotransmitter release. It has also been demonstrated that A1 receptor immunoreactivity is evident at postsynaptic sites together with NMDA receptor subunits NR1, NR2A and NR2B and with N-and P/Q-type calcium channel immunoreactivity, emphasizing the importance of A1 receptors in the control of dendritic integration (Rebola et al., 2003). A1 receptors

Purinergic receptors 13
can be found also extrasynaptically on dendrites (Rivkees et al., 1995) and on the ax-onal fibres of the hippocampus (Swanson et al., 1995). Activation of A1 receptors along the axon may be a powerful extrasynaptic mechanism by which adenosine alters axonal electric transmission to inhibit neurotransmitter release (Swanson et al., 1995).
A2A receptors are principally located in the basal ganglia: in the caudate-putamen, nucleus accumbens and olfactory tubercle (Jarvis et al., 1989; Rosin et al., 1998). In particular, this receptor subtype is expressed on striatopallidal GABAergic-enkephalin neurones (where it co-localises with dopamine D2 receptors), but not on GABAergic-dynorphin striatal neurones (Fredholm et al., 2003). In the striatum the A2A receptor gene is found to a lesser extent also in large striatal cholinergic interneurones (Dixon et al., 1996). A minor density of A2A receptor mRNA has been identified also in hippoc-ampus and cortex (Cunha et al., 1994; Dixon et al., 1996). Besides postsynaptically, A2A receptors are also located presynaptically on different GABAergic, cholinergic, gluta-matergic neurone types, although to a lesser extent (Hettinger et al., 2001; Rosin et al., 2003). In recent years, particular interest has been dedicated to study receptor dimeri-zation, either in homomeric and heteromeric structures, since this phenomenon seems to frequently occur in numerous cell types and can modify the pharmacological profile of receptors and their functional role. Various lines of evidence indicate that such an interaction occurs in the striatum between A2A adenosine and D2 dopamine receptors, which usually co-localize in this brain region. This heterodimerization inhibits D2 re-ceptor functions (Ferrè et al., 1991), leading to co-aggregation and co-internalization of both proteins as a result of long-term exposure to A2A or D2 agonists (Hillion et al., 2002).
Both A1 and A2A receptors are expressed in the brain not only in neurones but also on microglial cells (Fiebich et al., 1996), astrocytes (Biber et al., 1999; Lee et al., 2003), blood cells and vasculature (Phillis 2004).
The distribution of A2B and A3 adenosine receptors in the CNS has been difficult to determine since central levels of mRNAs encoding these two adenosine receptors are extremely low, even below the detection limits of in situ hybridisation techniques. The more sensitive RT-PCR method was then successfully applied to this issue (Dixon et al., 1996).
A2B receptors are ubiquitously distributed in the brain and their mRNA has been detected in all rat cerebral areas studied (Dixon et al., 1996; von Lubitz 1999). Up to now, it has been difficult to relate A2B receptors to specific physiological responses be-cause of the paucity of A2B selective agonists or antagonists.
The expression level of A3 adenosine receptor in the brain is generally lower than that of the other subtypes (Ji et al., 1994) and is highly species-dependent (Fredholm et al., 2000; Fredholm et al., 2001). A3 receptors are found in both neuronal and non-neu-ronal elements, i.e. astrocytes, microglia, and vasculature of the cerebral tissue (Zhao et al., 1997) with widespread distribution. However, in the rat, a significant expression of A3 receptors is found in cerebellum and hippocampus (De M et al., 1993; Dixon et al., 1996) where they are mainly expressed at the presynaptic level (Lopes et al., 2003).
4. P2 receptors
Extracellular P2 receptors are divided into two main classes based on whether they are ligand-gated ion channels (P2X) or G-protein coupled receptors (P2Y) (for a review see: Ralevic and Burnstock 1998).

Elisabetta Coppi14
The lack of highly-selective agents or reliable radioligand binding assays for the characterization of P2 receptors, in comparison to the relatively more defined adenos-ine receptor field, has led to difficulty in discriminating between the different P2X and P2Y receptor subtypes. Only recently, advantage has been taken from new highly selec-tive molecules and markers able to discern at least between some of the different P2 re-ceptor subtypes, such as P2Y1 (Houston et al., 2006), P2X7 (Romagnoli et al., 2004) and P2X3 and P2X2/3 (Jarvis et al., 2004).
5. P2X receptors
In the mid ‘90s, seven different genes encoding P2X receptors (P2X1-7) were identi-fied in vertebrates (Brake et al., 1994; Valera et al., 1994). They encode for seven dif-ferent subunits of P2X receptors that share 40-50% identity in amino acid sequenc-es (for a review see: North et al., 2000). Each subunit (composed of between 379 to 595 amino acids residues) comprises two hydrophobic transmembrane domains, sep-arated by a large extracellular loop (about 280 amino acids) containing the ligand-binding region (Jiang et al., 2000b). Both -NH2 and -COOH termini are cytoplasmic (Brake et al., 1994). A striking feature among P2X1-7 subunits is the presence of 10 con-served cysteine residues in the extracellular loop that could be oxidized to form di-sulfide bonds contributing to the tertiary structure of the protein (Ennion et al., 2002). In addition, all P2X subunits contain consensus sequences for N-linked glycosylation processes (Asn-X-Ser/Thr) that are essential for receptor trafficking to the cell surface (Torres et al., 1998a).
From the described structure it seemed unlikely that the two transmembrane do-mains (TM) of a single P2X subunit would be able to form an ion-conducting pore on their own and suggested that subunits associate to form multimeric channels. In fact, it has been confirmed that the assembly of three or six subunits (as homomers or heter-omers) builds up a functional nucleotide receptor channel (Lewis et al., 1995). No crys-tal structure of P2X receptors is available at present, but recent studies using atomic force microscopy (AFM) and electron microscopy of purified P2X2 receptors gave us the first pictures of the receptors (Barrera et al., 2005). On the basis of this and other studies (Mio et al., 2005: see also figure 3) the ‘trimeric hypothesis’, which is also consist-ent with a model of three ATP molecules binding to describe channel opening reported in previous works (Bean 1990; Bean et al., 1990; Ding et al., 1999), is prevailing.
A schematic example of the molecular structure of a single subunit and of trimeric assembly of P2X receptors is shown in figure 4.
Once the multimeric conformation of P2X receptors was confirmed, studies of coimmunoprecipitation with epitope-tagged subunits transfected in HEK293 cells showed that P2X2/P2X3, P2X4/P2X6 and P2X1/P2X5 may co-assemble to form heter-omers (Torres et al., 1998b). Recent investigations employing different recombinant systems gave evidence for several novel P2X receptor phenotypes: P2X1/2 (Brown et al., 2002b), P2X1/4 (Nicke et al., 2005) and P2X2/6 (King et al., 2000). In contrast, P2X7 has the unique characteristic to be only found in homomeric structures (Torres et al., 1999), while P2X6 receptors appear only to assemble in heteromeric channels, with no described functional homomeric structures being described (Soto et al., 1996).
The permeability of some P2X receptors presents peculiar characteristics since it changes during prolonged agonist application. In fact, some P2X receptors show pore dilation during prolonged agonist exposure as evidenced by a progressive increase in

Purinergic receptors 15
their permeability to large organic cations, including NMDG, Tris, and TEA (Virginio et al., 1999). Such phenomenon, described for P2X2, P2X2/3, P2X4 and, most of all, for P2X7 receptors, is probably due to the existence of several open conformation states (Stojilkovic et al., 2005). The P2X2 dilated pore reverts to its closed state within 2 s after agonist removal (Virginio et al., 1999). On the contrary, permeabilization induced by prolonged P2X7 receptor stimulation seems to be an irreversible process, usually fol-lowed by membrane blebbing and cell death (Klapperstuck et al., 2000). For this reason, the P2X7 subtype was named ‘cytolytic P2Z receptor’ when firstly described in macro-phages and lymphocytes (Surprenant et al., 1996). The mechanism of pore formation during prolonged agonist exposure is still unclear, and options vary between decreased filter selectivity of existing channels (Smart et al., 2002) to formation of oligomers and rearrangement of receptors into new molecular complexes (Kim et al., 2001).
32
A schematic example of the molecular structure of a single subunit and of trimeric assembly of
P2X receptors is shown in figure 4.
Figure 4. Structural model of the P2X2 receptor.
A. Membrane topology of the P2X2 receptor.
Each subunit is proposed to have two
transmembrane domains (TM-1 and TM-2) with
a cysteine rich large extracellular domain. Three
subunits are combined to form a functional
channel. The marks of S–S indicate putative
disulfide bonds. B. Schematic drawing of the
P2X2 receptor model. Three subunits form an
inverted three-sided pyramidal structure with a
crown-shaped outer surface. Taken from: Mio et
al., 2005.
Once the multimeric conformation of P2X receptors was confirmed, studies of
coimmunoprecipitation with epitope-tagged subunits transfected in HEK293 cells showed that P2X2/P2X3,
P2X4/P2X6 and P2X1/P2X5 may co-assemble to form heteromers (Torres et al., 1998b). Recent
investigations employing different recombinant systems gave evidence for several novel P2X receptor
phenotypes: P2X1/2 (Brown et al., 2002b), P2X1/4 (Nicke et al., 2005) and P2X2/6 (King et al., 2000). In
contrast, P2X7 has the unique characteristic to be only found in homomeric structures (Torres et al., 1999),
while P2X6 receptors appear only to assemble in heteromeric channels, with no described functional
homomeric structures being described (Soto et al., 1996).
The permeability of some P2X receptors presents peculiar characteristics since it changes during
prolonged agonist application. In fact, some P2X receptors show pore dilation during prolonged agonist
exposure as evidenced by a progressive increase in their permeability to large organic cations, including
NMDG, Tris, and TEA (Virginio et al., 1999). Such phenomenon, described for P2X2, P2X2/3, P2X4 and,
most of all, for P2X7 receptors, is probably due to the existence of several open conformation states
(Stojilkovic et al., 2005). The P2X2 dilated pore reverts to its closed state within 2 s after agonist removal
(Virginio et al., 1999). On the contrary, permeabilization induced by prolonged P2X7 receptor stimulation
seems to be an irreversible process, usually followed by membrane blebbing and cell death (Klapperstuck
et al., 2000). For this reason, the P2X7 subtype was named ‘cytolytic P2Z receptor’ when firstly described
Figure 4. Structural model of the P2X2 receptor. A. Membrane topology of the P2X2 recep-tor. Each subunit is proposed to have two transmembrane domains (TM-1 and TM-2) with a cysteine rich large extracellular domain. Three subunits are combined to form a functional channel. The marks of S–S indicate putative disulfide bonds. B. Schematic drawing of the P2X2 receptor model. Three subunits form an inverted three-sided pyramidal structure with a crown-shaped outer surface. Taken from: Mio et al., 2005.
Electrophysiological and pharmacological properties of P2X ligand gated cation channels are strictly dependent on the subunit composition of the receptor. Studies on recombinant homomeric P2X receptors have been used to characterise the general pro-file of single homomeric assemblies to avoid complications arising from expression of

Elisabetta Coppi16
and association with different subunits encountered in native tissues (North 2002). The typical P2X-mediated current evoked at a resting membrane potential (~ -60 mV) is an inward Na+ and Ca2+ current with single-channel conductances in the range of 18-50 pS (North 2002) and 27 pS (Poletto Chaves et al., 2006). The reversal potential is around 0 mV (typical of non-specific cation permeable channels) and, at positive potentials, an outward current prevails that is mainly due to the outflow of K+ ions. The total cur-rent-voltage (I-V) plot of the majority of P2X receptors is characterized by a marked inward-rectification, but linear I-V relationships have also been described (especially for P2X7 receptors), depending on different subunit composition and cell expression systems (Evans et al., 1996).
Another parameter commonly used to distinguish the different P2X receptor subu-nits is the rate of deactivation (the kinetics of current decay evoked by washout of the ag-onist) and desensitization (the current decay evoked by prolonged agonist application) (Stojilkovic et al., 2005). P2X1 and P2X3 are called ‘fast desensitizing P2X receptors’ be-cause they undergo rapid desensitization, on the order of hundreds of milliseconds, with an extremely slow recovery time course (≥ 5 min) (Rettinger et al., 2003). On the other hand, P2X2, P2X4 and P2X2/3 are called ‘slow desensitizing P2X receptors’ since they show relatively sustained responses to 1–2 s applications of the agonist (Roberts et al., 2006). Other heteromeric channels comprise responses with both fast and slow components, while P2X7 receptors do not show desensitization at all (Ralevic et al., 1998). The deacti-vation rate is equally fast (on the order of a few ms) for all P2X receptors, except for those undergoing pore dilation after prolonged agonist exposure (P2X2,4,7) as already described. The recombinant P2X6 subunit is poorly expressed in heterologous systems and probably does not form functional homomeric channels in vivo (Torres et al., 1999). For this rea-son it is also called a “silent subunit” (North 2002).
These properties are summarized in figure 5. Many P2X-mediated currents are influenced by extracellular pH and divalent cat-
ion concentration. For example, Zn2+, Mg2+ and Ca2+ can enhance or decrease the ago-nist-activated current of different P2X receptor assemblies, depending on their subunit composition (North 2002). These properties are summarized in table 2.
34
Figure 5. Fast (top) and slow (bottom) desensitization compared for homomeric rat P2X recep-tors transfected in HEK293 cells 48 h before whole cell recordings. Note the different time scale between upper and lower panels. Fast desensitization is observed only with P2X1 and P2X3: brief applications (2 s duration) of ATP (30 µM, except 1 mM for P2X7). Slow desensitization is ob-served for P2X2 and P2X4: more prolonged applications (60 s duration) of ATP (30 µM, except 1 mM for P2X7). Taken from: North 2002.

Purinergic receptors 17
Table 2: Properties of P2X-mediated currents.
Receptor Ca2+ Mg2+ Zn2+ Cu+ H+ Desensitization Pore dilation
P2X1No effect>100 mM — — — Decrease
pKa ≈6.3 Fast No
P2X2Decrease
5 mM — Increase20 μM
Increase16 μM
IncreasepKa ≈7.3 Slow Yes
P2X3Decrease90 mM — — — Decrease
pKa ≈6.0 Fast No
P2X4 — — Increase2 μM
No effectto 50 μM
DecreasepKa ≈7.0 Slow Yes
P2X5 Decrease — Increase — No effect Slow No
P2X6 — — — — — Slow No
P2X7Decrease
3 mMDecrease500 μM
Decrease10 μM
Decrease0.5 μM
DecreasepKa ≈6.1 Slow
Yes, irre-
versible
P2X2/3Decrease15 mM — — — Increase
pKa ≈7.3 Slow —
P2X1/5 No effect — — — Decrease Fast / slow NoP2X4/6 — — Increase — — Slow —
Values reported in each column are the concentrations that decrease by 50% (pKa in the case of hydrogen) or cause 50% of the maximal increase in response to ATP. Taken from: Roberts et al., 2006. The last two columns show the desensitization and permeation characteristics of P2X-me-diated currents, and are taken from North et al., 2000. A dash signifies that these conditions have not been studied for that receptor.
Upon activation by extracellular ATP, a channel comprised of P2X receptor sub-units opens and allows cations to move across the plasma membrane, resulting in changes in the electrical potential of the cell that, in turn, propagates a signal. This flux of ions across the plasma membrane has important signalling functions, es-pecially in impulse propagation in the nervous system and in muscle contractil-ity, where the activation of P2X receptors also generates global Ca2+ fluxes (Ca2+ permeates the channel pore) by depolarizing cells and facilitating voltage-sensitive Ca2+ influx (He et al., 2003; Koshimizu et al., 2000). In fact, P2X receptor activation causes the accumulation of Ca2+ ions in the cytoplasm, which is responsible for ac-tivating numerous signalling molecules with a slower time course (Erb et al., 2006). In non-excitable cells, Ca2+ influx through the pore represents the main mechanism by which P2X receptors modulate cellular functions, such as secretion (Stojilkovic et al., 2005). Thus, generally speaking, Ca2+ influx through the plasma membrane channels and its diffusion within the cell provides an effective mechanism by which P2X receptors control numerous cellular functions in different cellular compart-ments, and can even be used to detect the presence of such receptors on the cell sur-face (He et al., 2003).

Elisabetta Coppi18
6. Pharmacology of P2X receptors
6.1 Agonists
All P2X receptors are endogenously activated by adenine nucleotides. Homomeric P2X receptors expressed in recombinant systems differ in their sensitivity to the endog-enous agonist ATP, with EC50s in the order: P2X1 = P2X3 < P2X2< P2X4 = P2X5 < P2X6 << P2X7 (Stojilkovic et al., 2005).
Table 3: Agonist sensitivities of cloned P2X receptors.
Receptor ATP ADP αβmeATP βγmeATP 2meSATP BzATP
P2X11 30
80%1-3
100%10
40%1>>
100%>>3
60%
P2X210 ≈300
100%>100<5%
>300<10%
3>>100%>>
3060%
P2X31 ≈50
>80%1
100%>300
—0.3>>
100%>>——
P2X410 >>100
—>>100<10%
——
10–100>>30–80%>>
——
P2X510 ≈300
>80%>>100
———
10>>—>>
>500
P2X7100 >>300
—>>300
—>100
—10>>
80%>>3
300%P2X2/3 1 — 1 — —>> —P2X1/5 1 10 5 — —>> —P2X4/6 10 — 30 — —>> —
Table 3. The upper of the two values in each cell is the concentration (µM) eliciting 50% of maxi-mal response (EC50) to that agonist; the lower value is the maximal response evoked by that ag-onist as a fraction of the maximal response evoked by ATP. There are differences among EC50 reported for agonists that range up to 10-fold. Values reported are measured in the presence of 1–2 mM Ca2+ and Mg2+ and refer to rat receptors. Taken from North et al., 2000 and represent approximate averages of the published value. A dash signifies that these conditions have not been studied for that receptor.
P2X1 and P2X3 exhibit high sensitivity to αβ-meATP, which is retained in hetero-meric configurations. For this reason αβ-meATP sensitivity is usually taken as an index of P2X1 and P2X3 subunit expression in native systems (Khakh et al., 2001). In addition, if the αβ-meATP-activated current undergoes rapid desensitization, it is an indication of homomeric P2X1 or P2X3 expression, whereas if the αβ-meATP-activated current does not inactivate the channels are likely a heteromeric P2X2-3 structure.
The P2X7 subtype is sensitive to the endogenous agonist only at concentrations higher that 100 µM (North et al., 2000). However, it is potently activated by the selec-tive P2X7 agonist benzoylbenzoyl ATP (BzATP). Since P2X7 receptors only coassemble in homomeric structures, their expression in native tissues is easily identified by their sensitivity to this drug.
These properties are summarized in table 3.

Purinergic receptors 19
6.2 Antagonists
PPADS, suramin and Reactive Blue 2 (RB2) are the most commonly used non-selec-tive antagonists at P2X receptors. These substances are able to counteract the activa-tion of a number of P2X receptors, but show no selectivity within the P2X family or towards heteromeric assemblies of different subunits. In addition, the recombinant ho-momeric P2X4 is almost insensitive to these substances (Wang et al., 1996) being actu-ally potentiated by suramin, RB2, and, depending on the concentration, also by PPADS (Townsend-Nicholson et al., 1999).
Table 4: Antagonist affinities at cloned P2X receptors.
Suramin NF023 PPADS TNP-ATP
P2X1 1 μM 200 nM 1 μM 6 nM
P2X2 10 μM 100 nM 1 μM 1 μM
P2X3 3 μM 1 μM 1 μM 1 nM
P2X4 >300 μM >100 μM >300 μM 15 μM
P2X5 4 μM — 3 μM —
P2X7 500 μM — 50 μM >30 μM
P2X2/3 — 1 μM 5 μM 7 nM
P2X1/5 — — — 200 nM
Table 4. Values are expressed as concentration causing 50% inhibition (IC50) of the ionic current evoked by ATP. Concentrations of ATP vary, but a submaximal concentration has been chosen where possible. A dash signifies that these conditions have not been studied for that receptor. Taken from: North et al., 2000.
The recombinant homomeric P2X1 and P2X3 and heteromeric P2X2/3 receptors are readily distinguishable because they are blocked by the suramin analogue NF023 and by nanomolar levels of the nucleotide analogue TNP-ATP (North et al., 2000). In ad-dition, a new compound is now available commercially that selectively blocks P2X1 re-ceptors: the suramin analogue NF449. This compound has an IC50 value of 0.3 nM, for the rat P2X1 homomeric receptor, and 0.7 nM for the rat heteromeric P2X1-5 receptor (Rettinger et al., 2005), whereas it blocks rat P2X2, P2X3, P2X2-3 and P2X4 receptors only in the micromolar range.
The most useful blocker for P2X7 receptors is Brilliant Blue G (BBG), which is highly selective for this subtype at nanomolar concentrations (Jiang et al., 2000a). KN-62 and KN-04 also potently block human P2X7 channels in tens of nanomolar concen-tration range, but not rat P2X7 receptors (Chessell et al., 1998). These properties are summarized in table 4.
It should be mentioned that the pharmacological profile of P2X receptors reported in the present work is based on studies carried out on recombinant systems express-ing homomeric or heteromeric P2X cloned subunits transfected in oocytes or other cell types. In native systems, where the expression and coassembly of P2X subunits is usually largely unknown, the pharmacology of P2X receptors may present significant variations.
The molecular structure of some P2X antagonists is shown in figure 6.

Elisabetta Coppi20
Figure 6. Structural formulas for several antagonists used in the study of P2X receptors.
7. P2Y receptors
P2Y receptors belong to the superfamily of G protein-coupled receptors (GPCRs) (Bar-nard et al., 1994). Within the last 15 years, at least eight different mammalian P2Y receptors (P2Y1,2,4,6,11-14) have been cloned and functionally defined (Jacobson et al., 2002), which display 19–55% sequence identity at the protein level. The family of P2Y receptors is rapidly expanding since, among the about 150 orphan GPCRs encoded by our genome (for which the ligand specificity has not yet been identified) there are some receptors structurally related to the P2Y family, especially in the TM6 and TM7 regions (Abbracchio et al., 2006). In fact, a detailed pharmacological characterization of some of them revealed a purine/pyrimidine agonist profile, as has recently happened for GPR105 that has now been included in the P2Y family and re-named P2Y14 (Ab-bracchio et al., 2003). The youngest member of the P2Y family is the recently deorpha-nized GPR17 receptor (Ciana et al., 2006), which presents a unique pharmacological profile since it possesses a dual ligand specificity. It is sensitive not only to purinergic compounds (UDP-linked sugars such as UDP-glucose or UDP-galactose are preferred agonists), but also to ligands for the cysteinyl-leukotriene receptor family (CysLT1 and CysLT2), such as LTD4 and LTC4. This results confirms not only the already proposed cross-talk between purinergic and CysLT receptor system (Ballerini et al., 2005), but also the fact that some GPCRs may present a dual agonist profile, as previously hypoth-esized by Mellor and colleagues (Mellor et al., 2001).
P2Y receptors present the typical structure of GPCRs, with seven hydrophobic transmembrane domains, an extracellular –NH2 terminus containing several potential N-linked glycosylation sites, and an intracellular -COOH terminus containing consen-sus binding/phosphorylation sites for protein kinases (Erb et al., 2006) that modulate receptor activities (figure 7).
Individual P2Y receptor subtypes have been linked to one or more of the four sub-families of heterotrimeric G proteins (Gs, Gi/o, Gq/11, and G12/13). It is generally accepted that P2Y1,2,4,6 all couple via Gq-proteins to stimulate PLC which in turn leads to an in-crease in inositol phosphates and mobilization of Ca2+ from intracellular stores. Con-versely, P2Y12,13,14 all couple via Gi proteins resulting in the inhibition of adenylate cy-

Purinergic receptors 21
clase followed by a decrease in intracellular cAMP levels (von Kugelgen 2006). P2Y11 is unique since it can activate both pathways, with an agonist-specific signalling cas-cade. In fact, is has been clearly demonstrated that P2Y11 receptor activation by ATP can stimulate adenylyl cyclase leading to a rise in cAMP but, simultaneously, can also activate PLC to induce the formation of IP3 and the mobilization of intracellular Ca2+, while UTP can only induce intracellular Ca2+ rise by a G0-activated and PLC-independ-ent cascade (White et al., 2003). Coupling of an individual P2Y receptor subtype to multiple G proteins and signalling pathways may suggest that receptor activation leads to the induction of more than one conformational state that enables associations with different Gα subunits (Abbracchio et al., 2006). Recent studies have shown that P2Y receptors can also couple to the activation of monomeric G proteins, such as Rac and RhoA (Soulet et al., 2004). These data are summarized in table 5.
Table 5: P2Y receptor subtypes and G-protein coupling.
Receptor Preferred agonist (human) G protein Main effector systemsP2Y1 ADP Gq/11 PLC (+), Ca2+ releaseP2Y2 ATP, UTP Gq/11 PLC (+), Ca2+ release
ATP, UTP Go PLC (+), Ca2+ releaseATP, UTP G12 RhoA (+)
P2Y4 UTP Gq/11 PLC (+), Ca2+ releaseUTP Go PLC (+), Ca2+ release
P2Y6 UDP Gq/11 PLC (+), Ca2+ release
38
purine/pyrimidine agonist profile, as has recently happened for GPR105 that has now been included in the
P2Y family and re-named P2Y14 (Abbracchio et al., 2003). The youngest member of the P2Y family is the
recently deorphanized GPR17 receptor (Ciana et al., 2006), which presents a unique pharmacological
profile since it possesses a dual ligand specificity. It is sensitive not only to purinergic compounds (UDP-
linked sugars such as UDP-glucose or UDP-galactose are preferred agonists), but also to ligands for the
cysteinyl-leukotriene receptor family (CysLT1 and CysLT2), such as LTD4 and LTC4. This results
confirms not only the already proposed cross-talk between purinergic and CysLT receptor system
(Ballerini et al., 2005), but also the fact that some GPCRs may present a dual agonist profile, as
previously hypothesized by Mellor and colleagues (Mellor et al., 2001).
P2Y receptors present the typical structure of GPCRs, with seven hydrophobic transmembrane
domains, an extracellular –NH2 terminus containing several potential N-linked glycosylation sites, and an
intracellular -COOH terminus containing consensus binding/phosphorylation sites for protein kinases (Erb
et al., 2006) that modulate receptor activities (figure 7).
Figure 7. Molecular structure of P2Y receptors. Predicted secondary structure of the human P2Y12 receptor. TM: transmembrane region. EL: extracellular loop. Lines represent predicted disulfide bridges. Taken from: von Kugelgen 2006.
Individual P2Y receptor subtypes have been linked to one or more of the four subfamilies of
heterotrimeric G proteins (Gs, Gi/o, Gq/11, and G12/13). It is generally accepted that P2Y1,2,4,6 all couple via
Gq-proteins to stimulate PLC which in turn leads to an increase in inositol phosphates and mobilization of
Figure 7. Molecular structure of P2Y receptors. Predicted secondary structure of the human P2Y12 receptor. TM: transmembrane region. EL: extracellular loop. Lines represent predicted di-sulfide bridges. Taken from: von Kugelgen 2006.

Elisabetta Coppi22
Receptor Preferred agonist (human) G protein Main effector systemsP2Y11 ATP Gq/11 PLC (+), Ca2+ release
ATP Gs AC (+), increased cAMP
UTP Go
PLC-independent Ca2+ release
P2Y12 ADP Gi AC (−), ↓ cAMPADP G12/13? RhoA (+)
P2Y13 ADP Gi/o
AC (−), ↓ cAMP, PLC (+), Ca2+ release
P2Y14 UDP-glucose Gi/o PLC (+), Ca2+ release
G protein coupling and principal second messenger systems associated with P2Y receptor stim-ulation. Taken from: Erb et al., 2006.
A prolonged agonist-induced activation of GPCRs also initiates receptor desensi-tization, which diminishes GPCR responsiveness, leading to receptor internalization. Agonist-dependent GPCR desensitization is generally mediated by a family of GPCR kinases (GRK 1-7), which phosphorylate residues in intracellular domains of the re-ceptor. This process seems to not be present in all P2Y receptors, but has already been described in P2Y2 (Flores et al., 2005), P2Y12 (Hardy et al., 2005) subtypes. P2Y1 recep-tors also desensitize but with a different mechanism, probably involving protein kinase C (PKC) activation (Hardy et al., 2005).
8. Pharmacology of P2Y receptors
8.1 Agonists
A recent update in P2Y pharmacology (Abbracchio et al., 2006) distinguished four ma-jor groups of P2Y receptors, on the basis of the endogenous agonist preferred:1. Adenine nucleotide-preferring receptors mainly responding to ATP and (mostly)
ADP. This group includes human and rodent P2Y1, P2Y12, P2Y13, with the human receptors preferring ADP over ATP (Gachet 2005; Marteau et al., 2003; Palmer et al., 1998).
2. Uracilic nucleotide-preferring receptors. This group includes human P2Y4 and P2Y6 responding to either UTP or UDP.
3. Receptors of mixed selectivity, responding to both purine and pyrimidine nucle-otides: human and rodent P2Y2 and P2Y11, plus rodent P2Y4 (whereas human P2Y4 receptor is blocked by ATP: Kennedy et al., 2000).
4. Receptors responding solely to sugar nucleotides UDP-glucose and UDP-galac-tose: P2Y14 and the recently deorphanized GPR17 (Ciana et al., 2006).
Synthetic agonists able to discriminate between all the different P2Y recep-tor subtypes are still lacking. However, considerable progress has been made in re-cent years with the adenine nucleotide-preferring receptors P2Y1, P2Y12 and P2Y13, for which ADPβS has been the first preferred agonist synthesized (P2Y1: EC50=96 nM and P2Y12: EC50=82 nM: Jacobson et al., 2002; P2Y13: EC50=42 nM: Communi et al., 2001).

Purinergic receptors 23
Alkylthio-substituted molecules in position 2 of the adenine ring, such as 2-MeSADP, are even more selective agonists at P2Y1, P2Y12 and P2Y13 receptors, with EC50 values in the range of 1-6 nM (Jacobson et al., 2002; Marteau et al., 2003). The corresponding triphosphated molecule, 2-MeSATP, is less potent and selective towards P2Y1 recep-tors since it also activates some P2X receptors (King, 1998). The most potent agonists known for the human P2Y1 receptor is the newly synthesized MRS 2365, an ADP-de-rivative with modifications of both the ribose moiety and the adenine ring. with an EC50 of 0.4 nM (Chhatriwala et al., 2004). In addition, this is the unique P2Y1 agonist that is inactive at human P2Y12 and P2Y13 receptors (Chhatriwala et al., 2004). Thio-phosphate-containing adenine nucleotides, such as ???? and ATPγS, present a high sta-bility toward 5-NT’ and ecto-ATPase degradation and are more potent than ATP in ac-tivating the P2Y11 receptor.
Among uracil derivatives (see figure 8), UTP and ATP are equipotent agonists at P2Y2 and P2Y4 receptors, with the exception of the human P2Y4 that is blocked, in-stead of activated, by extracellular ATP (Herold et al., 2004). Uridine β-thiodiphos-phate (UDPβS) and γ-thiodiphosphate (UDPγS) are selective agonists at P2Y6 and P2Y2/P2Y4 receptors, respectively (Malmsjo et al., 2000).
41
1: ADP; 2: ADP S 3: ATP; 4: ATP S 6: 2-MeSADP. 7: 2-MeSATP MRS2365
n=1: UDP; n=2: UTP n=1: UDP S; n=2: UTP S UDP-glucose and UDP-galactose
Figure. 8. Structures of adenine-derived and uracil-derived nucleotide agonists of P2Y receptors.
Antagonists.
The classical P2 antagonists are suramin, PPADS and RB2. However, these molecules block not
only several P2Y receptors, but also many P2X subtypes (as already mentioned) and even some unrelated
proteins, such as 5’-NT (Chen et al., 1996), NMDA receptors (Peoples et al., 1998) and ion channels
(Galietta et al., 1997). Nevertheless, these compounds have been commonly used to study P2Y-mediated
actions. Suramin and its derivatives are relatively non-selective and non-competitive antagonists at P2Y
receptors, with a well characterized activity at the P2Y2 (IC50=48 µM: Muller 2002) P2Y11 (Communi et
al., 1999) and P2Y13 receptors (Marteau et al., 2003) in the micromolar range. RB2 effectively blocks
P2Y1 receptors (Jacobson et al., 2002) and rat, but not human, P2Y4 receptors at high concentrations (100
µM: Kennedy et al., 2000), but high potency and selectivity have not been achieved (Brown et al., 2002a;
Jacobson et al., 2002). PPADS, and its derivatives, competitively antagonizes P2Y1 receptors and non-
competitively block P2Y13 receptors (Marteau et al., 2003) at micromolar concentrations (Lambrecht et
al., 2002), but its action is not fully reversible (Ralevic et al., 1998).
Only recently, a new generation of high affinity and selective P2Y competitive antagonists has been
introduced. These compounds are able to selectively discriminate among different receptor subtypes. The
first notable molecule synthesized was MRS 2179, with an IC50 value of 300 nM at P2Y1 receptors
(Nandanan et al., 1999). Its 2-Chloro analogue, MRS 2216, is an even more potent agonist at this receptor,
with an IC50 of 100 nM (Brown et al., 2000). Subsequent molecular modifications lead to the newly
synthesized P2Y1 antagonists MRS 2279 and MRS 2500, that have particularly high affinity (IC50 under
the nanomolar range: Ohno et al., 2004) and selectivity (inactive at P2Y2,4,6,11,12,13 and P2X2,3,4,7: Boyer et
Figure. 8. Structures of adenine-derived and uracil-derived nucleotide agonists of P2Y receptors.
8.2 Antagonists
The classical P2 antagonists are suramin, PPADS and RB2. However, these molecules block not only several P2Y receptors, but also many P2X subtypes (as already men-tioned) and even some unrelated proteins, such as 5’-NT (Chen et al., 1996), NMDA receptors (Peoples et al., 1998) and ion channels (Galietta et al., 1997). Nevertheless, these compounds have been commonly used to study P2Y-mediated actions. Suramin and its derivatives are relatively non-selective and non-competitive antagonists at P2Y receptors, with a well characterized activity at the P2Y2 (IC50=48 µM: Muller 2002) P2Y11 (Communi et al., 1999) and P2Y13 receptors (Marteau et al., 2003) in the micro-molar range. RB2 effectively blocks P2Y1 receptors (Jacobson et al., 2002) and rat, but not human, P2Y4 receptors at high concentrations (100 µM: Kennedy et al., 2000), but high potency and selectivity have not been achieved (Brown et al., 2002a; Jacobson et

Elisabetta Coppi24
al., 2002). PPADS, and its derivatives, competitively antagonizes P2Y1 receptors and non-competitively block P2Y13 receptors (Marteau et al., 2003) at micromolar concen-trations (Lambrecht et al., 2002), but its action is not fully reversible (Ralevic et al., 1998).
Only recently, a new generation of high affinity and selective P2Y competitive an-tagonists has been introduced. These compounds are able to selectively discriminate among different receptor subtypes. The first notable molecule synthesized was MRS 2179, with an IC50 value of 300 nM at P2Y1 receptors (Nandanan et al., 1999). Its 2-Chloro analogue, MRS 2216, is an even more potent agonist at this receptor, with an IC50 of 100 nM (Brown et al., 2000). Subsequent molecular modifications lead to the newly synthesized P2Y1 antagonists MRS 2279 and MRS 2500, that have particularly high affinity (IC50 under the nanomolar range: Ohno et al., 2004) and selectivity (inac-tive at P2Y2,4,6,11,12,13 and P2X2,3,4,7: Boyer et al., 2002; Marteau et al., 2003) towards this receptor subtype. Only weak antagonism by MRS 2279 on rat P2X1 receptor has been reported (Brown et al., 2000). [33P]MRS 2179, [33P]MRS 2279 and [33P]MRS 2500 were prepared and shown to be very useful tools as radioligand probes to detect and quantify P2Y1 expression in native systems and tissues (Baurand et al., 2001; Waldo et al., 2002). An interesting compound is AR-C69931MX (cangrelor), another ATP-derivative, that, on the contrary, does not bind to the P2Y1 receptor subtype but is able to selectively block P2Y12 and P2Y13 receptors (Marteau et al., 2003).
Among uridine-preferring P2Y subtypes, a new family of selective P2Y6 antago-nists, the aryl diisothiocyanate derivatives, have been recently developed. These com-pounds, among which MRS 2578 has the highest affinity values for rat and human re-ceptors (IC50 in the nanomolar range), are promising compounds for the identification of P2Y6-mediated responses. Limitations in using these compounds include pharma-cological irreversibility, low stability and solubility in aqueous medium.
The molecular structure of some P2Y antagonists is shown in figure 9, whereas a summary of P2Y receptor pharmacology is reported in table 6.
Table 6 summarizes recent data about P2Y receptor distribution and pharmaco-logical profile.
42
al., 2002; Marteau et al., 2003) towards this receptor subtype. Only weak antagonism by MRS 2279 on rat
P2X1 receptor has been reported (Brown et al., 2000). [33P]MRS 2179, [33P]MRS 2279 and [33P]MRS
2500 were prepared and shown to be very useful tools as radioligand probes to detect and quantify P2Y1
expression in native systems and tissues (Baurand et al., 2001; Waldo et al., 2002). An interesting
compound is AR-C69931MX (cangrelor), another ATP-derivative, that, on the contrary, does not bind to
the P2Y1 receptor subtype but is able to selectively block P2Y12 and P2Y13 receptors (Marteau et al.,
2003).
Among uridine-preferring P2Y subtypes, a new family of selective P2Y6 antagonists, the aryl
diisothiocyanate derivatives, have been recently developed. These compounds, among which MRS 2578
has the highest affinity values for rat and human receptors (IC50 in the nanomolar range), are promising
compounds for the identification of P2Y6-mediated responses. Limitations in using these compounds
include pharmacological irreversibility, low stability and solubility in aqueous medium.
The molecular structure of some P2Y antagonists is shown in figure 9, whereas a summary of P2Y
receptor pharmacology is reported in table 6.
Table 6 summarizes recent data about P2Y receptor distribution and pharmacological profile.
18: MRS 2179; 19: MRS 2216 21: MRS 2279; 22: MRS 2500
Figure 9. Structures of nucleotide-based antagonists of P2Y receptors. Figure 9. Structures of nucleotide-based antagonists of P2Y receptors.
9. Distribution of P2 receptors
P2 receptors are widely distributed in a large variety of tissues with varying profiles for different subtypes, as summarized in table 6. In the lung, P2X4 (Bo et al., 2003) and uri-dine-preferring P2Y2,4,6 receptors (Bergner et al., 2002; Kishore et al., 2000) are most

Purinergic receptors 25
Tabl
e 6.
Sum
mar
y ab
out P
2Y-r
ecep
tors
pha
rmac
olog
ical
pro
file
and
dist
ribut
ion.
P2Y 1
P2Y 2
P2Y 4
P2Y 6
P2Y 11
P2Y 12
P2Y 13
Tissue disrtibution
Wid
e in
clud
ing
plat
elet
s, he
art,
skel
etal
mus
cle,
neur
onal
tiss
ues,
dige
stiv
e tr
act
Wid
e in
clud
ing
lung
, hea
rt, s
kele
tal
mus
cle,
sple
en,
kidn
ey
Plac
enta
, lun
g,
vasc
ular
smoo
th
mus
cle,
brai
n, li
ver
Wid
e in
clud
ing
lung
, hea
rt, a
orta
, sp
leen
, pla
cent
a,
thym
us, i
ntes
tine,
brai
n
Sple
en, i
ntes
tine,
imm
unoc
ytes
Plat
elet
s, ne
ural
tis
sues
Sple
en,
leuc
ocyt
es, b
one
mar
row,
live
r, br
ain
Plac
enta
, adi
pose
tis
sue,
inte
stin
e, br
ain,
sple
en
Preferred agonists at
human receptorc
(N)-
mc-
2-M
eSA
DP
>2M
eSA
DP
>AD
P=A
DPβ
S>A
TP
UTP
=ATP
>IN
S372
17>A
p4A
>ATP
γS
UTP
>U
TPγS
UD
P=5B
r-U
DP
>>U
TP>2
-MeS
AD
P
ARC
6708
5≥AT
PγS
=BzA
TP>A
TP,(U
TP)a >2
MeS
ATP
2-M
eSA
DP
>AD
P>>
(N)-
mc-
2-M
eSA
DP
2-M
eSA
DP
≥AD
P>A
DPβ
S
UD
P-gl
u>U
DP-
gal
Preferred agonists
at rat receptorc
2-M
eSA
DP
=2-M
eSAT
P>A
DP
UTP
=ATP
>CTP
>GTP
UTP
=ATP
=ITP
=Ap4
AU
DP>
UTP
>AD
P>2
-MeS
ATP
2-M
eSA
DP
>AD
P>A
TP
AD
P>2
-MeS
AD
P>A
TP
UD
P-gl
u
Suramin
5.5a
4.3b
−(30
0 μM
)↓2
7%
(100
μM
)6.
15.
5↓8
0%
(10
μM)
PPADS
4.9–
5.4a
−(30
μM
)↓3
0%
(100
μM
)↓6
9%(1
00 μ
M)
−(10
0 μM
)−(
100
μM)
↓50%
(1
0 μM
)
RB2
6.1a
↓80%
(100
μM
)↓3
3%
(100
μM
)6.
0a↓8
0%
(100
μM
)↓1
00%
(30
μM)
↓80%
(1
0 μM
)
MRS2179
6.8a
−(30
μM
)−(
30 μ
M)
−(30
μM
)−(
10 μ
M)
−(10
0 μM
)
MRS2279
8.1
−(30
μM
)−(
30 μ
M)
−(30
μM
)−(
30 μ
M)
MRS2500
8.8
−(10
0 μM
)
MRS2567
−(10
μM
)−(
10 μ
M)
−(10
μM
)↓9
5% (1
0 μM
)−(
10 μ
M)
Cangrelor (AR-
C69931MX)
8.7
↓80%
(0.0
1 μM
)
MRS 2211
<5−(
10 μ
M)
6.3
a App
aren
t pK
B val
ue. b S
lope
diff
eren
t fro
m u
nity
. Tak
en fr
om: v
on K
ugel
gen
2006
.

Elisabetta Coppi26
highly expressed, whereas in the ciliated airway epithelium P2X4,5,7 and P2Y1,2,6 prevail (Picher et al., 2003; Zhang et al., 2003). Smooth muscles of digestive tract and urinary system are particularly rich in P2 receptors and the first evidence for the “purinergic signalling” hypothesis came from studies on these tissues (Burnstock et al., 1963). The stomach smooth muscle is rich in P2X7 and P2Y1,2 receptors (Bo et al., 2003; Curro et al., 1998; Jenkinson et al., 2000; Otsuguro et al., 1996) and in the small intestine and colon also P2X5 and P2Y6 are also found (Bo et al., 2003; Ota et al., 1994). In the kid-ney glomerular cells almost all P2 receptor subtypes are present (Bo et al., 2003), ex-cept P2X1,2 that are found in the distal convoluted tubules (Bo et al., 2003). In the uri-nary bladder all P2X except for P2X7 subunits are expressed (Bo et al., 2003), whereas only P2Y1 transcript is present among metabotropic nucleotide receptors (Obara et al., 1998). The vas deferens, where ATP-mediated contractile activity has been largely char-acterized, is also rich in P2X1,2,4,7 receptors (Lee et al., 2000), but the presence of P2Y transcripts has not yet been described in this region. Immune cells present a particu-larly intense staining for purinergic nucleotide receptors, in accordance with the im-portant role of ATP in mediating immune cell functions (Di Virgilio et al., 1996). P2X7 (Falzoni et al., 1995; Li et al., 2002) are typically expressed on monocytes and macro-phages, together with P2Y1,2,4,11,12 subtypes (Bowler et al., 2003; Di Virgilio et al., 1996). Neutrophils (Jin et al., 1998), eosinophils (Mohanty et al., 2001), lymphocytes (Wang et al., 2004) and dendritic cells (Xiang et al., 2006b) also present P2X1,4,5 subunits. Meg-akaryocytic cells and platelets are known for their P2Y12-mediated aggregation, but they also express P2X1 and P2Y1 receptors (Greco et al., 2001; Hechler et al., 2001; Leon et al., 1997). In the heart, all P2X except P2X7 subunits are expressed (Bogdanov et al., 1998; Hansen et al., 1999a), whereas, among P2Y subtypes, only P2Y1,2,4,6 are found in myocytes (Webb et al., 1996). In the vasculature, P2 receptors present a wide distri-bution with distinct subtypes revealed in different regions (Bo et al., 2003; Hansen et al., 1999b). For example, endothelial cells mainly express P2X4,5 and P2Y1,2,11 receptors (Wang et al., 2002) whereas vascular smooth muscle cells express P2X1,2,4 (Nori et al., 1998) and P2Y2,6 subtypes (Wang et al., 2002).
Particularly relevant to the present work is the neuronal localization of P2 recep-tors that will be adescribed independently for P2X and P2Y subtypes in the next two sessions.
9.1 Neuronal localization of P2X receptors
The distribution of P2X receptors in the CNS ranges from abundant to discrete. Thus, P2X2, P2X4, and P2X6 mRNAs or proteins have been detected throughout the brain and spinal cord, as well as in sensory and autonomic ganglia (Norenberg et al., 2000a). P2X1 receptors were initially believed to be absent in the brain (Valera et al., 1994). However, later on, it turned out that P2X1 mRNA is localised in the cerebral cortex, striatum, hip-pocampus and cerebellum, where P2X1 subunit proteins have also been detected (Kidd et al., 1995). Outside the brain, P2X1 was found in the dorsal and ventral horns of the spinal cord, sensory ganglia (trigeminal, nodose and dorsal root ganglia), sensory sys-tems (spiral ganglion in the cochlea of the inner ear) and autonomic sympathetic gan-glia (superior cervical and coeliac ganglia: Collo et al., 1996; Xiang et al., 1998).
The P2X3 receptor is believed to mostly occur in capsaicin-sensitive sensory neu-rones involved in nociception (Chen et al., 1995; Lewis et al., 1995; Vulchanova et al., 1996). In fact, P2X3 protein or its mRNA was found in cell bodies of sensory neurones, and in their central termination fields (dorsal horn of the spinal cord, nucleus of the

Purinergic receptors 27
solitary tract), as well as in their peripheral endings, e.g. in taste buds of the tongue and the spiral ganglion of the inner ear (Vulchanova et al., 1997). However, exceptions exist: in the adult rat nervous system, P2X3 was also found in the hypothalamic supraoptic nucleus, as well as in autonomic sympathetic ganglia (Shibuya et al., 1999).
P2X5 also shows a restricted localisation in the CNS. P2X5 mRNA was found only in the mesencephalic nucleus of the trigeminal nerve and in motoneurones of the spinal cord ventral horn (Collo et al., 1996). In the peripheral nervous system, P2X5 mRNA, P2X5 protein, or both were identified in sensory ganglia and the spiral ganglion of the inner ear (Xiang et al., 1999), whereas sympathetic ganglia such as superior cervical and coeliac ganglia did not express P2X5 proteins (Xiang et al., 1998).
It is generally believed that the P2X7 receptor is not expressed in neuronal cells al-though it was originally cloned from superior cervical ganglia and brain tissue (Buell et al., 1996). In accordance, recent data indicate that this receptor subtype is mainly expressed by glial cells (astrocytes, oligodendrocytes and microglia) where it regulates their activation during neuroinflamatory responses (Gendron et al., 2003). More re-cently, detailed analysis has shown that P2X7 receptors are also expressed by some pe-culiar neuronal cell types, such as rat spiral ganglion neurons of the inner ear and rat retinal ganglion cells (Brandle et al., 1998 and 1999). Immunohistochemistry and elec-tron microscopy techniques revealed a preferential localization of neuronal P2X7 re-ceptor protein targeted to presynaptic terminals in the CNS, throughout the spinal cord and medulla oblongata (Deuchars et al., 2001), suggesting a role for P2X7 receptors in modulating neurotransmitter release.
9.2 Neuronal localization of P2Y receptors
Most of the known subtypes of P2Y receptors are expressed in the central nervous sys-tem. Quantitative RT-PCR revealed that P2Y1 and P2Y11 mRNA is present in the hu-man brain in large quantities when compared with other tissues whereas, in the same study, only low to moderate levels of P2Y2, P2Y4, and P2Y6 were detectable (Moore et al., 2001). In immunohistochemical staining of human brain slices, a striking neuro-nal localization of P2Y1 receptors was confirmed in human and rat brain in areas such as the cerebral and cerebellar cortex, hippocampus, basal ganglia (striatum) and mid-brain (Moore et al., 2000). In contrast, in situ hybridizations of human (Hollopeter et al., 2001) and rat (Sasaki et al., 2003) brain sections revealed mainly a glial localization of the P2Y12 receptor. Also P2Y13 mRNA was detected in various regions of the hu-man brain, such as cerebellum, hippocampus, substantia nigra, and thalamus (Com-muni et al., 2001). In the peripheral nervous system, mRNA for all P2Y receptor sub-types except P2Y11 and P2Y14 has been found in sympathetic neurons (Lechner et al., 2004; Norenberg et al., 2000b). Sensory neurons, in contrast, were shown to express only P2Y1,2,4,6 (Ruan et al., 2003). In the intramural parasympathetic ganglia of the cat urinary bladder, the presence of P2Y1,2,4,6, and P2Y12 was revealed by immunohisto-chemistry (Ruan et al., 2006). In the enteric nervous system of guinea pigs, evidence for the expression of P2Y1 (Hu et al., 2003), P2Y2, P2Y6, and P2Y12 receptors (Xiang et al., 2005 and 2006a) has been obtained. However, there is no evidence for a neuronal localization of P2Y14 subtype, and the respective mRNA was only found in rat corti-cal astrocytes (Fumagalli et al., 2003), where UDP-glucose also elicited a rise in intra-cellular Ca2+. As already described for A2A and D2, also P2Y1 receptors can assemble to form heterodimers with other metabotropic receptors. In particular, convincing evi-dences demonstrate an association between A1 and P2Y1 isoform both in co-transfect-

Elisabetta Coppi28
ed HEK293T cells (Yoshioka et al., 2001; Yoshioka et al., 2002b) and in native rat brain slices (cerebellum, hippocampus and cortex: (Yoshioka et al., 2002a). The dimerized A1/P2Y1 receptor presents hybrid pharmacological features across P1 and P2 subtypes: it can be activated by both adenosine and ADP-related agonists (Yoshioka et al., 2001) and it is blocked by DPCPX and MRS 2179 (Yoshioka et al., 2002b). Such heteromeric association reinforces the already close correlation between adenosine and ATP-ergic systems, but a precise implication of this phenomenon in neuronal functions is still un-known (for a review see: Nakata et al., 2004 and 2005).

Elisabetta Coppi, Purines as Transmitter Molecules: Electrophysiological Studies on Purinergic Signalling in Differ-ent Cell Systems, ISBN 978-88-8453-904-5 (print), ISBN 978-88-8453-905-2 (online) © 2008 Firenze University Press
Effectsofextracellularpurines
In virtually all peripheral tissues, extracellularly released nucleotides or nucleosides play important roles in a large number of physiological processes. In addition, the rap-id breakdown of extracellular ATP to adenosine is responsible for a close interplay be-tween ATP-ergic and adenosinergic systems whose clear dissection presents numerous experimental problems (Hussl et al., 2006).
In general, the time course of P1 adenosine and P2Y adenine mediated responses is usually slower than those mediated by P2X receptor activation since they involve sec-ond messenger systems and/or ionic conductance modulation by G protein coupling (Ralevic and Burnstock 1998). Therefore, ATP likely acts as a fast neurotransmitter where P2X receptors are expressed; this action can be followed by slower effects medi-ated by P2Y and, after conversion to adenosine, by P1 receptors.
1. Role of P1 receptors
P1 receptors exert important pathophysiological roles in a variety of tissue, from the cardiovascular system to the brain. At systemic level, adenosine acts as a negative chronotropic, inotropic and dromotropic modulator on heart functions by activating A1 receptors. These effects are mainly due to the attenuation of the stimulatory actions of catecholamines on the heart functions carried on by A1 adenosine receptor activa-tion (Fraser et al., 2003; Zablocki et al., 2004). The marked inhibitory effects of adeno-sine on the heart led to the introduction of A1 agonists in Phase II clinical trials to slow heart rate during atrial fibrillation (see Selodeson, Aderis Pharmaceuitcals: Ellenbogen et al., 2005) and in Phase III for paroxysmal supraventricular tachycardia (PSVT) with successful results (see Adenocard, Astellas Pharma: Vranic et al., 2006).
In contrast, the hypotensive effects exerted by adenosine in the periphery are at-tributed to A2A receptor activation, causing vasodilatation of blood vessels (Schindler et al., 2005) and led, in the ‘60s-‘70s, A2A agonists to be tested in clinical trials as anti-hypertensive drugs. In addition, A2A receptor stimulation also inhibits platelet aggrega-tion (Varani et al., 2000) and exhibits marked anti-inflammatory activities by inhibiting T-cell activation and proliferation, by reducing pro-inflammatory cytokine production and enhancing anti-inflammatory cytokine levels (Erdmann et al., 2005; Lappas et al., 2005).
Less is known about the roles of A2B and A3 receptors in the periphery. One of the first described biological effects of adenosine A3 receptor stimulation was degranu-lation of mast cells (Ramkumar et al., 1993), suggesteing a pro-inflammatory role of this receptor subtype. This hypothesis has been confirmed by subsequent studies dem-

Elisabetta Coppi30
onstrating that A3 receptor activation facilitates antigen-dependent histamine release from mast cells (Salvatore et al., 2000). In addition, it has a demonstrated irritant effect in asthmatic lung mediated by A3 receptor stimulation (Holgate 2005), probably part-nered, in eliciting this effect, by A2B receptor stimulation, that also mediates bronchoc-onstriction (Holgate 2005). For this reason, mixed A2B and A3 antagonists have been proposed as candidates for the treatment of asthma (Press et al., 2005).
1.1 P1 receptors and neurotransmission.
The role of adenosine as a neuromodulator has long been known. In fact, many P1-mediated modulatory actions on presynaptic neurotransmitter release or postsynaptic neuronal excitability have been described. Most of the actions played by adenosine un-der physiological conditions are mediated by A1 and A2A receptors. At the central level, adenosine exerts a number of actions: it acts as an endogenous anticonvulsant but also affects the control of motility, pain, sleep, cognition and memory. Actually, the overall stimulating effects of caffeine (the most consumed drug in the world) on arousal, con-centration and motility are mainly due to its antagonism on adenosine receptors. Fur-thermore, adenosine has an important tonic modulation of the affective state (Florio et al., 1998a, 1998b) thus influencing social interaction and aggressive behaviour.
Under physiological conditions, adenosine exerts a tonic inhibition of synaptic transmission both in vitro or in vivo by stimulating A1 receptors, as demonstrated in several brain regions such as the hippocampus, striatum and olfactory cortex (Latini et al., 2001; von Lubitz 1999). These mechanisms were studied in brain regions with a high concentration of A1 receptors, such as the hippocampus. The inhibitory effect of adenosine A1 receptor stimulation has a pre- and postsynaptic component. Activation of the presynaptic A1 receptors reduces Ca2+ influx through the preferential inhibition of N-type and, probably, Q-type channels (Wu et al., 1994; Yawo et al., 1993). Inhibi-tion of presynaptic calcium currents decreases transmitter release (Prince et al., 1992) and adenosine, by stimulation of A1 receptors, has been found to inhibit the release of virtually all classical neurotransmitters: glutamate, acetylcholine, dopamine, noradren-aline and serotonin (see in Fredholm et al., 1988). In particular, a powerful suppression of glutamate release from presynaptic terminals has been described in the hippocam-pus (Burke et al., 1988, Corradetti et al., 1984), where adenosine A1 receptor activa-tion reduces the number of quanta released (but not the size of individual quanta nor the postsynaptic glutamate receptor sensitivity) in the Schaffer collateral-commissural pathway (Lupica et al., 1992). The postsynaptic effect of A1 receptors consists of a direct hyperpolarization of neurones via activation of GIRK channels (Kir 3.2 and 3.4 chan-nels: potassium inward rectifiers) at the postsynaptic site (Takigawa et al., 1999; Taki-gawa et al., 2002). In some brain regions, such as the hippocampus, the endogenous adenosine that is present in the extracellular space under physiological conditions ex-erts a tonic inhibition of excitatory neurotransmission by the activation of both pre- and post-synaptic A1 receptors. Exogenous application of the selective A1 antagonist DPCPX causes a 15% increase of synaptic potential amplitude in in vitro brain slices (Latini et al., 1999b). This is an expected result in a brain region where extracellular ad-enosine concentration is found to be around 10-50 nM (Latini et al., 1998 and 1999b) and A1 receptors, whose affinity for adenosine is in the low nanomolar range, are highly expressed. These data are confirmed by the fact that, in slices taken from homozygous A1 receptor knockout mice, no evidence was found for an endogenous inhibitory ac-tion of adenosine in the Schaffer collateral pathway in the CA1 region of the hippocam-

Effects of extracellular purines 31
pus or at the mossy fibre synapses in the CA3 region (Moore et al., 2003). In addition, no inhibition of synaptic transmission was elicited by the application of exogenous ad-enosine (Johansson et al., 2001).
Opposite effects from A1-mediated synaptic inhibition are elicited by A2A recep-tor activation, that has been shown to mediate excitatory actions in the nervous system (Latini et al., 1996; Pedata et al., 1984; Sebastiao et al., 1996; Spignoli et al., 1984). Elec-trophysiological investigations into the role of A2A receptors in synaptic function under physiological conditions have shown that they increase synaptic neurotransmission. For example, in the hippocampus in vitro, A2A receptor stimulation results in a Ca2+-dependent release of acetylcholine (Cunha et al., 1995; Spignoli et al., 1984). Further-more, the application of CGS 21680, a selective A2A receptor agonist, decreases the abil-ity of A1 receptor agonists to inhibit excitatory neurotransmission (Cunha et al., 1994; O’Kane et al., 1998). This effect supports the already proposed hypothesis that A2A re-ceptor stimulation increases synaptic transmission through A1 receptor desensitization (Dixon et al., 1997; Stone et al., 2004). Alternatively, another current theory is that A2A receptors increase excitatory amino acid release. In fact, the selective stimulation of ad-enosine A2A receptors augment the amount of glutamate released in hippocampus and striatum of young rats (Corsi et al., 1999 and 2000; Popoli et al., 1995). In spite of the excitatory role in neurotransmission brought about by A2A receptors, the net effect of adenosine is an inhibitory tonus on neurotransmission, in accordance with observa-tions suggesting that activation of A2A receptors requires a protracted stimulation to in-duce evident effects on synaptic transmission (Latini et al., 1999a). It is worth noticing that the role of A2A receptors in the striatum is recently gaining interest in light of their heterodimerization with D2 dopamine receptors. The association between A2A and D2 receptors results in an antagonistic interaction which provided a rationale for evaluat-ing A2A-selective antagonists in Parkinson’s disease, supported by epidemiological evi-dence indicating an inverse relationship between caffeine consumption and risk of de-veloping this pathology (Ascherio et al., 2001; Ross et al., 2000). It was suggested that A2A antagonists not only provide symptomatic relief but also decelerate dopaminergic neurone degeneration in patients (Xu et al., 2005). Two different A2A antagonists, istra-defylleine (KW-6002) and a derivative of the anti-malarian mefloquine (V2006), are respectively in Phase III and Phase II clinical trials for Parkinson’s disease at present, with promising results (Hauser et al., 2003; Weiss et al., 2003).
Discrepancies about the role of adenosine A3 receptors in the CNS are present in the literature, as indicated by the fact that the activation of this receptor subtype has been associated with both excitatory and inhibitory effects, even in the same brain re-gion. An excitatory role of A3 receptors has been supported by evidence indicating that, in the rat hippocampus, their activation attenuates LTD and allows induction of LTP elicited by a subliminal weak-burst protocol (Costenla et al., 2001). In addition, in the same brain area, A3 receptor activation through a selective adenosine A3 agonist has been shown to antagonizes the adenosine A1 receptor-mediated inhibition of excita-tory neurotransmission (Dunwiddie et al., 1997a). However, further electrophysiologi-cal studies refused this hypothesis, since several authors demonstrated that no signifi-cant interaction between A1 and A3 receptors occur in the rat cortex and hippocampus (Brand et al., 2001; Lopes et al., 2003). Additional evidence for an excitatory role of adenosine A3 receptors came from studies carried out in “in vitro” hippocampal slices. For example, A3 receptor stimulation always attenuated the inhibition of hippocampal slice neurotransmission caused by presynaptic metabotropic glutamate receptors in a PKC-dependent manner (Macek et al., 1998). In addition, whole-cell patch clamp re-
Elisabetta Coppi32
cordings in CA3 hippocampal pyramidal neurones demonstrated that A3 receptor acti-vation results in a significant potentiation of high threshold hippocampal Ca2+ currents by a PKA-dependent mechanism (Fleming et al., 1997). Finally, a facilitation of epilep-tiform discharge onset has been observed in the presence of the selective A3 receptor agonist Cl-IB-MECA (Laudadio et al., 2004) and a reduction of such epileptic activity was observed when A3 receptors, activated by endogenously released adenosine during seizures, were blocked by the selective antagonist MRS 1191 (Etherington et al., 2004).
Contrary to previous results, an inhibitory action has been attributed to A3 recep-tors by Brand and colleagues (Brand et al., 2001), who demonstrated that, in rat corti-cal neurones, the selective activation of this adenosine receptor subtype is involved in inhibition of excitatory neurotransmission, suggesting a synergistic action with the in-hibitory effect of adenosine brought about by A1 receptor activation. Despite results ob-tained by A3 receptor stimulation, evidence that selective block of A3 receptors does not affect neurotransmission in the CA1 region of the hippocampus under normoxic con-ditions, indicates that endogenous adenosine at physiological concentrationa does not exert tonic activation of A3 receptors (Dunwiddie et al., 1997a; Pugliese et al., 2003). This is in line with evidence that A3 receptor activation requires micromolar levels of extracellular adenosine, which can be reached only during pathological conditions of impairment in energy supply (for example during hypoxia or ischemia: Latini et al., 1998; Pearson et al., 2006). For this reason, particular interest has been dedicated to in-vestigate A3-mediated effects during brain damage, when the activation of this receptor subtype becomes relevant. Since a section of the present research has been dedicated to study the role of A3 receptors during ischemic insults in the brain, it is useful to focus on the role of adenosine during such cerebral insults.
1.1 P1 receptors and cerebral ischemia
Ischemic stroke is the third leading cause of death in industrialised countries, with a mortality rate of around 30%, and it is the major cause of long-lasting disabilities. It is caused by a transient or permanent reduction in cerebral blood flow due to the occlu-sion of a major brain artery, either by an embolus or by local thrombosis. An effective therapy for this pathology does not exists yet. Several neuroprotective drugs have been developed and successfully tested in animal stroke models, but most of them failed to be efficacious in clinical trials (De Keyser et al., 1999). A typical example concerning clinical failure of experimental models is provided by the class of NMDA receptor an-tagonists, that, in spite of promising results in animal models (Calabresi et al., 2000; Lee et al., 1999) failed to provide neuroprotection in clinical studies on patients (Cap-lan 1998; Plum 2001).
As reported above, the extracellular adenosine concentration under physiological conditions, calculated by different experimental approaches, is usually relatively con-stant in a range between 30-200 nM in brain tissue (see: Latini et al., 2001). Both in vivo and in vitro studies largely demonstrate that this concentration dramatically increases during cerebral ischemia (Hagberg et al., 1987; Latini et al., 1999b; Melani et al., 1999 and 2003; Pearson et al., 2006), reaching values around 3 µM, able to activate all 4 sub-types of adenosine receptors. This is principally due to the rapid and massive depletion of intracellular ATP occurring under metabolic stress conditions, such as hypoxia or ischemia, that lead to an accumulation of AMP, which in turn is degraded to adeno-sine. The rate of adenosine production thus exceeds its deamination to inosine or its rephosphorylation to AMP (Deussen 2000) leading to a concentration gradient from

Effects of extracellular purines 33
the intra- to the extracellular space that causes adenosine to be released by the mem-brane transporter proteins (ENTs). Furthermore, adenine nucleotides are released into the extracellular compartment and rapidly metabolized to adenosine by NTPDases and e5’-NTs ubiquitously expressed on the cell surface (see figure 3). Therefore, extracellu-lar adenosine concentrations greatly increase reaching micromolar values during hy-poxic/ischemic conditions. In vitro studies demonstrated that during ischemia adeno-sine reaches values as high as 30 µM (Latini et al., 1999b).
A neuroprotective role of extracellular adenosine during cerebral ischemia has long been recognised by different authors. In fact it is largely known that adenosine-poten-tiating agents, which elevate endogenous adenosine by either inhibiting its metabolism (Lin et al., 1992) or preventing its reuptake (Dux et al., 1990), offer protection against ischemic neuronal damage in different in vivo ischemia models. Furthermore, adeno-sine infusion into the ischemic striatum during medial cerebral artery (MCA) occlu-sion significantly ameliorates the neurological outcome and reduces the infarct volume after transient focal ischemia (Kitagawa et al., 2002). For all these reasons, many au-thors have indicated adenosine and its receptors as possible targets for therapeutic im-plementation in the treatment of stroke. All these protective effects of adenosine dur-ing cerebral ischemia are mainly due to adenosine A1 receptor stimulation, that causes a reduction of Ca2+ influx, thus inhibiting the presynaptic release of excitatory neuro-transmitters (Corradetti et al., 1984; Pedata et al., 1993; Zetterstrom et al., 1990) and in particular of glutamate, whose over-stimulation of NMDA receptors during ischemia is one of the principal mechanisms of neuronal excitotoxicity (Choi 1990). In addition, by directly increasing the K+ and Cl- ion conductances at postsynaptic level, adenos-ine stabilises the neuronal membrane potential and reduces the neuronal hyper-excit-ability caused by increased glutamate release during ischemia (Tominaga et al., 1992). The consequent reduction in cellular metabolism and energy consumption (Tominaga et al., 1992) and a moderate lowering of the body/brain temperature (Gourine et al., 2004) are protective events under ischemic conditions. Accordingly, in vitro models demonstrated that selective A1 receptor stimulation reduces neuronal damage follow-ing hypoxia and/or glucose deprivation in primary cortical or hippocampal cell cul-tures (Daval et al., 1994) and brain slices (Dux et al., 1992; Marcoli et al., 2003; Mori et al., 1992; Newman et al., 1998; Tanaka et al., 1997). Although data converge in dem-onstrating a neuroprotective effect of adenosine through A1 receptors during ischemia, the clinical utility of selective A1 agonists is hampered by unwanted central and periph-eral effects i.e. sedation, bradycardia, hypotension (White et al., 1996).
The role of A2A receptors in cerebral ischemia has been recently studied. Several data support an opposite, deleterious, role of A2A receptors during ischemic brain in-jury in comparison to adenosine A1 receptors. In 1994, Gao and Phillis (Gao et al., 1994) demonstrated for the first time that the non-selective A2A receptor antagonist CGS 15943 reduces cerebral ischemic injury in the gerbil following global forebrain ischemia. Thereafter, many reports have confirmed the neuroprotective role of A2A re-ceptor antagonists in different models of ischemia. The selective A2A receptor antago-nist CSC, as well as the less selective antagonists CGS 15943 and CP 66713, were able to ameliorate hippocampal cell injury during global forebrain ischemia in gerbils (Phil-lis 1995; von Lubitz et al., 1995). In agreement with these observations, hippocam-pal activation of A2A receptors during in vitro oxygen and glucose deprivation (OGD) may reduce the beneficial effects mediated by A1 receptors and, in addition, increase glutamate outflow, thus contributing to the excitotoxic damage. These mechanisms ex-plain the protective effects of A2A selective antagonists during OGD insults (Latini et

Elisabetta Coppi34
al., 1999a). Similarly, the selective A2A receptor antagonist SCH 58261 reduced ischem-ic brain damage in a rat neonatal model of hypoxia/ischemia (Bona et al., 1997) and in an adult rat model of focal cerebral ischemia (Melani et al., 2003 and 2006; Monopoli et al., 1998). Studies in genetically manipulated mice definitely confirmed the neuro-protective role of A2A receptor antagonists on ischemic brain damage. In fact, in A2A receptor knockout mice subjected to focal cerebral ischemia, the cerebral damage and neurological deficits were attenuated (Chen et al., 1999). The beneficial effects brought about by A2A antagonists are mainly attributed to the blockade of A2A receptors located presynaptically on glutamatergic terminals (Hettinger et al., 2001; Rosin et al., 2003) thus reducing the excitotoxic damage (Marcoli et al., 2003). In fact, selective activation of adenosine A2A receptors has been demonstrated to promote glutamate release under normoxic and ischemic conditions (Corsi et al., 1999 and 2000; O’Regan et al., 1992; Popoli et al., 1995; Simpson et al., 1992). In addition, recent data suggest that bone marrow derived cells, injected into rat brains (Yu et al., 2004), and native microglial cells (Melani et al., 2006) are important targets for A2A antagonist-mediated neuropro-tection against ischemic damage.
Few studies, due to the paucity of A2B selective agonists and antagonists, indicate a possible role for A2B receptors during brain ischemic damage. In the stratum radiatum of CA1 hippocampal slices, the number and immunostaining density of immunoreac-tive cells for A2B receptors were increased after ischemic preconditioning (Zhou et al., 2004). In human astroglial cells, the selective A2B receptor antagonist MRS 1706 com-pletely prevents the elongation of astrocytic processes, a typical morphological hall-mark of in vivo reactive astrogliosis which represents a deleterious process induced by selective stimulation of A2B receptors (Trincavelli et al., 2004).
Taking into account that A3 receptors are stimulated by micromolar concentra-tions of adenosine (Fredholm et al., 2001), we may speculate that A3 mediated effects would become particularly important during ischemia when high levels of extracellular adenosine are reached. Unfortunately, the few studies that are present in the literature concerning the role of A3 receptors in cerebral ischemia are rather contradictory. The effects of A3 receptor stimulation appear to depend on drug administration (acute ver-sus chronic), dosage and timing of treatment with respect to the onset of the ischemic insult. In vivo experiments show that the acute administration of a selective A3 recep-tors agonist, IB-MECA, impaired post-ischemic blood flow, increased tissue necrosis and exacerbated the loss of hippocampal neurones in the gerbil model of global fore-brain ischemia (von Lubitz et al., 1994). However, beneficial effects were reported when the A3 agonist was administered chronically in the same ischemia model (von Lubitz et al., 1994; von Lubitz 1999). Other studies reported that treatment with IB-MECA 20 minutes after focal cerebral ischemia decreases the infarct volume, the intensity of reac-tive gliosis and the microglial infiltration, whereas IB-MECA administered 20 minutes prior to ischemia increases infarct volume (von Lubitz et al., 2001). Previous studies in my laboratory demonstrated that in a model of in vitro ischemic preconditioning, the selective A3 receptor antagonist MRS 1523 facilitates the full recovery of CA1 hippoc-ampal neurotransmission after a severe (7-minute) oxygen glucose deprivation (OGD) insult (Pugliese et al., 2003). These data are in line with a previous demonstration that the detrimental effects of A3 receptor activation may be due, at least in part, to the at-tenuation of the beneficial effects of A1 receptors (Dunwiddie et al., 1997a). Contrary to the evidence reported, it has been shown that the A3 receptor agonist, IB-MECA, re-duced the amplitude of postsynaptic potentials in the rat cortex under normal (Brand et al., 2001) and hypoxic (Hentschel et al., 2003) conditions. In agreement, A3 receptor

Effects of extracellular purines 35
knockout mice showed more pronounced hippocampal pyramidal neurone damage following repeated episodes of hypoxia and a decline in cognitive function compared to wild-type mice (Fedorova et al., 2003). These histological and cognitive changes were reproduced in wild-type mice by repeatedly administering the selective A3 receptor an-tagonist, MRS 1523 (Fedorova et al., 2003).
Since information present in the literature about the role of A3 receptors during cerebral ischemia is scarce and conflicting at present, we focused our attention on this matter in the present work. In particular, we investigated the role of this adenosine re-ceptor subtype in a model of in vitro OGD by evaluating the effect of ischemic insults of different duration on hippocampal neurotransmission. In fact, ischemic episodes oc-curring in the mammalian CNS result in impairment of neurotransmission and, with increasing duration of ischemia, in increasingly severe tissue damage. The impairment in neurotransmission is, however, not directly correlated with cell death and is revers-ible if the oxygen and glucose supply is restored within a narrow time window (Latini et al., 1999b; Pugliese et al., 2003). While the disappearance of synaptic activity is the ear-liest detectable functional sign of tissue suffering, the absence of recovery after inter-ruption of ischemia strongly suggests irreversible neurone damage. We monitored both events to correlate protective or deleterious effects of different A3 receptor agonists or antagonists applied during OGD of different time duration.
Another typical electrophysiological parameter usually monitored during OGD is a rapid anoxic depolarization (AD) of a sizeable population of brain cells. This event appears as a consequence of prolonged ischemic episodes and is strictly correlated with irreversible neuronal and glial damage (for a review see: Somjen 2001), also contribut-ing to the increase in cell damage in the so called “ischemic penumbral area” (Touzani et al., 2001). An individual section will be devoted to describing this crucial event com-monly considered an index of irreversible neuronal ischemic damage.
2. Anoxic depolarization
A typical consequence of a cerebral hypoxic/ischemic insult is the appearance of anoxic depolarization (AD), a rapid and regenerative wave of depolarization that propagates in the brain tissue. A similar response occurs in cerebral grey matter under normoxic conditions, as a consequence of neuronal hyper-excitability (for example during epi-leptic discharges) and is called spreading depression (SD). These two events are strictly correlated and present the same diagnostic criterion: an accelerating, regenerative, all-or-none type depolarization spreading out from a restricted core of grey matter into the surrounding tissue (Somjen 2001).
SD was described for the first time by Aristides Leão, in 1944, who recorded a cor-tical electrogram (ECoG) of epileptic discharges obtained by “tetanic” stimulation in anesthetized rabbits. Leão noticed that, immediately after the induced seizure, an un-expected silencing of the ongoing normal electrical activity occurred, and hypothesised that SD and propagation of focal seizures were related phenomena generated by the same cellular elements (Leão 1944). These first observations, later confirmed by others (Van Harreveld et al., 1953), have been later supported by detailed investigations dem-onstrating that SD is caused by a “negative slow voltage variation” in the cortical surface that was identical to the voltage shift recorded after a few minutes of blood flow depri-vation in the cerebral cortex (Leão 1947). By reaching a maximal amplitude of -15 mV, this surface potential shift was astonishingly large compared with other brain waves re-

Elisabetta Coppi36
corded by ECoG and attracted the interest of a number of neurologists. Similarly, se-vere hypoxia or, more generally, sudden energy failure induce an SD-like response, and “spontaneous” waves of SD emanate from the border of an ischemic core and propa-gate into the surrounding brain areas (the “penumbra”). To date, SD and AD have been recorded in almost all brain regions, with high similarity and reproducibility among in vivo and in vitro experiments, but they are more readily provoked in some brain areas than in others. The CA1 region of the hippocampal formation is considered the most susceptible zone, closely followed by the neocortex (Somjen 2001).
Under normoxic conditions, SD can be triggered by a number of different stimu-li and chemicals. Among the chemical agents, noteworthy are K+ ions, glutamate, and acetylcholine, because these molecules are normally present in the brain, and ouabain because it reflects the reduced function of the membrane Na+-K+-ATPase during high energy demand or low energy supply and ultimately raises extracellular K+ concentra-tion, which is known to play a key role in this phenomenon. When ion-selective mi-croelectrodes became available in the ‘60s, allowing to measure “real time” ion con-centration changes in live tissues, it was soon reported an overflow of K+ ions from the cortical surface during both SD (Brinley et al., 1960) and AD (Vyskocil et al., 1972). This K+ overload is also accompanied by a precipitous drop in extracellular Cl- and Na+ levels and a passive release of organic anions from the cell cytoplasm including gluta-mate (Davies et al., 1995). This sequence of events suggests that during AD or SD, in-tra- and extracellular ion concentrations equilibrate and the electrochemical gradient across the cell membrane, which is essential for living functions, is lost. This hypothesis is also supported by the nearly complete depolarization that accompanies these events (Collewijn et al., 1966), typical of cells exposed to high extracellular K+ concentrations as during SD or AD. In fact, as expressed by Grafstein in the “potassium hypothesis” of SD (Grafstein 1956), K+ released during intense neuronal firing accumulates in the re-stricted interstitial space of brain tissue and depolarizes the very cells that released it, resulting in a vicious circle that leads to neuronal hyperexcitability.
Further progresses in describing SD- and AD-related phenomena were made by us-ing intracellular sharp microelectrodes to measure resting membrane potential before, during and after the passage of SD or AD waves. This technique allowed the recording of an abrupt depolarization in cell potential, approaching zero millivolts during SD for some seconds, that was always accompanied by a 90% decrease in membrane input re-sistance (Collewijn et al., 1966; Muller et al., 2000). The “all-or-none” nature of both events was confirmed by the observation that, once started, the amplitude of mem-brane depolarization was independent of the severity of the triggering event (Muller et al., 2000). When membrane potential recordings were made simultaneously from stratum radiatum and stratum pyramidale of CA1 hippocampal slices, cell depolariza-tion always began earlier and was of larger amplitude and longer duration in the layer of dendritic trees than in cell somata, suggesting that the triggering region was the den-dritic layer and from there the depolarization spreads to the cell bodies (Herreras et al., 1993c). A detailed analysis of the time course of different AD-related events in the hip-pocampus demonstrated that the onset of voltage changes was usually preceded by in-creased neuronal excitability that produced a “shower of population spikes” reflecting synchronized firing of pyramidal neurons (Grafstein 1956; Herreras et al., 1993b). This neuronal hyperactivity, also recorded during in vivo experiments (Rosenblueth et al., 1966), was shown to be strictly related to glutamate-induced excitotoxicity, since the voltage changes produced during AD or SD were greatly reduced by NMDA receptor antagonists (Herreras et al., 1993a), that are well known neuroprotective agents against

Effects of extracellular purines 37
ischemia-induced damage of the brain tissue in experimental models (Calabresi et al., 2000; Lee et al., 1999). In addition, the exogenous application of glutamate to the corti-cal surface is able to induce SD (Van Harreveld 1959). Evidence indicates, however, that a much reduced but still substantial ion gradient remains across the plasma membrane during AD (Muller et al., 2000).
The massive redistribution of ions between the intra- and extracellular compart-ment during AD and SD leads to significant changes in cell homeostasis, reflected by the prominent cell swelling that accompany both phenomena. Leão himself firstly de-scribed a transient increase in tissue electrical impedance accompanying SD (Leão et al., 1953), and this was soon confirmed by others (Hoffman et al., 1973; Ochs et al., 1956). The major effect was the increase in tissue resistance, and was confirmed by morphological studies to be caused by swelling of cells leading to shrinkage of the in-terstitial space (Kow et al., 1972; Van Harreveld et al., 1959). Another parameter usual-ly measured to monitor in vitro induced SD or AD is the intrinsic optical signal (IOS). Cell swelling produces a marked change in intracellular volume that is reliably associ-ated with a decrease in light scattering (Aitken et al., 1999), attributable to the dilution of scattering particles in the cytosol (Barer et al., 1953). This sequence of events leads to a pronounced increase in the IOS of brain tissue, as reported for the first time by Snow et al in hippocampal slices during SD (Snow et al., 1983). This new approach permitted a detailed real-time two-dimensional mapping (not reachable with microelectrodes) of SD and AD spread, simultaneously recorded with other parameters (for example mem-brane potential or extracellular K+ concentration), as exemplarily reported by Obeidat and Andrew (Obeidat et al., 1998). Again, in hippocampal slices, the IOS triggered by AD or SD was stronger and occurred more rapidly in the dendritic layer of stratum ra-diatum than in the somatic region of stratum pyramidale (Aitken et al., 1998; Muller et al., 1999).
In spite of the many similarities between SD and AD events, some differences have also been described. For example, depolarization in SD is “self-limiting” and is followed by complete restoration of neuronal functions as soon as neurons recover their rest-ing membrane potential, without any “irreversible side effects” at least after sparce SD events. On the contrary, after an AD, membrane potential and neuronal functions only recover if oxygen is restored soon after the onset of depolarization (Lipton 1999) since oxidative energy (O2 and ATP consumption) is required to restore ion gradients (Wang et al., 2000). If the ischemic insult persists during AD manifestation, neuronal damage will become irreversible and only a partial recovery of brain tissue functionality can be achieved. This seems to be mainly due to the deleterious role of a protracted intracel-lular Ca2+ rise, an event typically recorded during ischemia. In this regard it may be ar-gued that, during normoxic SD, neurons gain as much Ca2+ as during AD but do not encounter such irreversible damage because membrane depolarization is self-limiting and only lasts for a few seconds. In fact, it has been demonstrated that if neurones are forced to remain depolarized for extended periods after SD triggering, even in well-oxygenated tissues they do not regain function (Herreras et al., 1993b; Kawasaki et al., 1988). Accordingly, if Ca2+ is removed from the bathing solution before oxygen is with-drawn, neurons recover their functions following a period of hypoxia that otherwise would have caused irreversible damage (Siesjo, 1989). It appears that intracellular Ca2+ levels must remain elevated for a critical length of time to initiate the reactions that re-sult in irreversible cell injury (Deshpande et al., 1987; Morley et al., 1994). It follows that any treatment that postpones the onset of AD should extend the time limit of cell recovery. This concept has been largely confirmed by both in vivo and in vitro studies

Elisabetta Coppi38
and represents the basis of the present work to investigate the effect of different drugs acting on purinergic systems during ischemia. On these basis, we monitored AD ap-pearance in hippocampal slices as an index of irreversible tissue damage induced by in vitro ischemia and we investigated the role of purinergic receptors during such insults (Obeidat et al., 1998).
3. Role of P2 receptors
Studies on the functional role of P2 receptors are a recent field of research in com-parison to the adenosine effects. ATP- or UTP-mediated actions have been reported in a number of tissues. Early evidence, as already anticipated in the “historical over-view”, came from the cardiovascular system, with observations by Drury and Szent-Gyorgyi, in 1929, reporting complex chronotropic and inotropic effects mediated by extracellular ATP on Langendorf ’s heart model (Drury et al., 1929). Subsequent evi-dence about ATP-mediated effects came from the gastrointestinal system, where ATP has been firstly recognised to act as a co-transmitter with either VIP and/or NO play-ing a role in NANC-mediated inhibition of taenia coli motility (Burnstock et al., 1963) and contraction of the esophageal sphincter (Castell 1975). A few years later, the pres-ence of both vasoconstricting P2X receptors and vasodilating P2Y receptors in pulmo-nary vessels was demonstrated in rats and humans (Liu et al., 1989a and 1989b). In ad-dition, in airway epithelial cells, ATP enhances the synthesis and secretion of mucins via P2 receptor activation (Davis et al., 1992). Another important aspect in which ATP exerts a key role is haemostasis, where ATP, but mostly ADP, was recognised early on as one of the most potent stimulators of platelet aggregation (Gaarder et al., 1961). This discovery led to the first clinical use of a P2-related drug, clopidogrel, a prodrug of an irreversible P2Y12 antagonist, that has proved to be effective in inhibiting pro-aggrega-tion signals via the platelet-specific P2Y12 ADP receptor and is used in the prevention of cardiovascular events (van Giezen et al., 2005). A related compound, the selective and competitive P2Y12 antagonist cangrelor (also known as AR-C69931MX), is now in the late stage of Phase II clinical trials for haemostasis disorders with promising results (Fugate et al., 2006).
It has long been known that ATP acts as an extracellular messenger in inflamma-tory responses. This finding encouraged the exploration of P2 antagonists as new target for anti-inflammatory drug development. Most evidence attributes a key role for P2X7 in this function; in fact this receptor is highly expressed in immune cells, including microglia, macrophages, lymphocytes, and dendritic cells (Collo et al., 1997), where it mediates cytotoxic responses, cytokine release, and phagocytosis-associated cell fu-sion. For example, it has been shown that P2X7 receptor activation in macrophages and microglial cells is one of the most potent stimuli for interleukin-1β (IL-1 β) secretion in response to lipopolysaccharide (LPS) stimulation (Ferrari et al., 1997) and promotes cell infiltration and chemokine release in in vivo tissues (Fulgenzi et al., 2005). Further studies in P2X7-deficient mice confirmed the involvement of this receptor in inflamma-tory (Solle et al., 2001) and immune (Labasi et al., 2002) processes.
Among the impressive variety of actions mediated by extracellular purine nu-cleotides, it is helpful to focus on the involvement of P2 receptors in neurotransmis-sion under physiological and pathological conditions, since most research of this the-sis has been performed in the brain using electrophysiological techniques. The role of P2 receptors has been also investigated during in vitro OGD; thus a describtion of the

Effects of extracellular purines 39
present knowledge on ATP and degenerative events is needed. Another important field concerns the involvement of P2 receptors in mediating trophic effects related to cell de-velopment and proliferation, since part of the research was dedicated to study ATP-me-diated effects in a bone-marrow stem cell lineage. For this reason, a whole paragraph will be devoted to explore each of these arguments.
3.1 P2 receptors and neurotransmission
Differently from adenosine, ATP is considered itself a neurotransmitter since it presents all the typical features of this class of molecules:1) It is stored in vesicles at presynaptic nerve terminals and released in quanta upon
specific stimulation (electrically or chemically-induced depolarization).2) Its extracellular concentration is finely tuned and transmitter action terminated
by the coordinated action of catalytic enzymes (NTPDases) acting in the order of ms.
3) It is able to activate specific receptors on the postsynaptic membrane (P2X and P2Y receptors) which may directly elicit postsynaptic currents or membrane depolari-zation with a modest delay (in the case of P2X-mediated EPSCs: time delay in the order of to 1-2 ms), to propagate an electrical stimulus among adjacent excitable cells for relatively “long” distances.
Investigation into P2-mediated effects on neurotransmission have been historical-ly complicated by the neuromodulatory role of adenosine in the CNS, since extracel-lularly released ATP is rapidly converted to its metabolite adenosine and, in addition, P1 receptors are widely expressed in the CNS. However, in the last 15 years, the role of P2 receptors in synaptic activity has been better elucidated, thanks to novel pharma-cological tools able to selectively bind to specific P2 receptors. While ionotropic P2X receptors are mainly involved in fast synaptic transmission, directly eliciting synaptic currents (Edwards et al, 1992; Bardoni et al., 1997; Khakh, 2001 Pankratov et al., 1998; 2002; 2006), metabotropic P2Y receptors rather mediate slower neuromodulatory ef-fects, eliciting changes in neuronal excitability or neurotransmission mainly through the G protein-related modulation of ligand-gated or voltage-gated ion channels, either at pre- or postsynaptic sites of action.
P2X-receptor mediated synaptic currents were first described in the peripheral nervous system. In late ’80s-early ‘90s, it was demonstrated that cultured rat sensory neurons (Krishtal et al., 1988) and cardiac parasympathetic ganglion cells (Fieber et al., 1991) and sympathetic ganglion cells (Evans et al., 1992; Cloues, 1995) displayed in-ward currents in the presence of exogenous ATP. These ATP-elicited currents presented the typical features of P2X-mediated conductances: a tiny delay between ATP applica-tion and current onset (less than 20 ms), strong inward rectification, Na+ and Ca2+ per-meability, a reversal potential around 0 mV, a single-channel conductance around 20-50 pS and, obviously, a marked sensitivity to P2 antagonists (suramin and RB2). Within the CNS, the first evidence of ATP-mediated synaptic currents came a few years later from a study in the medial habenula (Edwards et al., 1992a), who demonstrated that, after exclusion of glutamate, GABA and ACh-gated ionotropic receptors with selective antagonists, it was still possible to evoke inward synaptic currents, TTX- α−β-meATP and suramin-sensitive, by electrical stimulation. In the same work, the existence of en-dogenous ATP release was suggested by the observation that suramin alone diminished both the frequency and the amplitude of miniature excitatory postsynaptic currents

Elisabetta Coppi40
(mEPSCs) recorded in the presence of TTX. Soon after, a number of evidences strongly supported a role of ATP as a fast neurotransmitter in other brain regions: locus ceru-leus (Nieber et al., 1997), trigeminal mesencephalic nucleus (Khakh et al., 1997), spinal cord dorsal horn (Bardoni et al., 1997), hippocampal CA1 (Pankratov et al., 1998) and CA3 (Mori et al., 2001) regions and somato-sensory cortex (Pankratov et al., 2002).
At a presynaptic level, P2X receptor activation enhances neurotransmitter release (Cunha et al., 2000). P2X7 subtypes seems to be particularly important in this effect. Their stimulation enhances glutamate release from rat dorsal horn neurons in the spi-nal cord (Nakatsuka et al., 2001) and in the mesencephalic nucleus (Khakh et al., 1998), evidence consistent with the mainly presynaptic expression of these receptors (Deu-chars et al., 2001; but see Sim et al., 2004 for a re-examination of this role). Several data demonstrate an important role of P2X7 receptors in modulating neurotransmitter re-lease in the hippocampus, where their stimulation induces either glutamate outflow from pyramidal cells and GABA release from hippocampal interneurones (Sperlagh et al., 2002). In this brain region, P2X7 receptors are also expressed by astrocytes and seem to participate to the increased glutamate release (Duan et al., 2003).
P2Y receptors can modulate neurotransmission mainly by G protein coupling and consequent alterations in the opening and closure of ion channels, either voltage- or ligand-gated, at both pre- and postsynaptic level. Since a considerable section of the present work was aimed to investigate the modulation of ionic conductances by P2Y re-ceptor activation in different cell types, this subject will be described in detail, describ-ing the present status of knowledge in the field.
Among voltage-gated channels, Ca2+ and K+ conductances are the major media-tors of P2Y effects. The first evidence for regulation of voltage-activated Ca2+ channels via P2Y receptors was obtained in adrenal chromaffin cells, where ATP and ADP ap-plication caused a pertussis toxin (PTX)-sensitive reduction of current amplitudes (Di-verse-Pierluissi et al., 1991; Lim et al., 1997), an effect sensitive to RB2 and mediated by the inhibition of N- and P/Q-type calcium channels (Gandia et al., 1993; Powell et al., 2000). Similarly, in NG108-15 neuronal hybrid cells, not only adenine but also uri-dine nucleotides (UTP and UDP) inhibited N-type as well as L-type Ca2+ channels in a PTX-sensitive and insensitive manner, respectively (Filippov et al., 1996). Several other cases have been subsequently reported. In general, P2Y12 mediated effects were found to be PTX-sensitive, as expected for Gi/o coupled receptors, and mediated by a membrane-delimited pathway, likely due to a direct interaction of the Gi/o βγ subunit with the Ca2+ channel (Simon et al., 2002). In contrast, the inhibition of Ca2+ current via P2Y1,2,4 and 6 receptors included two components: a PTX-sensitive and membrane-delimited pathway, as well as a PTX-resistant second messenger-mediated mechanism (Filippov et al., 1998 and 1999). The diffusible second messenger involved in the effect was found to be a product of PLCβ-dependent hydrolysis of membrane phosphatidyli-nositol 4,5-bisphosphate (PIP2: Lechner et al., 2005; Gamper et al., 2004). Circumstanc-es were complicated by the fact that some P2Y-mediated responses seemed to depend on the experimental procedure used. For example, some authors reported that P2Y4-mediated inhibition of Ca2+ currents was solely observed in the perforated patch con-figuration, whereas almost no inhibition was recorded in the standard whole-cell mode (Filippov et al., 2003) implying involvement of a diffusible second messenger. At the functional level, voltage-activated Ca2+ channels, in particular N- and P/Q-type chan-nels, are located at presynaptic nerve terminals and link invading action potentials to transmembrane Ca2+ influx and concomitant vesicle exocytosis (Catterall et al., 2003). As a consequence, the inhibition of voltage gated Ca2+ currents by adenine and uridine

Effects of extracellular purines 41
nucleotides may be responsible for the reduction in neurotransmitter release reported in different brain regions after stimulation of P2Y receptors, such as the hippocampus (Mendoza-Fernandez et al., 2000; Rodrigues et al., 2005) and cortex (von Kugelgen et al., 1994 and 1997). In addition, changes in Ca2+ influx in neurones may also affect the activity of Ca2+-dependent K+ channels, that are known to shape single action poten-tials and regulate firing frequency adaptation (Faber et al., 2003).
However, nucleotides were not only found to exert inhibitory effects on neuronal Ca2+ channels. ATP, for instance, may increase Ca2+ currents in hippocampal neurons (Dave et al., 1996), a result also reported for rat cardiac cells (Scamps et al., 1994). Un-fortunately, the receptor subtypes responsible for these effects are still unknown.
Some of the mechanisms underlying the regulation of voltage-activated Ca2+ chan-nels via P2Y receptors are shown in figure 10.
61
1994 and 1997). In addition, changes in Ca2+ influx in neurones may also affect the activity of Ca2+-
dependent K+ channels, that are known to shape single action potentials and regulate firing frequency
adaptation (Faber et al., 2003).
However, nucleotides were not only found to exert inhibitory effects on neuronal Ca2+ channels.
ATP, for instance, may increase Ca2+ currents in hippocampal neurons (Dave et al., 1996), a result also
reported for rat cardiac cells (Scamps et al., 1994). Unfortunately, the receptor subtypes responsible for
these effects are still unknown.
Some of the mechanisms underlying the regulation of voltage-activated Ca2+ channels via P2Y
receptors are shown in figure 10.
Figure 10. P2Y nucleotide receptors may use at least four different pathways to modulate neuronal Ca2+ channels: (1) Activation of P2Y receptors coupled to PTX-sensitive Gi/o proteins sets subunits free which directly interact with pore-forming Ca2+ channel proteins. (2) The same pathway sometimes also requires a soluble cofactor in addition to the membrane-associated G proteins. (3) Some P2Y receptors may also mediate such a voltage-dependent inhibition of Ca2+ currents via PTX-insensitive G proteins. (4) Activation of P2Y receptors linked to PTX-insensitive Gq/11 proteins initiates a signal cascade that involves diffusible second messengers and mediates inhibition of Ca2+ currents . For other Gq/11-coupled receptors (e.g., muscarinic or bradykinin receptors), this pathway was found to involve an activation of phospholipase C and a depletion of membrane phosphatidylinositol 4,5-bisphosphate. Taken from: Hussl et al., 2006.
Aside from voltage-gated Ca2+ channels, a variety of neuronal K+ channels have been found to be
modulated by extracellular nucleotides. Quite a number of different K+ channels were reported to be
modulated by various neurotransmitters, but the most intensively studied examples of K+ channel
regulation via GPCRs are inward rectifier channels (Kir belonging to Kir3, also called GIRK family) and
KCNQ channels.
Concerning GIRK channels, it is known that the activation of Gi/o-linked receptors generally opens
these channels (Fernandez-Fernandez et al., 2001) whereas Gq/11-linked receptors usually lead to their
closure (Hussl et al., 2006). Many inhibitory neurotransmitters, included GABA and adenosine, cause
Figure 10. P2Y nucleotide receptors may use at least four different pathways to modulate neu-ronal Ca2+ channels: (1) Activation of P2Y receptors coupled to PTX-sensitive Gi/o proteins sets βγ subunits free which directly interact with pore-forming Ca2+ channel proteins. (2) The same pathway sometimes also requires a soluble cofactor in addition to the membrane-associated G proteins. (3) Some P2Y receptors may also mediate such a voltage-dependent inhibition of Ca2+ currents via PTX-insensitive G proteins. (4) Activation of P2Y receptors linked to PTX-insensi-tive Gq/11 proteins initiates a signal cascade that involves diffusible second messengers and me-diates inhibition of Ca2+ currents . For other Gq/11-coupled receptors (e.g., muscarinic or brady-kinin receptors), this pathway was found to involve an activation of phospholipase C and a depletion of membrane phosphatidylinositol 4,5-bisphosphate. Taken from: Hussl et al., 2006.
Aside from voltage-gated Ca2+ channels, a variety of neuronal K+ channels have been found to be modulated by extracellular nucleotides. Quite a number of different K+ channels were reported to be modulated by various neurotransmitters, but the most intensively studied examples of K+ channel regulation via GPCRs are inward rectifier channels (Kir belonging to Kir3, also called GIRK family) and KCNQ channels.
Concerning GIRK channels, it is known that the activation of Gi/o-linked recep-tors generally opens these channels (Fernandez-Fernandez et al., 2001) whereas Gq/11-linked receptors usually lead to their closure (Hussl et al., 2006). Many inhibitory neu-rotransmitters, included GABA and adenosine, cause hyperpolarizations by activating inwardly rectifying K+ currents via receptors linked to PTX-sensitive G proteins. Ac-cordingly, opening of GIRK channels by 2MeS-ADP in superior cervical ganglion neu-rons transfected with P2Y12 receptors, that are typically coupled to Gi/o proteins (Simon et al., 2002) and a closure of GIRK channels after P2Y1,2,4,6 receptor activation (in cells transfected with each of these receptor subtypes) in a PTX-insensitive manner has been

Elisabetta Coppi42
described (Filippov et al., 2004; Mark et al., 2000). Again, the latter mechanism has been attributed to PIP2 hydrolysis and IP3-mediated intracellular signalling pathways (Filippov et al., 2004).
Among KCNQ channels, the best studied example is the M-current (IM), that is in-hibited through the activation of various GPCR coupled to Gq/11 proteins by PLCβ ac-tivation and PIP2-IP3-coordinated signalling (muscarinic M1-mediated closure of such a channel was the first example of this mechanism described by Brown and Adams in 1980: Brown et al., 1980). Several neurotransmitters depolarize neurons by inhibit-ing M-type currents, an effect that is also shared by extracellular nucleotides, as dem-onstrated by the inhibition of IM by UTP (Adams et al., 1982) and ATP (Akasu et al., 1983; Tokimasa et al., 1990) in bullfrog sympathetic neurons. This was one of the first examples of a modulation of K+ channels by nucleotides and, although the receptors involved in these effect remained unknown at that time, the inhibition of IM by nucle-otides was shown to be mediated by a G protein (Lopez et al., 1989). Subsequent stud-ies were aimed at identifying the P2Y subtype involved in IM inhibition. Most of them recognized a UTP-preferring receptor involved in this effect: in NG108-15 hybrid cells, activation of the PLC-linked P2Y2 receptor was reported to lead to an inhibition of IM (Filippov et al., 1994). Accordingly, P2Y6, was found to mediate an inhibition of IM in rat superior cervical ganglion neurons (Boehm 1998), and P2Y4 in bullfrog sympathet-ic neurons (Meng et al., 2003). In all cases, the signalling cascade underlying this effect involved an activation of PLC, generation of IP3, and release of Ca2+ from intracellular stores (Bofill-Cardona et al., 2000).
Another class of K+ channels modulated by P2Y receptor activation is that of Ca2+-sensitive-K+ channels. These channels, divided into BK, SK or IK channels, are activat-ed by increased intracellular Ca2+ levels either due to Ca+2 entry from voltage-depend-ent channels (L-type, N-type) or from the release of Ca2+ ions from intracellular stores. Since P2Y receptors mainly activate PLC-mediated intracellular Ca2+ release, they are a good candidate to elicit Ca2+-activated K+-channel opening. In fact, it has already been demonstrated that P2Y receptor stimulation indeed activates BK channels (in retinal Muller cells: Bringmann et al., 2002; in clonal kidney cells: Hafting et al., 2000) and SK channels (colon smooth muscle cells :Koh et al., 1997; Zizzo et al., 2006).
At a functional level, modulation of K+ channels (GIRK, KCNQ, BK or SK) will cause changes in postsynaptic excitability rather than in neurotransmitter release, due to the preferentially dendritic and somatic expression of such proteins.
Some of the mechanisms underlying the regulation of GIRK and KCNQ channels via P2Y receptors are presented in figure 11.
Furthermore, it has been recently demonstrated that some non-selective cationic conductances can be activated by P2Y1 receptor stimulation. In fact, data in the mouse hippocampus demonstrate that, in CA1 and CA3 regions, P2Y1 agonists can evoke an inward cationic conductance that depolarizes GABAergic interneurones (Bowser et al., 2004; Kawamura et al., 2004). Similarly, in rat megakaryocytic cells, P2Y1 receptor stimulation activates some non-selective cationic conductances belonging to the fam-ily of transient receptor potential channels (TRP channels) (Tolhurst et al., 2005) that elicits an inward Na+-Ca2+ mixed current. Both mechanisms are mediated by Gq pro-tein-induced activation of PLC.
Finally, some ligand-gated ion channels were found to be regulated via P2Y recep-tors. One prominent example is the glutamatergic NMDA receptor that is also modu-lated by other GPCRs. Adenine and uridine nucleotides were reported to enhance cur-rents elicited by NMDA in layer V pyramidal neurons of the rat prefrontal cortex. This

Effects of extracellular purines 43
effect was firstly proposed to be mediated by P2Y2 receptors (Wirkner et al., 2002). However, a recent study by the same authors, demonstrated that this effect was due to the activation of P2Y4 receptor expressed by astrocytes and involved the stimulation of type I mGluR (Wirkner et al., 2006). In contrast, activation of P2Y1 receptors inhibited currents through the NMDA receptors (Luthardt et al., 2003) in the very same cells. In addition, ATP was found to inhibit NMDA receptors independently of P2Y receptors; this effect involved a direct binding of the nucleotide to the glutamate-binding site of the NR2B subunit of NMDA receptors (Ortinau et al., 2003; Kloda et al., 2004). An-other transmitter-gated ion channel that was found to be modulated by nucleotides is the vanilloid receptor 1 (VR1) that might be relevant in peripheral sensory neurons. In rat DRG neurones, capsaicin-evoked currents through VR1 were enhanced by nucle-otides (Tominaga et al., 2001). This potentiation was abolished by a PKC inhibitor and mimicked by phorbol esters (PKC activators). These results indicated that a P2Y recep-tor linked to PKC via Gq/11 proteins was involved. Moreover, UTP was reported to be as potent an agonist as ATP, and suramin abolished the potentiation of VR1 by UTP. The authors concluded that P2Y2 receptors mediated the facilitatory effects of nucleotides on VR1 in mouse and rat dorsal root ganglion neurons (Moriyama et al., 2003).
63
Some of the mechanisms underlying the regulation of GIRK and KCNQ channels via P2Y
receptors are presented in figure 11.
Figure 11. P2Y nucleotide receptors may use at least three different pathways to modulate the functions of GIRK and KCNQ channels: (1) Activation of P2Y receptors coupled toPTX-sensitive Gi/oproteins sets subunits free which directly interact with Kir3 proteins to activate the channels. (2) Activation of P2Y receptors linked to PTX-insensitive Gq/11 proteins leads to the activation of phospholipase C, which uses membrane phosphatidylinositol 4,5-bisphosphate (PIP2) to synthesize inositol triphosphate (IP3) and diacyl glycerol. Via the depletion of PIP2, GIRK channels as well as KCNQ channels are closed. (3) The accumulating IP3 liberates Ca2+ from intracellular stores, and the increase in cytosolic Ca2+ inhibits KCNQ channels via calmodulin. Take from: Hussl et al., 2006.
Furthermore, it has been recently demonstrated that some non-selective cationic conductances can
be activated by P2Y1 receptor stimulation. In fact, data in the mouse hippocampus demonstrate that, in
CA1 and CA3 regions, P2Y1 agonists can evoke an inward cationic conductance that depolarizes
GABAergic interneurones (Bowser et al., 2004; Kawamura et al., 2004). Similarly, in rat megakaryocytic
cells, P2Y1 receptor stimulation activates some non-selective cationic conductances belonging to the
family of transient receptor potential channels (TRP channels) (Tolhurst et al., 2005) that elicits an inward
Na+-Ca2+ mixed current. Both mechanisms are mediated by Gq protein-induced activation of PLC.
Finally, some ligand-gated ion channels were found to be regulated via P2Y receptors. One
prominent example is the glutamatergic NMDA receptor that is also modulated by other GPCRs. Adenine
and uridine nucleotides were reported to enhance currents elicited by NMDA in layer V pyramidal
neurons of the rat prefrontal cortex. This effect was firstly proposed to be mediated by P2Y2 receptors
(Wirkner et al., 2002). However, a recent study by the same authors, demonstrated that this effect was due
to the activation of P2Y4 receptor expressed by astrocytes and involved the stimulation of type I mGluR
(Wirkner et al., 2006). In contrast, activation of P2Y1 receptors inhibited currents through the NMDA
receptors (Luthardt et al., 2003) in the very same cells. In addition, ATP was found to inhibit NMDA
receptors independently of P2Y receptors; this effect involved a direct binding of the nucleotide to the
Figure 11. P2Y nucleotide receptors may use at least three different pathways to modulate the functions of GIRK and KCNQ channels: (1) Activation of P2Y receptors coupled toPTX-sen-sitive Gi/o proteins sets βγ subunits free which directly interact with Kir3 proteins to activate the channels. (2) Activation of P2Y receptors linked to PTX-insensitive Gq/11 proteins leads to the activation of phospholipase C, which uses membrane phosphatidylinositol 4,5-bisphosphate (PIP2) to synthesize inositol triphosphate (IP3) and diacyl glycerol. Via the depletion of PIP2, GIRK channels as well as KCNQ channels are closed. (3) The accumulating IP3 liberates Ca2+ from intracellular stores, and the increase in cytosolic Ca2+ inhibits KCNQ channels via calmod-ulin. Take from: Hussl et al., 2006.
3.2 P2 receptors and cerebral ischemia
The role of P2 receptors may become critical during pathological conditions such as ischemia, when extracellular ATP concentrations increase. Again, elucidation of the role of P2 receptors in such pathological conditions is complicated by the concomi-tant increase in adenosine levels, whose activation of P1 receptors has already been de-scribed. An enhanced outflow of radioactive ATP from hippocampal slices during in
Elisabetta Coppi44
vitro ischemic-like insults was first reported by Juranyi and co-workers (Juranyi et al., 1999) and the first demonstration that ATP outflow increases in vivo during the induc-tion of focal ischemia in the rat was reported by Melani and colleagues (Melani et al., 2005). Evidence supports the idea that, under such pathological conditions, released ATP may exert a cytotoxic role. Intrastriatal ATP injection in rats induced, 24 hours lat-er, a clearly lesioned area (Ryu et al., 2002). The ATP-induced damage was concentra-tion-dependent, mimicked by ATPγS and α,β meATP (but not by ADP or adenosine) and blocked by RB2, a non-specific P2 antagonist (Kharlamov et al., 2002). Suramin, another non-specific P2 receptor antagonist, administered 30 minutes before occlusion of the middle cerebral artery, resulted in a significant decrease in infarct and oedema volume 6h after brain injury (Kharlamov et al., 2002). In agreement, it has been dem-onstrated that RB2 (Melani et al., 2006) and PPADS (Lammer et al., 2006) improve neurological deficit and reduce the damage induced in rats in a model of focal ischemia in vivo. Protective effects of P2 receptor antagonists (suramin, BBG and RB2), on cell survival were also demonstrated in organotypic hippocampal slices exposed to OGD (Cavaliere et al., 2001a; 2003 and 2004).
3.3 P2 receptors and trophic effects
In contrast to the toxic effects described above, P2 receptors can also exert troph-ic actions on cell growth and development as well as regeneration and proliferation in different tissues, including the brain (Franke et al., 2006). The first indication for an ATP-mediated role came from a study on PC12 cells at the beginning of the ‘90s, where the authors demonstrated that ATP enhanced neuronal growth factor- (NGF)-induced neurite outgrowth, although ATP alone did not cause any neurite development. This mechanism was found to be mediated by ATP-induced Ca2+ influx, rather than to in-tracellular mobilization of the ion, and the consequent increase in cytosolic Ca2+ levels was the triggering signal (Aono et al., 1990). Subsequent studies reported not only that the synergistic action of ATP and this trophic factor was also shared by UTP (Pooler et al., 2005) and blocked by P2 antagonists (D’Ambrosi et al., 2000), but also that ex-tracellular nucleotides stimulate the synthesis and release of both NGF and fibroblast growth factor (FGF) from the same cell system (D’Ambrosi et al., 2001; Huang et al., 1996). Further studies demonstrated that ATP activation of P2Y2 receptors enhances NGF-induced neurite outgrowth also in DRG neurones and inhibits serum-depriva-tion induced apoptosis by activation of the MAPKs cascade in both DRG neurones and PC12 cells (Arthur et al., 2005; Arthur et al., 2006). The anti-apoptotic mechanism ac-tivated by ATP in PC12 cells was demonstrated to involve the up regulation of some heat shock proteins (HSP70 and HSP90), the prevention of caspase-2 cleavage and the inhibition of cytochrome C release from mitochondria into the cytoplasm (D’Ambrosi et al., 2004). P2 receptor activation was also reported to promote fibre outgrowth in the developing hippocampus (Heine et al., 2006; Skladchikova et al., 1999), but it remain elusive whether this effect is mediated by P2X or P2Y receptors. The unique in vivo study available at present reports that injection of a stable ATP analogue, ATPγS, in the rat sciatic nerve is effective in enhancing the expression of growth-associated protein-43 (GAP-43), a marker for axonal growth, in wild-type but not P2Y2
(-/-) mice (Arthur et al., 2005).
In the last few years, exciting results came from studies about stem cells. This field of research is receiving vast consideration among scientists since the growing knowl-edge of stem cell physiology and functions allows their employment as initial materi-

Effects of extracellular purines 45
al for organ-engineered constructs and tissue repair. The intriguing results about the trophic roles mediated by extracellular purines and pyrimidines stimulated the inves-tigation of similar effects also in immature, stem cell-like systems. Indeed, it has been demonstrated that various lineages of undifferentiated cells, such as haematopoietic stem cells (Lemoli et al., 2004; Sak et al., 2003), neuronal progenitor stem cells (Hogg et al., 2004; Ryu et al., 2003) and oligodendrocytes progenitors (Agresti et al., 2005) re-spond to extracellular ATP with an increased proliferation, differentiation and/or mi-gration by intracellular signalling cascades that are similar or synergistic to that acti-vated by numerous growth factors. Particularly interesting data correlate these trophic effects with the occurrence of spontaneous Ca2+ waves that propagate among adjacent cells in a self-renewing manner. In fact, it is known that Ca2+-dependent signalling pathways play crucial roles in cellular proliferation and differentiation (Clapham 1995). Such mechanism that promote periodic oscillation of intracellular Ca2+ seem to be trig-gered by a diffusible extracellular messenger spontaneously released by different kind of cells. At least in some cases ATP has been proposed to be the most likely candidate implicated in such a mechanism. In fact it was shown that a number of cultured cells, like astrocytes (Anderson et al., 2004), osteoblasts (Jorgensen et al., 1997; Henriksen et al., 2006), fibroblasts (Gerasimovskaya et al., 2002), striatal-derived cells from rat em-bryos (Scemes et al., 2003) and endothelial cells (Gomes et al., 2005a) can release ATP in an autocrine/paracrine manner, and through the activation of P2 receptors (mainly P2Y) induces the propagation of such Ca2+ waves. In a particularly interesting study, it was demonstrated that ATP-mediated propagation of Ca2+ waves through radial glial cells modulates neurogenesis in embryonic rat neocortex (Weissman et al., 2004).

Aimofthestudy
The aim of the present study was to investigate the role of P1 and P2 purinergic recep-tors stimulation in different in vitro cell systems. In particular, this thesis is subdivid-ed into two principal sections, differing either in methodological approaches or in the means of investigation.
1. The first section is entitled: “Role of purines in CA1 hippocampal neurotransmis-sion under normoxic conditions and during OGD. Extracellular recordings from rat hippocampal slices.”
Within this argument of research two major points have been analysed:Chapter 1: “Role of A3 adenosine receptors during OGD.”Chapter 2: “Role of P2 purinergic receptors in CA1 neurotransmission under nor-moxic conditions and during OGD.”
2. The second section is entitled: “Studies on P2 receptor modulation of membrane ionic currents by patch clamp recordings.”
Within this argument of research three major points have been analysed:Chapter 3: “Role of P2Y1 receptor stimulation in medium spiny neurons of rat stri-atal slices.”Chapter 4: “Role of purine nucleotides in cultured hMSCs: release of ATP and ac-tivation of P2 receptors.”Chapter 5: “Pharmacological characterization of the recently deorphanized GRP17 receptor transfected in 1321N1 astrocytoma cells.”
••
•
•
•

Elisabetta Coppi, Purines as Transmitter Molecules: Electrophysiological Studies on Purinergic Signalling in Differ-ent Cell Systems, ISBN 978-88-8453-904-5 (print), ISBN 978-88-8453-905-2 (online) © 2008 Firenze University Press
Materialsandmethods
All animal procedures were conducted according to the European Community Guide-lines for Animal Care (DL 116/92, application of the European Communities Council Directive 86/609/EEC) and approved by the Committee for Animal Care and Experi-mental Use of the University of Florence
1. Extracellular recordings
1.1 Acute rat hippocampal slices preparation.
Male Wistar rats (Harlan Italy; Udine Italy, 150-200 g body weight) were anesthetized with ether and decapitated with a guillotine. The hippocampi were rapidly removed and placed in ice-cold oxygenated (95% O2 - 5% CO2) artificial cerebral spinal fluid (aCSF) of the following composition (mM): NaCl 124, KCl 3.33, KH2PO4 1.25, MgSO4 1.4, CaCl2 2.5, NaHCO3 25 and D-glucose 10. Slices (400 µm nominal thicknesses) were cut using a McIlwain tissue chopper (The Mickle Lab. Engineering, Co. LTD., Gom-shall, U.K.) and kept in oxygenated aCSF for at least 1 h at room temperature.
1.2 Experimental procedure
After 1 h incubation at room temperature following surgical preparation, a single slice was placed on a nylon mesh, completely submerged in a small chamber (0.8 ml) and superfused with oxygenated aCSF (30-32°C) at a constant flow rate of 1.5 ml min-1. The treated solutions reached the preparation in 60 s and this delay was taken into account in our calculations. Stimulation pulses (80 µs duration, frequency; 0.066 Hz) were de-livered through a bipolar nichrome electrode positioned in the stratum radiatum of the CA1 region of the hippocampus to stimulate the Schaffer collateral/commissural path-way. Evoked potentials were extracellularly recorded with glass microelectrodes shaped by a vertical pipette puller (David Kopf Instruments model 700C, Tujung, California, USA) from borosilicate capillaries (GC100F-15, outer diameter 1.0 mm, inner diam-eter 0.58 mm, Harvard Apparatus Ltd) filled with 150 mM NaCl. Tip resistance was 2-10 MΩ. The recording electrode was placed at the soma or at dendritic level of the CA1 region to record population spikes (PSs) or field excitatory postsynaptic poten-tials (fEPSPs), respectively. Responses were amplified (BM 622, Mangoni, Pisa, Italy), digitized (sample rate, 33.33 kHz), low-pass filtered in direct current (DC) mode at 10 kHz and stored for later analysis using LTP software facilities (version 2.30D, William W. Anderson 1991-2001).

Elisabetta Coppi48
The amplitude of the fEPSP was measured as the difference between the negative peak following the afferent fibre volley and the baseline value preceding the stimulus artefact. In some experiments both the amplitude and the initial slope of fEPSP were quantified, but since no appreciable difference between these two parameters was ob-served in control conditions, in the presence of drugs or during in vitro ischemia, only the measure of the amplitude was expressed in figures. The amplitude of PS was meas-ured as the difference between the peak negativity and the averaged values of the two peak positivities following the stimulus artefact.
When a stable baseline of evoked responses was reached, time course of fEPSP or PS amplitudes was routinely measured and expressed as the percentage of the averaged values recorded 5 minutes before the application of any treatment. In some experi-ments, we also monitored the time course of extracellular potential preceding the stim-ulus artefact in DC mode. AD appearance was recorded as a negative shift in the DC voltage induced by prolonged OGD conditions. All compounds were applied by bath superfusion, a complete exchange of solutions was reached 60 s after switching the su-perfusion, and this delay was taken into account in our time course calculation.
1.3 Protocols used
Stimulus-response curves: at the beginning of each experiment, stimulus-response curves were obtained by gradual increase in stimulus intensity till saturation of the response. The response evoked at each stimulus intensity was measured by averaging the amplitude of three consecutive fEPSPs evoked by sweeps of the same strength. The stimulus intensity was then adjusted to produce a response whose amplitude was 40 to 50% of the maximum and was kept constant throughout the experiment. In some cases, the same stimulus-response curve was repeated during the experiment, at representa-tive times after treatments, as indicated in the result session.
Paired pulse facilitation (PPF): to elicit PPF of the fEPSP pairs of stimuli were ap-plied to the Schaffer collateral/commissural fibres with a 40 ms inter-pulse interval. The synaptic facilitation was quantified as the ratio (P2/P1) between the amplitude of the fEPSP elicited by the second (P2) and the first (P1) stimuli. When applied, PPF was monitored for at least 5 minutes before, during and after the application of each drug. The effects of different drugs on PPF were evaluated by measuring the P2/P1 ratio ob-tained before, during and 10 minutes after drug application.
1.4 OGD conditions
In vitro OGD was obtained by perfusing the slice with glucose-free aCSF gassed with nitrogen (95% N2 - 5% CO2). This caused a drop in pO2 in the recording chamber from about 500 mm Hg (normoxia) to a range of 120−150 mmHg (after 2 min OGD) and of 35-75 mm Hg (after 7 minutes of OGD) (Pugliese et al., 2003), measured with an ISO2 and its associated OXEL-1 probe (WPI, Aston, U.K.). At the end of the ischemic period, slices were superfused with normal, glucose-containing, oxygenated aCSF. The effects of different OGD time duration on hippocampal slices were evaluated by monitoring the time course of fEPSP amplitude and the appearance of AD as negative shifts in the DC mode induced by OGD (Pugliese et al., 2003; Pugliese et al., 2006).
2-minute OGD protocol: A 2-minute OGD insult induces a partial and reversible depression of synaptic neurotransmission in the CA1 hippocampal region that started about 2 minutes after OGD application and fully reverts within 5 minutes from nor-

Materials and methods 49
moxic reperfusion. This short-lasting ischemic insult does not significantly change the DC amplitude. In a typical experimental day, a control slice was submitted to 2 con-secutive 2-minute OGD insults separated by 40 minutes of normoxic perfusion. The second OGD insult always produced a fEPSP depression comparable to the first one. Another slice from the same rat was then taken and submitted to the same protocol de-scribed above, but the second 2-minute OGD was carried out in the presence of differ-ent compounds, applied at least 5 minutes before, during and 5 minutes after the OGD. The effect of each drug on the OGD-induced depression of neurotransmission was ob-tained by comparing fEPSP depression induced by the second OGD insult versus that induced by the first OGD.
5-minute OGD protocol: A 5-minute OGD insult always induced a complete but re-versible depression of synaptic neurotransmission in the CA1 hippocampal region that started about 2 minutes after OGD application and lasted for about 10 minutes. This mild ischemic insult induced a reversible decrease of DC amplitude during OGD that was < 1 mV, but a sizable AD was never recorded. In a typical experimental day, a con-trol slice was submitted to a 5-minute OGD insult in control conditions. Since this in-sult always produced a maximal fEPSP depression, the effect of a 5-minute OGD insult on neurotransmission was quantified as “area under the curve” (AUC) and expressed as the time of fEPSP depression during OGD up to the recovery of the baseline poten-tial amplitude. Then, a second slice from the same rat was taken and submitted to a 5-minute OGD insult in the presence of a different compound, applied at least 5 minutes before, during and 5 minutes after the OGD. The effect of each drug on the OGD-in-duced depression of neurotransmission was obtained by comparing the AUC meas-ured in the first, control, slice with that measured in the second, treated, slice.
7-minute OGD protocol: A 7-minute OGD insult always induced a complete de-pression of synaptic neurotransmission in the CA1 hippocampal region that, in most cases, was not followed by a recovery of synaptic activity. This irreversible ischemic in-sult induced an abrupt decrease of DC amplitude with a negative shift of about 5-10 mV, interpreted as AD. In a typical experimental day, a control slice was submitted to 7 minutes of OGD. If the recovery of fEPSP amplitude after 15 minutes of reperfusion with glucose-containing and normally-oxygenated aCSF was ≤15% of the preischemic value, a second slice from the same rat was submitted to a 7-minute OGD insult in the presence of different drugs. To confirm the result obtained in the treated group, a third slice was taken from the same rat and another 7-minute OGD was performed in con-trol conditions, to verify that no difference between slices was caused by the time gap between the experiments.
2. Patch clamp recordings
Acute rat striatal slice preparation 7 day old Sprague-Dawley rats were humanely killed by decapitation using a pair of surgical scissors (RS6930, Roboz, Germany). The skin was cut along the midline with a pair of small scissors. The skull was cut along the midline with a pair of fine scissors and the skull bones were removed using fine curved forceps. Within 60 s of decapita-tion the exposed brain was submerged in a 100 ml plastic weighting boat (Fisher Sci-entific, Loughborough, UK) containing ice-cold slicing solution continuously bubbled with a mixture of O2 (95%) and CO2 (5%). Then the brain was cut along the midline with a scalpel (Nº 11, Swann-Morton, Sheffield, UK) and the cerebrum was isolated

Elisabetta Coppi50
from the rostral part of the cerebellum and caudal part of the olfactory bulb. Then the brain was removed from the skull using a fine spatula. Both brain halves were allowed to cool down for 3-5 minutes in ice-cold ACSF.
For striatal slice preparation, a flat surface was cut across the dorsal side of a half brain with a scalpel. This surface was glued, using cyanoacrylate instant adhesive (Loc-tite UK Ltd, Watchmead, Welwyn Garden City), to the tissue block of the specimen bath of a vibroslicer (DTK 1000, Dosaka; Kyoto, Japan) with the medial side of the brain facing the cutting blade. Immediately, the specimen bath was filled with oxygen-ated ice-cold slicing solution until the tissue was completely covered. Slices were cut using ceramic blades (Campden Instruments Ltd, UK) at a thickness of 300 µm. Hy-podermic needles (Monoject, Ballymoney, UK) were used to dissect out the striatum with the adjacent cerebral cortex from the rest of the brain slice. Slices were transferred into an incubation chamber (Edwards et al., 1992b) using a plastic disposable Pasteur pipette (Scientific Laboratory Supplies Ltd, Nottingham) cut to a tip opening of 3-5 mm across. The incubation chamber contained 100 ml extracellular recording solution, with additional 1 mM MgCl2 added to improve tissue viability, continuously bubbled with a mixture of O2 (95%) and CO2 (5%). Slices were incubated at room temperature (20 – 24 °C) for a period that ranged from 45 minutes to 8 hours before experimenting. Each slice was transferred in the same way to a recording chamber fitted to the stage of an upright microscope (Axioscope, Zeiss, Oberkochen, Germany).
3. Cell cultures
hMSCs. Human bone marrow cells were obtained from the iliac crest of marrow aspi-rates from healthy donors. Informed consent was obtained from all donors and the in-stitutional ethical committee approved all procedures. Details on isolation of hMSCs have been described previously (Urbani et al., 2006). Briefly, whole bone marrow as-pirate was collected and small aliquots were centrifuged for 10 minutes at 700 g; the ring of white blood cells (buffy-coat) was recovered and plated in 75 cm2 flasks (1.6x10⁵
cells/cm2) in growth medium (Iscove’s MDM) with 50 µg/ml gentamicin, 10% FBS, 2% Ultroser® G and incubated at 37°C in a humidified atmosphere containing 95% air and 5% CO2. On reaching confluence, the adherent cells were harvested with trypsin-EDTA for 5-10 min at 37°C, washed with PBS and 10% FBS and resuspended in com-plete medium (primary culture, P0). Cells were plated again at 104 cells /cm2 in 100-mm dishes (P1), for the in vitro differentiation experiments and for determination of their growth kinetics: expansion of the cells was obtained with successive cycles of trypsini-zation and reseeding.
At the first passage in culture, the morphologically homogeneous population of hMSCs was analysed for the expression of cell surface molecules using flow cytometry procedures: hMSCs, recovered from flasks by trypsin-EDTA treatment, were washed in HBSS and 10% FBS and were resuspended in flow cytometry buffer consisting of CellWASH with 2% FBS. Aliquots were incubated with the following conjugated mon-oclonal antibodies: CD34-PE, CD45-FITC, CD14-PE, CD29-PE, CD44-FITC, CD166-PE, CD90-PE, CD73-PE, HLA-DP Q R, HLA-ABC (BD Pharmingen, San Diego, CA, USA) and CD105-PE (Ancell, Bayport, MI, USA). Non-specific fluorescence and mor-phologic parameters of the cells were determined by incubation of the same cell aliq-uot with isotype-matched mouse monoclonal antibodies. Flow cytometric acquisition was performed on a FACSort (Becton Dickinson) instrument and data were analysed

Materials and methods 51
on DOT-PLOT bi-parametric diagrams using CELL QUEST software (Becton Dickin-son) on a Macintosh PC. The ability of hMSCs to differentiate among osteogenic, adi-pogenic and chondrogenic lineages was assayed, as previously described in more detail (Urbani et al., 2006) to ascertain the pluripotent differentiation potential typical of this stem cell line.
1321N1 astrocytoma cells. 1321N1 astrocytoma cells stably transfected with GPR17 were kindly provided from Department of Pharmacology, University of Milan. The cells were cultured in growth medium (DMEM) containing 10 % inactivated FBS and antibiotics (Penicillin 100U/ml/streptomycin100µg/ml-) at 37°C in a humidified at-mosphere of 95 % air 5 % CO2. When the cells had grown in culture flasks to 70%-80% confluence, they were detached with trypsin/EDTA. After centrifugation (1000 rpm for 5 minutes, RT), cells were used for patch clamp recordings.
4. Solutions
Striatal slices: for slicing procedures a modified aCSF with the following composition was used (in mM): sucrose, 206; KCl 2.5; CaCl2 1.0; MgCl2 1; NaH2PO4 1.25; NaHCO3 26; glucose 25; at pH 7.4 when bubbled with 95% O2 and 5% CO2.. During whole cell re-cordings, slices were superfused with an extracellular aCSF solution of following com-position (in mM): NaCl 125; KCl 2.5; CaCl2 1; MgCl2 1; NaH2PO4 1.25; NaHCO3 26; glucose 25; pH 7.4. The slicing and extracellular solutions were continuously gassed with a mixture of O2 (95%) and CO2 (5%) (BOC Gases, Manchester, UK). When cur-rent clamp experiments were not performed, TTX 100nM was added to the aCSF to block voltage-gated Na+ currents. In order to keep the cell as close as possible to the physiological condition in vivo, patch pipettes were filled with a potassium gluconate (KGlu) pipette solution. The composition of the internal solution was (in mM): KGlu 140; EGTA 0.2; NaCl 10; MgCl2 1; adjusted to pH 7.4 with KOH. This solution was stored at -20ºC in 1 ml aliquots. ATP 2 mM and GTP 0.5 mM were daily added to each aliquot in use and the solution maintained on ice before filling each pipette.
Cultured cells: The extracellular tyrode solution contained (mM): HEPES 5, glucose 10, NaCl 140, KCl 5.4, MgCl2 1.2, CaCl2 1.8. The pH was adjusted to 7.3 with NaOH. Standard pipette solution contained (mM): K-aspartate 110, KCl 20, Na2-ATP 5, MgCl2 2, HEPES 10, Na2-GTP 0.1, EGTA 2.75 and CaCl2 1.25. “EGTA-free” pipette solution contained K-aspartate 110, KCl 20, Na2-ATP 5, MgCl2 2, HEPES 10, Na2-GTP 0.1 and EGTA 0.05. “High EGTA” pipette solution contained: K-aspartate 110, KCl 20, Na2-ATP 5, MgCl2 2, HEPES 10, Na2-GTP 0.1, EGTA 11 and CaCl2 5. In all cases, pH was adjusted to 7.2 with KOH. In some experiments we replaced KCl with equimolar con-centrations of CsCl in both the extracellular and internal pipette solution in order to eliminate membrane K+ currents. In these cases, pH was adjusted with CsOH. For per-forated-patch experiments, pipettes were back-filled with an intracellular solution con-taining amphotericin-B (Rae et al., 1991) disolved in DMSO (30 mg/ml) and diluted to 0.12 mg/ml in standard intracellular pipette solution before recording.
5. Patch pipettes fabrication
Striatal slices. Patch pipettes were made in a vertical pipette puller (L/M-3P-A, List-Medical, Darmstadt, Germany or MF-83, Narishige, Tokyo, Japan) from thick-walled

Elisabetta Coppi52
borosilicate glass capillaries containing an internal filament (GC150F-7.5, outer diam-eter 1.5 mm, inner diameter 0.86 mm, Harvard Apparatus Ltd). The tip of the pipette was cleaned, smoothed and reduced by fire polishing on a microforge (MF-83, Nar-ishige, Tokyo, Japan) to a final resistance of 6-15 MΩ. For current clamp and single channel recordings, pipettes were coated with an insulating silicone resin (Sylgard 184® Dow Corning, USA). Pipettes were back-filled with pipette solution and the level in the pipette was kept to a minimum to reduce electrical interference produced by solution creeping up the electrode or going into the suction line.
Cultured cells. Borosilicate glass electrodes (GC150T-7.5, outer diameter 1.5 mm, inner diameter 1.17 mm, Harvard Apparatus Ltd) were pulled with a Sutter Instrument (model P-87). When pipettes were filled with the intracellular solution, tip resistance was between 2 and 3.5 MΩ.
6. Experimental procedures.
Striatal slices. The cell bodies of individual neurons in brain slices were visualised under Normaski differential interference contrast optics (Yamamoto 1975; Taka-hashi 1978; Edwards et al., 1989) using an upright microscope (Axioskop, Zeiss, Oberkochen, Germany) with an Achromat 40X water immersion objective with a numerical aperture of 0.75 and a working distance of 1.6 mm at a total magnifica-tion of 600X. Visualisation was carried out on a monochrome video monitor (VM-902K, Hitachi-Denshi, Tokyo, Japan) connected to CCD monochrome camera (RS Components, Corby, UK) mounted on top of the microscope trinocular head. Slice health was visually checked before patching and the presence of a considerable pro-portion of neurons with a smooth surface readily evident on the surface of the slice was used as an indicator of a good healthy slice. Individual healthy cells were identi-fied by the smooth appearance of their surface. Striatal medium spiny neurons were identified by their location, size and morphology (Gotz et al., 1997). Medium spiny neurons comprise approximately 90% of the striatal neurons (Jain et al., 2001), and they are about 15 µm in diameter which is about half of the interneuron’s size (Gotz et al., 1997).
Patch pipettes were positioned on an electrode holder connected to the head-stage of a patch clamp amplifier (Axopatch 200A, Axon Instruments, Foster City, CA, USA) and some positive pressure was applied to the inside of the pipette to generate a tiny stream of solution at the tip of the pipette that prevented the accumulation of debris at the tip and the mixing of the pipette solution inside the pipette with the ex-ternal solution in the recording chamber. The patch pipette was then lowered into the recording chamber. Once in solution, the pipette resistance was measured by pass-ing a 5 mV rectangular pulse through the input using the patch clamp amplifier. Po-sitioning of the patch pipette was carried out under the optic field of the microscope using a micromanipulator (Suttar) and under visual control the patch pipette was lowered further down until visual contact with the slice was made. Contact between the patch pipette and the cell was visually confirmed by the formation of a character-istic dimple on the cell surface caused by flow of solution from the pipette tip. Imme-diately, the positive pressure was released and a small and increasing amount of gen-tle suction was applied to the back of the electrode. Then the cell membrane and the tip of the electrode begin to form a high resistance gigaohm seal. This configuration was then used for cell attached single channel recordings. For whole cell recordings

Materials and methods 53
the patch pipette potential was held at -60 mV and suction was applied through the tubing connected to the back of the electrode holder to break the membrane and gain electrical access to the cell interior (Hamill et al., 1981) and then a whole cell current can be recorded. Currents were recorded using an Axopatch 200A patch-clamp am-plifier (Axon Instruments). Signals were amplified and filtered at 2 kHz (8 pole Bes-sel) and digitised at 20 kHz using an analogue-to-digital converter (CED micro 1401, Cambridge Electronics Design, UK).
Cultured cells. After enzymatic dissociation, cells were suspended in tyrode solution, transferred to a small chamber mounted on the platform of the inverted microscope (Ol-ympus CKX41), and superfused at a flow rate of 2 ml min-1 with tyrode solution. Patching procedure was then carried on as described above, with the only difference that the patch pipette potential was held at -75 mV before suction was applied to break the membrane and gain electrical access to the cell interior. Data were acquired with an Axopatch 200B amplifier (Axon Instruments, CA, USA), low pass filtered at 10 kHz, stored and analysed with pClamp 9.2 software (Axon Instruments, CA, USA).
7. Voltage clamp protocols
Striatal slices. Series resistance (Rs) and membrane capacitance (Cm) were carefully checked and compensated throughout the experiment. Only cells showing a stable Cm and Rs before, during and after drug application were included in the analysis. In or-der to reduce the voltage error due to the Rs existing in whole-cell experiments, more than 75 percent of the Rs were compensated by the Axopatch-200A before starting recordings. The voltage error can be calculated by Ohm’s law (Verr = I Rs).The average Rs before compensation from my experiments was 33 MΩ (n = 45). The holding cur-rent (Ih) was usually between +10 and – 15 pA. So originally the voltage error (Ve = Ih Rs) was -0.5 mV and reduced to -0.3 mV after 80% compensation. In contrast, during voltage-ramp experiments, the largest current measured at pipette potentials of +40 mV was 2000 pA, giving a Rs error of 66 mV or 13.2 mV after compensation. There-fore in these experiments Rs errors had little impact on the whole cell recordings.
Ramp protocols consisted of 1.8 s depolarization from -100 to +40 mV. 4 ramp pulses were applied at 20 s intervals. Sweeps were applied to cells by using WinWCP V3.4.6 software (available on line at http://spider.science.strath.ac.uk/ PhysPharm/showPage.php?page Name=software_ses). All traces shown in the present work are the average of 4 consecutive ramp episodes. When the ramps recorded in control conditions were sufficiently stable (less than 10% variation) the P2Y1 agonist, 2MeS-ADP, was superfused. Other ramp trials were adquired 3, 5 and 8 min after drug ap-plication. In some experiments different kinds of potassium channel blockers (TEA, iberiotoxin, apamin) were added to the superfusion in the presence of 2MeS-ADP, to evaluate if they were able to block the effect observed with the P2Y1 agonist. At the end of the treatment all drugs were washed out for at least 5 minutes before another trial of ramps was recorded. Current-voltage relationships were analyzed in Excel or Prism 3.02 software after each recording. Only one whole cell recording was made in each striatal slice.
Cultured cells. Membrane resistance was measured with fast hyperpolarizing volt-age pulses (from -70 to -75 mV, 40 ms duration). Rs and Cm were routinely checked and compensated during the experiment. Only cells showing a stable Cm and Rs before, dur-ing and after drug application were included in the analysis.

Elisabetta Coppi54
In order to study the effects on membrane currents evoked by the application of P2 agonists and antagonists in cultured cells (hMSCs and 1321N1 cells) we used two dif-ferent protocols:
A voltage ramp protocol, consisting of a 1500 ms depolarization (from -90 to +40 mV) from a holding potential of -75 mV, was used to evoke a wide range of overall non-specific voltage-dependent ionic currents. Each trace shown in the figures is the average of 5 consecutive episodes. A voltage step protocol was used to specifically generate outward currents. It con-sists of 16 consecutive steps (10 mV each, 1800 ms duration, -80 mV holding po-tential) starting from a -70 mV membrane potential to a +80 mV value. In these conditions the current amplitude was measured at the peak. A variation of this pro-tocol was used to selectively block transient outward currents and consisted of a se-ries of 10 consecutive depolarizing steps (10 mV each, 1800 ms duration, -40 mV holding potential) starting from -30 mV membrane potential to +60 mV. The val-ues of currents were measured at the steady state. Only one cell was recorded from each Petri dish where cells were cultured.
8. Current clamp experiments.
Striatal slices. Current clamp recordings were performed with the WinWCP program in a TTX-free extracellular solution with sylgard-covered pipettes to reduce the noise level. After a stable whole cell configuration was reached in the voltage clamp mode with the standard procedure already described, the amplifier was switched to the “nor-mal I-clamp” mode and, when necessary, a little negative or positive current was in-jected (5-10 pA) to obtain an holding potential of -70 mV. Ten steps of positive current injection (10 pA each) were imposed in control conditions, at 20 s intervals. The first step amplitude was chosen on the basis of each single cell recorded, to obtain both sub-threshold and suprathreshold responses (from 2 to 50 pA). After 5 minutes application of 2MeS-ADP the same stimulation protocol was applied to the cell. If the cell was still available, a last recording was made after 5 minutes wash out.
Current clamp recordings were made by depolarizing current injection using the program WinWCP (V3.4.6) to determine the membrane current injection and to record membrane potentials. All data from each step episode were transferred to Excel to be analyzed. The frequency of action potential firing was measured as the number of action potentials/second. The amplitude of action potentials was calculated as the dif-ference between the peak reached by the overshoot and the voltage reached by the step stimulation. The rate of depolarization and hyperpolarization of action potentials was measured as the first derivative of membrane potential over time (mV/ms). The thresh-old value for firing was taken as the point at which the derivative described before was ≥ 30 mV/ms. The action potential width was measured as the difference between the time of reaching the threshold during the rising phase and the time when the repolar-izing potential crossed the threshold value again. The medium afterhyperpolarization potential (mAHP) was measured as the difference between the minimum potential reached after the action potential peak and the voltage reached by the step stimulation. No slow afterhyperpolarization potential (sAHP) after the end of the step was recorded in any cell investigated. The latency of the first action potential was determined as the time point where the first threshold to fire was reached. The inter-spike interval (ISI) between the first-second and the second-third action potentials were measured as the
•
•

Materials and methods 55
difference between the times at the peak of the two events. Spike-frequency adaptation during repetitive firing was measured by dividing the latency between the first-sec-ond action potential and the latency between the second-third action potential. Values around 1 showed no spike frequency adaptation.
9. Measurement of ATP release from hMSCs
ATP in the cell supernatant was analyzed by the ATPLite-M Kit (Perkin-Elmer, Life and Analytical Sciences, Boston, MA, USA) according to a previously described meth-od (Melani et al., 2005). The luminescence was measured on the PerkinElmer Top-Count luminescence counter (TopCount Packard Instruments, Perkin-Elmer). In pre-vious experiments we found that ATP levels measured in the supernatant collected after plating human astrocytoma cells (ADF1) decrease steadily over time, attaining a baseline in the low nanomolar range between 3 and 5 h thereafter and remain un-changed for up to 24 h (data not shown). High ATP release measured soon after cell plating is in agreement with previous work and is attributed to “medium change” that is a mechanical stimulation (Lazarowski et al., 2000). For this reason, hMSCs were plated onto a 24-well microplate at a density of 50,000 cells/well and incubated for 24 h be-fore ATP assay. After 24 h, a sample of extracellular medium (50 µl) was collected from each well and placed in a white 96-well microplate. The same volume of the substrate solution (50 µl) was added to each sample. Standard solutions of ATP (from 10-7 to 10-
11 M) were run in parallel in the same microplate following an identical procedure to that of the samples.
The ATP values were extrapolated from the linear regression curve calculated on the basis of standard solutions and expressed in absolute values (nM).
10. Chemicals
All compounds were applied by bath superfusion by a multi-way gravity system for pe-riods indicated in the result section. In general, antagonists were applied for 15-30 min-utes and were always superfused before agonists when co-application was performed. In all cases, a stable response (at least 5 minutes) was achieved before the time points used for measurements. Enzymatic inhibitors were applied for at least 20 minutes, and results were compared with incubated slices (1h 30’) to confirm that a complete block of enzymatic activity was obtained. Agonist and antagonist concentrations were calcu-lated on the basis of Ki values reported in binding studies in the literature by using the Hill-Langmur equation or Gaddum equation as appropriate (80% receptor activation for agonists and 95% inhibition for antagonists).
DPCPX was dissolved in dimethylsulphoxide (DMSO) and stock solutions were made to obtain concentrations of DMSO lower than 0.001% in the superfusing aCSF. Control experiments, carried out in parallel, showed that this concentration of DMSO did not affect CA1 hippocampal neurotransmission.
All the A3 adenosine receptor antagonists used in our experiments were applied 5, 10 or 20 minutes before, during OGD and 5 min after the end of ischemic episode, as indicated in the result section. The concentration used for each of the selective ad-enosine A3 receptor antagonists was chosen on the basis of Ki values on rat or human A3 receptors. MRS 1523, among all A3 antagonists used in our experiments, is the

Elisabetta Coppi56
most potent and selective antagonist for the rat A3 receptors actually available com-mercially (Ki value of 113 nM; Li et al., 1998; Muller 2003). MRS 1220 is a highly po-tent antagonist at human A3 receptor (Ki value of 0.65 nM) but presents a lower affin-ity for the rat isoform (Kim et al., 1996). VUF 5574 is another potent ligand at human but not at rat A3 receptor, showing a Ki value of 4 nM and being at least 2500-fold selective versus human A1 and A2A receptors (Muijlwijk-Koezen et al., 2000). Simi-
P1 ligands
class Acronym Chemical name purchasing
A1 antagonist DPCPX 8-cyclopentyl-1,3-dipropylx-anthine
Research Biochemicals International (Natik,
MA, U.S.A.)
A3 antagonists
MRS 1523
3-propyl-6-ethyl-5[(ethylthio)carbonyl]-2-phe-nyl-4-propyl-3-pyridinecar-
boxylate
Sigma (Milano, Italy)
MRS 1220
N-[9-Chloro-2-(2-fura-nyl)[1,2,4]-triazolo[1,5-
c]quinazolin-5-yl]benzene acetamide
Tocris (Bristol, U.K.)
VUF 5574(N-(2-methoxyphenyl)-N’-[2-
(3-pyrindinyl)-4-quinazolinyl]-urea)
Tocris (Bristol, U.K.)
WSAB
5-[[(4-pyridyl)amino]carbonyl]amino-8-methyl-2-(2-fu-
ryl)-pyrazolo[4,3-e]1,2,4-triazolo[1,5-c]pyrimidine
hydrochloride
Kindly provided by Dr. G. Spalluto, University
of Trieste, Italy
class Acronym Chemical name purchasing
A3 agonists
Cl-IB-MECA
1-[2-chloro-6[[(3-iodophenyl)methyl]amino]-
9H-purin-9-yl]-1-deoxy-N-me-thyl-ß-D-ribofuranuronamide
Tocris (Bristol, U.K.)
AR132, N6-methyl-2-phenylethynylad-enosine
Kindly provided by the University of Cameri-
no, Italy
VT72 , N6-methoxy-2-phenylethyny-ladenosine
VT158, N6-methoxy-2-phenylethynyl-5’-N-methylcarboxamidoad-
enosine
VT160 N6-methoxy-2-(2-pyridinyl)-
ethynyl-5’-N-methylcarboxam-idoadenosine
VT163N6-methoxy-2-p-acetylphe-
nylethynyl-5’-N-methylcarbox-amidoadenosine

Materials and methods 57
larly, the recently synthesized A3 antagonist WASB present a very high affinity for the human A3 receptor (Ki of 0.01 nM, see: Maconi et al., 2002). MRS 1523, MRS 1220 and VUF 5574 were dissolved in DMSO. The hydrophilic A3 antagonist WSAB was dissolved in distilled water. All the selective adenosine A3 receptor agonists, Cl-IB-MECA, AR132, VT72, VT158, VT160 and VT163 were applied 5 min before, during OGD and 2 minutes after OGD (referred to as “long” application in results section) or for only 2 minutes during OGD (referred to as “short” application in results sec-tion). Ki taken from radioligand and functional studies for Cl-IB-MECA are 0.33 and 11.1 nM on rat and human membranes respectively (Muller 2003). The compound has been described as highly selective for A3 adenosine receptors versus A1 recep-tors (Ki of 820 nM) and A2A receptors (Ki of 470 nM) in rat brain membranes (Kim et al., 1996). When Cl-IB-MECA and the A3 antagonist MRS 1523 were co-applied, the antagonist was always superfused 5 min before the combination of the two drugs. Ki values for the new A3 agonists synthesized by Camerino: AR132, VT72, VT 158, VT160 and VT163, are taken from binding experiments in CHO cells stably trans-fected with human recombinant A3 receptors. The compounds have been reported as highly selective for A3 adenosine receptors versus A1 receptors and A2A receptors: AR 132, A3 Ki of 3.4 nM and A3 selectivity versus A1 of 500 and versus A2A of 2,500: (Volpini et al., 2002); VT 72, A3 Ki of 3.8 nM and A3 selectivity versus A1 of 320 and versus A2A of 1,100 (Dal Ben et al., 2006; Volpini et al., 2005); VT 158, A3 Ki of 1.9
P2 ligands
Acronym Chemical name purchasing
Non-selective P2 agonists
ATP adenosine 5’ triphosphate Sigma (Milano, Italy)
ATPγS adenosine 5’-O-(3-thiotriphosphate) Sigma (Milano, Italy)
P2Y1 agonist 2meS-ADP 2-(Methylthio) adenosine 5’ di-phosphate trisodium salt
Sigma (St. Louis, MO, USA)
P2 non-selective antagonists
Suramin Tocris (Bristol, U.K.)
PPADSpyridoxalphosphate-6-azophe-nyl-2’,4’-disulfonic acid tetraso-
dium saltTocris (Bristol, U.K.)
P2X7 antagonist BBG Brilliant Blue G Sigma (Milano, Italy)
P2Y1 antagonist MRS 21792’-deoxy-N6-methyladenosine
3’,5’-bisphosphate tetraammoni-um salt
Tocris (Bristol, U.K.)
NTPDase inhibitors
ARL 67156
6-N,N-diethyl-D-β,γ-dibro-momethylene ATP), suramin (8-(3-benzamido-4-methylbenzamido)naphthalene-1,3,5-trisulfonic
acid
Tocris (Bristol, U.K.)
BGO 136 1-hydroxynaphthlene-3,6-disul-fonic acid Sigma (Milano, Italy)
PV4hexapotassium dihydrogen monoti
tanoundecatungstocobaltate(II) tridecahydrate
Kindly provided from Prof. Müller, Universi-ty of Bonn, Germany

Elisabetta Coppi58
nM and A3 selectivity versus A1 of 4,800 and versus A2A of 8,600 (Dal Ben et al., 2006; Volpini et al., 2005); VT 160, A3 Ki of 1.1 nM and A3 selectivity versus A1 of 3,600 and versus A2A of 16,400; VT 163: (Volpini et al., 2006), A3 Ki of 2.5 nM and A3 selectivity versus A1 of 21,500 and versus A2A of 4,200).
Under normoxic conditions, ATP and its metabolically stable analogue ATPγS were perfused for 10 minutes, a time that allowed us to record a stable response to the compounds. Concentrations were chosen on the basis of Ki values obtained in ligand binding studies from rat membranes (see: Khakh et al., 2001 for P2X receptors and: von Kugelgen 2006 for P2Y receptors). The concentration of the P2Y1 selective agonist, 2MeS-ADP, was chosen on the basis of ligand binding studies from Gao and colleagues (Gao et al., 2004) that reported a Ki value of 57 nM in astrocytoma cells.
The P2 purinergic antagonists suramin, PPADS, MRS 2179 and BBG were applied 10 or 15 minutes before, during, and 5 minutes after the application of P2 agonists or the induction of OGD. Suramin is a non-specific and non-competitive antagonist of P2 purinergic receptors (either P2X or P2Y). It also inhibits ecto-nucleotidases activ-ity (Iqbal et al., 2005) and affects glutamatergic and GABAergic receptor activation in rat hippocampal slices (Nakazawa et al., 1995). PPADS is a non-selective antagonist at both P2Y and P2X (excluding P2X7) receptors and is the compound most used to block P2 purinergic receptor activation (Lammer et al., 2006; Ralevic and Burnstock, 1998). Ki values for suramin and PPADS were chosen on the basis of data in the lit-erature (for a review see: von Kugelgen 2006). BBG is a selective P2X7 receptor an-tagonist in the low nanomolar range, with no detectable activity on other P2X recep-tor subtypes at concentrations below 10 µM (Jiang et al., 2000a). The concentration of the P2Y1 selective antagonist MRS 2179 was chosen on the basis of Kb=177 nM reported by Moro and co-workers (Boyer et al., 1998; Camaioni et al., 1998; Moro et al., 1998).
Ecto-ATPases (NTPDase1, 2 and 3) are responsible for the degradation of extracel-lular ATP (Zimmermann, 2000). In the present work, 3 different ecto-ATPase inhibi-tors were tested: ARL 67156, BGO 136 and PV4. ARL 67156, a commonly used ecto-ATPase inhibitor (Crack et al., 1995), was superfused at a concentration of 50 µM, 20 minutes before and during ATP or ATPγS application, in accordance with previous data in the literature (Pascual et al., 2005; Safiulina et al., 2005). However, it has been recently shown that, at micromolar concentrations, ARL 67156 only inhibits rat NTP-Dase1 and 3 transiently transfected in Chinese Hamster Ovary (CHO) cells, showing negligible activity on NTPDase2 (Iqbal et al., 2005). In addition, a possible interaction of this ATP analogue with some P2Y receptors have been suggested (Drakulich et al., 2004). BGO 136 is a new ecto-ATPase inhibitor recently available in commerce. From the few data existing in the literature at present, this compound is described as a selec-tive NTPDase1 and 2 blocker with Ki values in the high micromolar range (Kukulski et al., 2003), being ineffective at concentrations below 5 mM (Duval et al., 2003 and our unpublished observation). PV4 is a recently synthesized compound (not available commercially) that belongs to a new class of ecto-ATPase inhibitors: the polyoxotung-states (Muller et al., 2006). PV4 strongly inhibits rat NTPDase1, 2 and 3 with Ki values in the nanomolar range (Muller et al., 2006). Its high affinity for these enzymes renders it a useful tool (the best one available at present) to inhibit extracellular ATP catabo-lism without interfering with P2Y receptors, at least at 10 µM concentrations (Muller et al., 2006). Since no data are available at present about the application of BGO 136 or PV4 to brain slices, for similarity with ARL 67156 we superfused these compounds 20 minutes before ATP application. In some cases hippocampal slices were preincubated

Materials and methods 59
in the presence of the ecto-ATPase inhibitors 1h before starting the experiment, but since no significant difference was found with non-incubated slices, the results were pooled together.
All the P2 agonists, antagonists and NTPDase inhibitors (excepted BGO 136) were dissolved in distilled water and stock solutions at 100-10,000 times the desired final concentration, stored at -20°C and dissolved in aCSF at the final concentration imme-diately before slice superfusion. Since BGO 136 was applied at mM concentration, it was directly dissolved in the aCSF before slice superfusion.
GPR17 ligands
Acronym Chemical name purchasing
Uridine-agonistsUDP-glucose
Kindly provided by Prof. Abbracchio,
University of Milan, Italy
UDP-galactoseUDP uridine 5’ diphsphate
CysLT-agonist LTD4
antagonistsMRS 2179
2’-deoxy-N6-methylade-nosine 3’,5’-bisphosphate
tetraammonium saltMontelukastPranlukast
Toxins
Acronym purchasingTTX tetrototoxin Nav channels blocker Alomone labs
TEA Tetraethyl ammonium Kv channels blocked Sigma (St. Louis, MO,
USA)
Ibtx Iberiotoxin BK channels blocker Sigma (St. Louis, MO, USA)
Apa Apamin SK channels blocker Sigma (St. Louis, MO, USA)
PTX Pertussis toxin Protein Gi blocker Sigma (Milan, Italy)
When Nav channel block was required, TTX was added directly in the extracellular solution and perfused throughout the experiment. TEA was applied at a concentration of 200 µM estimated to selectively block about 80 % of BK channels (Blatz et al., 1984). Apamin and iberiotoxin concentrations were chosen on the basis of previous works showing a maximal block of SK and BK channels (respectively) at 10 nM for both tox-ins in rat striatum (Bargas et al., 1999; Nisenbaum et al., 1996). PTX pre-treatment was conducted in a group of 1321N1 transfected cells, which were incubated for 18 h with PTX (100 ng/ml) before enzymatic dissociation and subsequent electrophysiological recordings.

Elisabetta Coppi60
Pipette solution component
Acronym Chemical name purchasing
EGTA ethylene glycol-bis(β-aminoethyl ether)N,N,N’,N’-tetracetic acid Sigma (Milano, Italy)
Amphotericin B Sigma (Milano, Italy)
Na2-GTP guanosine 5’ triphosphate disodium salt Sigma (Milano, Italy)
Na2-ATP adenosine 5’ triphosphate disodium salt Sigma (Milano, Italy)
Hepes Hepes sodium salt Sigma (Milano, Italy)
hMSCs culture medium
compound purchasingPBS (phosphate buffer solution) GIBCO, Invitrogen, UK
IMDM (Iscove’s Modified Dulbecco’s Medium with L-
glutamine and Hepes 25 mM)EuroClone, Milan, Italy
FBS (fetal bovine serum) HyClone, South Logan, Utah, USAgentamicin Schering-Plough S.p.A., Milan ItalyUltroser® G Pall Biosepra SA, Cergy-Saint-Christophe, France
Trypsin-EDTA (0.05% trypsin-0.02% EDTA) (Eurobio, Courtaboeuf Cedex B, France
CellWASH (0.1% sodium azide in PBS) Becton Dickinson, San Jose, CA, USA
Ancell, Bayport, MI, USA
1321N1 culture medium
compound purchasingPBS (phosphate buffer solution) GIBCO, Invitrogen, UK
DMEM (Dulbecco’s modified Eagle’s medium high glucose) EuroClone, Milan, Italy
FBS (fetal bovine serum) EuroClone, Milan, ItalyP/S (penicillin
100U/ml/streptomycin100µg/ml) EuroClone, Milan, Italy
L-glutamine EuroClone, Milan, ItalyNa-piruvate GIBCO, Invitrogen, UK
Trypsin/EDTA GIBCO, Invitrogen, UKgeneticin GIBCO, Invitrogen, UK

Materials and methods 61
11. Statistical analysis
Data were analyzed using Prism 3.02 software (Graphpad Software, San Diego, CA, U.S.A.) and expressed as the mean ± s.e. Data were tested for statistical significance with the paired two-tailed Student’s t test or by analysis of variance (one-way ANOVA), as appropriate followed by Newman-Keuls multiple comparison test. Where indicated, two-tailed Mann-Whitney test was used. In all cases, a value of P<0.05 was considered significant.


RESULTSSection 1
ROLE OF PURINES IN CA1 HIPPOCAMPAL NEUROTRANSMISSION UNDER NORMOXIC CONDITIONS AND DURING OGD. EXTRACELLULAR
RECORDINGS FROM RAT HIPPOCAMPAL SLICES


Elisabetta Coppi, Purines as Transmitter Molecules: Electrophysiological Studies on Purinergic Signalling in Differ-ent Cell Systems, ISBN 978-88-8453-904-5 (print), ISBN 978-88-8453-905-2 (online) © 2008 Firenze University Press
Chapter1RoleofA3adenosinereceptorsduringOGD
1. Historical background
Adenosine concentration drastically rises during ischemic brain damage, reaching mi-cromolar levels that are sufficient to activate all P1 receptors, also the “low affinity” A3 subtype (Latini et al., 2001). Even though the protective role mediated by A1 receptor activation during such insults has been largely demonstrated, the effects of A3 recep-tor stimulation are still unclear. In fact, evidence for both protective and deleterious effects due to A3 receptor stimulation are described in the literature (for a review see: von Lubitz 1999). Likewise, controversial evidence exists about the effect of A3 receptor stimulation on neurotransmission under normoxic conditions, as already mentioned in the introduction. In fact, both inhibitory (Brand et al., 2001) and facilitatory effect (Costenla et al., 2001; Dunwiddie et al., 1997a; Fleming et al., 1997; Laudadio et al., 2004; Macek et al., 1998) have been described in the brain, which might sustain , re-spectively, a protective or a deleterious role of A3 receptors during ischemia.
A protective role of adenosine A3 receptors during cerebral ischemia has been dem-onstrated in A3 KO mice, that present an increased neurodegeneration in response to repeated episodes of mild hypoxia (Fedorova et al., 2003). In addition, Hentschel and co-workers (Hentschel et al., 2003) demonstrate that, in rat cortical neurones, the se-lective activation of adenosine A3 receptors during hypoxia is involved in the inhibition of excitatory neurotransmission, suggesting that A3 receptor stimulation contributes to the neuroprotective role of adenosine brought about by A1 receptor activation. Simi-larly, at a cardiac level, most evidence indicates that A3 receptors are involved in protec-tion of the ischemic heart (Fredholm et al., 2005).
On the other hand, a deleterious role of A3 receptors during ischemia has also been proposed. Previous work in my laboratory demonstrated that the selective block of A3 receptors during ischemic preconditioning limits the beneficial effects of that treat-ment on fEPSP recovery following a subsequent severe OGD insult in rat hippocampal slices (Pugliese et al., 2003). In agreement, Von Lubitz and co-workers demonstrated that acute A3 receptor stimulation exacerbates the damage caused by a concomitant ischemic episode in vivo (von Lubitz et al., 1994). Nevertheless, the same study reports that chronic pre-ischemic administration of A3 agonist elicits opposite effects, reducing cerebral damage against ischemic insults (von Lubitz et al., 1994). This effect may be at-tributed to a desensitization of A3 receptors. In fact, both human and rat A3 receptors are desensitized and internalized within a few minutes after agonist exposure (Fergu-son et al., 2000; Palmer et al., 1995 and 2000; Trincavelli et al., 2000; 2002 and 2002b). Altogether, these data suggest that the outcome of A3 receptor stimulation on synaptic transmission during hypoxic/ischemic phenomena is intricately related to the intensity and duration of receptor activation.

Elisabetta Coppi66
In the present work we used selective A3 receptor agonists and antagonists to inves-tigate the role of A3 adenosine receptors on synaptic transmission, extracellularly re-corded in the CA1 region of rat hippocampal slices, during brief, mild or severe OGD episodes. These insults are aimed at reproducing, in vitro, the consequences of blood flow interruption following cardiac arrest or occlusion of intracranial vessels.
2. Results
2.1 Experiments were performed on a total of 219 slices taken from 133 rats
2.1.1 The selective block of A3 adenosine receptors by MRS 1523 reduces fEPSP depression evoked by a 2-minute OGD insult and induces a faster recovery of fEPSP amplitude after a 5-minute OGD.
Figure 12 shows that periods of 2 or 5 minutes of OGD induce, respectively, a partial or complete reduction of synaptic potential amplitude that was always reversible upon reperfusion with normal oxygenated aCSF. These results are in agreement with our pre-vious studies (Latini et al., 1999a and 1999b; Pugliese et al., 2003).
The application of 2 minutes of OGD resulted in a partial but consistent depression of synaptic potentials, reaching a maximal inhibition of 76.3±4.2% (n=13, P<0.001, paired two-tailed Student’s t test vs pre-ischemic baseline) a few seconds after reperfusion with normal oxygenated aCSF (figure 12A). After 2 minutes of reperfusion in normal, glu-cose-containing aCSF, fEPSPs progressively reappeared and reached a complete recovery within 5 minutes from the beginning of reperfusion. The application of a second 2-min-ute OGD insult, 40 minutes after the end of the first one, resulted in a similar depression of fEPSP amplitude (66.4±6.2%, n=13), with the same time-course. No significant differ-ence was found by comparing synaptic potential amplitude at any time during the first and second OGD (figure 12A, P>0.05, paired two-tailed Student’s t test). Therefore the ef-fects of the A3 selective antagonist MRS 1523 on fEPSPs were evaluated before and during the second 2-minute OGD insult in comparison with the first one (figure 12B). MRS 1523 (100 nM, n=10) applied 10 minutes before, during OGD and 5 minutes thereafter, did not modify the fEPSP amplitude in normoxic conditions but significantly inhibited the
fEPSP amplitude depression evoked by a 2-minute OGD (74.1±6.1% in control and 34±10% in the presence of the antagonist; P<0.05, paired two-tailed Student’s t test , fig-ure 12B). The effect of 100 nM MRS 1523 was maximal, since increasing the antagonist concentration to 1 µM did not potentiate the effect (data not shown).
Application of 5 minutes of OGD resulted in a complete depression of synaptic po-tentials within 4 minutes after OGD initiation (n=12, figure 12C). After 3.5 minutes of reperfusion in normal, glucose-containing aCSF, fEPSPs progressively reappeared and reached a complete recovery within 10 minutes of normoxic reperfusion. Since it has been demonstrated that a second 5-minute OGD episode, 50 minutes after the end of the first one, is followed by an appreciably faster recovery of fEPSPs (Latini et al., 1999a and 1999b), the effect of the selective A3 antagonist was studied in a separate group of slices. MRS 1523 (100 nM, n=7), applied 10 minutes before, during and 5 minutes after OGD application, induced a faster fEPSP recovery (AUC: 10.1±0.5 in control and 7.1±0.7 in the presence of the antagonist; P<0.05, one-way ANOVA, Newman-Keuls multiple compari-son post-hoc test, see also figure 18C) measured from the beginning of fEPSP depression during OGD up to the recovery of synaptic potentials to the baseline value (figure 12C).

Role of A3 adenosine receptors during OGD 67
Figure 12. The selective A3 adenosine receptor antagonist MRS 1523 reduces fEPSP depression in-duced by a 2-minute OGD episode and induces a faster fEPSP recovery after a 5-minute OGD. Data (mean ± s.e.) are expressed as percent of baseline values. A. Averaged time-course (n=10) of fEPSP amplitude before, during and after the application of two consecutive ischemic insults of 2 minutes duration. The second 2-minute OGD, administered 40 minutes after the end of the first period, elicited a comparable depression of synaptic potentials (P>0.05, paired Student’s t test). B. The same protocol as before carried out in the presence of MRS 1523. MRS (100 nM) applied 10 minutes before, during and 5 minutes after the second 2-minute OGD, as indicated by the open bar. Note that, in the presence of MRS 1523, the fEPSP depression induced by OGD was signifi-cantly reduced (P<0.05, paired Student’s t test) in comparison to that obtained in the absence of the drug. C. Time-course of fEPSP amplitude changes elicited by a 5-minute OGD insult in the ab-sence and in the presence of 100 nM MRS 1523. The A3 antagonist, applied 10 minutes before, dur-ing and 5 minutes after OGD application, induced a faster fEPSP recovery after OGD application.
2.1.2 Selective block of A3 adenosine receptors prevents irreversible impairment of neurotransmission induced by a 7-minute OGD episode.
In a first series of experiments we characterised the response of synaptic excitatory transmission to 7 minutes OGD, an ischemia-like insult that in our experimental con-ditions has been shown to consistently produce an irreversible loss of synaptic transmis-sion, but to be sensitive to the protective effects of ischemic preconditioning (Pugliese et al., 2003).

Elisabetta Coppi68
Figure 13A illustrates the effects of 7 minutes OGD on the amplitude of synaptic responses evoked by the stimulation of CA1 stratum radiatum and recorded from the apical dendritic region of pyramidal cells. One 7-minute OGD episode induced the disappearance of the fEPSP, which did not recover after prolonged superfusion with oxygenated, glucose-containing aCSF (up to 80 minutes, n=7; not shown). The effect of 7 minutes OGD on the fEPSP was similar in 42 slices examined and the mean re-covery of fEPSP amplitude, after a 7minute OGD episode, was 5±1%, n=42 (see also Figure 15).
The presence of selective adenosine A3 receptor antagonists prevented the irrevers-ible disappearance of synaptic potentials induced by 7 minutes of OGD. Thus, in the presence of MRS 1523 (100 nM, figure 13B), a total recovery of synaptic response was observed within 10 minutes from OGD interruption. The mean recovery of fEPSP am-plitude after 7 minutes of OGD in the presence of 100 nM MRS 1523, was 83 ± 6%, (n=17, Figure 14B and 15A). Furthermore, when compared to those obtained in con-trol conditions, in MRS 1523 treated slices the transient recovery of the fEPSP ampli-tude was delayed and the afferent fibre volley did not disappear at the end of the 7-minute OGD (figure 13B, trace 2, see also table 7)
Table 7. Treatment with MRS 1523 produces a delay in the effects of OGD in the CA1 region of hippocampal slices.
ControlMRS 1523
(n) (n)Initial fEPSP disappearance time (s)
(50/50) 177.9± 7.2 (41/41) 254.3± 10.9 P<0.0001
Transient fEPSP recovery peak time (s)
(31/50) 357 ± 17 (34/41) 480 ± 18 P<0.0001
Transient fEPSP recovery duration (s)
(31/50) 59 ± 7 (34/41) 46 ± 7 P=0.0948
Transient fEPSP recovery amplitude (%)
(31/50) 18.0 ± 3.3 (34/41) 15.5 ± 2.4 P=0.4265
Fibre volley disappearance time (s)
(34/50) 372 ± 18 (19/41)§ 501 ± 26 P<0.0001
AD peak time (s) (20/20) 436 ± 17 (22/33)# 520 ± 23 P=0.0017
Data are from slices receiving 7 or 30 minutes of OGD in control (n=50) and 7, 8, 9, 10 or 30 minutes of OGD in the presence of 100 nM MRS 1523 (n=41). Numbers in parentheses (n/n) indicate number of observations out of investigated slices. Time is calculated from OGD initia-tion. The amplitude of the transient fEPSP recovery is expressed as per cent of baseline fEPSP recorded before OGD application. Statistical significance was assessed with Mann-Whitney test. § Fibre volley did not disappear in any of the slices receiving a 7-minute OGD insult in the pres-ence of MRS 1523. # AD was absent in 11 slices receiving 7 or 8 minutes of OGD in the pres-ence of MRS 1523.

Role of A3 adenosine receptors during OGD 69
Figure 13. The A3 adenosine receptor antagonist MRS 1523 protects hippocampal slices from ir-reversible fEPSP depression induced by 7 minutes of OGD. (A,B) Graphs: typical time courses of changes in fEPSP amplitude evoked by 7-minute OGD episodes (solid bar) in control (A) or in the presence of 100 nM MRS 1523 (B). Each point represents fEPSP amplitude expressed as percent of the mean baseline responses recorded before OGD application. Note the transient reappearance of synaptic potential during OGD (arrowheads) in A and B. Upper traces: fEPSP recordings taken at the times indicated by numbers in the corresponding graph. Note that after reperfusion in normal oxygenated aCSF, only the afferent volley recovered in controls, while a recovery of 77% was ob-served at the end of MRS 1523 application in normoxic conditions. A total recovery of fEPSP after 15 minutes of reperfusion in normal oxygenated aCSF was found in MRS 1523 (trace 3).
In a subset of experiments, we investigated the effects of 100 nM MRS 1523 on AD by comparing the time of peak and the magnitude of depolarising DC shifts caused by a 7-minute OGD insult in treated slices and in matched control slices from the same rats. As illustrated in figure 14A, in control conditions, 7-minute OGD episodes always caused AD, recorded as negative DC shifts, with a mean peak latency of about 6.5 min-utes (390 ± 20 s) from the beginning of ischemia and a peak amplitude of 8.9 ± 0.6 mV (n=8). The duration of DC shifts was variable (range 5-15 minutes) and was always ac-companied by complete and irreversible disappearance of synaptic transmission.
In the presence of MRS 1523 (100 nM, n=8), AD was virtually absent in 7 out of 8 preparations and, as shown in figure 14B, the mean recovery of potential amplitude was significantly greater than in control slices taken from the same rats (MRS 1523: 85.8 ± 13.3 %, n=8 vs control: 3.3 ± 2.5 %; P<0.001). Interestingly, in one experiment in which a sizeable AD (peak amplitude: -7.6 mV) was recorded, the recovery from OGD-evoked impairment in neurotransmission was only 22%. The overall effect of A3 antagonism on fEPSP recovery after 7 minutes of OGD, compared with that observed in control preparations, is summarised in figure 14B. As illustrated by the frequency histogram, 39 out of 45 slices treated with any of the A3 antagonists at effective concen-trations (all except 0.1 nM MRS 1523), had a substantial (> 50%) recovery of fEPSP am-plitude after 7-minute OGD episodes, while synaptic activity in controls (n=42) never recovered beyond 20% of responses recorded before OGD.
The protective effect of MRS 1523 on OGD-evoked irreversible depression of fEP-SPs was detectable at concentrations as low as 0.1 nM and the recovery of fEPSP ampli-

Elisabetta Coppi70
tude became statistically significant with concentrations of 1-100 nM of the antagonist (figure 15A). The apparent EC50 value for MRS 1523 was 0.25 nM (95% C.L. 0.05-1.2 nM). However, since within the time of the antagonist application (10-20 minutes) the drug might not have reached equilibrium at the receptor level in slices, the EC50 value is likely to be underestimated. Similar beneficial effects on the recovery of fEPSPs from 7 minutes of OGD were exerted by the selective adenosine A3 receptor antagonists MRS 1220, VUF 5574 and WSAB, all chemically different from MRS 1523 (Kim et al., 1996; Maconi et al., 2002; Muijlwijk-Koezen et al., 2000). As shown in figure 15A, all A3 an-tagonists prevented synaptic impairment and allowed for complete synaptic recovery within 15 minutes from OGD interruption. In addition, all compounds prevented or significantly delayed AD appearance after the 7 minute OGD insult (not shown).
Figure 14. The A3 adenosine receptor antagonist MRS 1523 minimises AD and protects CA1 hippocampus from irreversible fEPSP depression induced by a 7-minute OGD insult. A. AD was recorded as the negative DC shift in response to 7 minutes of OGD in control conditions (n=8) and in the presence of 100 nM MRS 1523 (open bar, n=8). MRS 1523 significantly prevented AD in 7 out of 8 slices. B. Graph shows the time-course of a 7-minute OGD effect on fEPSP ampli-tude, expressed as percent of baseline, in control aCSF (filled circles) and in the presence of 100 nM MRS 1523 (unfilled circles). Data are expressed as mean ± s.e. Note that in the presence of the A3 antagonist the time-course of fEPSPs depression during OGD was significantly delayed (see table 7) in comparison to corresponding times in the absence of the drug (control slices).

Role of A3 adenosine receptors during OGD 71
2.1.3 The selective block of A3 adenosine receptors delays the effects of prolonged OGD application on synaptic transmission.
In the experiments performed with 7 minutes of OGD, the inhibitory effect of A3 an-tagonists on the development of AD seemed to be related to the significant recovery of fEPSP amplitude induced by these drugs. Furthermore, as illustrated in Figures 13 and 14, OGD episodes produced a typical sequence of neurophysiological effects that followed the initial disappearance of fEPSP and that comprised a transient recovery of fEPSP response, the disappearance of the afferent fibre volley and the development of an AD. All these phenomena were significantly delayed and/or reduced in the presence of A3 receptor antagonists, as shown in table 7, where the effects of 100 nM MRS 1523 on OGD of different duration are summarised. The possible correlation of these effects of A3 receptor antagonists with the recovery of the fEPSP after OGD interruption and the time window in which A3 receptor block may play a role in limiting the deleterious effects of severe ischemia were investigated by applying OGD episodes longer than 7 minutes. To delimit the time window in which A3 antagonists could delay the appear-ance of AD, we applied 30 minutes of OGD in the presence of 100 nM MRS 1523 (fig-ure 16A). Compared to the effects observed in matched control slices, the A3 receptor antagonist significantly increased the latency of AD peak from 7.28 minutes (437 ± 31 s) in control to 9.5 minutes (571 ± 70 s) in MRS 1523 (P <0.01, Mann-Whitney test, two tailed), without significantly affecting either the average magnitude (figure 14) or the peak amplitude of AD (6.2 ± 1.2 mV, n=6 vs. 7.3 ± 0.3 mV, n=8 in control, P= 0.49, two-tailed Mann-Whitney test). No recovery of fEPSPs was recorded after interruption of the 30-minute OGD insult (not shown).
In a final set of experiments we monitored the recovery of fEPSPs while recording AD latency and amplitude following OGDs of different duration (8-10 minutes) in the presence of 100 nM MRS 1523.
As summarised in figure 16B, a significant recovery of fEPSP amplitude was obtained after OGD insults of duration up to 9 minutes. No significant recovery was observed in 5 slices after 10 minutes of OGD. On analyzing the fEPSP recovery in relation to AD ap-pearance after OGD, it emerged that the degree of fEPSP recovery after OGD in A3 antag-onist-treated slices depended on the appearance of AD and not on the duration of OGD episodes. In fact, in the absence of AD a full recovery of fEPSP was found in most prepa-rations receiving 7 or 8 minutes of OGD episodes and in one slice after 9 minutes OGD.
Interestingly, treatment with MRS 1523 allowed for a significantly better recovery of neurotransmission also in those slices in which AD was present, but peaked close to the end of OGD episodes (≤ 45 s) or after the interruption of OGD (25.6±5.5 % mean ± s.e., range 3-75 %, n=14 vs control 7.2±2.8 % mean ± s.e., range 0-24.5 %, n=17, P<0.005, Mann-Whitney test, two-tailed). Conversely, in control slices, no considera-ble recovery was found even in those preparations in which AD peaked after interrup-tion of the 7-minute OGD.
Therefore, it appears that in our experimental conditions the most relevant corre-lates for the degree of recovery of neurotransmission produced by A3 receptor block during OGD was the delay in AD development, which prolonged the time-window al-lowed for the recovery of fEPSPs.
After evaluating the effects of the selective block of A3 receptors activated during mild (2 or 5 minutes) and severe (7 minutes) OGD episodes by the endogenously re-leased adenosine, we investigated the role of A3 receptor stimulation by exogenous ago-nist application in the same experimental conditions.

Elisabetta Coppi72
2.1.4 The selective stimulation of adenosine A3 receptors by a “long application” of Cl-IB-MECA reduces fEPSP depression evoked by a 2-minute OGD episode and induces a faster recovery of fEPSP amplitude after a 5-minute OGD.
The effect of Cl-IB-MECA (10 nM) on fEPSP amplitude after 2 minutes of OGD is shown in figure 17A. The selective A3 agonist did not affect the amplitude of fEPSPs under normoxic conditions, but induced a significant decrease in fEPSP depression evoked by 2 minutes of OGD (72.5±4.5% in control and 39.5±7.1% in the presence of the agonist, n=13, P<0.05, paired two-tailed Student’s t test). The effect of 10 nM Cl-IB-
Figure 15. Effects of different selective A3 adenosine receptor antagonists on recovery of fEPSP amplitude after a 7-minute OGD insult. A. Column bars indicate the average recovery (mean ± s.e.) of fEPSPs after 7 minute of OGD, recorded in hippocampal slices at 15 minutes reperfusion in normal, oxygenated aCSF. Asterisks indicate P<0.05, one-way ANOVA, Newman-Keuls mul-tiple comparison post-hoc test, versus control. B. Distribution analysis of fEPSP recovery in 87 slices receiving 7-minute OGD episodes either in control or in the presence of A3 receptor antag-onists (see A, 0.1 nM MRS excluded). Bars indicate the number of cells (ordinate) that showed a given recovery of fEPSP (abscissa) from 7-minute OGD episodes in control aCSF (n=42; white bars) or in the presence of A3 antagonists (n=45; black bars). Note that the large majority of treated slices (38 out of 45) show more than 50% recovery of fEPSPs.

Role of A3 adenosine receptors during OGD 73
MECA was maximal because the increase of the agonist concentration to 100 nM did not potentiate the effect (75±7% in control and 41±10% in the presence of the agonist, n=6, P<0.05, paired two-tailed Student’s t test, data not shown). The effect of 10 nM Cl-IB-MECA was not antagonized by the selective A2A receptor antagonist ZM 241385, su-perfused 15 minutes before and then co-applied with Cl-IB-MECA (73±9% in control and 38±14% in the presence of 100 nM ZM 241385 in combination with Cl-IB-MECA, n=3, data not shown).
The effect of 10 nM Cl-IB-MECA during a 5-minute OGD insult is shown in figure 17B. Cl-IB-MECA did not change the fEPSP time-course before and during OGD but reduced the time of fEPSP recovery (AUC: 9.5±0.6 in control, n=10 and 7.7±0.61 in the
Figure 16. Treatment with MRS 1523 postpones the appearance of AD and broadens the time window for CA1 fEPSP recovery after OGD interruption. A. Time-window for OGD (30 min-utes)-elicited ADs in the absence (dotted lines) or presence of 100 nM MRS 1523 (continuous lines). Traces represent ADs recorded as negative DC shifts in response to 30 minutes of OGD taken from control experiments (n=6) or in MRS 1523 (n=6). For the sake of clarity, only the earliest and the most delayed ADs observed in each group of slices are shown. Note that in MRS 1523 both the earliest and the latest ADs were delayed compared to the corresponding ADs in controls. AD magnitude, expressed as the integral of tissue depolarisation measured for 2 min-utes after AD peak in MRS 1523-treated slices (3.2 ± 0.6 Vs, n=6), was not statistically different from that of controls (3.6 ± 0.7 Vs, n=8, P=0.49, Mann-Whitney, two tails). B. Time-course of fEPSP amplitude, expressed as percent of baseline level, during OGD of different time durations applied in the presence of 100 nM MRS 1523. Values are mean ± s.e.

Elisabetta Coppi74
presence of the agonist, n=6, P<0.05, one-way ANOVA, Newman-Keuls multiple com-parison post-hoc test, see also figure 18C).
Figures 17C and D show the effect of co-application of Cl-IB-MECA and MRS 1523 on 2 and 5 minutes of OGD, respectively. The antagonist was always superfused 5 minutes before the agonist. The effect of the co-application of the two drugs on fEPSP depression induced by a 2-minute OGD episode (81±3.3 % in control and 32.3±11.5% in the presence of the two drugs, n=7, P<0.05, paired two-tailed Student’s t test, fig-ure 17C) was not significantly different from that observed in the presence either of MRS 1523 alone (figure 12B) or Cl-IB-MECA alone (figure 17A). Similarly, the effect induced by the co-application of the two drugs on the time of fEPSP recovery after a 5-minute OGD insult (AUC: 10.6±1 in control, n=8 and 7.79±0.49 in the presence of the two drugs, n=6, P<0.05, one-way ANOVA, Newman-Keuls multiple comparison post-hoc test, see also figure 18C) was not different from those observed in the pres-ence either of MRS 1523 alone (figure 12C) or Cl-IB-MECA alone (figure 17B). Thus,
Figure 17. The selective A3 adenosine receptor agonist Cl-IB-MECA, decreases fEPSP depres-sion induced by a 2-minute OGD episode and induces a faster recovery of fEPSP amplitude after a 5-minute OGD. Time-courses of fEPSP amplitude changes elicited by different OGD insults. Data (mean ±s.e.) are expressed as percent of baseline values recorded before OGD initiation. A. 2-minute OGD insults in the absence and in the presence of Cl-IB-MECA (10 nM; n=13). The A3 agonist, applied 5 minutes before, during and 2 minutes after OGD (open bar), induced a sig-nificant reduction in fEPSP depression caused by the 2-minute OGD insult (P<0.05 vs first OGD insult, paired two-tailed Student’s t test). B. 5 minutes of OGD in the absence and presence of 10 nM Cl-IB-MECA. The A3 agonist, applied as before, induces a faster fEPSP recovery after 5 min-utes of OGD. C. 2-minute OGD insults in the absence and presence of 10 nM Cl-IB-MECA in combination with 100 nM MRS 1523 (n=7). The antagonist was always superfused alone 5 min-utes before and 3 minutes after agonist application. Note that, in the presence of Cl-IB-MECA and MRS 1523, the fEPSP depression induced by a 2-minute OGD episode was significantly re-duced (P<0.05 vs first OGD insult, paired two-tailed Student’s t test). D. 5 minutes of OGD in the absence and presence of Cl-IB-MECA (10 nM) in combination with MRS 1523 (100 nM). The antagonist was applied as described before.

Role of A3 adenosine receptors during OGD 75
we concluded that the effects of MRS 1523 and Cl-IB-MECA co-application on fEPSP inhibition induced by 2 or 5 minutes of OGD are not additive.
2.1.4 The selective stimulation of adenosine A3 receptors by a “short application” of Cl-IB-MECA does not affect fEPSP depression evoked by a 2-minute OGD insult and delayed the recovery of fEPSP amplitude after a 5-minute OGD.
Since it has been demonstrated that A3 adenosine receptors undergo to a rapid de-sensitization more evident and persistent when the agonist was applied for long times (Trincavelli et al., 2002a), we chose to check a different protocol shortening the time
Figure 18. “Short” application Cl-IB-MECA does not modify fEPSP depression induced by a 2-minute OGD episode whereas it significantly delays fEPSP recovery after a 5-minute OGD. Data (mean ±s.e.) are expressed as percent of respective baseline values recorded before OGD appli-cation. A. Time-course of fEPSP amplitude changes elicited by 2-minute OGD episode in the absence and in the presence of Cl-IB-MECA (10 nM; n=7). The A3 agonist was applied for only 2 minutes, during OGD (open bar). Note that, a “short” application of Cl-IB-MECA did not in-duce significant change (P>0.05, paired two-tailed Student’s t test) in the fEPSP depression in-duced by 2 minutes of OGD. B. Time-course of fEPSP amplitude changes elicited by 5-minute OGD insults in the absence and in the presence of 10 nM Cl-IB-MECA. As indicated by open bar, the A3 agonist was applied only for 2 minutes, at the end of the 5-minute OGD episode. Note that “short” application of Cl-IB-MECA delayed fEPSP recovery after 5 minutes of OGD. C. Columns in the graph summarize the average time of fEPSP amplitude recovery after 5-minute OGD insults in control conditions and in the presence of Cl-IB-MECA and MRS 1523, alone or in combination. * P < 0.05, one-way ANOVA followed by Newman-Keuls multiple comparison post-hoc test versus control slices; § P<0.05, one-way ANOVA followed by Newman-Keuls mul-tiple comparison post-hoc test versus all experimental groups.

Elisabetta Coppi76
of Cl-IB-MECA application. As shown in figure 18A, Cl-IB-MECA (10 nM) applied only during the 2-minute OGD episode did not modify the outcome of fEPSP depres-sion induced by this insult in comparison to those obtained in the absence of drug (51.6±7.7% in control and 55.6±11.8% in the presence of Cl-IB-MECA n=7, P>0.05, paired two-tailed Student’s t test). Figure 18B shows that when Cl-IB-MECA was ap-plied for 2 minutes at the end of the 5-minute OGD episode, it significantly delayed the time of fEPSP recovery (AUC: 9.7±0.4 in control, n=20 and 12.1±0.65 in the presence of the agonist, n=10, P<0.05, one-way ANOVA, Newman-Keuls multiple comparison post-hoc test, see also figure 18C). This effect was blocked in the presence of 100 nM MRS 1523 (n=5, data not shown). Similar results were obtained using different A3 ago-nists: AR132 (10 nM, n=3), VT158 (5 nM, n=2) and VT 160 (5 nM, n=2). A summary of “short” and “long” application of Cl-IB-MECA during 5 minutes of OGD is illus-trated in figure 18C.
2.1.5 The selective A3 adenosine receptor agonist, Cl-IB-MECA, also protects from the irreversible depression of neurotransmission induced by a 7-minute OGD insult.
The effects of 10 nM Cl-IB-MECA on fEPSP amplitude after 7 minutes of OGD are shown in figure 19. In control slices, a 7-minute OGD insult induced an irreversible block of neurotransmission as indicated by the absence of fEPSP amplitude recovery (4.2±3.3%, n=16) when the slices were superfused in normal oxygenated aCSF. In 8 control slices in which we also measured the appearance of AD, 7-minute OGD epi-sodes always caused AD, with a mean peak latency of about 6.6±0.3 minutes from the beginning of OGD and a peak amplitude of 7.1±0.5 mV (n=8). Cl-IB-MECA (10 nM, 5 minutes before, during and 2 minutes after OGD), did not modify fEPSP amplitude under normoxic conditions but induced a significant fEPSP recovery after 7 minutes of OGD (81.5±10.5 %, P<0.001, one-way ANOVA, Newman-Keuls multiple comparison post-hoc test vs control slices group, n=15, figure 19B and C). AD was absent in 5 slices out of 8 tested and it was significantly delayed in the remaining 3 slices (peak latency of 7.91± 0.54 minutes, peak amplitude 6.6± 2.0, figure 17A). Similar effects on fEPSP recovery were obtained by using different A3 agonists, AR132 (10 nM, n=5), VT72 (10 nM, n=8), VT158 (5 nM, n=3), VT160 (5 nM, n=4) and VT163 (5 nM, n=3) (figure 19C). In addition, all the A3 agonists tested prevented or significantly delayed AD after the 7-minute OGD episode (not shown). These data demonstrate that the effects elic-ited by the exogenous application of a selective A3 receptor agonist are similar to those obtained in the presence of A3 selective antagonists (figure 15A), thus suggesting a rap-id desensitisation of this receptor subtype.
In order to confirm that the protective effect exerted by Cl-IB-MECA on fEPSP re-covery after a 7-minute OGD insult was effectively due to a desensitization of A3 recep-tors, we performed a different protocol. In a separate group of slices, a 15-minute pre-treatment with 10 nM Cl-IB-MECA was applied 20 minutes before the induction of a 7-minute OGD insult. As shown in figure 19D, 10 nM Cl-IB-MECA pre-treatment was enough to induce a significant fEPSP recovery after 7 minutes of OGD (103±3.6 % af-ter Cl-IB-MECA pre-treatment, n=3, 4.1±3.6, n=3% in control) even if the compound was absent during the ischemic episode itself.

Role of A3 adenosine receptors during OGD 77
Figure 19. The selective A3 adenosine agonist, Cl-IB-MECA, protects hippocampal slices from the irreversible fEPSP depression induced by a 7-minute OGD insult. Data (mean ± s.e.) are ex-pressed as percent of baseline values recorded before OGD application. A. Time-course of fEP-SP amplitude before, during and after the 7-minute OGD in the absence and in the presence of 10 nM Cl-IB-MECA. Cl-IB-MECA was applied 5 minutes before, during and 2 minutes after OGD (open bar). B. In the same slices, AD was recorded as the negative DC shift in response to 7 minutes of OGD in control conditions (n=8) and in the presence of 10 nM Cl-IB-MECA (open bar, n=8). The agonist prevented AD appearance in 5 slices and delayed it in the remain-ing 3 slices. C. Time-course of fEPSP amplitude in control conditions, in the presence of 10 nM Cl-IB-MECA (open bar, 15 minutes) and during the 7-minute OGD episode. OGD was applied 20 minutes after the end of Cl-IB-MECA superfusion. Note that Cl-IB-MECA does not modify fEPSP in normoxic conditions but allows a complete recovery of fEPSP amplitude after 7 min-utes of OGD. D. Columns in the graph summarize the effects of different A3 agonists on fEPSP recovery after 7- minute OGD insults. * P<0.05, one-way ANOVA followed by Newman-Keuls multiple comparison post-hoc test versus control slices.

Elisabetta Coppi78
3. Discussion
3.1 Role of adenosine receptor antagonists in depression and disruption of CA1 hippocampal excitatory synaptic transmission during in vitro ischemia.
The main finding of the present work is that the selective antagonism of A3 adenos-ine receptors during a severe (7-minute) OGD insult reduces the deleterious effects of ischemia on CA1 hippocampal neurotransmission and pyramidal cell survival.
In our experiments, the pre-treatment of hippocampal slices with selective A3 ade-nosine receptor antagonists considerably delays the occurrence of AD and significantly protects from the irreversible disruption of excitatory neurotransmission caused by 7-minute OGD episodes. A3 receptor antagonists exert a protective effect on OGD epi-sodes of ≤ 9 min duration, showing that other cellular mechanisms are implicated and predominate when AD takes place after a prolonged ischemia.
We used four selective A3 adenosine receptor antagonists with differ-ent chemical structure and lipid solubility (Jacobson et al., 1997; Kim et al., 1996; Li et al., 1998; Maconi et al., 2002; Muijlwijk-Koezen et al., 2000; Mull-er 2003) to assess the role of A3 receptor stimulation by endogenous adeno-sine released during OGD episodes. All compounds show similar protective effects on the 7-minute OGD protocol at nM concentration, ensuring spe-cific involvement of A3 receptors in the observed effects. MRS 1220, VUF 5574 and WSAB were reported to have higher affinity for the human A3 re-ceptors (Jacobson et al., 1997; Kim et al., 1996; Maconi et al., 2002; Muijl-wijk-Koezen et al., 2000) and their effectiveness on native rat A3 receptors at very low concentration may be surprising. We do not have any straight-forward explanation for this phenomenon. The tissue accumulation of the lipophilic MRS 1523, MRS 1220 and VUF 5574, is an unlikely explanation since WSAB is a hydrophilic compound (Maconi et al., 2002). On the oth-er hand, receptor affinity of these compounds may also depend on specific conformations assumed by A3 receptors in the integer cell membrane and may differ from that assessed in receptor binding experiments on disrupted membranes. Alternatively, the paucity of A3 receptors in native tissue (Ji et al., 1994; von Lubitz 1999) allows the speculation that occupancy of a sub-stantial fraction of A3 receptors is required for evoking cell response(s). In this case, the block of a relatively small fraction of A3 receptors may be suf-ficient to greatly antagonise the effects of endogenous adenosine released during OGD (see also below).
The depression of synaptic responses caused by OGD episodes of short duration (up to 5 minutes) in the CA1 region of the hippocampus is fully reversible (Latini et al., 1999b; Pugliese et al., 2003). In the present work, it has been demonstrated that the selective block of A3 receptors by the antagonist MRS 1523 reduces fEPSP inhibition caused by 2 minutes of OGD and induces a faster recovery of fEPSP amplitude after 5 minutes of OGD application. The decrease in fEPSP depression or the faster recov-ery of fEPSP amplitude during the selective block of A3 receptors indicate an inhibi-tory role of A3 receptors on synaptic transmission during brief OGD insults. We have previously demonstrated that depression of synaptic potentials during 2 or 5 minutes of OGD is almost completely antagonized in the presence of the selective A1 adenosine receptor antagonist DPCPX (Latini et al., 1998; 999a and 1999b). Most of the known neuroprotective effects of adenosine during ischemia both in vivo or in vitro are attrib-

Role of A3 adenosine receptors during OGD 79
uted to the depression of synaptic activity induced by the activation of A1 receptors. Therefore, the decrease in synaptic depression brought about by A3 adenosine receptor antagonists suggests that A1 and A3 receptors cooperate in inhibiting fEPSP amplitude during the first minute of OGD and share a neuroprotective role in these pathological conditions. This interpretation is in line with the observation that selective activation of A3 adenosine receptors under hypoxic conditions brings about inhibition of excitatory neurotransmission in rat cortical neurons (Hentschel et al., 2003) and that mice lack-ing A3 adenosine receptors have increased neurodegeneration in response to repeated episodes of moderate hypoxia (Fedorova et al., 2003).
Nevertheless, as above illustrated, the role of A3 receptors is no longer beneficial during periods of severe (7-minute) OGD and drastically diverge from the A1-like pro-tective effect. In fact, unlike the A3 antagonists, the selective A1 receptor antagonist DPCPX impairs the recovery of synaptic potentials after a hypoxic insult (Sebastiao et al., 2001). Moreover, the non-selective A1 receptor antagonist theophylline increas-es the incidence of spreading depression (SD), the analogue of AD under normoxic conditions (Somjen 2001), and decreases the latency of SD occurrence elicited by in-creasing extracellular K+ concentration in CA1 hippocampal slices (Kaku et al., 1994). Prolonged ischemic conditions could play a pivotal role in switching the effects of A3 receptor stimulation from A1-like inhibition to potentiation of excitotoxic glutamate ef-fect. The activation of PLC by adenosine A3 receptors has been reported in striatal and hippocampal slices (Abbracchio et al., 1995a). Rat cortical neurons exposed to in vit-ro hypoxia show an increase in PKC activation after selective A3 receptor stimulation (Nieber et al., 2006). Similarly to what is described in the heart, PKC-dependent acti-vation of KATP channels may enhance adenosine protection (Liang 1998) but if OGD is applied long enough to be considered severe, protracted PKC activation induced by A3 receptors could account for an increase in intracellular calcium which may participate in increasing tissue excitability and thus leading to irreversible synaptic failure, as al-ready speculated in previous work (Abbracchio et al., 1999).
A constant sequence of changes in neurotransmission occurs during the applica-tion of long OGD episodes and comprises: i) the early depression of evoked fEPSPs, ii) a transient recovery of fEPSPs followed by iii) the disappearance of synaptic responses and afferent fibre volley and iv) AD. The whole sequence of events lasts about 6 min and therefore is typically recorded within the application of 7-min OGD.
Our results show that the block of A3 receptor-mediated effects by selective antago-nists results in a significant delay of the sequence of electrophysiological changes, in-cluding disappearance of the afferent fibre volley and AD that are considered early elec-trophysiological signs of tissue suffering.
The earliest event observed during OGD was the disappearance of the electrical-ly-evoked fEPSPs that reflect the currents generated by the inflow of cations into CA1 pyramidal cell dendrites produced by activation of synaptic glutamate receptors. The predominant, although not exclusive, mechanism that accounts for the reduction in fEPSPs during the first 4-5 min of ischemia is a decrease in glutamatergic neurotrans-mission caused by activation of adenosine A1 presynaptic receptors (Fowler 1990; Gri-bkoff et al., 1990; Latini et al., 1999a; Pedata et al., 1993).
A3 receptor stimulation per se does not produce any harmful effects in normox-ic tissue. In fact neither A3 receptor agonists nor adenosine disrupt CA1 neurotrans-mission in normally oxygenated slices (Dunwiddie et al., 1997a). This implies that the main role of A3 receptor activation during OGD is to hasten the processes that lead to AD and that removal of these mechanisms prolongs the period of tissue survival

Elisabetta Coppi80
to OGD, but cannot fully block the consequences of ischemia. In order to explain the mechanism by which A3 receptors may be contributing to failure of synaptic transmis-sion during OGD, we can postulate that stimulation of A3 receptors by adenosine re-leased during prolonged and severe ischemia may enhance excitatory transmission on CA1 pyramidal neurones, accounting for increased neuronal excitability and conse-quent lack of protection of the ischemic tissue. Stimulation of A3 receptors in the hip-pocampus may in fact: i) counteract the inhibitory action of A1 adenosine receptors on excitatory neurotransmission (Dunwiddie et al., 1997a); ii) inhibit the presynaptic me-tabotropic glutamate receptor inhibitory function on excitatory transmission (Macek et al., 1998). Furthermore, A3 receptor-mediated stimulation of PLC could contrib-ute to neuronal damage through mobilisation of intracellular Ca2+ (Abbracchio et al., 1995a) and/or activation of PKC, resulting in an increase in excitability of CA1 neu-rones (Hu et al., 1987). Consistently, our data show that the action of A3 receptor an-tagonists is limited to a time window that extends survival to about 9 minutes of OGD. This time window seems to be related to the maximal delay allowed for the appearance of AD in the absence of A3 receptor stimulation.
The generation of AD is complex and multifactorial (see Somjen 2001) and the mechanisms responsible for the delay in AD remain elusive. Interestingly, the time window of A3 receptor-mediated effects overlaps with the delay that can be obtained by treating the slices with glutamate receptor antagonists (Somjen 2001; Tanaka et al., 1997; Yamamoto et al., 1997). It is appealing to suggest that removal of the A3 receptor-mediated impairment of feedback inhibition of glutamate release exerted by specific metabotropic glutamate receptor subtypes (Macek et al., 1998) may substantially de-crease/delay the participation of the excitatory neurotransmitter in triggering the AD.
Our results are in contrast with those obtained in transgenic mice with a deletion of the A3 receptor. It has been demonstrated that after repeated brief exposure to car-bon monoxide, mice lacking the A3 receptors are more vulnerable than control animals to hippocampal damage following hypoxia (Fedorova et al., 2003), suggesting a neuro-protective role of A3 receptors. The discrepancy about the functional role of A3 recep-tors in the brain during hypoxia or ischemia could be due to the diversity of both the experimental conditions (hypoxia/ischemia) and pharmacological profiles of these re-ceptors across species.
The delay of the initial depression of fEPSPs caused by A3 antagonists indicates that A3 receptors are activated within the first 2 minutes of OGD despite the reported low affinity of adenosine for these receptors (about 5 μM: Zhou et al., 1992). However, since the estimated concentration of adenosine at the receptor level approaches 5 μM at the second minute of OGD and reaches 30-40 μM within the fifth min of OGD (Latini et al., 1999b) a substantial activation of A3 receptors may be achieved since the begin-ning of ischemia. According to the Hill-Langmuir equation, using the above reported values, the estimated occupancy of A3 receptors by endogenous adenosine would ap-proach 50% within the second min of OGD and be almost 90% at 5 min of OGD.
It is therefore conceivable that all the changes in neurophysiological parameters observed with A3 receptor antagonists result from block of cell mechanisms activated by A3 receptors and that their stimulation by adenosine released during OGD contrib-utes to the development of ischemia effects from the beginning of OGD, thus hastening the deleterious effects of ischemia on neurotransmission.
A modest, transient, recovery of fEPSPs was observed in most preparations and fading of the recovery was accompanied by disappearance of the presynaptic fibre vol-ley. This sequence of events has been ascribed to a progressive increase in the extracel-
Role of A3 adenosine receptors during OGD 81
lular K+ concentration that initially produces hyperexcitability of pyramidal cells fol-lowed by a depolarizing block of neurotransmission when extracellular K+ reaches 10 mM or higher concentration (Sick et al., 1987). After fibre volley disappearance and in the absence of any synaptic response, the large efflux of potassium into the extracel-lular space combined with activation of sodium and calcium channels, triggers sus-tained depolarization of hippocampal cells that coincides with AD recorded in the CA1 region. Although similar to the spreading depression described by Leão (Leão 1944) and known to be harmless to the cerebral cortex under normoxic conditions, AD has been suggested to contribute to cell damage during ischemia (see Somjen 2001). In-creased intracellular calcium and/or massive glutamate receptor activation are addi-tional mechanisms that act in concert with potassium redistribution to produce AD (Tanaka et al., 1997; Yamamoto et al., 1997) and have been suggested to contribute to cell damage during ischemia (Somjen 2001).
3.2 Therapeutic implications for the protective role of adenosine A3 receptor antagonists during prolonged ischemic conditions.
In the brain, spreading depression is a phenomenon characterised by a slow transient cellular depolarization moving at 3–4 mm/min over the surface of the cortex (Leão 1944). A large efflux of potassium into the extracellular space coincides with the shift in the DC potential. The changes in brain homeostasis are transient and do not cause visible injury in normoxic conditions (Hansen et al., 1988), but are correlated with tis-sue damage during ischemia (Somjen 2001). Within 2 minutes of stroke onset, neu-rones and glia suddenly depolarize in the brain area where cerebral blood flow falls to 10% of control (Macdonald et al., 1998). In these conditions, the generation of AD may contribute to the extent and severity of neuronal damage. In particular, the propaga-tion of the AD to the hypoxic/hypoglycaemic region (penumbral area) surrounding the ischemic core may extend the damage. Consistently, it has been demonstrated that one major factor contributing to neuronal death in the penumbra is the propagation of spreading depression waves (Koroleva et al., 1996). Because the penumbra constitutes potentially salvageable tissue, the molecular responses of the perifocal neurones to fo-cal ischemia and AD are of interest (Obeidat et al., 2000).
In our experiments, a substantial field depolarization was recorded for several min-utes (see e.g. figures 14, 16 and 19) after the AD peak and therefore even when OGD is interrupted immediately after the AD peak, hypoxia persists for few min after AD. In-deed, in our experimental conditions the recovery of pO2 to normal levels takes about 3-4 minutes (Pugliese et al., 2003).
This is important for the possible therapeutic outcome during ischemia in vivo. It may be envisaged that the block of A3 receptors may increase the resistance of the brain tissue not only in the ischemic core but also in the surrounding “penumbral” region. However, while the action of A3 block is of limited effectiveness in the ischemic core (de-pending on the duration of the episode), more effective neuroprotection can occur in the surrounding regions, where the damage can be ascribed to the concomitant hypoxia/hy-poglycaemia and appearance of AD. The observation that a statistically significant recov-ery of fEPSPs occurred when AD peaked concurrently or after interruption of OGD in the presence of A3 antagonists but not in control slices, supports the notion that A3 recep-tor block increases the resistance to the deleterious effect of AD in conditions of milder hypoglycaemia/hypoxia. The causal association of A3 receptor block, delayed AD appear-ance and better recovery from ischemic episodes needs, however, further investigation.

Elisabetta Coppi82
Regardless of the exact mechanisms exerted by A3 receptors at a cellular level, it appears that the activation of these adenosine receptor subtypes during a prolonged ischemic episode produces deleterious consequences for the survival of neuronal cells and that the block of A3 receptors may substantially increase the resistance of brain tis-sue to OGD occurring in ischemia.
3.3 Role of adenosine receptor agonists in depression and disruption of CA1 hippocampal excitatory synaptic transmission during in vitro ischemia.
Our results show, unexpectedly, that the effects induced by Cl-IB-MECA during OGD of different duration are similar to those elicited by adenosine A3 antagonists. In fact, Cl-IB-MECA reduces fEPSP depression induced by a 2-minute OGD episode, in-duces a faster recovery of fEPSPs after a 5-minute OGD and permits a full recovery of neurotransmission after severe (7-minute) OGD. A decrease in OGD-induced fEPSP depression, brought about by A3 agonists, may be attributed to A2A receptor stimula-tion. It was, in fact, previously demonstrated that selective stimulation of A2A receptors by CGS 21680 decreases fEPSP depression induced by 2 minutes of OGD and that the effect is antagonized by the selective A2A antagonist, ZM 241385 (Latini et al., 1999a). However, the concentration of Cl-IB-MECA used in the present study (10 nM) is high-ly selective for A3 versus A2A receptors (Muller 2003) and the effect of Cl-IB-MECA is not antagonized by ZM 241385, not withstanding that Cl-IB-MECA-induced depres-sion of fEPSPs inhibition during a 2-minute OGD insult is mediated by A2A adenosine receptors. Specific involvement of A3 receptors in the observed effects is also ensured by observation that five chemically related compounds demonstrated similar effects to those elicited by Cl-IB-MECA. Concentrations of Cl-IB-MECA and of MRS 1523 used in the present study induce maximal effects. Therefore, the observation that the effects of Cl-IB-MECA and MRS 1523 during 2 or 5 minutes of OGD are not additive indi-cates that the effect of both drugs on fEPSP depression evoked by OGD is mediated by the same receptor system (i.e. A3 receptors). In addition, the hypothesis of A3 desensiti-zation is also supported by the fact that 15 minutes of Cl-IB-MECA pre-treatment are sufficient to allow a full recovery of fEPSP amplitude after 7 minutes of OGD.
A reducing effect of Cl-IB-MECA on fEPSPs inhibition induced by adenosine has been attributed to a desensitization of A1 receptors(Dunwiddie et al., 1997a). Our re-sults do not support such a mechanism because: i) the selective A3 receptor antagonist MRS 1523 not only does not potentiate fEPSP inhibition induced by 2 and 5 minutes of OGD, but it attenuates this effect; ii) Cl-IB-MECA protects against AD appearance and irreversible disruption of excitatory neurotransmission caused by severe (7 min-utes) OGD episodes while the selective A1 antagonist DPCPX impairs the recovery of neurotransmission after hypoxia (Sebastiao et al., 2001). Therefore, the effects of Cl-IB MECA are likely attributable to a rapid desensitization of A3 receptors. This adenosine receptor subtype is particularly susceptible to phosphorylation by G protein-coupled receptor kinases (Linden 2001; Palmer et al., 2000). Studies using stably transfected CHO cells have demonstrated that, following a few minutes of exposure to the agonist, there is a 30-40% decrease in the A3 high affinity binding sites (von Lubitz et al., 2001) and receptor internalization (Trincavelli et al., 2000). Desensitization of A3 receptors following exposure to Cl-IB-MECA and other A3 selective agonists is supported by the observation that when Cl-IB-MECA was applied for a shorter time, it induced a slower recovery of fEPSPs after a 5-minute OGD episode instead of shortening the recovery. Further evidence in support of A3 desensitization is provided by the observation that

Role of A3 adenosine receptors during OGD 83
perfusion with Cl-IB-MECA 20 minutes before application of a 7-minute OGD insult still allows a significant recovery of neurotransmission.
When considering that A3 receptors encounter desensitization after prolonged ex-posure to A3 agonists, we also have to consider that, under the OGD conditions used in the present study, endogenous adenosine released by the ischemic stimulus is not suf-ficient to cause A3 receptor desensitization. During hypoxic/ischemic conditions ade-nosine is released from hippocampal slices, reaching concentrations up to 30 µM after 5-min OGD (Latini et al., 1998; Pearson et al., 2006). However, the efficacy of A3 an-tagonists in blocking the depression induced by OGD of different durations indicates that endogenous adenosine concentrations reached in the extracellular milieu are not sufficient to desensitize A3 receptors. Therefore, stimulation as massive as that reached in the presence of endogenous adenosine plus A3 agonists is necessary to carry out sub-stantial A3 receptor plastic adjustments.
3.5 Conclusions
In conclusion, our data indicate that the block of A3 receptors, stimulated by adenosine released during ischemia, counteracts fEPSP depression induced by OGD of different durations. Adenosine A3 receptors stimulated by adenosine released by brief periods of ischemia might exert A1-like protective effects on neurotransmission. Longer peri-ods of ischemia, implying longer A3 receptor stimulation, would switch the A3 recep-tor-mediated effects to injurious effects. Moreover our data support the notion that A3 receptors undergo rapid desensitization.
The major outcome of the present work is that selective block of adenosine A3 re-ceptors, or their desensitization, during severe ischemic insults in the brain may ex-erts neuroprotective effects on synaptic transmission, thus opening possible therapeu-tic perspectives for the future.
Increased knowledge of molecular mechanisms of A3 receptors during cerebral ischemia may increase our understanding of the utility of A3 agonists/antagonists in ischemic and different neurodegenerative disorders.


Elisabetta Coppi, Purines as Transmitter Molecules: Electrophysiological Studies on Purinergic Signalling in Differ-ent Cell Systems, ISBN 978-88-8453-904-5 (print), ISBN 978-88-8453-905-2 (online) © 2008 Firenze University Press
Chapter2RoleofP2purinergicreceptorsonhippocampalCA1neurotransmissionundernormoxicconditionsandduringOGD
1. Historical background
Both potentiating and suppressing effects of exogenously applied ATP on synaptic transmission have been reported to date in the literature, depending on varying ex-pression and localization of purinergic receptor subtypes (Cunha et al., 2000; Hugel et al., 2000; Nakatsuka et al., 2001). From first evidence, it was clear that ATP-excitatory effects were mediated by P2X receptor stimulation since they were blocked by selec-tive antagonists (Edwards et al., 1992a; Evans et al., 1992; Khakh et al., 1998; Mori et al., 2001; Pankratov et al., 1998). In contrast, the inhibitory action of ATP and its ana-logues was usually found to be blocked by the selective A1 antagonist DPCPX, suggest-ing an involvement of adenosine A1 receptors (Cunha et al., 1998; Masino et al., 2002). In fact, it is generally known that extracellular ATP is rapidly converted into adenosine through ecto-ATPases and ecto-nucleotidases (Zimmermann 1996), with subsequent activation of P1 adenosine receptors. This was particularly evident in the hippocam-pus, where adenosine A1 receptors are highly expressed, and their inhibitory role in CA1 neurotransmission has been well described (Fredholm et al., 2001). Firstly, several lines of evidence lead to the hypothesis that ATP-mediated inhibition of hippocampal synaptic activity was probably mediated by adenosine A1 receptors after a rapid degra-dation (<1s) of the nucleotide by ecto-ATPases and ecto-nucleotidases. In fact, this re-sponse was theophylline-sensitive (Cunha et al., 1998; Dunwiddie et al., 1997b; O’Kane et al., 1998) and absent in A1 knock out mice (Masino et al., 2002). On the other hand, a more detailed observation of adenine nucleotide-evoked effects and the synthesis of new pharmacological tools revealed a P2-mediated inhibition (mostly attributed to P2Y receptor activation) of synaptic transmission in the hippocampus (Luthardt et al., 2003; Mendoza-Fernandez et al., 2000; Rodrigues et al., 2005). However, the relative contribution of P1 and P2 receptor activation to the total hippocampal neurotransmis-sion is still to be clarified (see Masino et al., 2002; Rodrigues et al., 2005).
The role of P2 receptors in the hippocampus may become even more relevant dur-ing pathological conditions such as ischemia, when an increased outflow of radioac-tive ATP from hippocampal slices during ischemic-like conditions has been reported (Juranyi et al., 1999; Melani et al., 2005). Some evidence already exists about a cytotox-ic role of endogenously released ATP under such pathological conditions, both in vivo (Kharlamov et al., 2002; Lammer et al., 2006; Melani et al., 2006; Ryu et al., 2002) and in vitro (Cavaliere et al., 2003 and 2004), but the mechanisms by which P2 receptors exert this toxic action are still unknown.
In this work we investigated the role of P2 purinergic receptor activation in CA1 neurotransmission in rat hippocampal slices under normoxic and ischemia-like con-

Elisabetta Coppi86
ditions, through the application of different P2 purinergic receptor agonists and antagonists.
2. Results
2.1 Effects of ATP on CA1 hippocampal neurotransmission
In the first series of experiments, the effect of ATP on evoked synaptic transmission in the CA1 region of rat hippocampal slices was investigated. Figure 20A shows that a 10-minute application of ATP decreased the evoked fEPSP amplitude in a concentra-tion-dependent manner. A partial but statistically significant inhibition was observed at a concentration of 10 µM ATP (20.3±2.5 %, P<0.0001, paired Student’s t test) while a substantial inhibition was observed at a concentration of 100 µM ATP (77.8±3.3%). As shown in figure 20A, the effect was always reversible after a few minutes of washout. The apparent EC50 value of ATP on fEPSP inhibition was 59 µM (95% C.L. 17-198 µM). These data are consistent with previous results demonstrating an ATP-mediated inhibi-tion of extracellularly recorded CA1 neurotransmission (Cunha et al., 1998; Dunwid-die et al., 1997b; Masino et al., 2002; Mendoza-Fernandez et al., 2000; O’Kane et al., 1998). At the beginning of each experiment and 15 minutes after ATP washout, a stim-ulus-response curve was recorded to verify if there was a relatively “long lasting” po-tentiation of synaptic responses after ATP removal. Such an effect has previously been reported to occur in hippocampal slices (Fujii et al., 1995a; 1995b; 1999; 2002; Nishi-mura et al., 1990; O’Kane et al., 1998; Wieraszko et al., 1989; Yamazaki et al., 2002). At concentrations of 1-10 µM we did not observe any change in fEPSP amplitude after a 15-minute application of ATP at any stimulus intensity tested (data not shown). In con-trast, an increase of 6.6±3.8% and of 12.3±7.2% in fEPSP amplitude was observed at the highest stimulus intensity tested after 30 µM (upper inset of figure 20A) and 100 µM ATP superfusion, respectively.
The inhibitory effect of ATP on fEPSP amplitude was not blocked by the P2 antag-onists PPADS and suramin (figure 20B). The two compounds were applied 10 minutes before, during and 5 minutes after ATP superfusion. As shown in Figure 20B, 10 µM ATP in the presence of 30 µM PPADS still elicited a fEPSP inhibition of 20±9% that is not different from that obtained with ATP alone. Similarly, 30 µM ATP in the presence of 100 µM suramin evoked a 32±3.5% fEPSP inhibition, that is not different from the 36±10.6% fEPSP reduction obtained with 30 µM ATP alone. The potentiation induced by 30 µM ATP was blocked in the presence of 100 µM suramin (lower inset of figure 20A). It should be noticed that PPADS alone, but not suramin, significantly reduced the fEPSP amplitude by 5.21± 1.6% (inset of figure 20B; P<0.05, paired Student’s t-test; n=29) in accordance with previous data obtained in rat hippocampus
It is well known that extracellular ATP is rapidly metabolized by membrane ecto-ATPases, leading to the formation of ADP, AMP and adenosine. Adenosine A1 recep-tors are widely distributed in the CA1 hippocampus and many effects of exogenous ATP have been attributed to A1 adenosine receptor activation after ATP catabolism in this brain region. For this reason, the effect of ATP was also evaluated in the presence of the selective adenosine A1 antagonist DPCPX. The application of 100 nM DPCPX 30 minutes before ATP superfusion significantly increased fEPSP amplitude (12.7± 5.2% vs control, n=5; P<0.05, paired Student’s t-test, data not shown). In addition, it completely blocked the ATP-mediated reduction of fEPSP (P<0.05, one-way ANOVA,

Role of P2 purinergic receptors on hippocampal CA1 neurotransmission 87
Newman-Keuls multiple comparison post-hoc test, figure 20B). We also investigated the effect of ATP in the presence of different ecto-ATPase inhibitors: ARL 67156, BGO 136 and PV4. As shown in figure 21A, in the presence of PV4, the inhibitory effect on fEPSP amplitude elicited by 10 µM ATP (35.2±6.1%, n=6) was significantly enhanced in comparison to that observed with 10 µM ATP alone (20.3±2.5%, P<0.05, one-way
Figure 20. The inhibitory effect induced by ATP on fEPSP amplitude is not blocked by P2 pu-rinergic antagonists. A. Time-course of fEPSP amplitude before, during and after the applica-tion of different concentrations of ATP. Each point in the graph represents the mean ± s.e. of fEPSP value measured as percent of baseline, pre-drug level. Upper panels represent single trac-es recorded in a typical experiment before, during and after 10 µM ATP application. Upper in-set: stimulus-response curves recorded before and after 30 µM ATP application illustrate the potentiating effect of the P2 agonist on a wide range of stimulus strength in a typical experi-ment. fEPSP amplitude is expressed as percent of the maximal value obtained in control con-ditions at the highest stimulus strength. Lower inset: the potentiating effect was prevented in the presence of 100 µM suramin. B. Columns in the graph summarize the average amplitude (mean ± s.e.) of evoked fEPSP recorded from CA1 hippocampal region in control conditions, 5 minutes after superfusion of ATP alone and 5 minutes after ATP superfusion in the presence of different purinergic antagonists. Note that the inhibitory effect of ATP on fEPSP amplitude is not blocked by the P2 antagonists PPADS and suramin, but only by the A1 adenosine antago-nist, DPCPX. *P<0.05, one-way ANOVA followed by Newman-Keuls test versus pre-drug value. §P<0.05, one-way ANOVA followed by Newman-Keuls test versus 10 µM ATP. Inset: bars in the graph represent the average of fEPSP amplitude 5 minutes before and during the last 5 minutes of PPADS superfusion (30 µM). *P<0.05, paired Student’s t test.(Pankratov et al., 1998; Safiulina et al., 2005) and prefrontal cortex (Luthardt et al., 2003; Wirk-ner et al., 2002).

Elisabetta Coppi88
ANOVA, Newman-Keuls multiple comparison post-hoc test). Similar results were ob-tained with all the ecto-ATPase inhibitors tested (figure 21B: 35.8±6.4% in ATP+ARL 67156, n=5; 38.2±3.6% in ATP+BGO 136, n=5).
The effects of ATP were also studied by recording synaptic potentials at the somatic level of CA1 region. ATP (10 µM) induced a 66±7.1% decrease in PS amplitude (P<0.0001; paired Student’s t test, figure 22A) that was reversed after few minutes washout. The ap-parent EC50 value of ATP on PS inhibition was 7 µM (95% C.L. 1.5-33 µM). When the stimulus-response curve was delivered 15 minutes after drug removal, a significant in-crease in PS amplitude (P<0.05, paired Student’s t-test, n=7) was observed at a stimulus intensity able to evoke a response higher than 50% of the maximum (upper inset of figure 22A). At the highest stimulus intensity tested, the increase was 14.8±3% (n=7).
Figure 21. The inhibitory effect induced by ATP on fEPSP amplitude is potentiated in the pres-ence of different NTPDase inhibitors. A. Time-course of fEPSP amplitude before, during and af-ter the application of ATP in the absence or in the presence of the NTPDase1,2,3 inhibitor PV4. Each point in the graph represents the mean ± s.e. of fEPSP value measured as percent of base-line, pre-drug level. Note that fEPSP inhibition induced by 10 µM ATP in the presence of PV4 is significantly greater than that induced by 10 µM ATP alone (P<0.05, one-way ANOVA one-way ANOVA, Newman-Keuls multiple comparison post-hoc test). B. Columns in the graph sum-marize the average amplitude (mean ± s.e.) of evoked fEPSP recorded from CA1 hippocampal region in control conditions, 5 minutes after superfusion of ATP alone and 5 minutes after ATP superfusion in the presence of different ecto-ATPases inhibitors. Note that the inhibitory effect of ATP on fEPSP amplitude is potentiated by BGO 136, PV4 and ARL 67156. *P<0.05 one-way ANOVA, Newman-Keuls multiple comparison post-hoc test versus pre-drug value. §P<0.05, one-way ANOVA, Newman-Keuls multiple comparison post-hoc test versus 10 µM ATP treat-ed slices.

Role of P2 purinergic receptors on hippocampal CA1 neurotransmission 89
Figure 22. The inhibitory effect induced by ATP on PS amplitude is blocked by DPCPX, a se-lective A1 adenosine receptor antagonist, and by suramin, an aspecific P2 antagonist. A. Time-course of PS amplitude before, during and after the application of different concentrations of ATP. Each point in the graph represents the mean ± s.e. of PS value measured as percent of base-line, pre-drug level. Upper panels represent single traces recorded in a typical experiment be-fore, during and after 10 µM ATP application. The stimulus artefact was blanked and replaced by the arrowhead. Upper inset: stimulus-response curves recorded before and after 10 µM ATP ap-plication illustrate the potentiating effect of the P2 agonist on a wide range of stimulus strength in a typical experiment. PS amplitude is expressed as percent of the maximal value obtained in control conditions at the highest stimulus strength. Lower inset: the potentiating effect was pre-vented in the presence of 100 µM suramin. B. Columns in the graph summarize the average amplitude (mean ± s.e.) of evoked PS recorded from CA1 hippocampal region in control con-ditions, 5 minutes after superfusion of ATP alone, and 5 minutes after ATP superfusion in the presence of different purinergic antagonists. *P<0.05, one-way ANOVA, Newman-Keuls multi-ple comparison post-hoc test versus pre-drug value. §P<0.05, one-way ANOVA, Newman-Keuls multiple comparison post-hoc test versus 10 µM ATP. Inset: bars in the graph represent the aver-age of PS amplitude 5 minutes before and during the last 5 minutes of 100 µM suramin applica-tion. *P<0.05, paired Student’s t test.

Elisabetta Coppi90
No block of ATP-mediated inhibition of PS amplitude was observed in the pres-ence of PPADS (figure 22B). In contrast, 100 µM suramin significantly blocked the ATP-mediated inhibition of the evoked potentials (P<0.05, one-way ANOVA, New-man-Keuls multiple comparison post-hoc test, figure 22B) and completely prevented the potentiation of stimulus-response curve (lower inset of figure 22A). In addition, it induced a significant decrease in PS amplitude (12.8±3.4%; P<0.05, paired Student’s t-test) when applied alone (inset of figure 22B). DPCPX (100 nM) applied 30 minutes before, during and 5 minutes after ATP superfusion, antagonized the effects of 10 µM ATP on PS amplitude, as observed at dendritic level. DPCPX alone significantly in-creased PS amplitude (60.3±11.4% vs control PS, n=6; P<0.05, paired Student’s t-test, data not shown).
2.2 Effects of ATPγS on CA1 hippocampal neurotransmission
ATPγS, the metabolically stable ATP analogue, evoked a concentration-dependent de-crease in fEPSP amplitude (figure 23A). A statistically significant reduction was evident starting from a concentration of 3 µM (P<0.05, paired Student’s t-test), and at 10 µM, ATPγS inhibited fEPSP amplitude by 32.6±4.2% (figure 23A). The apparent EC50 val-ue estimated for ATPγS on fEPSP inhibition was 22 µM (95% C.L. 4.6-106 µM). In all the slices in which we recorded a stimulus-response curve before and 15 minutes after ATPγS application, a statistically significant potentiation of fEPSP (P<0.05, paired Stu-dent’s t-test, n=12) was observed at intensities able to evoke a response higher than 50% of the maximum (upper inset of figure 23A).
The inhibitory effect of ATPγS on fEPSP amplitude was significantly reduced both in the presence of 30 µM PPADS and 10 µM MRS 2179. When higher concentrations of PPADS (50 µM, figure 23B) and MRS 2179 (30 µM, data not shown) were tested, no significant difference in the block of ATPγS-induced inhibition was found. Both antagonists completely prevented the potentiation of the stimulus-response curve ob-served after 15 minutes of ATPγS washout (lower inset of figure 23A) at dendritic level. It should be noted that the application of 10 µM MRS 2179 alone caused a modest but significant reduction in fEPSP amplitude (6.1±3.2%, P<0.05, paired Student’s t-test, in-set of figure 23B, n=15). Contrary to PPADS and MRS 2179, the nonspecific puriner-gic antagonist suramin (100 µM) did not significantly inhibit ATPγS effects at dendritic level (figure 23B).
Surprisingly, the effect of ATPγS on fEPSP amplitude was completely antagonized by the selective adenosine A1 antagonist, DPCPX (figure 23B). Evidence exists that even this metabolically stable ATP analogue is partially converted to adenosine (Masino et al., 2002). To verify this possibility we applied ATPγS after a 30-minute application of 50 µM ARL 67156. However, in these experimental conditions, a 10-minute applica-tion of ATPγS induced an even more pronounced effect on evoked neurotransmission (figure 23B). In fact, the reduction in fEPSP amplitude elicited by 10 µM ATPγS in the presence of ARL 67156 was of 68.2±4.6%, that is significantly greater than that observed under control conditions (P<0.001; one-way ANOVA, Newman-Keuls multiple com-parison post-hoc test). At somatic level, we delivered a cumulative concentration-re-sponse curve (figure 24A) for ATPγS, since no desensitization was observed during sin-gle drug applications (data not shown). Also in this case, the exogenous application of ATPγS produced a concentration-dependent decrease in PS amplitude. A significant effect was observed starting from a concentration of 3 µM (17.4±8.6%, P<0.05, paired Student’s t-test, n=4), while at a 30 µM concentration PS was completely suppressed.

Role of P2 purinergic receptors on hippocampal CA1 neurotransmission 91
The apparent EC50 value for ATPγS on PS inhibition was 6 µM (95% C.L. 1.2-28 µM). In these experimental conditions, a potentiation of PS amplitude (37±12.1%) was observed after drug removal in comparison to pre-drug values (see figure 24A, trace f) even with-out eliciting a stimulus-response curve. The potentiation of somatic response persisted for at least 30 minutes and was also recorded during the stimulus-response curve (inset of figure 24A) after 15 minutes of washout.
Figure 23. The inhibitory effect induced by ATPγS on fEPSP amplitude is reduced by the P2 pu-rinergic antagonists PPADS and MRS 2179 and is enhanced by the ecto-ATPases inhibitor ARL 67156. A. Time-course of fEPSP amplitude before, during and after the application of differ-ent concentrations of ATPγS. Each point in the graph represents the mean ± s.e. of fEPSP value measured as percent of baseline, pre-drug level. Upper panels represent single traces recorded in a typical experiment before, during and after 10 µM ATPγS application. Upper inset: stimu-lus-response curves recorded before and after 10 µM ATPγS application illustrate the potentiat-ing effect of the P2 agonist on a wide range of stimulus strength in a typical experiment. fEPSP amplitude is expressed as percent of the maximal value obtained in control conditions at the highest stimulus strength. Lower inset: the potentiating effect was prevented in the presence of 10 µM MRS 2179. B. Columns in the graph summarize the average amplitude (mean ± s.e.) of evoked fEPSP recorded from hippocampal slices in control conditions, 5 minutes after super-fusion of ATP S alone, and 5 minutes after ATPγS superfusion in the presence of different drugs. *P<0.05, one-way ANOVA, Newman-Keuls multiple comparison post-hoc test versus pre-drug value. §P<0.05, one-way ANOVA, Newman-Keuls multiple comparison post-hoc test versus 10 µM ATPγS. Inset: bars in the graph represent the average of fEPSP amplitude recorded 5 min-utes before and during the last 5 minutes of 10 µM MRS 2179 application. *P<0.05, paired Stu-dent’s t test.

Elisabetta Coppi92
The application of 30 µM PPADS was unable to block the ATPγS-mediated inhi-bition of PS amplitude (figure 24B) and did not affect the potentiation of the stimu-lus-response curve observed 15 minutes after drug removal (data not shown). In con-trast, suramin (100 µM) significantly reduced the ATPγS-mediated inhibition of PS amplitude (figure 24B), and completely prevented the potentiation of the stimulus-re-sponse curve (data not shown). As observed at the dendritic level, the effect of ATPγS on PS amplitude was completely antagonized by the adenosine A1 selective antagonist, DPCPX (figure 24B).
Figure 25 shows the concentration-response curves obtained for ATP and ATPγS at both the dendritic and somatic level. It can be noted that lower concentrations of both P2 agonists are necessary to elicit the inhibitory effect on PS amplitude in comparison to
Figure 24. ATPγS induces a concentration-dependent inhibition and a subsequent potentiation of PS amplitude in the CA1 region of rat hippocampus. A. Averaged time-course (n=4) of PS amplitude before, during and after the application of different concentrations of ATPγS. PS am-plitude (mean ± s.e.) is measured as percent of baseline level. Upper panels represent single traces recorded in a typical experiment before, during and after ATPγS application at different concentrations. Inset: stimulus-response curve recorded before and after 10 µM ATPγS applica-tion illustrate the potentiating effect of the P2 agonist on a wide range of stimulus strength in a typical experiment. PS amplitude is expressed as percent of the maximal value obtained in con-trol conditions at the highest stimulus strength. B. Columns in the graph summarize the aver-age amplitude (mean ± s.e.) of evoked PS recorded from the CA1 region in control conditions, 5 minutes after superfusion of ATP S alone, and 5 minutes after ATPγS superfusion in the pres-ence of different purinergic antagonists (PPADS: 30 µM; suramin: 100 µM; DPCPX: 100 nM). *P<0.05, one-way ANOVA, Newman-Keuls multiple comparison post-hoc test versus pre-drug value. §P<0.05, one-way ANOVA, Newman-Keuls multiple comparison post-hoc test versus 10 µM ATPγS.

Role of P2 purinergic receptors on hippocampal CA1 neurotransmission 93
what is observed at the dendritic level. In addition, the figure shows that ATPγS is more efficient in reducing fEPSP amplitude (but not PS amplitude) in comparison to ATP.
2.3 Effects of ATP and ATPγS on PPF in the CA1 region of rat hippocampus
In order to discern if the ATP and ATPγS mediated effects on fEPSP amplitude were due to pre- or postsynaptic mechanisms, we performed a PPF protocol (see methods). As shown in table 8, a 10-minute application of 10 µM ATP increased PPF, an effect that is not statistically significant. On the other hand, at a concentration of 100 µM, a significant increase in PPF was observed (P<0.01; paired Student’s t test). Ten minutes application of ATPγS significantly increased PPF starting from a concentration of 10 µM (table 8).
To clarify if these effects on PPF were due to P1 or P2 receptor activation, we tested different purinergic antagonists. The action elicited by ATP was tested only in the pres-ence of DPCPX, since we previously demonstrated that PPADS and suramin are not able to antagonize the ATP-inhibitory effect on fEPSP amplitude.
DPCPX (100 nM) alone decreased PPF and fully prevented the ATP-mediated ef-fect. Since the effects of ATPγS at dendritic level were blocked by both P2 and the A1
Figure 25. Concentration-response curves of ATP and ATPγS on dendritic fEPSP and somatic PS responses. The graph shows the fitting curves of concentration-dependent inhibitory effects of ATP and ATPγS on fEPSP and PS amplitude. Note that the curves obtained for both puriner-gic agonists at somatic level are shifted to the left in respect to those recorded at dendritic level. In addition, at the dendritic level, the concentration-response curve obtained in the presence of ATPγS is steeper than that obtained in the presence of ATP.

Elisabetta Coppi94
receptor antagonists, the effect was checked in the presence of PPADS, MRS 2179 and DPCPX.
PPADS (30 µM) and MRS 2179 (10 µM), applied alone 10 and 15 minutes be-fore agonist superfusion respectively, significantly increased, per se, the P2/P1 ratio, but failed to block the increase in PPF induced by 10 µM ATPγS. DPCPX (100 nM) alone decreased PPF and fully prevented ATPγS-mediated effect (table 8).
Table 8. Effects of P2 purinergic agonists and antagonists on PPF in the CA1 hippocampal region.
n P2/P1 ratio n P2/P1 ratioPre-drug n=2 1.49±0.12 Pre-drug n=4 1.32±0.02
10 µM ATP n=2 1.59±0.13 100 nM DPCPX n=4 1.25±0.07*wash n=2 1.48±0.11 100 nM DPCPX + 10 µM ATP n=4 1.22±0.07
Pre-drug n=5 1.54±0.06 Pre-drug n=5 1.31±0.01100 µM ATP n=5 2.16±0.06* 100 nM DPCPX n=5 1.29±0.05*
wash n=5 1.56±0.06 100 nM DPCPX + 100 µM ATP n=5 1.29±0.04
Pre-drug n=9 1.48±0.08 Pre-drug n=6 1.51±0.08
10 µM ATPγS n=9 1.69±0.06* 30 µM PPADS n=6 1.53±0.09*
Wash n=8 1.47±0.09 30 µM PPADS + 10 µM ATPγS n=6 1.90±0.12**
Pre-drug n=4 1.49±0.03 Pre-drug n=8 1.43±0.0430 µM ATPγS n=4 1.90±0.07* 10 µM MRS n=8 1.46±0.04*
wash n=4 1.50±0.03 10 µM MRS + 10 µM ATPγS n=8 1.67±0.08**
* P<0.05 from respective pre-drug value (paired Student’s t-test). ** P<0.05 from antagonist alone (paired Student’s t-test).
2.4 Effects of different purinergic antagonists on OGD-evoked disruption of neurotransmission in the CA1 region of rat hippocampal slices
The effect of P2 purinergic receptor stimulation by endogenous ATP released during in vitro OGD episodes on the impairment of synaptic transmission was investigated us-ing P2 selective antagonists.
In the first series of experiments we characterized the synaptic response of evoked fEPSPs following severe (7-minute) OGD, an ischemia-like insult that in our experi-mental conditions has been consistantly shown to produce an irreversible loss of syn-aptic transmission (Pugliese et al., 2003; Pugliese et al., 2006). At the same time as the fEPSPs recordings, we also monitored another important parameter of brain tis-sue integrity, the DC shift produced by AD. It has been well described in the literature that AD is one of the major factors inducing brain damage after an ischemic episode (Somjen 2001).

Role of P2 purinergic receptors on hippocampal CA1 neurotransmission 95
One 7-minute OGD episode induced the disappearance of fEPSP, which did not recover (4.2±1.9%, n=13) after superfusion with oxygenated, glucose-containing aCSF as monitored up to 80 minutes.In addition, in all control slices, AD was recorded as a DC shift with a mean peak latency of 6.2±0.2 minutes after OGD initiation and a mean peak amplitude of 6.1±0.6 mV (table 9 and figure 26A).
Figure 26. Different P2 antagonists prevent the irreversible loss of hippocampal CA1 neuro-transmission after a 7-minute OGD. A. The graph shows the time-courses of fEPSP amplitude before, during 7 minutes of OGD, and after reperfusion in normal oxygenated aCSF in the ab-sence and in the presence of 30 µM PPADS (open bar). Data (mean ± s.e.) are expressed as a percent of the baseline values. Right panels: in the same groups of slices, AD was recorded as a negative voltage shift in response to 7 minutes of OGD in control slices (upper panel) and in the presence of PPADS (lower panel). Solid bars indicate the time duration of OGD. B. Columns in the graph summarize the average recovery (mean ± s.e.) of fEPSP amplitude in CA1 hippocam-pal region after 7 minutes of OGD in control conditions or in the presence of different P2 antag-onists. Only slices showing a fEPSP recovery >15% after 15 minutes of reperfusion were includ-ed in the analysis. *P<0.001, one-way ANOVA, Newman-Keuls multiple comparison post-hoc test versus control slices.

Elisabetta Coppi96
In the presence of PPADS, a non-selective P2 antagonist, the irreversible block of synaptic transmission induced by a 7-minute OGD episode was prevented in 5 of the 6 slices tested. As shown in figure 26A, 30 µM PPADS, applied 10 minutes before, during, and 5 minutes after the OGD insult, allowed a significant recovery of the fEP-SP amplitude within 15-minutes reperfusion with oxygenated and glucose-containing aCSF (from 4.2±2.1% recovery in control slices to 79±16.6% in the presence of 30 µM PPADS, n=6). Figure 26B (right panels) shows that in this experimental group, only 3 out of 6 slices exposed to 7-minute OGD insults presented a sizeable AD (>1 mV) whose peak latency was delayed (7.1±1 minutes) by PPADS 30 µM. One of these three slices, in spite of the appearance of AD (2.5 mV, 30 s after oxygen and glucose restora-tion) recovered a significant fraction (78.5%) of the original fEPSP amplitude after 20 minutes of reperfusion.
Table 9. Effects of P2 purinergic receptors antagonists on CA1 hippocampal synaptic transmis-sion after 7 minutes of OGD.
AD appearance
(n/n)
AD peak time
(min)
AD peak amplitude
(mV)
fEPSPrecovery ≥ 15%(n/n)
fEPSP recovery (%) after 15 min reperfusion
Control (n=13) (13/13) 6.2±0.2 6.1±0.6 (1/13) 4.2±1.9
PPADS10 µM (n=4) (3/4) 6.4±0.3 6.2±0.3 (3/4) 34.3±18.7
30 µM (n=6) (3/6) 7.1±0.9 5.9±0.4 (5/6) 65.9±20*
MRS 21791 µM (n=3) (2/3) 7.5±0.6 6.8±1.8 (2/3) 42.9±29.7
10 µM (n=5) (2/5) 7±0.3 4±1.8 (4/5) 79.2±18.2*
Suramin10 µM (n=4) (3/4) 7.6±0.6 6±2.3 (2/4) 53.1±29.5
100 µM (n=3) (2/3) 6.6±0.5 4.7±1.1 (3/3) 80.5±11.9*
BBG500 nM (n=4) (2/4) 6.1±0.3 7.9±0.4 (2/4) 57.6±31.6
1 µM (n=7) (4/7) 7.9±0.3 6.7±0.8 (4/7) 52.9±16.3*
Data are taken from slices receiving 7 minutes OGD in control conditions or in the presence of different P2 purinergic antagonists. Numbers in parentheses (n/n) indicate the number of obser-vations out of investigated slices. Time is calculated from OGD initiation. The amplitude of the final fEPSP recovery is expressed as per cent of baseline fEPSP value recorded 5 minutes before OGD application. *P<0.01 from control value (one-way ANOVA, Newman-Keuls post test).
As shown in table 9, similar results were obtained in the presence of different pu-rinergic antagonists: suramin, MRS 2179 and BBG. In all cases the effect on recovery of fEPSP amplitude (figure 26B) and AD inhibition was concentration-dependent. In ad-dition, in 8 out of all 29 slices treated with the P2 antagonists, no AD appearance was observed. In the remaining 21 treated slices in which AD was recorded, its appearance was significantly delayed (7.1±0.2 minutes after OGD initiation). A significant recov-ery of fEPSP amplitude (>15% of preischemic value) was observed in 10 out of the 21 treated slices in which AD emerged.

Role of P2 purinergic receptors on hippocampal CA1 neurotransmission 97
3. Discussion
3.1 Role of P2 receptors in hippocampal neurotransmission under normoxic conditions
Our results demonstrate that ATP or its stable analogue ATPγS modulate evoked syn-aptic transmission in the CA1 region of the rat hippocampus. The main effect, observed within the first 2-3 minutes of drug application, is a reduction in fEPSP and PS ampli-tude evoked by electrical stimulation of the Schaffer collateral-commissural pathway. This effect is concentration-dependent and reversible after a few minutes of washout. Another effect elicited by both ATP and ATPγS is a significant potentiation of evoked responses, recorded after drug removal and persisting for at least 30 minutes. The in-hibitory effect observed during ATP application has already been described, and attrib-uted to P1 (Cunha et al., 1998; Dunwiddie et al., 1997b; Masino et al., 2002) or to P2 receptor stimulation (Luthardt et al., 2003; Mendoza-Fernandez et al., 2000; Rodrigues et al., 2005). Our observation that the selective A1 receptor antagonist DPCPX blocks ATP-induced inhibition of synaptic responses suggests that adenosine formed from ATP catabolism and acting at A1 receptors is responsible for synaptic depression. We would therefore expect that the ecto-ATPase inhibitors tested (ARL 67156, BGO 136 and PV4) would antagonize the ATP inhibition of synaptic responses. On the contra-ry, all the ecto-ATPase inhibitors potentiate the ATP inhibitory effect, suggesting that they unmask a significant ATP-mediated inhibitory action that is otherwise covered by adenosine acting on A1 receptors. This interpretation is supported by the observa-tion that both ATP- and ATPγS-mediated inhibitory responses are partially blocked by the nonselective P2 antagonists suramin and PPADS and the selective P2Y1 antagonist MRS 2179. These observations indicate that, in addition to P1 receptor activation, a P2 component is responsible for an ATP-mediated decrease in synaptic transmission in the CA1 area of the rat hippocampus.
The block of ATPγS effects by DPCPX was unexpected because the agonist is con-sidered a metabolically stable ATP analogue. Our result is however, consistent with previous observations that at least a fraction of ATPγS undergoes enzymatic degrada-tion and activates A1 adenosine receptors (Masino et al., 2002). An enzymatic degrada-tion of ATPγS is further supported by the result that ARL 67156 potentiates the inhibi-tory effect of this P2 agonist.
It has been suggested that, in hippocampal neurones, ATP may activate DPCPX-sensitive P2 receptors (Mendoza-Fernandez et al., 2000). The existence of a hetero-meric association between A1 and P2Y1 receptors was demonstrated by co-localiza-tion staining, co-immunoprecipitation and bioluminescence resonance energy transfer technology in HEK293T cells transfected with both A1 and P2Y1 receptors (Yoshioka et al., 2001; Yoshioka et al., 2002b) and in primary cultures of cortical hippocampal and cerebellar neurons (Yoshioka et al., 2002a). Therefore, we could hypothesize that the DPCPX sensitivity of both ATP and ATPγS inhibitory effects is attributable both to their enzymatic degradation to adenosine and to the activation of the heteromeric A1-P2Y1 receptor. The fact that, in the present work, the P2Y1 antagonist MRS 2179 reduc-es the ATPγS- inhibitory effect on fEPSP amplitude supports this notion.
Other groups have previously described a persistent ATP-induced potentiation of CA1 hippocampal neurotransmission (Fujii et al., 1995a; 1995b; 1999 and 2002; Nishi-mura et al., 1990; O’Kane et al., 1998; Wieraszko et al., 1989; Yamazaki et al., 2002). In the present work, we clearly observed this phenomenon after a prolonged application

Elisabetta Coppi98
of ATPγS during somatic recordings. When the dendritic potential was measured, the increase in fEPSP amplitude elicited by both purinergic agonists was detectable only by evoking a stimulus-response curve 15 minutes after drug removal. The increase in fEP-SP amplitude was statistically significant only at the highest stimulus intensities tested. The potentiating effect elicited by ATP and ATPγS application is completely blocked by P2 antagonists at both the dendritic and somatic level, demonstrating that it is due to P2 receptor stimulation. It has to be noted that higher stimulus strengths are needed to observe a potentiation of dendritic potentials in comparison to somatic responses and that ATP and ATPγS induce a significant potentiation of PS amplitude at lower concen-trations in respect to those required at dendritic level. Altogether, these data suggest that both presynaptic P2 receptors modulating glutamate release and postsynaptic P2 receptors modulating cell excitability are involved in potentiation of CA1 hippocampal neurotransmission. The P2 antagonists PPADS and MRS 2179 applied alone signifi-cantly decrease fEPSP amplitude. At somatic level, only suramin diminishes the evoked responses. These observations demonstrate that in the CA1 region of rat hippocampal slices there is an endogenous tonic activation of P2 receptors that contributes to excita-tory neurotransmission and is in agreement with those reported in the rat hippocam-pus (Pankratov et al., 1998; Safiulina et al., 2005) and prefrontal cortex (Luthardt et al., 2003; Wirkner et al., 2002). The varying efficacy of the P2 antagonists at the dendritic and somatic levels suggests that different subtypes of P2 receptors located in the pre- and postsynaptic compartments are involved in the excitatory effect.
The effect of P2 agonist application was also evaluated using a PPF protocol. The P2/P1 ratio was significantly increased by ATP and ATPγS application. The same effect has been described in hippocampal slices during exogenous adenosine application by other groups (Moore et al., 2003) and is attributed to an adenosine A1 receptor-medi-ated decrease of glutamate release. Our data indicate that the increase in PPF elicited by ATP application is completely blocked by DPCPX, suggesting that it is effectively due to A1 receptor stimulation after ATP conversion to adenosine. Similar results are observed for ATPγS-induced PPF increase, because it is not blocked by PPADS or MRS 2179, but only by DPCPX. These data support the hypothesis that part of ATPγS is converted to adenosine and activates A1 receptors. It should be noted that both purinergic antago-nists (PPADS and MRS 2179) applied alone induced a significant increase of PPF (P2\P1 ratio). This observation indicates that ATP contributes to excitatory neurotransmis-sion stimulating the release of glutamate. These results are in line with those obtained by Rodrigues and colleagues (Rodrigues et al., 2005) on hippocampal synaptosomes.
3.2 Role of P2 receptors in hippocampal neurotransmission during OGD
The application of purinergic antagonists before, during and after a severe (7 minutes) OGD insult allows a significant recovery of fEPSP amplitude that is never observed in control slices. The concentration range of the drug effects falls within the Ki value es-timated for all the antagonists in rat tissue (Boyer et al., 1998; Ralevic and Burnstock 1998).
The mechanism by which these drugs protect hippocampal slices from the OGD-induced irreversible loss of synaptic transmission is likely correlated to AD appearance (Pugliese et al., 2006), a phenomenon that contribute to cell damage during ischemia (for a review see Somjen 2001). In all 13 control slices, AD is recorded within the 7-minute OGD insult (mean latency of AD appearance: 6.2±0.2 minutes after OGD ini-tiation) and the recovery of fEPSP amplitude after 15 minutes of reperfusion in oxy-

Role of P2 purinergic receptors on hippocampal CA1 neurotransmission 99
genated and glucose-containing aCSF is always less than 10% of the preischemic value. In contrast, P2 antagonists both delay or block AD appearance and allow a significant recovery of neurotransmission.
Our data suggest that hippocampal P2 receptors activated during OGD by endog-enously released ATP exert a deleterious effect on CA1 neurotransmission by partici-pating in the appearance of AD.
An increase in extracellular ATP concentration during ischemia was demonstrat-ed in hippocampal slices by Jurani (Juranyi et al., 1999) and Frenguelli (Frenguelli et al., 2006) who report a peak in extracellular ATP concentration immediately before AD appearance during an OGD insult. In agreement with our results, the same au-thors show that this phenomenon is always followed by the complete loss of synaptic transmission.
Under ischemic conditions both direct and indirect actions could account for P2 receptor antagonist-mediated protection. A protective effect of P2 antagonists may be attributed to a direct inhibition of intracellular Ca2+ loading in neuron and glial cells (Schipke et al., 2002; Troadec et al., 1999). In fact, calcium is the main toxicity factor under ischemia (Dirnagl et al., 1999). Further possible indirect protective effects of P2 receptor antagonists may reside in the prevention of glutamate-evoked toxicity (Vo-lontè et al., 1996; Zona et al., 2000) and in maintaining normal energy stores (Cavaliere et al., 2001b). Antagonism of P2 receptors during ischemia might also regulate intrac-ellular pathways involved in ischemia-associated necrosis/apoptosis pathways such as expression of the glucose-regulated protein GRP75 and of the caspase-2 enzyme (Cav-aliere et al., 2001a).
Among the antagonists checked in the present model, the high selectivity of BBG indicates that P2X7 receptors are clearly involved in the deleterious effects induced by OGD in the CA1 hippocampal region. In addition, the participation of P2Y1 receptors in this effect is supported by the efficacy of MRS 2179 in blocking AD appearance and preventing the irreversible loss of neurotransmission induced by a severe OGD.
These results are in agreement with the protective effect exerted by P2 antagonists in in vitro OGD (Cavaliere et al., 2004; Pugliese et al., 2003) and in vivo ischemic con-ditions (Kharlamov et al., 2002; Lammer et al., 2006; Melani et al., 2006).
3.3 Conclusions
I conclude that P2 receptors play an important role in CA1 hippocampal neuro-transmission in both normoxic and ischemic conditions. Under normoxic condi-tions, both inhibitory and excitatory effects are observed after application of ATP or the stable analogue ATPγS. The inhibition of CA1 neurotransmission recorded during ATP application, under our experimental conditions, is mostly due to enzy-matic degradation to adenosine and subsequent activation of A1 receptors. The ATP analogue ATPγS evokes an inhibition of hippocampal neurotransmission by both P2 and A1 adenosine receptors. A later excitatory effect, as pointed out by enhancement of fEPSP and PS amplitude, is attributable only to P2 receptors. In addition, a tonic activation of P2 receptors (likely located at a presynaptic level since their block en-hances PPF) contributes to excitatory neurotransmission normally recorded in this brain area.
Under in vitro ischemic conditions (OGD), a deleterious role of ATP is suggested by the observation that P2 antagonists allow the restoration of neurotransmission after an otherwise lethal insult and block or delay the appearance of AD.


RESULTSSection 2
STUDIES ON P2 RECEPTOR MODULATION OF MEMBRANE IONIC CURRENTS BY PATCH CLAMP RECORDINGS


Elisabetta Coppi, Purines as Transmitter Molecules: Electrophysiological Studies on Purinergic Signalling in Differ-ent Cell Systems, ISBN 978-88-8453-904-5 (print), ISBN 978-88-8453-905-2 (online) © 2008 Firenze University Press
Chapter3RoleofP2Y1receptorstimulationinmediumspinyneuronsofratstriatalslices
1. Historical background
Purinergic P2 receptors have been extensively investigated in recent years and growing evidence indicates their involvement in numerous cell-to-cell communication systems. Particular interest has been dedicated to the role of these membrane receptors during cerebral development, on the basis of studies underlying a possible role of extracellular ATP as a growth and trophic factor influencing neurons and glial differentiation (Ab-bracchio et al., 1995b; Mishra et al., 2006; Stevens et al., 2000).
In particular, P2Y1 receptors are widely distributed in the CNS, and both mRNA transcription (Moore et al., 2001) and protein expression (Franke et al., 2003; Moore et al., 2000) has been demonstrated in human and rat striatum. On the other hand, there is conflicting evidence regarding their functional role in this brain region. Ikeuchi and Nishizaki (Ikeuchi et al., 1995) demonstrated that ATP application in primary cultures of striatal neurons (from 1 day old rats) activates a sustained outward potassium cur-rent sensitive to GDPβS and PKC inhibitors but insensitive to PTX. In contrast, Schei-bler and colleagues (Scheibler et al., 2004) recently reported a lack of functional effects after P2X or P2Y selective activation in medium spiny neurons of 5-26 days old rat stri-atal slices. These discrepancies might be due to differences in postnatal development of experimental animals, in parallel with the profound electrophysiological changes of medium spiny neurones during the first 3 postnatal weeks (Tepper et al., 1993). A re-cent paper from Rubini et al. (Rubini et al., 2006) demonstrated that neuronally en-riched striatal cell cultures from 1 day old rat give distinct responses to exogenous ATP application depending on whether they were cultured in NBM or DMEM growth me-dium. The same authors demonstrated that NBM-cultured striatal neurones present immature electrophysiological characteristics (wide, low amplitude action potentials, no repetitive firing, low Nav channels density on cell membrane) resembling those ob-served in “young” in vivo striatum, whereas DMEM-cultured neurones display fully-developed electrical behaviour (more hyperpolarized resting membrane potential, fast and pronounced action potential, repetitive firing) typical of adult striatal neurons. In-terestingly, only “immature” NBM-cultured striatal neurones responded to extracellu-lar ATP with an intracellular Ca2+ rise. These interesting results suggest that purinergic signalling in the rat striatum is related to brain development.
In the present work we investigated the role of P2Y1 purinergic receptor activation in medium spiny neurons of striatal slices from neonatal (1 week old) rats using the patch clamp technique, in both voltage-clamp and current-clamp mode.
Our results show that the P2Y1 agonist 2MeS-ADP can activate calcium-sensitive potassium channels during voltage-ramp depolarizations and regulate action potential firing rate in current clamp recordings.

Elisabetta Coppi104
2. Results
2.1 P2Y1 receptor activation increases the outward currents elicited by a voltage ramp depolarization in striatal medium spiny neurons
In order to investigate the presence of a purinergic modulation in the striatum we record-ed whole cell currents evoked by voltage ramp depolarization in medium spiny neurons of rat striatal slices in the absence and in the presence of a P2Y1 selective agonist.
In the first set of experiments we measured the amplitude of currents evoked by a ramp protocol before, during and after 10 minutes application of 250 nM 2MeS-ADP, a selective P2Y1 agonist. As shown in figure 27A, the current recorded in control con-ditions doesn’t show any inward component, as expected in the presence of the Na+-channel blocker TTX (100 nM), and in accordance with previous observations dem-onstrating that, in medium spiny neurons, voltage-dependent Ca2+-currents do not normally contribute to steady-state whole cell currents (Bargas et al., 1999; Hoehn et al., 1993). As shown in figure 27A, voltage ramps under control conditions were dom-inated by outward potassium conductances. After 5 minutes superfusion of 250 nM 2MeS-ADP, the outward current elicited by the ramp depolarization was markedly in-creased, and the effect was reversed after drug removal. Figure 27B shows the 2MeS-ADP activated current obtained by subtraction of the ramp current recorded in the P2Y1 agonist from the control trace. Inset of figure 27B shows the time course of cur-rent changes at +40 mV recorded before, during and after 2MeS-ADP application. The maximal effect is reached after 8 minutes of drug superfusion and is reversible after a few minutes of wash out. Figure 27C shows the 2MeS-ADP sensitive conductance acti-vated in the presence of the P2Y1 agonist in the same cell, assuming that the calculated reversal potential for potassium ions in our experimental conditions is -101.4 mV. The curve obtained can be fitted by the Boltzmann equation for voltage-dependent mem-brane conductances:
Y=gmin+(gmax-gmin)/1+exp[z(V1/2-Vm)/(RT/F)]
where gmin and gmax are the minimum and maximum value for membrane conduct-ance, V1/2 is the membrane potential at which half of the maximum conductance (gmax) is reached, z is the equivalent charge, RT and F are the gas constant, the absolute tem-perature and the Faraday constant, respectively.
The values obtained by the fitting of the 2MeS-ADP activated conductance in this cell were: V1/2 = -15.78 mV, z = 2.12 and a gmax = 10.86 nS.
Figure 28A shows the normalized average conductance activated by 2MeS-ADP in 29 cells investigated. The curve obtained can be fitted by a combination of a linear equation (to describe the non-voltage dependent membrane conductance at potentials ≤ -20 mV) and the Boltzmann relation for voltage-gated ion channels. The fitted pa-rameters are shown in the lower inset. The upper inset of figure 28A shows that the av-erage value of current amplitude elicited by the ramp protocol at a membrane potential of +40 mV is significantly increased in the presence of 2MeS-ADP (paired Student’s t-test, P=0.0065, n=29). It is to be mentioned that 16 out of the 45 cells investigated (64.4%) didn’t show any increase in the outward current during the 10 minutes super-fusion of 2MeS-ADP. Figure 28C represent a population distribution of the maximal increase in membrane conductance recorded in the presence of 2MeS-ADP in all the cells investigated.

Role of P2Y1 receptor stimulation in medium spiny neurons 105
Figure 27. Effect of 2MeS-ADP on whole cell current elicited by voltage ramps in medium spiny neurons of rat striatal slices. A. The figure shows ramp protocols recorded in a typical experi-ment. The whole cell outward current activated by the ramp protocol is increased after 5 min-utes application of 250 nM 2MeS-ADP. In this cell, the effect of 2MeS-ADP is reversed after 20 minutes of drug removal. The inset shows the ramp protocol applied. B. The graph shows the 2MeS-ADP sensitive current in the cell shown in A obtained by subtraction of the ramp current recorded in the P2Y1 agonist from the control trace. Inset: Time course of current amplitude ac-tivated by the ramp protocol at +40 mV before, during and after 2MeS-ADP application. C. The graph shows the 2MeS-ADP activated conductance in the same cell. The solid line shows the fit of the data from -80 mV to +40 mV to the Boltzmann relation giving a half-maximal voltage of -15.78 mV and equivalent charge of 2.12.

Elisabetta Coppi106
In another experimental group we recorded the ramp-evoked current before, dur-ing and after the co-application of 250 nM 2MeS-ADP and 15 µM MRS 2179, a P2Y1 selective antagonist. Figure 28B shows a representative cell in which no changes in the outward current elicited by the voltage ramp were observed during the co-application of the two drugs. The inset in figure 28B shows that no significant difference was found between the current amplitude measured at +40 mV in control conditions and during the co-application of 2MeS-ADP and MRS 2179 in 16 cells investigated (paired Stu-dent’s t-test, P>0.05).
These results indicate that the increase in the outward current amplitude recorded in the presence of 2MeS-ADP is due to P2Y1 receptor activation.
2.2 Characterization of the P2Y1-activated conductance in striatal medium spiny neurones.
In order to investigate which type/s of K-conductances are activated by the P2Y1 re-ceptor agonist in medium spiny neurones, we applied three different kinds of K-chan-nel blockers. Since only 64.4% of the cells investigated in the previous section of ex-periments showed a response to the P2Y1 agonist, the K-channel blocker was applied by superfusion after a marked response to 2MeS-ADP was observed. Firstly, we ap-plied TEA at a concentration (200 µM) that is relatively selective for blocking the large conductance-Ca+2-activated-K+-channels (BK channels). As shown in figure 29A, the application of 200 µM TEA blocked the P2Y1-activated current. The TEA-sensitive current is shown in the inset of figure 29A and is obtained by subtraction of the ramp current recorded in the presence of 2MeS-ADP minus the ramp current recorded in the presence of 2MeS-ADP + TEA. The average values obtained in 7 cells are shown in the bar graph of figure 29A (right panel). The amplitude of currents elicited by the ramp at + 40 mV is significantly increased by the application of 2MeS-ADP and this effect is blocked in the presence of TEA. The average of the TEA-sensitive conduct-ance obtained in the 7 cells investigated is shown in figure 30A (open circles) and is well fitted by the Boltzmann equation with a gmax value of 3.66 nS, a z value of 1.95 and a V1/2 value of 0.67 mV.
Since TEA could also decrease the currents recorded in the presence of 2MeS-ADP by blocking K-currents already present in control conditions, we performed a series of experiment in which we superfused TEA alone for 5 minutes before applying 2MeS-ADP. In 6 out of 8 cells, an increase in conductance elicited by the P2Y1 ago-nist was not observed, indicating that it was due to TEA-sensitive ion channels (figure 29D). It is to be noted that the application of TEA significantly reduced (paired Stu-dent’s t-test, P=0.0197, n=8) the current amplitude measured at + 40 mV in control cells; in fact TEA was also able to reduce the current amplitude below the control level in the group where it was applied after 2MeS-ADP superfusion (figure 29A, left pan-el, paired Student’s t-test, P=0.0339, n=7). In the remaining two cells, a small increase of outward current was still observed in the presence of TEA (not shown), suggesting that potassium channels other than BK could also be involved in the 2MeS-ADP me-diated effect.
In a separate set of experiments we applied the selective blocker of BK channels, iberiotoxin, after the 2MeS-ADP induced effect was observed. When a significant in-crease of the current amplitude was elicited by the P2Y1 agonist, the application of the toxin completely blocked the effect in 6 out of 7 cells (figure 29B, right and left panel). The iberiotoxin-sensitive current is shown in the inset of figure 29B, and the average

Role of P2Y1 receptor stimulation in medium spiny neurons 107
of the iberiotoxin-sensitive conductances is shown in figure 30A. It is to be mentioned that in one cell, not included in this analysis, the toxin failed to block the P2Y1-medi-ated effect, suggesting again the implication of other K-channel subtypes in the effect observed with 2MeS-ADP.
To better investigate the nature of this possibly non-BK-mediated effect, we also applied apamin (100 nM), a selective blocker of small conductance Ca2+-activated K+ channels (SK channels, figure 29B) after the 2MeS-ADP mediated effect was elicited. As shown in figure 29C, the application of apamin (10 µM) reversed the effect elicited by the P2Y1 agonist in three out of four cells investigated. The apamin-sensitive current is shown in the inset of figure 29C, and the average of the apamin-sensitive conductances
Figure 28. Averaged results showing the effect of selective P2Y1 agonist or antagonist application. A. The graph shows the averaged conductance (±s.e.) normalized to the “zero voltage” value ob-tained in 29 cells investigated. The straight line shows the fitted curve obtained by the combina-tion of a linear function and the Boltzmann equation, with parameter values shown in the grid. Inset: the column bars in the graph represent the average of current amplitude elicited by the ramp depolarization at +40 mV normalized to the control value in the 29 cells investigated. A significant increase was observed in the presence of 2MeS-ADP (**:P=0.0065, paired Student’s t test). B. In a typical experiment, no difference was found in the outward current amplitude ac-tivated by the ramp at +40 mV in the absence or in the presence of 2MeS-ADP (250 nM) and MRS 2179 (15 µM). Inset: averaged values of current amplitude at +40 mV in 16 cells investi-gated. No significant difference was found during the coapplication of the P2Y1 agonist with 15 µM MRS 2179 (P>0.05, paired Student’s t test). C. Population graph showing the distribution of responding and non responding cells in relation to the maximal value measured for the P2Y1-activated conductance.

Elisabetta Coppi108
is shown in figure 28B. As observed for the averaged 2MeS-ADP activated conductance (figure 28A), this curve shows a linear component at negative potentials (<-20 mV). For this reason we fitted the curve with a combination of a linear equation (to describe the non-voltage dependent membrane conductance at potentials ≤ -20 mV) and the Boltzmann relation described above. A summary of all the parameters obtained by fit-ting the conductances sensitive to each potassium channels blocker investigated is re-ported in the table of figure 30.
Figure 29. Effect of different potassium channel blockers on the 2MeS-ADP activated current. A. Left panel shows a single experiment where 2-MeSADP application (250 nM) was followed by the perfusion of the 2-MeSADP + 200µM TEA. The current increase observed in the presence of the P2Y1 agonist was completely blocked by TEA. Inset: in the same cell, the TEA-sensitive current obtained by subtraction of the ramp current recorded in the presence of 2-MeSADP + TEA from that observed with the P2Y1 agonist alone. Right panel: average current amplitudes recorded at +40 mV in each cell of this experimental group. *: P<0.05 from the control group, **: P<0.05 from 2-MeSADP group, paired Student’s t test. A similar protocol was performed in the presence of 200 nM iberiotoxin (B) and 100 nM apamin (C). D. Left panel: when 200 µM TEA is applied before the P2Y1 agonist, no increase in ramp-evoked outward current was observed. The right panel shows that in this group TEA applied alone significantly reduced the total outward current evoked by the voltage ramp (P=0.0197, paired Student’s t test).

Role of P2Y1 receptor stimulation in medium spiny neurons 109
2.3 Single channel recordings show SK potassium channel opening following P2Y1 receptor activation
In order to investigate further the mechanisms underlying the results obtained with voltage and current clamp experiments in whole cell configuration, we investigated the effect of 2MeS-ADP during cell-attached single channels recordings. Patch current was measured for two minutes during the imposition of different membrane potentials to the recording pipette, before and after 5 minutes application of 250 nM 2MeS-ADP. In a total of 14 patches recorded from the soma of medium spiny neurons, only 3 showed openings of SK-like potassium channels, and none of them included BK-like currents, presumably reflecting a low density of these two kinds of ionic channels at the soma level of striatal medium spiny neurons.
Figure 30. Averaged TEA-, iberiotoxin-, and apamin-sensitive conductances compared to the P2Y1-activated conductance. A. Filled circles represent the averaged P2Y1-activated conduct-ance in 29 cells investigated. The solid line is the curve obtained by fitting the sum of a linear function and the Bolzmann equation. Open circles represent the averaged TEA-sensitive con-ductance after the application of 2MeS-ADP. Thick dashed line is the fitted curve of a Boltzmann equation. B. Filled squares show the iberiotoxin-sensitive conductance, thin solid line is the fit-ted Boltzmann equation. Open squares indicate the apamin-sensitive conductance. The table shows the Boltzmann parameters obtained by fitting each curve.

Elisabetta Coppi110
Figure 31. Single channel recordings in cell-attached configuration show the activation of SK channels in the presence of 2MeS-ADP. A. Representative recordings of 20 s duration from the same cell in control conditions (upper panels) and in the presence of 250 nM 2MeS-ADP (lower panels) at two different pipette potentials. The potential values indicated in the figure represent the membrane potential calculated assuming a resting membrane potential of – 80mV. Channel openings are shown as upward deflection of the current traces. Calibration bars: 2 s, 1 pA.
However, in some cells, the application of 2MeS-ADP revealed the presence of po-tassium channels in the patch pipette (figure 31). On the basis of the current-voltage relationship, the estimated conductance of such channels was 35pS, which is consistent with SK channel activity.
2.4 2MeS-ADP decreases the firing rate of medium spiny neurons recorded under the current-clamp mode in striatal slices
In order to gain insight into possible physiological effects of P2Y1 receptor activation in striatal medium spiny neurones, we investigated the effects of 2MeS-ADP (250 nM) on the firing pattern of these cells in current-clamp recordings.
Ten subsequent steps of current injection (1 s duration, 10 pA each) from sub-threshold to suprathreshold potentials were performed from a resting potential of –70 mV, to establish the threshold value for spiking activity in each cell investigated. The amplitude of the first step current injection was chosen on the basis of the electrophysi-ological characteristics of each cell recorded, and varied from 2 to 50 pA.
Under control conditions, increasing current injections resulting in suprathresh-old voltages cause the cell to fire with increasing frequency (figure 32A, thin trace). Little frequency adaptation was observed during current pulses (see table 10), as pre-viously described for medium spiny neurons (Calabresi et al., 1987; Kawaguchi et al., 1989; Kawaguchi 1992; Kawaguchi 1993), and a medium after hyperpolarization po-tential (mAHP) was usually present after each action potential. No slow after hyperpo-larization potential (sAHP) was observed at the end of the depolarising step, as expect-ed for this kind of cell (Kawaguchi 1992; Kawaguchi 1993) particularly during the first postnatal week (Tepper et al., 1993; Tepper et al., 1998). The current clamp parameters measured in 11 cells investigated are shown in table 10.
In the presence of 2MeS-ADP (250 nM) the resting potential was usually more nega-tive than the control value, and the current injected was adjusted to maintain the resting membrane potential at -70 mV. After 5 minutes application of the selective P2Y1 agonist, a significant decrease in the frequency of action potential firing (figure 32A, thick trace; figure 32B, open circle, thick line) was observed in all 11 cells investigated (paired Stu-dent’s t-test, P=0.0346). We also recorded an increase of the first action potential latency during the first step of current injection (figure 32C, left panel), of the interspike-interval

Role of P2Y1 receptor stimulation in medium spiny neurons 111
(ISI) between the first and the second action potentials (figure 32C, central panel, paired Student’s t-test, P<0.01), as well as between the second and the third (figure 32C, right panel, paired Student’s t-test, P<0.001) in the presence of 2MeS-ADP. It has been demon-strated that calcium-dependent potassium conductances, mainly SK channels, are crucial factors in determining firing frequency and adaptation in medium spiny neurons (Pineda et al., 1992), so these results are in agreement with the purinergic-mediated activation of Ca2+-dependent K+ currents observed during our voltage ramp experiments.
In contrast, other current-clamp parameters like action potential threshold, depo-larization and hyperpolarization rate (mV/ms), amplitude and duration (the time be-tween the threshold and the point where the membrane potential crossed the threshold value during the depolarization phase) were not significantly affected by 2MeS-ADP (table 10). Surprisingly, the mAHP amplitude, known to depend on SK channel activa-tion, was not significantly increased by the P2Y1 agonist.
Figure 32. Effects of 2MeS-ADP application on firing activity of medium spiny neurones dur-ing current clamp recordings. A. Traces recorded in the same cell stimulated by suprathreshold current injections in control conditions (thin line) and after 5 minutes application of 250 nM 2MeS-ADP (thick line) are superimposed. Each trace shows the step depolarization in response to a 100 pA current injection. Note that in the presence of the selective P2Y1 agonist the spike frequency is greatly reduced. The inset shows the stimulation protocol used. B. Average number of action potentials obtained in each group investigated as a function of the membrane potential reached by the current injection (X axis), assuming an imposed resting potential of -70 mV in all cells. For each group of cells the trend line of action potential frequency as a function of the membrane potential reached by the step pulse is shown. Note that iberiotoxin does not modify the firing frequency recorded in the presence of 2MeS-ADP. C. A significant difference in the latency of the first action potential (left panel) was found in the presence of 2MeS-ADP. The la-tency between the first and the second spike (inter-spike interval: ISI 1st-2nd: central panel) and between the second and the third spike (ISI 2nd-3rd: right panel) is increased in the presence of the P2Y1 agonist (in particular during the first suprathreshold stimulation).
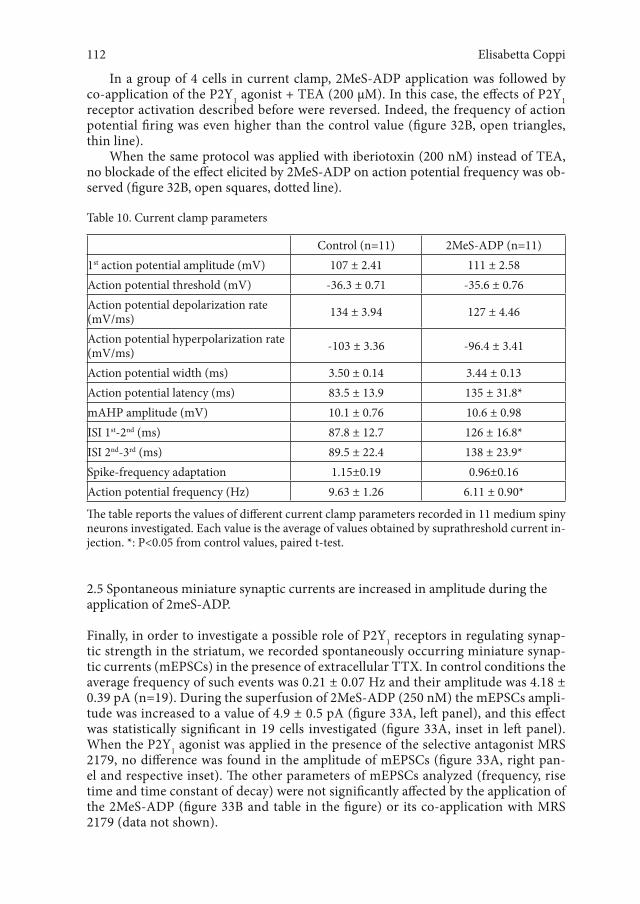
Elisabetta Coppi112
In a group of 4 cells in current clamp, 2MeS-ADP application was followed by co-application of the P2Y1 agonist + TEA (200 µM). In this case, the effects of P2Y1 receptor activation described before were reversed. Indeed, the frequency of action potential firing was even higher than the control value (figure 32B, open triangles, thin line).
When the same protocol was applied with iberiotoxin (200 nM) instead of TEA, no blockade of the effect elicited by 2MeS-ADP on action potential frequency was ob-served (figure 32B, open squares, dotted line).
Table 10. Current clamp parameters
Control (n=11) 2MeS-ADP (n=11)1st action potential amplitude (mV) 107 ± 2.41 111 ± 2.58Action potential threshold (mV) -36.3 ± 0.71 -35.6 ± 0.76Action potential depolarization rate (mV/ms) 134 ± 3.94 127 ± 4.46
Action potential hyperpolarization rate (mV/ms) -103 ± 3.36 -96.4 ± 3.41
Action potential width (ms) 3.50 ± 0.14 3.44 ± 0.13Action potential latency (ms) 83.5 ± 13.9 135 ± 31.8*mAHP amplitude (mV) 10.1 ± 0.76 10.6 ± 0.98ISI 1st-2nd (ms) 87.8 ± 12.7 126 ± 16.8*ISI 2nd-3rd (ms) 89.5 ± 22.4 138 ± 23.9*Spike-frequency adaptation 1.15±0.19 0.96±0.16Action potential frequency (Hz) 9.63 ± 1.26 6.11 ± 0.90*
The table reports the values of different current clamp parameters recorded in 11 medium spiny neurons investigated. Each value is the average of values obtained by suprathreshold current in-jection. *: P<0.05 from control values, paired t-test.
2.5 Spontaneous miniature synaptic currents are increased in amplitude during the application of 2meS-ADP.
Finally, in order to investigate a possible role of P2Y1 receptors in regulating synap-tic strength in the striatum, we recorded spontaneously occurring miniature synap-tic currents (mEPSCs) in the presence of extracellular TTX. In control conditions the average frequency of such events was 0.21 ± 0.07 Hz and their amplitude was 4.18 ± 0.39 pA (n=19). During the superfusion of 2MeS-ADP (250 nM) the mEPSCs ampli-tude was increased to a value of 4.9 ± 0.5 pA (figure 33A, left panel), and this effect was statistically significant in 19 cells investigated (figure 33A, inset in left panel). When the P2Y1 agonist was applied in the presence of the selective antagonist MRS 2179, no difference was found in the amplitude of mEPSCs (figure 33A, right pan-el and respective inset). The other parameters of mEPSCs analyzed (frequency, rise time and time constant of decay) were not significantly affected by the application of the 2MeS-ADP (figure 33B and table in the figure) or its co-application with MRS 2179 (data not shown).

Role of P2Y1 receptor stimulation in medium spiny neurons 113
3. Discussion
There is clear evidence in the literature that P2Y purinergic receptors are expressed in the striatum. In fact, mRNA for P2Y1,2,4,6,11 (Moore et al., 2001) and P2Y1 protein ex-pression (Franke et al., 2003; Moore et al., 2000) have been found in human and rat striatum. However, there are conflicting reports of whether these physiologically ex-pressed receptors have a functional role in this brain area (Ikeuchi et al., 1995; Schei-bler et al., 2004).
In the present work we found that the activation of P2Y1 receptors by a selective ag-onist induces an increase in the outward potassium currents in medium spiny neurons of rat striatal slices in 64.4% of cells. The P2Y1-activated conductance shows a linear I-V relationship at potentials more negative than -20 mV, and a sigmoidal I-V curve at more positive potentials. In fact, the averaged P2Y1-activated conductance recorded in 29 cells investigated is well fitted by the combination of a linear equation and the Boltz-mann relation for voltage-gated ion channels, as shown in figure 26A. We conclude
Figure 33. Effect of 2MeS-ADP on spontaneous mEPSCs in medium spiny neurons. A. Left pan-el: the three traces superimposed represent the average of mEPSCs recorded in a single cell be-fore, during and 5 minutes after the application of 2MeS-ADP. The average mEPSCs obtained in the presence of the P2Y1 agonist is increased (solid line). The inset shows that a significant increase in mEPSCs amplitude was observed in 19 cells investigated (*: P<0.05 versus control, paired Student’s t test). Right panel: in another cell, no difference was found between the average of mEPSCs measured in control conditions (thin line) and during the coapplication of 2MeS-ADP + MRS 2179 (solid line). B. mEPSCs parameters are summarizad in the table, with respec-tive P values from a paired Student’s t test.

Elisabetta Coppi114
that the ion carrying that current is K+, since the reversal potential for the 2MeS-ADP activated current is around –100 mV (see figure 27A), close to the Nernst-calculated potassium equilibrium in our experimental conditions (Ek=-101 mV). Another can-didate for the outward current observed in the presence of 2MeS-ADP could be chlo-ride, since in our recording conditions the internal and external solutions contain 12 mM and 132.5 mM chloride ions respectively. However chloride is unlikely to carry the current observed in the presence of 2MeS-ADP, since the current reverses at potentials around -100 mV, whereas the calculated chloride equilibrium potential in our experi-mental conditions is ECl=-61.4 mV.
A relatively high percentage (35.6%) of medium spiny neurons didn’t respond to the P2Y1 agonist application with an increase in outward current. A possible explana-tion for this phenomenon is the presence of different cell populations of striatal me-dium spiny neurons presenting different expression patterns of purinergic receptors. In fact, in the last few years, emerging evidence demonstrates that medium spiny neu-rons are not such an homogeneous cell population as they were considered in the past. For example, it has been demonstrated that medium spiny neurons can be divided into enkephalin and P-substance expressing neurons, on the basis of different staining for these two histological markers (Gerfen et al., 1988; Izzo et al., 1987). It is reasonable that these two different subpopulations of cells (not distinguishable in our experimen-tal conditions) express distinct pathways of P2 purinergic receptors. This hypothesis is consistent with recent results from Scheibler and colleagues (Scheibler et al., 2004) showing that only 50% of striatal medium spiny neurons from 10-14 day old rats ex-press the P2Y1 purinergic receptor.
The half maximal activation potential of the 2MeS-ADP activated conductance is -9 mV, and the maximal value of conductance is reached at about +20 mV, whereas at more positive potentials the total outward conductance tends to decrease. This charac-teristic is typical of Ca2+-activated K+ channels, where a component of the calcium in-crease is from voltage dependent calcium channels that would be expected to reach a maximum around 0 mV.
Three different kinds of calcium-activated potassium channels have been described: the big conductance (BK), the intermediate conductance (IK) and the small conduct-ance (SK) calcium-activated potassium channels. Both BK and SK channels are found in mammalian brain, whereas IK channels are present only in a few non-neuronal cell types, such as epithelial and red blood cells (Gardos 1958; Ishii et al., 1997). In particu-lar, BK and SK channels have been histochemically and functionally described in stri-atal neurones (Knaus et al., 1996; Pineda et al., 1992), and are shown to represent more that 50% of outward currents in acutely dissociated medium spiny neurones (Bargas et al., 1999). BK channels are known to be voltage-sensitive, in fact intracellular cal-cium rise and membrane depolarizations both enhance the channel open probability (Bargas et al., 1999; Horrigan et al., 2002). In contrast, SK channels are voltage-inde-pendent; therefore we hypothesize that P2Y1-mediated activation of SK channel could be responsible of the linear region of 2MeS-ADP activated conductance, whereas BK channel activation could determine the sigmoid region at positive potential values.
These conclusions were confirmed in the present study by the use of selective blockers. BK channels are the most likely K-channels blocked by sub-millimolar con-centrations of TEA (Blatz et al., 1986), by iberiotoxin (except for BK channels contain-ing the β4 subunit, see: Faber et al., 2003; Meera et al., 2000) and by charybdotoxin (Galvez et al., 1990). IK channels are blocked by charybdotoxin but not iberiotoxin or apamin (Ishii et al., 1997), whereas mammalian SK channels are very sensitive to block
Role of P2Y1 receptor stimulation in medium spiny neurons 115
by apamin, with IC50 values found in the pM range (Kohler et al., 1996). In voltage clamp experiments of the present study either TEA at micromolar concentration, ibe-riotoxin or apamin were able to significantly block the current activated by 2MeS-ADP, confirming the involvement of both BK and SK channels in the P2Y1-mediated effect. It should be noticed that the blockade of outward currents elicited by TEA was greater than that observed with iberiotoxin or apamin, even though the concentrations of both toxins (iberiotoxin: 200 nM; apamin: 100nM) were largely saturating (complete block-ade at 10 nM for both toxins has been demonstrated in striatal neurons: (Bargas et al., 1999; Nisenbaum et al., 1996). It is interesting that the application of 200 µM TEA af-ter the P2Y1 agonist caused a significant reduction of the total outward current even in comparison to control values (figure 29A), whereas iberiotoxin and apamin did not. In addition, TEA was also able to significantly reduce the whole cell current in the absence of the P2Y1 agonist (figure 29D). This may be due to some other potassium channels, not blocked by iberiotoxin or apamin but blocked by low TEA concentrations, already activated in control conditions, such as IK channels. In fact, Bargas and colleagues (Bargas et al., 1999) demonstrated that in medium spiny neurones there is a residual outward current (sensitive to extracellular cadmium application) not blocked in the presence of both apamin and iberiotoxin at saturating concentrations.
The voltage-dependence of K-blocker-sensitive conductances found in the present work was well described by a Boltzmann relationship. This result was expected for TEA and iberiotoxin-sensitive conductances, if these reflect blockade of voltage-dependent BK channels. Surprisingly, the apamin-sensitive conductance obtained in the present work and shown in figure 28B presents a linear g-V relationship at potentials negative to -20 mV but also a voltage-sensitive component at higher potentials, which is fitted by the Boltzmann relationship. This is probably a consequence of the voltage-sensitivity of calcium influx through voltage-activated calcium channels that activates the SK con-ductance. In fact, in cholinergic interneurones of rat striatum it has been demonstrated that SK channels are activated by calcium influx from N-type calcium channels, as well as from the classical calcium release from intracellular stores (Goldberg et al., 2005).
In current clamp experiments under control conditions, we recorded the typical electrophysiological characteristics previously described for medium spiny neurons at this maturational stage (Kawaguchi 1992; Kawaguchi 1993; Tepper et al., 1993): a rest-ing membrane potential around -80 mV, little spike frequency adaptation, little AHP, high threshold for action potential firing and no visible sAHP after the current step (see table 10). In the presence of 2MeS-ADP, we found a significant reduction of firing fre-quency induced by positive current injections, as well as an increase in the first spike latency and an increased adaptation between the first three action potentials in com-parison to control values. This data is consistent with the idea of SK channel activation by the P2Y1 agonist. It has been shown that the frequency of action potential firing in striatal medium spiny neurones is finely tuned by SK channels, which play an impor-tant role during the interspike period because they shape the AHP amplitude. This is probably due to their high calcium-sensitivity at hyperpolarized potentials (not ob-served for BK channels) that leads to more long-lasting currents than those mediated by BK channels. In contrast, BK channels are mostly implicated in shaping action po-tential repolarization since they are characterized by fast activation and inactivation ki-netics. In fact, iberiotoxin was unable to reverse the spike frequency decrease caused by P2Y1 receptor activation, confirming that BK channels are not involved in determining action potential frequency. Surprisingly, micromolar concentrations of TEA (that are not expected to block SK channels) markedly reverse the P2Y1-mediated effect, caus-

Elisabetta Coppi116
ing an increase in firing frequency even in comparison to control conditions. We may hypothesise that, in this case, the action of TEA is due to the blockage of calcium-de-pendent potassium channels other than BK, such as the IK subtype. Alternatively, it can be hypothesised that TEA is blocking other potassium currents tonically activated in medium spiny neurons but not related to the P2Y1 effect (for example the M-cur-rent, since KCNQ2 formed M-channels are blocked by submillimolar concentrations of TEA, see (Robbins 2001; Shapiro et al., 2000). From these data we conclude that, in current clamp mode, SK channel activation elicited by the P2Y1 agonist predominates over the BK channel-mediated actions in determining the firing rate of medium spiny neurones. The lack of increase in AHP amplitude during 2MeS-ADP application is sur-prising if we expect that P2Y1 receptors activate SK channels. A possible explanation is that a long-lasting hyperpolarization after thalamic or cortical stimulation in vivo is recorded in medium spiny neurons only after the third postnatal week (Tepper et al., 1993; Tepper et al., 1998), when the electrophysiological characteristics of these cells reach their mature phenotype. It could be that the lack of AHP increase in our experi-ments reflects some immature characteristic of this cell type.
The results obtained during the recordings of mEPSCs also confirm that P2Y1 re-ceptors may influence striatal neurotransmission. As application of 2MeS-ADP caused a significant increase in the amplitude, but not in the frequency, or time course of such events, it may be that P2Y receptor activation can modulate the strength of synaptic in-puts in these neonatal neurones.
An increase in mEPSC amplitude is usually associated with increased strength of the synaptic circuitry, since the synapse efficacy is potentiated. This phenomenon is usually explained by an increase in the number of postsynaptic receptors, in this case glutamate AMPA receptors, and is also described as “chemical potentiation” (chemi-cal LTP).
In vivo (but not in vitro) medium spiny neurons show some spontaneous oscilla-tions of membrane potential in the subthreshold range, and different kinds of potas-sium channels play an important role in determining such phenomenon. These mem-brane potential oscillations, known as “up” and “down” states (Wilson et al., 1981; Wilson 1993), reflect a similar behaviour in corticostriatal projecting neurons (medi-al and lateral agranular layers: Stern et al., 1997; infragranular layer: (Plenz and Kitai 1998). During the “up” state the medium spiny neuron can show spontaneous spiking activity, with bursting events rarely observed, whereas during the “down” state no firing is recorded. On the basis of data obtained in the present work, we hypothesise that P2Y1 receptors, by modulating SK and BK channels, may play an important role in determin-ing the pattern of such oscillations in neonatal animals and influence the spontaneous firing activity of medium spiny neurones in vivo.
Finally, it is important to note that this study has been performed on 7 day old rats, so the observed effect of P2Y1 receptors activation may be relevant to this time window of striatal development. It has been extensively described that the electrophysiological characteristics of 7 day old rat medium spiny neurons are profoundly different from the adult phenotype (Sharpe et al., 1998; Tepper et al., 1993; Tepper et al., 1998). These results are in agreement with the fact that Ikeuchi and Nishizaki reported an ATP-me-diated increase in outward K+ conductances in cultured medium spiny neurones from 1-day old rats (Ikeuchi et al., 1995), whereas Scheibler and colleagues demonstrated a lack of P2Y-mediated effects in striatal medium spiny neurons from older rats (Schei-bler et al., 2004). Further support for this idea comes from a recently published paper by Rubini and co-workers (Rubini et al., 2006). In that work the authors demonstrated

Role of P2Y1 receptor stimulation in medium spiny neurons 117
that neuronally enriched striatal cell cultures from 1 day old rats respond to extracel-lularly applied ATP with a transient increase in intracellular Ca2+ concentration only if they are grown in NBM medium, which allows the maintenance of an “immature” elec-trophysiological profile (no repetitive firing, depolarized resting membrane potential, low density of INa) that is lost in normal DMEM cultured neurones.
The selective expression-activation of P2Y1 receptors during early developmental stages of postnatal life could be correlated with particularly interesting ATP effects on cell development and proliferation recently reported by different authors. For exam-ple, an increased proliferation and migration of neuronal (Hogg et al., 2004; Ryu et al., 2003; Scemes et al., 2003) and glial (Agresti et al., 2005; Weissman et al., 2004) progeni-tor cells has been linked to the stimulation of purinergic P2 receptors. On this basis, it can be envisaged that there is an important role for ATP during ontogenesis in the striatum.


Elisabetta Coppi, Purines as Transmitter Molecules: Electrophysiological Studies on Purinergic Signalling in Differ-ent Cell Systems, ISBN 978-88-8453-904-5 (print), ISBN 978-88-8453-905-2 (online) © 2008 Firenze University Press
Chapter4RoleofpurinenucleotidesinculturedhMSCs:releaseofATPandactivationofP2receptors
1. Historical background
In the last few years, several studies have demonstrated an interesting trophic role ex-erted by P2 receptor activation in various lineages of differentiated (Arthur et al., 2005 and 2006) and undifferentiated cells. Haematopoietic stem cells (Lemoli et al., 2004; Sak et al., 2003), neuronal progenitor stem cells (Hogg et al., 2004; Ryu et al., 2003) and oligodendrocyte progenitors (Agresti et al., 2005) respond to extracellular ATP with increased proliferation, differentiation and/or migration by intracellular signal-ling cascades that are similar or synergistic to those activated by numerous growth fac-tors. In different cell systems, the trophic role of extracellular ATP is correlated with the occurrence of spontaneous intracellular Ca2+ waves, a self-renewing mechanism pro-moting periodic oscillation of intracellular Ca2+ levels that plays a crucial role in cellu-lar proliferation and differentiation (Clapham 1995). It has been demonstrated that a number of cultured cells (Gerasimovskaya et al., 2002; Gomes et al., 2005b; Henriksen et al., 2006; Scemes et al., 2003) can release ATP that, in an autocrine/paracrine man-ner, propagate Ca2+ waves. It was demonstrated that ATP-mediated propagation of Ca2+ waves through radial glial cells modulates neurogenesis in the embryonic rat neocortex (Weissman et al., 2004).
There has been great interest lately in human mesenchymal stem cells (hMSCs), a population of undifferentiated stromal stem cells derived from human adult bone mar-row (Caplan et al., 2001; Pittenger et al., 1999; Reyes et al., 2001 and 2002) that can be isolated, expanded in culture, and stimulated to differentiate into a variety of cell line-ages (bone, cartilage, muscle, marrow stroma, tendon, fat) including neurones (Jiang et al., 2002). Because large numbers of MSCs can be generated in culture, tissue-engi-neered constructs principally composed of these cells may be re-introduced into the in vivo setting. It has been recently demonstrated that in vivo transplantations of hMSCs into the post-ischemic brain (Zhao et al., 2002) or infarcted myocardium (Min et al., 2002; Shake et al., 2002) of experimental animals significantly improved tissue func-tions, suggesting a possible role of these cells in the therapy of degenerating patholo-gies (Benvenuti et al., 2006; Schwarz et al., 1999). In spite of the huge employment of hMSCs in experimental cell transplantation in the last few years, the precise mecha-nisms determining in vivo migration and differentiation of engrafted hMSCs into the host tissue are still unclear.

Elisabetta Coppi120
2.Results
Experiments were conducted on successfully culture-expanded hMSCs. A morpholog-ically homogeneous population of fibroblast-like cells with more than 90% confluence was seen after 14 days. Thereafter, primary cultured (P0) cells were trypsinized and re-plated and, after the first passage in culture (P1), the cells grew exponentially, requir-ing weekly passages.
Flow cytometric analysis was used to assess the purity of hMSC cultures, which appeared uniformly positive for CD29, CD44, CD166, CD90, CD73, HLA-ABC and CD105. HLA-DPQR was expressed in less than 2% of the population. There was no de-tectable contamination of haematopoietic cells: in fact, markers of haematopoietic lin-eage, CD14, CD34 and CD45, were not detectable (figure 34). This pattern of cellular markers was stably expressed till P9 (data not shown).
Once a stable hMSC line was obtained (figure 35A), we investigated whether it ton-ically released ATP into the culture medium. As shown in figure 35B, the extracellular ATP concentration measured in the medium containing hMSCs, 24 h after a medium change, was 7.6±0.57 nM. This value was significantly higher than that measured in the medium without cells, which was 0.3±0.11 nM (P<0.0001, unpaired Students’t test; n=11). Since no difference in ATP concentration was found at different cell passages in culture (P0-P5), all the results were plotted together.
Figure 34. Flow cytometric analysis of surface adhesion molecules on human mesenchymal stem cells. Cells were labeled with monoclonal antibodies specific for molecules indicated in each flow cytometric histogram (negative for CD45, HLA-DP DQ DR, CD34, and CD14 and positive for CD166, HLA-ABC, CD105, CD90, CD44, CD29, and CD73). Abbreviations: FITC, fluores-cein isothiocyanate; HLA, human leucocyte antigen; PE, phycoerythrin.

Role of purine nucleotides in cultured hMSCs 121
Unfortunately, in our study, we could not determine ATP concentration in the presence of the ecto-ATPase inhibitor, ARL 67156, that prevents degradation of ATP, because the drug interfered with the luciferin/luciferase assay (Melani et al., 2005).
2.1 Electrophysiological experiments
To investigate the presence and role of P2 receptors in hMSCs we used the patch-clamp technique to record whole-cell currents before and after the application of purinergic agonists and antagonists. The present work was carried out on 36 cells with a mean membrane resistance of 408.9± 78.6 MΩ, a mean membrane capacitance of 47± 5.9 pF and a mean membrane potential of -19.6± 3.2 mV. All the experiments were carried out at room temperature on cells from P0 to P5 passage in culture.
Exogenous ATP application modulates ionic membrane currents in hMSCs in culture.
In a first group of cells we studied the effects of ATP (10 µM, 5 minutes applica-tion, n=19) on hMSCs on the overall currents elicited by a voltage ramp protocol (in-set figure 36A). In these experimental conditions, ATP elicited two different responses, shown in figures 36A-B and 36C-D, respectively.
Figure 35. hMSCs in culture tonically release ATP. A. The figure shows adherent hMSCs as they appear in a primary culture (P0) 14 days after plating. B. Extracellular concentrations of ATP were measured with the luciferine/luciferase bioluminescence assay method in the medium con-taining hMSCs (50.000 cells/well) and in control medium not containing cells. Data are ex-pressed as mean ± s.e., n=11. Unpaired Student’s t test: *P<0.0001 vs medium alone.

Elisabetta Coppi122
In figure 36A, we reported that ATP enhanced the outward currents at membrane potentials more positive than -20 mV, with a modest increase in the inward compo-nent at more negative voltages. The ATP-sensitive current, obtained by subtraction of the control ramp from the trace recorded in the presence of ATP, showed a reversal po-tential of -30.8 mV (figure 36B). Similar results were obtained in 9 cells, that present-ed a mean resting membrane potential of -33.3±5.9 mV in control conditions and of -33.4±5.8 mV during ATP application (P>0.05, paired Student’s t-test). The effect in-duced by the P2 purinergic agonist was maximal since no difference was found when ATP was applied at a higher concentration (30 µM, n=3, not shown). The maximal increase in the outward currents was reached after 5 minutes of ATP application and was reversible after drug washout (inset of figure 36B). In this group of cells, the aver-age current amplitude at +40 mV was 639.6±129.8 pA in control conditions and 1021± 235.4 pA after 5 minutes of ATP application (P<0.05, paired Student’s t-test).
Figure 36C shows the other response elicited by ATP in hMSCs on overall mem-brane currents evoked by the ramp protocol. In this case, the effect produced by 10 µM ATP was an increase in inward currents without significant changes in outward cur-rents. The ATP-sensitive current presented a reversal potential of 0.5 mV (figure 36D). A similar response was obtained in 6 cells that presented a mean resting membrane potential of -15.27±3.2 mV in control conditions. The mean resting membrane poten-tial measured at the peak of ATP effect was of -10.31±2.8 mV, indicating a significant depolarization induced by ATP (P<0.01, paired Student’s t-test). The maximal effect was reached after 3 minutes of ATP application and it desensitised before the end of drug superfusion (inset of figure 36D). The average current amplitude at -90 mV was -162.2±76.8 pA in control and -292.5±149.2 pA after 3 minutes of ATP superfusion (P<0.01, paired Student’s t-test).
In 4 out of 19 cells investigated in this experimental section no effects of ATP on membrane currents were observed.
From this first set of experiments we conclude that 79% of hMSCs respond to the application of exogenous ATP. These ATP-responding cells can be divided into two subgroups. One group presented a negative membrane potential (-33.3±5.9 mV) and responded to exogenous ATP superfusion with the activation of an outwardly rectify-ing ATP-sensitive current, with a reversal potential of -45.9±2.5 mV. The other group of hMSCs presented a more depolarized membrane potential (-15.27±3.2 mV) and re-sponded to exogenous ATP with the activation of an inwardly rectifying ATP-sensitive current. This effect was accompanied by membrane depolarization. Cell capacitance, as a measure of cell size, was not different in both subgroups. Similarly, cell passage in culture (P0 and P5) did not influence ATP-mediated responses, and cells from P0 to P5 were pooled together.
In order to investigate the properties of the outward currents activated by ATP, we studied the effects of ATP on membrane currents elicited by a voltage step protocol.
As shown in figure 37A, a consistent increase in outward currents evoked by the step protocol was induced in a typical cell by 10 µM ATP starting from membrane po-tentials of +40 mV. The ATP-sensitive current showed a more evident increase in the transient early phase followed by a moderate but significant enhancement in the late sustained current. Figure 37B showed the averaged I-V plot of ATP-sensitive current obtained in this group of cells (n=3). To isolate the late sustained currents activated by ATP, we used another step protocol starting from a holding potential of -40 mV (inset of figure 37C) that inactivated transient conductances. As expected, in this case only slowly-activating, sustained currents were evoked by this protocol, and their amplitude

Role of purine nucleotides in cultured hMSCs 123
was increased in the presence of 10 µM ATP (figure 37C). Figure 37D shows the aver-aged I-V plot of ATP-sensitive current obtained in this group of cells (n=5).
The effects of ATP were further investigated in the presence of different P2 purin-ergic antagonists. In the presence of a selective P2Y1 receptor antagonist, MRS2179 (10 µM), ATP (10 µM) did not induce any effect on ionic currents, evoked either by the ramp (figure 38A) or by the step protocol (figure 38B), and on resting membrane po-tential. Figure 38C shows that the mean effects of ATP on both inward and outward currents, measured at -90 mV and +40 mV respectively, were blocked in the presence of MRS2179 (figure 38C). In contrast, the other P2 antagonist tested, the non-selective PPADS, was efficacious in blocking only the ATP-induced increase in inward conduct-ances, also revealing a membrane hyperpolarization during ATP application of from -16.3±3.7 mV to -23.9±2.6 mV.
Figure 36. Exogenous ATP increases non-desensitising outward currents and/or desensitising in-ward currents in hMSCs in the whole-cell patch-clamp configuration. A. Typical experiment in which ATP evoked the increase of outward currents in an isolated hMSC. Inset: voltage ramps (inset: from -90 to +40 mV, ms duration) were applied before and during 10 µM ATP superfusion. B. ATP-sensitive current recorded in the same cells and obtained by subtraction of the current re-corded at the maximal peak of effect (after 5 minutes of ATP application) from the control trace. Inset: time course of current amplitude activated by the ramp protocol at +40 mV before, during and after 10 µM ATP application. Each point in the graph represents the mean ± s.e. of 9 experi-ments in which ATP increased outward currents. C. Typical experiment in which ATP evoked the increase in inward currents in an isolated hMSC. Inset: voltage ramps were applied before and during 10 µM ATP superfusion. D. ATP-sensitive current recorded in the same cells and obtained by subtraction of the current recorded at the maximal peak of effect (after 3 minutes of ATP ap-plication) from the control trace. Inset: time course of current amplitude activated by the ramp protocol at -90 mV before, during and after 10 µM ATP application. Each point in the graph rep-resents the mean ± s.e. of 6 experiments in which ATP enhanced inward currents.

Elisabetta Coppi124
2.2 Effects of exogenous ATP in potassium-free conditions
To better clarify the nature of the ATP-sensitive currents in hMSCs, we investigated the effect of ATP under K+-free conditions by substituting all the K+ ions of the intracellu-lar and extracellular solution with equimolar Cs+. In this experimental condition cells showed a mean resting membrane potential of -5.9±2.8 mV. As shown in figure 39A, 10 µM ATP increased the overall currents evoked by the ramp protocol, mainly affecting in-ward currents, as indicated also by the ATP-sensitive current (figure 39A, right panel). The same effect was recorded in all 6 cells tested. The maximal increase in inward cur-rent was reached after 3 minutes of ATP superfusion, and it desensitised after 5 minutes of agonist application (figure 39B). The averaged ATP-sensitive current showed a reversal potential of -6.5±0.6 mV, indicating the non-specific nature of the ATP-activated con-ductance (figure 39C). It should be mentioned that this effect resembles that observed in the presence of ATP in a group of cells, and shown in figure 36C. The fact that in K+-free conditions ATP affected mainly inward current, suggests that the ATP-sensitive outward currents, also shown in figures 36A and 37, are carried by K+ ions.
Figure 37. Exogenous ATP increases both early and late phase of outward currents in hMSCs. A. Representative current traces recorded in a hMSC by using the voltage step protocol (inset) in the absence (left panel) and in the presence of 10 µM ATP (5 minutes application: middle panel). The right panel shows the ATP-sensitive current obtained in the same cell by subtraction of the two precedent traces. B. Current-voltage relationship of ATP-sensitive current amplitude (meas-ured at the peak) evoked with the protocol described in A and obtained by averaging the results recorded in 3 cells. C. Representative current traces recorded in a hMSC by using the voltage step protocol (inset) in the absence (left panel) and in the presence of 10 µM ATP (5 minutes ap-plication: central panel). The right panel shows the ATP-sensitive current obtained in the same cell by subtraction of the two precedent traces. D. Current-voltage relationship of ATP-sensitive currents (measured at the steady state) evoked with the protocol described in C and obtained by averaging the results recorded in 5 cells.

Role of purine nucleotides in cultured hMSCs 125
Figure 38. Effects of different P2 receptor antagonists on ATP-evoked currents. A. Typical ex-periment in which the application of MRS 2179 (10 µM) prevents the increase of both inward and outward currents evoked by the ramp protocol in the presence of 10 µM ATP. B. Repre-sentative current traces recorded in a hMSC by using the voltage step protocol (from -70 to +80 mV, 1800 ms duration, -80 mV holding potential) in the absence (left panel) and in the pres-ence of ATP+MRS 2179 (middle panel). The right panel shows that no ATP-sensitive currents are evoked in this cell in the presence of MRS 2179. C. The bar graphs report the average current values at +40mV (left panel) and at -90 mV (right panel) evoked by the ramp protocol in the presence of ATP alone or in combination with different P2 antagonists. *: P<0.05 from 10 µM ATP alone (One-way ANOVA, Newman-Keuls post test).

Elisabetta Coppi126
2.3 Effects of ATP in hMSCs in the perforated patch-clamp configuration
Since it has been described that ATP promotes an intracellular increase in Ca2+ concen-tration in hMSCs, we performed perforated patch-clamp experiments to better investi-gate the effects of ATP on Ca2+-dependent ionic conductances.
Also in these conditions ATP elicited two different responses. In 3 out of 5 cells in-vestigated, ATP (10 µM, 5 minutes application) induced a consistent increase in out-ward currents and a modest enhancement in the inward currents evoked by the ramp protocol. The mean ATP-sensitive current (figure 40A, filled circles) showed a revers-al potential of -38.7±1.2 mV. In the remaining 2 cells, 10 µM ATP increased inward currents, producing an ATP-sensitive current with a reversal potential of -5.6 mV, as shown in figure 40A (open circles). By comparing the ATP-sensitive currents recorded in the perforated-patch configuration (figure 40A) and that observed in the whole-cell configuration, shown in a typical experiment in figure 40A and 36C and averaged in figure 40B, it can be noted that in both experimental conditions ATP elicited compa-rable effects. In both cases, we can distinguish two groups of responding cells: cell re-sponding to ATP with an increase in outward currents (filled circles) and cells respond-ing to ATP with an increase in inward currents (open circles). It appears that in the perforated patch configuration the magnitude of ATP effects was greater, suggesting the involvement of a diffusible messenger (probably Ca2+ ions).
Figure 39. In K+-free conditions only the increase in inward currents was elicited by ATP. A. Left panel: Representative experiment recorded in K+-free conditions obtained by substitution with equimolar Cs+. Right panel: ATP-sensitive current recorded in the same cell. B. Time course of current amplitude recorded at -90 mV before, during and after 10 µM ATP application. Each point in the graph represents the mean ± s.e. of 6 experiments. C. Averaged ATP-sensitive cur-rent amplitude elicited by the ramp protocol and recorded in the 6 cells investigated in K+-free conditions.

Role of purine nucleotides in cultured hMSCs 127
A summary of membrane properties measured in the different experimental groups is shown in table 11.
Table 11. Electrophysiological membrane properties of hMSCs.
(n/n) Rm (MΩ) Cm (pF) Vm (mV)
Whole-cell (n=19) ATP outward (9/19) 363± 66 41.1± 10.2 -36.9± 7.2ATP inward (6/19) 375.7± 76.4 45± 11.6 -12.5 ±3.3
ATP no effect (4/19) 258.3± 61.3 46.1± 18.7 -17.5± 2.9
Whole-cell Cs+ (n=6) ATP inward (6/6) 212.7± 46.4 40.3±5.2 -2.9± 1.7
Perforated patch(n=5)
ATP outward (3/5) 330.5± 218.2 / -28.2± 11.7ATP inward (2/5) 302.0±58.2 / -11.6±4.3
Data are taken from a total of 30 hMSCs investigated with the patch clamp technique in differ-ent experimental conditions. Numbers in parentheses (n/n) indicate the number of observations out of investigated cells.
Figure 40. The same dual pattern of responses to exogenous ATP is observed in the perforat-ed patch and whole-cell configurations. A. The graph shows the ATP-sensitive currents evoked by the ramp protocol in the perforated patch configuration. Filled circles: in 3 out of 5 cells the ATP-sensitive current presented a marked outward component with a minor effect on inward currents and a reversal potential of about -40 mV. Open circles: in the remaining two cells the ATP-sensitive current shows a prevalent inward component, with a reversal potential around 0 mV. B. The graph shows the ATP-sensitive currents evoked by the ramp protocol in the whole-cell configuration (K+-containing solutions: experimental section described in figure 36). Filled circles: in 9 cells the ATP-sensitive current presents a marked outward component with a minor inward current and a reversal potential around -40 mV. Open circles: in 6 cells the ATP-sensitive current shows a marked inward rectification, with a reversal potential around 0 mV. Note that mean current amplitudes in the perforated patch configuration are greater than that recorded in the whole-cell patch-clamp.

Elisabetta Coppi128
3. Discussion
In this work we demonstrate for the first time that hMSCs in culture, from P0 to P5, tonically release ATP and express functional P2 purinergic receptors which modulate ionic conductances.
Our result that cultured hMSCs tonically release ATP is in agreement with Ka-wano and co-workers (Kawano et al., 2006). The tiny difference between the value of ATP concentration reported by these authors (~3 nM) and that shown in the present work (~7.5 nM) might be due to the earlier culture passages (P0-P5) of cells used in the present study compared to those used by Kawano and colleagues (P6-P19). A decrease in ATP release during culture passages together with the observation of Kawano (Ka-wano et al., 2006) that ATP-induced Ca2+-waves in hMSCs gradually decrease during cell differentiation until they disappear in the fully-differentiated adipogenic pheno-type, suggests a prevalent role of ATP in the earlier, undifferentiated, cell culture steps.
Our data demonstrate that exogenous ATP modulates ionic conductances in hMSCs by inducing two different responses. By imposing voltage ramp protocols to evoke overall currents at a wide range of membrane potentials, we observed that a pop-ulation of cells responded to exogenous ATP with a marked increase in the outward currents that reached a maximum at the end of drug application (5 minutes); this effect was accompanied by a small enhancement of the inward component. In the other group of cells, exogenous ATP enhanced only the inward conductances that reached a maxi-mum at 3 minutes and decayed at the end of the 5-minute agonist superfusion, indi-cating a desensitising response. The same dual pattern of ATP responses was observed when the cells were recorded in the perforated patch-clamp configuration. When K+ ions were replaced by equimolar Cs+, ATP elicited only one type of response, i.e. an in-crease in the inward currents, demonstrating that the outward ATP-sensitive currents are carried by K+ ions.
The increase in outward K+ currents observed in the presence of ATP is abolished in the presence of the selective P2Y1 receptor antagonist MRS2179, suggesting that such cur-rents are modulated by P2Y1 receptor activation. Conversely, in the presence of PPADS, a non-selective P2X-P2Y antagonist, an increase in outward currents was still elicited in the presence of ATP. This fact could be due to the expression and activation in hMSCs of PPADS-insensitive P2Y receptors (such as the human P2Y2 and P2Y11 receptors: Charl-ton et al., 1996; Communi et al., 1999). An involvement of a metabotropic receptor in the modulation of outward K+ currents is also supported by the observation that the max-imal effect is reached at the end of ATP application (5 minutes). Since P2Y receptors (P2Y1,2,4,6,11) stimulate PLC, with subsequent IP3 formation and Ca2+ release from intrac-ellular stores (von Kugelgen 2006), it is likely that this signalling cascade activates the K+ conductances (IKCa) in hMSCs, similarly to what is observed in other cell cultures (Haft-ing et al., 2000; Mule et al., 2003; Zizzo et al., 2006). In agreement with a metabotropic-mediated effect, our results show that the amplitude of ATP-sensitive currents is greater in the perforated patch- clamp configuration that avoids dilution of intracellular constitu-ents (second messengers) with the internal pipette solution.
Previous electrophysiological experiments conducted in hMSCs in culture report the presence of three distinct K+ currents with different activation and inactivation ki-netics (Heubach et al., 2004; Li et al., 2005). In these works, 94% of tested cells present a rapidly activating and noise-like current, identified as the Ca2+-activated K+ current (IKCa); 48% of cells show a typical delayed rectified K+ current (IKDR) and a small frac-tion of cells (8%) presents a rapidly inactivating transient outward current, similar to

Role of purine nucleotides in cultured hMSCs 129
the cardiac and neuronal Ito. Almost all cells investigated express a combination of the three K+ currents that is not correlated to cell diameter or passage in culture. In our experiments, the ATP-sensitive outward K+ conductances were studied in isolation by applying a voltage step protocol. Our results indicate that at least two different types of K+ conductances are involved in ATP effects. When the holding potential is clamped at -80 mV, the effect observed in the presence of ATP is the enhancement of both the transient early currents and the late sustained currents. The ATP-sensitive conduct-ance obtained in these cells shows a highly noisy trace, suggesting the involvement of high conductances Ca2+-dependent K+ channels (BK channels). However, when we in-activate transient conductances by setting the holding potential at -40 mV, ATP still enhances outward currents, demonstrating that late sustained K+ conductances, most likely represented by IKDR, are also positively modulated by the P2 purinergic agonist. Both currents are activated by P2Y1 receptors since they are completely blocked in the presence of the selective P2Y1 antagonist MRS 2179.
The inward ATP-sensitive current presents the typical features of a non-selective cationic conductance, as expected after P2X receptor activation. It shows a reversal potential of 0 mV and a weak inward rectification, as determined by the I-V relation-ship. The observation that the response desensitises before drug removal is evidence of a P2X-like receptor-mediating ATP-sensitive inward current. In agreement with the involvement of a P2X-like receptor is the observation that ATP-induced inward cur-rent is associated with a concomitant membrane depolarization, as already demon-strated (Zemkova et al., 2006). The increase in inward currents and membrane depo-larization induced by ATP were prevented by PPADS, a non selective P2 purinergic antagonist, and by MR S2179, that mainly affects P2Y1 receptors. PPADS is known to block P2Y1,2,4,6 receptors and recombinant homomeric P2X1,2,3,5, as well as heteromeric P2X2/3 and P2X1/5 receptor subtypes (Ralevic and Burnstock 1998). On these bases, we suggest that ATP-sensitive inward currents are mediated by the activation of P2X re-ceptors, but we rule out the involvement of P2X1 and P2X3 subunits, at least in homo-meric structures, since their inactivation takes place within 200-300 ms (Rettinger et al., 2003; Werner et al., 1996). Even if MRS 2179 is generally reported as a P2Y1 antag-onist, it must be considered that it also blocks some P2X receptors in transfected cells (Nandanan et al., 2000). In agreement with this observation, we envisage that a native system such as immature stem cells at early stages in culture can express peculiar as-semblies of heteromeric P2X receptors that are blocked by MRS 2179, in addition to the classical MRS 2179-sensitive P2Y1 subtype. Alternatively, in an attempt to explain the MRS 2179-sensitivity of the ATP-sensitive inward current, we can ascribe this effect to a P2Y1-mediated activation of “transient receptor potential” (TRP) channels, a family of non-selective cation channels specifically activated by Gq protein-coupled receptors (Zuker 1996). There is no evidence, to date, for TRP channels expression in hMSCs. Anyway, we cannot rule out the hypothesis that, in hMSCs, exogenous ATP stimulates P2Y1 receptors that leads to TRP channels opening with a consequent influx of cations in the cell, as demonstrated in megakaryocytes (Tolhurst et al., 2005).
When voltages ramps were recorded in Cs+ containing solutions, even if all K+ con-ductances are blocked by Cs+ replacement in these conditions, the inward ATP-sensi-tive current also shows a small outward component. We hypothesize that in this case the outward current is carried by Cs+ ions themselves, permeating through P2X chan-nels, since it has been demonstrated that some P2X receptors expressed in native sys-tems are also partially permeable to Cs+ ions (Ikeda 2006; Liu et al., 2001; Ma et al., 2006), given the large size of the pore diameter (North 2002).

Elisabetta Coppi130
Finally, it should be noted that the effects of ATP on inward currents are always present in hMSCs, even in cells where ATP mainly induces an increase in outward cur-rents. This is confirmed by the observation that the reversal potential of the ATP-sen-sitive outward current is -40 mV, that is different from the Nernst-calculated K+ equi-librium potential in our experimental conditions (EK=-81.7 mV). These results suggest that all hMSCs can potentially respond to ATP with an increase in inward currents, but, when K+ channels or P2Y1 receptors are present, the outward current activation over-laps the effect on inward currents.
Accordingly, in the latter case, no change in membrane potential was observed during ATP superfusion. This observation suggests that the depolarization due to the increase in inward currents elicited by ATP is counterbalanced by the outward current increase. In fact, when ATP is applied in the presence of PPADS, that only blocks the ATP-sensitive inward currents, an hyperpolarization is revealed, reasonably due to the ATP-induced activation of K+ channels.
The absence of the outward ATP-sensitive current in some cells may be justified in several ways. For example, it is possible that not all the cells tested express the same subtype/s of P2X and/or P2Y receptors. Consequently, one possibility is that hMSCs responding to exogenous ATP with an increase in outward currents, are provided with P2Y1 receptors, whereas cells that do not show this effect are not. Alternatively, since not all hMSCs express the same subtypes of K+ channels (Heubach et al., 2004; Li et al., 2005). the lack of outward current increase in some hMSCs could be due to the ab-sence of the particular subtype/s of K+ channels activated by ATP, even in cells express-ing P2Y1 receptors. In agreement with the last assumption is the fact that cells in which ATP increases outward currents present a more negative resting membrane potential in comparison to cells in which ATP enhances inward currents, in both perforated and whole-cell configurations (see table 11). The question arises as to whether the two pop-ulations of hMSCs, showing distinct responses to exogenous ATP, also present some differences in morphological parameters. However, we reported that cell capacitance, as a measure of cell size, is not different in hMSCs responding to ATP with the increase of inward or outward currents (see table 11) and that the passage in culture from P0 to P5 does not affect the characteristics of ATP-sensitive currents.
3.1 Conclusion
In summary, ATP released from hMSCs, by producing two different responses, reveals two separate populations of these cells with distinct electrophysiological and pharma-cological characteristics. It is possible that these characteristics correlate with differ-ent developmental potential of hMSCs. The precise mechanisms by which hMSCs may spontaneously differentiate into osteogenic, adipogenic or chondrogenic phenotypes are still unclear, and we can hypothesize that ATP may act as one of the early factors determining cell fate.
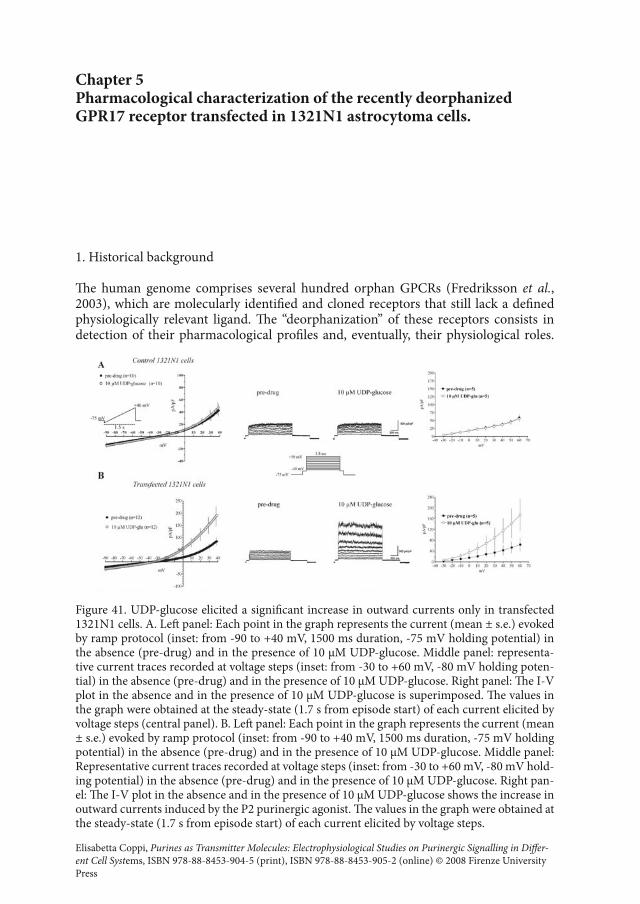
Elisabetta Coppi, Purines as Transmitter Molecules: Electrophysiological Studies on Purinergic Signalling in Differ-ent Cell Systems, ISBN 978-88-8453-904-5 (print), ISBN 978-88-8453-905-2 (online) © 2008 Firenze University Press
Chapter5PharmacologicalcharacterizationoftherecentlydeorphanizedGPR17receptortransfectedin1321N1astrocytomacells.
1. Historical background
The human genome comprises several hundred orphan GPCRs (Fredriksson et al., 2003), which are molecularly identified and cloned receptors that still lack a defined physiologically relevant ligand. The “deorphanization” of these receptors consists in detection of their pharmacological profiles and, eventually, their physiological roles.
Figure 41. UDP-glucose elicited a significant increase in outward currents only in transfected 1321N1 cells. A. Left panel: Each point in the graph represents the current (mean ± s.e.) evoked by ramp protocol (inset: from -90 to +40 mV, 1500 ms duration, -75 mV holding potential) in the absence (pre-drug) and in the presence of 10 µM UDP-glucose. Middle panel: representa-tive current traces recorded at voltage steps (inset: from -30 to +60 mV, -80 mV holding poten-tial) in the absence (pre-drug) and in the presence of 10 µM UDP-glucose. Right panel: The I-V plot in the absence and in the presence of 10 µM UDP-glucose is superimposed. The values in the graph were obtained at the steady-state (1.7 s from episode start) of each current elicited by voltage steps (central panel). B. Left panel: Each point in the graph represents the current (mean ± s.e.) evoked by ramp protocol (inset: from -90 to +40 mV, 1500 ms duration, -75 mV holding potential) in the absence (pre-drug) and in the presence of 10 µM UDP-glucose. Middle panel: Representative current traces recorded at voltage steps (inset: from -30 to +60 mV, -80 mV hold-ing potential) in the absence (pre-drug) and in the presence of 10 µM UDP-glucose. Right pan-el: The I-V plot in the absence and in the presence of 10 µM UDP-glucose shows the increase in outward currents induced by the P2 purinergic agonist. The values in the graph were obtained at the steady-state (1.7 s from episode start) of each current elicited by voltage steps.

Elisabetta Coppi132
The purinergic receptor family is growing by addition of newly deorphanized receptors that are found to bind purinergic-related compounds. The last one has been GPR17, whose recent deorphanization by Abbracchio and colleagues demonstrated a dual lig-and binding profile. In fact, this receptor is activated by both sugar uridine nucleotides (UDP-glucose and UDP-galactose) and cysteinil-leukotrienes (CysLTs, such as LTD4 and LTC4). In addition, it is also blocked by purinergic antagonists (MRS 2179, AR-C-69931) and CysLT blockers (Montelukast and Pranlukast). This paper helped clarifying the already reported functional cross-talk between purinergic and leukotriene signal-ling (Ballerini et al., 2005; Capra et al., 2005; Mamedova et al., 2005), mainly during inflammatory responses (Capra et al., 2005; Mellor et al., 2001). In fact, CysLTs are in-flammatory lipid mediators generated by 5-lipoxygenase metabolism of arachidonic acid Samuelsson, 2000 590 /id that, by activating two different subtypes of G-protein-coupled receptors (CysLT1 and CysLT2) participate in inflammatory processes impli-cated, for instance, in bronchial asthma (Drazen 2003), stroke (Ciceri et al., 2001) and cardiovascular diseases (Brink et al., 2003). Similarly, dysfunctions of nucleotides and their receptors have been associated to various human diseases, including immune and ischemic/inflammatory conditions (Abbracchio et al., 2003; Burnstock et al., 2004). At molecular levels, GPR17 is coupled to Gi protein, but either a reduction in cAMP and an increase in intracellular Ca2+ concentration has been reported upon stimulation (Ciana et al., 2006).
In the present work we performed an electrophysiological study on 1321N1 as-trocytoma cells stably transfected with GRP17. By investigating its role in modulat-ing membrane ionic currents, we confirmed its dual pharmacological profile with such functional studies. This cell line has been chosen because it does not endogenously ex-press other P2 receptors (excluded a tiny fraction of P2Y1 subtype) but present several kind of K+ channels subjected to GPCR modulation.
2. Results
This study was carried out on 113 cells, 22 control cells which were transfected with pcDNA and 91 cells transfected with the GPR17 receptor (Ciana et al., 2006). Control 1321N1 cells presented a mean Cm of 14.7± 2.7 pF, and a mean membrane potential of -35.8± 2.7 mV Transfected 1321N1 cells presented a mean Cm of 11± 0.67 pF and a mean membrane potential of -37.1 ± 3.4 mV.
2.1 Exogenously applied UDP-glucose and UDP-galactose activate outward potassium currents in 1321N1 astrocytoma cell stably transfected with GPR17.
As shown in figure 41A (left panel), the application of 10 µM UDP-glucose did not modify the overall currents evoked by the ramp protocol (inset) in control 1321N1 cells (n=10). In addition, no changes in outward potassium currents amplitude were observed (middle and right panels, figure 41A) when different voltage steps (step pro-tocol: central panel) were applied. In contrast, UDP-glucose induced a significant in-crease in overall currents in transfected 1321N1 cells (figure 41B, left panel). This ef-fect was evident in 12 out of 17 cells examined. The effect was evident starting from a membrane potential of -30 mV. At +40 mV the amplitude of outward currents in-creased from +84.1±16.6 pA/pF in control to +190.4±41.3 pA/pF in UDP-glucose (n=12, P<0.05, paired Student’s t-test). The effect of UDP-glucose was reversible after
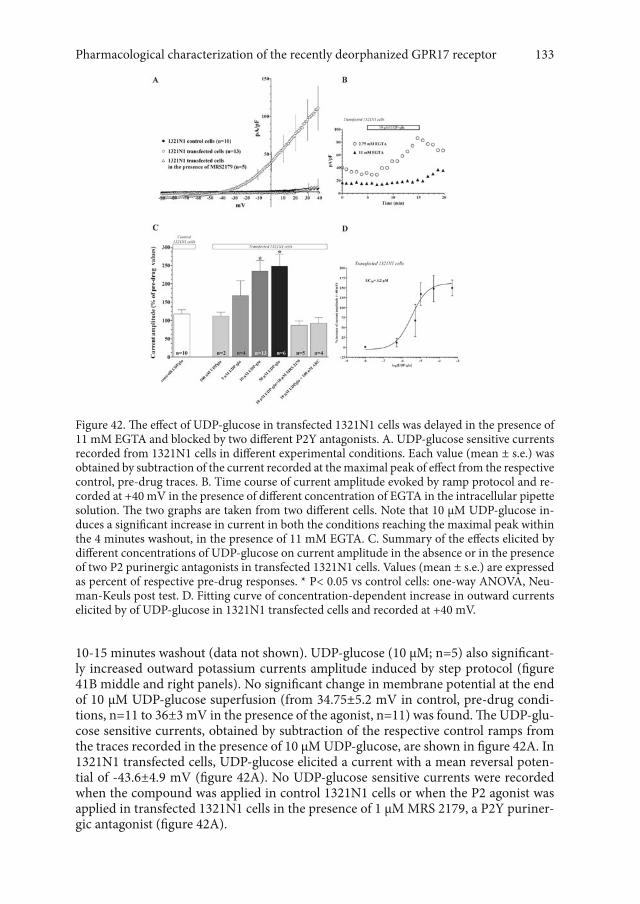
Pharmacological characterization of the recently deorphanized GPR17 receptor 133
10-15 minutes washout (data not shown). UDP-glucose (10 µM; n=5) also significant-ly increased outward potassium currents amplitude induced by step protocol (figure 41B middle and right panels). No significant change in membrane potential at the end of 10 µM UDP-glucose superfusion (from 34.75±5.2 mV in control, pre-drug condi-tions, n=11 to 36±3 mV in the presence of the agonist, n=11) was found. The UDP-glu-cose sensitive currents, obtained by subtraction of the respective control ramps from the traces recorded in the presence of 10 µM UDP-glucose, are shown in figure 42A. In 1321N1 transfected cells, UDP-glucose elicited a current with a mean reversal poten-tial of -43.6±4.9 mV (figure 42A). No UDP-glucose sensitive currents were recorded when the compound was applied in control 1321N1 cells or when the P2 agonist was applied in transfected 1321N1 cells in the presence of 1 µM MRS 2179, a P2Y puriner-gic antagonist (figure 42A).
Figure 42. The effect of UDP-glucose in transfected 1321N1 cells was delayed in the presence of 11 mM EGTA and blocked by two different P2Y antagonists. A. UDP-glucose sensitive currents recorded from 1321N1 cells in different experimental conditions. Each value (mean ± s.e.) was obtained by subtraction of the current recorded at the maximal peak of effect from the respective control, pre-drug traces. B. Time course of current amplitude evoked by ramp protocol and re-corded at +40 mV in the presence of different concentration of EGTA in the intracellular pipette solution. The two graphs are taken from two different cells. Note that 10 µM UDP-glucose in-duces a significant increase in current in both the conditions reaching the maximal peak within the 4 minutes washout, in the presence of 11 mM EGTA. C. Summary of the effects elicited by different concentrations of UDP-glucose on current amplitude in the absence or in the presence of two P2 purinergic antagonists in transfected 1321N1 cells. Values (mean ± s.e.) are expressed as percent of respective pre-drug responses. * P< 0.05 vs control cells: one-way ANOVA, Neu-man-Keuls post test. D. Fitting curve of concentration-dependent increase in outward currents elicited by of UDP-glucose in 1321N1 transfected cells and recorded at +40 mV.

Elisabetta Coppi134
Evidence in the literature indicates that the principal effect observed after P2Y pu-rinergic receptor activation is an increase in the intracellular concentration of calcium ions (Ikeuchi and Nishizaki, 1996a; Ikeuchi et al., 1996b; Koizumi et al., 2002). To in-vestigate a possible calcium dependency of currents elicited by GPR17 receptor stimu-lation, we increased EGTA concentration. The presence of 11 mM EGTA in the pipette solution decreased the overall current amplitude, both in transfected (from a value of +115.8±31 pA/pF, n=12, to a value of +33.7±10.8 pA/pF in EGTA, n=7) and control 1321N1 cells (from +93±47.2 pA/pF, n=7, to 40±4.8 pA/pF in EGTA, n=3) (data not shown). In these experimental conditions, 10 µM UDP-glucose did not change the am-plitude of currents evoked by the ramp protocol in control 1321N1 cells (n=5, data not shown). In transfected 1321N1 cells, 10 µM UDP-glucose still elicited an increase in outward currents but with a slower time-course. As shown by two typical experiments in figure 42B, in fact, while the maximal increase in 2.75 mM EGTA is reached at the end of drug superfusion, in 11 mM EGTA the maximal increase of current amplitude induced by UDP-glucose was reached during the 4 minutes washout. The mean in-crease in outward current induced by 10 µM UDP-glucose in transfected 1321N1 cells in the presence of 11 mM EGTA was of 52±19% (P<0.05 vs respective control, paired Student’s t test, n=7).
As shown in figure 42C, in transfected 1321N1 cells, the effect of UDP-glucose in the presence of 2.75 mM EGTA was evident starting from a concentration of 5 µM and the apparent EC50 value estimated for UDP-glucose effect on outward currents (figure 42D) was 3.2 µM (95% C.L. 0.36-38 µM). As shown in figure 42A and C, MRS 2179 completely prevents the increase in outward currents elicited by 10 µM UDP-glucose. In fact, in the presence of 1 µM MRS 2179, no effect of the P2 agonist on ionic currents evoked by the ramp (figure 42A and C) or by the step protocol (n=4, not shown) was recorded. Similarly, 100 nM AR-C69931MX (n=4), another P2 purinergic antagonists, completely prevented the effect of 10 µM UDP-glucose (figure 42C).
On the basis of previous results obtained in studies on GRP17 (Ciana et al., 2006) we also tested the effects of UDP-galactose and UDP. In agreement with Ciana and colleagues, both compounds presented an agonistic activity on GRP17 transfected in 1321N1 cells. Figure 43A shows that the UDP-galactose sensitive current is superim-posed to that evoked by UDP-glucose. In fact, it shows a similar current-voltage rela-tionship and membrane reversal potential (-39±3 mV).
Conversely, UDP sensitive current was smaller in amplitude and presented a mem-brane reversal potential of -23.6±8.3 mV. As illustrated in figure 43B, the effect of both UDP-galactose and UDP on outward currents was completely blocked in the presence of 1 µM MRS 2179 in 1321N1 transfected cells.
2.2 GPR17 receptor, stably transfected1321N1 astrocytoma cells, is also sensitive to leukotriene-related compounds
In a set of experiments we also evaluated the effects of leucotrieneD4 (LTD4) both on transfected and control 1321N1 cells. LTD4 (10 nM) increased the amplitude of out-ward currents evoked either by the ramp protocol (figure 44A) or by the step protocol (middle and right panels, figure 44B) in transfected 1321N1 cells. No significant differ-ence in membrane potential at the end of 10 nM LTD4 superfusion was found (from -47.23±8.5 mV pre-drug value, n=6, to -45.8±7.4 mV in the presence of the agonist, n=6, data not shown). The LTD4 sensitive currents, obtained by subtraction of the respec-tive control ramps from the traces recorded in the presence of 10 nM LTD4 are shown

Pharmacological characterization of the recently deorphanized GPR17 receptor 135
in figure 44C. In transfected 1321N1 cells LTD4 elicited currents with a mean revers-alpotential of -46.5±3.6 mV (figure 44C). No LTD4 sensitive currents were recorded in control 1321N1 cells (figure 44C,D). In transfected 1321N1 cells the compound was tested at different concentrations and the percentage increase in outward currents was of 4±8% (n=3) at 0.05 nM, of 59±42% (n=3) at 5 nM; of 111±34% (P<0.05 vs respective pre-drug value, paired Student’s t test, n=6) at 10 nM and of 85±22 (P<0.05 vs respec-tive pre-drug value, paired Student’s t test, n=6) at 50 nM (figure 44D). The apparent EC50 value estimated for LTD4 effect on outward currents (figure 44E) was 0.92 nM. The effect of 10 nM LTD4 was significantly reduced either by MRS 2179 (figure 44C,D) or Montelukast (figure 44D), a P2Y purinergic antagonist and a CysLT receptor antag-onist, respectively. We also tested the effects of LTD4 in the presence of Pranlukast, an-
Figure 43. UDP-galactose elicited a significant increase in outward currents in transfected 1321N1 cells. A. Left panel: Each point in the graph represents the current (mean ± s.e.) evoked by the ramp protocol. Either UDP and UDP-galactose (10 µM both) increase outward currents. The UDP-glucose sensitive current is reported for comparison. B. Summary of UDP and UDP-galactose effects, alone or in combination with MRS 2179, on outward currents recorded at +40 mV either in control or in transfected 1321N1 cells. Values (mean ± s.e.) are expressed as per-cent of the respective pre-drug responses. * P< 0.05 vs control cells: one-way ANOVA, Neuman-Keuls post test.

Elisabetta Coppi136
other leukotriene antagonist. Differently from Pranlukast, this compound, per se, elic-ited a significant increase in outward currents evoked by the ramp protocol (n=3, data not shown). No effect of 10 nM LTD4 in control 1321N1 cells (10 nM, n=5) was ob-served. (figure 44C,D).
In a group of experiments UDP-glucose and LTD4 were co-applied at the submax-imal and maximal concentrations in transfected 1321N1 cells to verify if the effects elicited by the two agonists were additive or occlusive. As shown in figure 45A, when the two drugs were co-applied at submaximal concentrations (5 µM UDP-glucose and 5 nM LTD4, n=4) no additive effect was found. In fact, the value of current amplitude recorded at +40 mV in the presence of both compounds was not significantly different from the pre-drug level obtained in control conditions (P>0.05, paired Student’s t-test). Furthermore, no significant difference was found between current values measured in this group of cells and that previously recorded in the presence of each drug alone, con-firming that 5 µM UDP-glucose and 5 nM LTD4, applied alone or in combination, are ineffective (P>0.05, one-way ANOVA, Neumann-Keuls post test). An occlusive effect was observed when the two drugs were co-applied at maximal concentrations (50 µM UDP-glucose and 50 nM LTD4). In these experimental conditions, 8 out of 10 cells in-
Figure 44. LTD4 elicits an increase in outward currents in transfected 1321N1 cells, an effect that is blocked by a P2 antagonist, MRS 2179, and a CysLT antagonist, montelukast. A. Each point in the graph represents the current (mean ± s.e.m.) evoked by the ramp protocol. LTD4 (10 nM) increases outward currents starting from -20 to +40 mV. B. Representative current traces record-ed with the voltage step protocol in the absence (pre-drug) and in the presence of 10 nM LTD4. Right panel: The I-V plot of the step protocol-evoked currents recorded in 4 cells in the absence and in the presence of 10 nM LTD4 (current amplitude is measured at the steady-state). C. LTD4 sensitive currents recorded from control and transfected 1321N1 cells in different experimental conditions. Each value (mean ± s.e.) was obtained by subtraction of the currents recorded at the maximal peak of effect from the respective control, pre-drug traces. D. Summary of the effect of LTD4, applied at different concentrations, on the amplitude of outward currents evoked by the ramp pulse at a voltage of +40 mV both in control and transfected 1321N1 cells. Values (mean ± s.e.) are expressed as percent of the respective pre-drug responses. Cell number of each experi-mental group is shown on the corresponding bar. * P< 0.05 vs control cells: one-way ANOVA, Neuman-Keuls post test. E. Fitting curve of the concentration-dependent increase in outward currents elicited by LTD4 in 1321N1 transfected cells and recorded at +40 mV.

Pharmacological characterization of the recently deorphanized GPR17 receptor 137
vestigated responded with an enhancement in outward conductances activated by the ramp protocol. The averaged increase in current amplitude measured at + 40 mV in the presence of 50 µM UDP-glucose and 50 nM LTD4 was of 154.3±36.1% in respect to pre-drug responses (n=8). This result is not significantly different from that obtained in the presence of each drug applied alone. Finally, in order to investigate which class of G protein coupled to GPR17 is involved in the effect elicited by UDP-glucose or LTD4 in 1321N1 transfected cells, we studied the effect of both agonists, applied separately, in PTX-treated cells. Figure 46A shows that in 5 out of 8 cells, the increase in outward currents produced by 10 µM UDP-glucose was blocked by the toxin. However, in the remaining 3 cells, an increase in outward currents was found. This latter effect is not different from that elicited by UDP-glucose in 1321N1 transfected cells without PTX pre-treatment. In all the 5 cells investigated, 10 nM LTD4 was able to increase outward currents in PTX-pre-treated 1321N1 transfected cells, similarly to what observed in the absence of the toxin.
3. Discussion
Our data demonstrate that the GPR17 receptor transfected in 1321N1 astrocytoma cell line is a functional receptor whose activation, by micromolar concentrations of UDP-glucose, UDP-galactose and UDP lead to a significant increase of outward potassium
Figure 45. Summary of the effects of UDP-glucose and of LTD4, applied alone or in combina-tion, on the amplitude of outward currents evoked by the ramp protocol at a voltage of +40 mV in transfected 1321N1 cells. Each column bar represents the mean ± s.e. of current amplitude measured at + 40 mV. Values are expressed as percent of the respective pre-drug responses. A. Effect of 5 µM UDP-glucose applied in combination with 5 nM LTD4 (submaximal concentra-tions). No significant difference was found among all experimental groups. B. Effect of 50 µM UDP-glucose applied in combination with 50 nM LTD4 (maximal concentrations). *: P<0.05, one-way ANOVA, Neuman-Keuls post test.

Elisabetta Coppi138
currents. In particular, micromolar concentrations of both the agonists bring to a sig-nificant increase in outward potassium currents. In control 1321N1 cells, UDP-glucose and UDP-galactose do not have any effect. It’s worth noticing that P2Y receptors are able to regulate potassium currents in different cultured cells (Ikeuchi and Nishizaki 1996a; Ikeuchi et al., 1996b; Hede et al., 2005; Von Kugelgen et al., 2005). Since the in-crease of potassium currents was observed only in transfected 1321N1 cells and it was blocked by a specific purinergic antagonist, MRS 2179, we can assume that the effects of both UDP-glucose and UDP-galactose are mediated by the GPR17 receptor.
The relatively slow time-course of current changes (8-10 minutes to reach the max-imum peak value) indicates that the receptor acts by a typical metabotropic mecha-nism, mediated by intracellular second messengers. In our experiments, the increase of EGTA (from 2.75 to 11 mM) in the pipette solution delays and reduces the magnitude of UDP-glucose-mediated effect (an increase of 140±31%, in 2.75 mM EGTA at a con-centration of 10 µM vs 52±19% in 11 mM EGTA). This result confirms that the potas-sium currents activated by UDP-glucose are calcium dependent. Since EGTA is a slight calcium chelator, presumably it does not completely block the intracellular calcium rise evoked after the receptor stimulation bringing to only a transient delay or reduction of the response.
Figure 46. Pertussis toxin (PTX) sensitivity of UDP-glucose and LTD4 elicited effects in 1321N1 transfected cells. Each column bar represents the mean ± s.e. of current amplitude measured at + 40 Mv. Values are expressed as percent of the respective pre-drug responses. A. Effect of 10 µM UDP-glucose in 1321N1 transfected cells in the absence and in the presence of PTX pre-treat-ment. In three out of 8 cells PTX was unable to block the UDP-glucose elicited effect. * P<0.05 vs UDP-glucose alone in transfected cells: one-way ANOVA, Neuman-Keuls post test. B. Effect of 10 nM LTD4 in 1321N1 transfected cells in the absence or in the presence of PTX pretreatment. No significant difference was found between the two groups (P>0.05, unpaired Student’s t test.

Pharmacological characterization of the recently deorphanized GPR17 receptor 139
It has been demonstrated that the effects of cysteinyl leukotriene LTD4 are medi-ated by a specific interaction with cell surface receptors belonging to the rhodopsin family of the G protein-coupled receptor. Until now, two receptor subtypes have been cloned, namely CysLT1 and CysLT2 (Brink et al., 2003). CysLT receptors have been de-tected in astrocytes (Ciccarelli et al., 2004), and CysLT2 receptors (Mamedova et al., 2005). GPR17, a recently deorphanized receptor, is at intermediate phylogenetic posi-tion between P2Y and CysLT receptors and it is specifically activated by both families of endogenous ligands, P2 agonists and cysteinyl leukotriene, respectively (Ciana et al., 2006).
An important finding of the present work is that LTD4, at nanomolar concentra-tions, is able to increase outward potassium currents evoked by a ramp protocol in transfected, but not in control, 1321N1 cells. In addition, we demonstrate that the effect of LTD4 on ionic currents was blocked by the purinergic antagonist MRS 2179. There-fore, we assume that LTD4 exerts its action by activating the GPR17 receptor. However, we found that the effect of LTD4 was also significantly reduced in the presence of the CysLT antagonist Montelukast. Recently, Mamedova et al., (2005) demonstrated that Montelukast inhibits the effects of nucleotides acting at P2Y receptors in 1321N1 cells stably expressing human P2Y1,2,4,6 receptors. Therefore, UDP glucose, UDP galactose, UDP and LTD4 reasonably act on the same receptor as already demonstrated by Ciana et al. (2006). This conclusion is supported by the observation that the effects of UDP-glucose and LTD4 co-application at submaximal concentrations are not additive.
In conclusions, our data indicate that both UDP-glucose and LTD4 increase out-ward potassium currents in transfected 1321N1 cells through activation of the GPR17 receptor.


Elisabetta Coppi, Purines as Transmitter Molecules: Electrophysiological Studies on Purinergic Signalling in Differ-ent Cell Systems, ISBN 978-88-8453-904-5 (print), ISBN 978-88-8453-905-2 (online) © 2008 Firenze University Press
Finalremarks
On the basis of the present results, it can be summarized that purinergic signalling ac-tually plays important roles in cell functions either under physiological or pathologi-cal circumstances, in different tissues and at various developmental stages of living animals. What emerges in most cases is that both nucleosides (adenosine) and nucle-otides (ADP, ATP, UDP, UTP), by activating specific membrane receptors (P1 and P2, respectively), are strictly correlated in orchestrating such responses. However, the re-spective contribution of each single element is hard to discern from the total outcome, due to the rapid and ubiquitous enzymatic interconvertion of these molecules into one another.
Regarding the CNS, adenosine and ATP share a modulatory role on synaptic trans-mission but, if adenosine only acts as a neuromodulator by activation of specific me-tabotropic receptors (A1 A2A, A2B and A3), ATP presents a more complex profile. In fact, it may act either as a neuromodulator or as a neurotransmitter itself. Under physiologi-cal conditions, both compounds are likely to play a role in neuronal activity, and the inhibitory action of endogenous adenosine in excitatory neurotransmission (mainly due to A1 receptor activation) is well documented. Conversely, the present results, in line with previous observations in the literature, suggest a prevalent excitatory action of endogenous ATP under physiological conditions. This effect is modest, and prob-ably restricted to certain brain regions (such as the hippocampus), but it is unmasked by the application of P2 purinergic antagonists that enhances evoked synaptic respons-es. However, the plurality of P2 receptors present in the brain (seven P2X subunits and eight P2Y subtypes) complicates the scenario. In fact, the application of exogenous ATP elicits opposite effects to that described for the endogenous agonist, mainly exerting an inhibitory effect on synaptic transmission. The discrepancy between the endogenously released and the exogenously applied agonist effect could be due to the stimulation of distinct P2 receptor subtypes in each situation. The inhibitory effect elicited by exog-enous ATP application has long been ascribed to adenosine formation from ATP ca-tabolism and subsequent activation of P1 receptors. However, the present work dem-onstrates that ATP itself may inhibit hippocampal synaptic transmission since an even more pronounced effect is observed when enzymatic ATP degradation is blocked. At a single cell level, the inhibitory role of ATP in synaptic responses can be ascribed to the activation of K+ conductances, as already described for other neurotransmitters. This hypothesis is supported by the results obtained in this thesis on striatal slices, where P2Y1 selective activation enhances Ca2+-dependent K+ currents (BK and SK channels) and decrease the firing frequency of medium spiny neurons in response to certain de-polarizing inputs. However, the fact that the two effects elicited by ATP and reported in the present work (inhibition of synaptic transmission and activation of K+ currents)

Elisabetta Coppi142
have been observed in different brain regions and in animals at distinct developmental stages should be considered (1 week old rats for striatal slices and 3 weeks-1 month old rats for hippocampal slices) and might not be correlated.
Within the CNS, ATP seems to be also involved in synaptic plasticity phenomeno-na. In fact evidence in the literature confirms the results shown in the present work in demonstrating that ATP application not only induces short lasting effects terminated by drug removal, but it also elicits long lasting responses. For example, an ATP-induced LTP has been described by Fuji and colleagues in different works (Fuji et al., 1995, 1999 and 2002). In the present research, in the hippocampus, a potentiation of neurotrans-mission develops few minutes after the inhibitory effect has been washed out, and it persists up to 45’-1 h. In addition, experiments on rat striatal slices (presented in sec-tion 2, chapter 1) revealed an intriguing effect of P2 receptor stimulation in enhanc-ing the amplitude of spontaneous mEPSCs recorded in the absence of synaptic activity (TTX in the extracellular milieu). This phenomenon is ascribed to an increased “syn-aptic strength”, i.e. an enhanced response capability at certain synaptic inputs (due, for example, to an enhancement in membrane receptor expression), and is generally called “chemical LTP”. Summarising hippocampal potentiating effects and striatal “chemical LTP” induced by P2 receptor stimulation, it can be argued that ATP could be an impor-tant mediator of long lasting effects in synaptic plasticity.
Either adenosine or ATP seem to become particularly important signalling mol-ecules under pathological conditions, such as ischemia, when the extracellular con-centration of both compounds drastically rises. It is well known that adenosine exerts important neuroprotective effects during brain ischemic insults by activating adenos-ine A1 receptors which profoundly inhibits synaptic transmission and in particular the release of glutamate, that is known to contribute to ischemic damage. On the basis of the present results we propose that, during brief ischemic insults, adenosine A1 and A3 receptors share a common inhibitory effect on synaptic transmission. However, under severe ischemia, a prolonged stimulation of A3 receptors causes a switch to deleterious effects, as demonstrated by the fact that a number of A3 selective antagonists protect hippocampal slices from AD appearance and neurotransmission impairment after a se-vere OGD. The role of endogenously released ATP during cerebral ischemia is mainly deleterious, as found in the present work and in the literature, since the application of P2 antagonists always results in a reduction of ischemic damage. The mechanisms un-derlying these effects are still unknown, but they can be correlated to the tonic excita-tory action of endogenous ATP found in many brain regions (for example in the hip-pocampus and prefrontal cortex).
Concerning developmental processes, growing evidence indicates an ancient phy-logenetic origin of purinergic signalling. The expression of P2 receptors on cell mem-brane and a responses to extracellular ATP and are found in primitive prokaryotic spe-cies up to evolved animals and plants, suggesting an important and highly conserved role of extracellular purine nucleotides through the evolution. Similarly, ontogenetic development in several species seems to involve purinergic signalling especially during its first stages. In fact, in the present work, we describe an effect elicited by extracellu-lar ATP in hMSCs, an undifferentiated line of human stem cells derived from stromal bone marrow able to originate a number of different cell lineages (adipocytes, condro-cytes, osteoblasts,….). hMSCs in culture are shown to spontaneously release ATP in the extracellular space and to express functional purinergic P2 receptors which modulates different kinds (either inward Na+-Ca2+ and/or outward K+) of membrane currents. These results suggest an authocrine/paracrine mechanism of action for extracellular

Final remarks 143
purines in modulating cell functions of undifferentiated stem cells at early develop-mental stages.
Regarding the future of the purine field, new perspectives of investigation come from the still large area of orphan receptors, whose characterization is providing new members of the P2 receptor family. One example is GPR17, which has been recently deorphanized. In the present work we provide a pharmacological characterization of this receptor transfected in astrocytoma cells, that is sensitive to both uridine and leu-kotrienes compounds, solving the puzzling interrelation between these two systems al-ready described in the literature. Our data demonstrate that the activation of GPR17, transfected in 1321N1 astrocytoma cells, leads to an increase in outward K+ currents, an effect similar to that described after stimulation of P2Y1 receptors endogenously ex-pressed in striatal medium spiny neurons.


Elisabetta Coppi, Purines as Transmitter Molecules: Electrophysiological Studies on Purinergic Signalling in Differ-ent Cell Systems, ISBN 978-88-8453-904-5 (print), ISBN 978-88-8453-905-2 (online) © 2008 Firenze University Press
References
Abbracchio MP, Boeynaems JM, Barnard EA, Boyer JL, Kennedy C, Miras-Portugal MT, King BF, Gachet C, Jacobson KA, Weisman GA and BURNSTOCK G (2003). Characterization of the UDP-glucose receptor (re-named here the P2Y14 receptor) adds diversity to the P2Y receptor family. Trends Pharmacol Sci 24(2), 52-55.
Abbracchio MP, Brambilla R, Ceruti S, Kim HO, von Lubitz DK, Jacobson KA and Cattabeni F (1995a). G protein-dependent activation of phospholipase C by adenosine A3 receptors in rat brain. Mol Pharmacol 48(6), 1038-1045.
Abbracchio MP and Burnstock G (1994). Purinoceptors: are there families of P2X and P2Y pu-rinoceptors? Pharmacol Ther 64(3), 445-475.
Abbracchio MP, Burnstock G, Boeynaems JM, Barnard EA, Boyer JL, Kennedy C, Knight GE, Fumagalli M, Gachet C, Jacobson KA and Weisman GA (2006). International Union of Pharmacology LVIII: update on the P2Y G protein-coupled nucleotide receptors: from mo-lecular mechanisms and pathophysiology to therapy. Pharmacol Rev 58(3), 281-341.
Abbracchio MP and Cattabeni F (1999). Brain adenosine receptors as targets for therapeutic in-tervention in neurodegenerative diseases. Ann N Y Acad Sci 890, 79-92.
Abbracchio MP, Ceruti S, Langfelder R, Cattabeni F, Saffrey MJ and Burnstock G (1995b). Ef-fects of ATP analogues and basic fibroblast growth factor on astroglial cell differentiation in primary cultures of rat striatum. Int J Dev Neurosci 13(7), 685-693.
Adams PR, Brown DA and Constanti A (1982). Pharmacological inhibition of the M-current. J Physiol 332,223-262.
Agresti C, Meomartini ME, Amadio S, Ambrosini E, Volonte C, Aloisi F and Visentin S (2005). ATP regulates oligodendrocyte progenitor migration, proliferation, and differentiation: in-volvement of metabotropic P2 receptors. Brain Res Brain Res Rev 48(2), 157-165.
Aitken PG, Fayuk D, Somjen GG and Turner DA (1999). Use of intrinsic optical signals to moni-tor physiological changes in brain tissue slices. Methods 18(2), 91-103.
Aitken PG, Tombaugh GC, Turner DA and Somjen GG (1998). Similar propagation of SD and hypoxic SD-like depolarization in rat hippocampus recorded optically and electrically. J Neurophysiol 80(3), 1514-1521.
Akasu T, Hirai K and Koketsu K (1983). Modulatory actions of ATP on membrane potentials of bullfrog sympathetic ganglion cells. Brain Res 258(2), 313-317.
Anderson CM, Bergher JP and Swanson RA (2004). ATP-induced ATP release from astrocytes. J Neurochem 88(1), 246-256.
Aono K, Nakanishi N and Yamada S (1990). Increase in intracellular Ca2+ level and modula-tion of nerve growth factor action on pheochromocytoma PC12h cells by extracellular ATP. Meikai Daigaku Shigaku Zasshi 19(2), 221-229.
Arthur DB, Akassoglou K and Insel PA (2005). P2Y2 receptor activates nerve growth factor/TrkA signaling to enhance neuronal differentiation. Proc Natl Acad Sci U S A 102(52), 19138-19143.
Arthur DB, Georgi S, Akassoglou K and Insel PA (2006). Inhibition of apoptosis by P2Y2 recep-tor activation: novel pathways for neuronal survival. J Neurosci 26(14), 3798-3804.

Elisabetta Coppi146
Ascherio A, Zhang SM, Hernan MA, Kawachi I, Colditz GA, Speizer FE and Willett WC (2001). Prospective study of caffeine consumption and risk of Parkinson’s disease in men and wom-en. Ann Neurol 50(1), 56-63.
King BF and Burnstock G (2002). Purinergic receptors. M.Pangalos and C.Davies. Understand-ing G Protein-coupled Receptors and their Role in the CNS. 422-438. Oxford University Press . Ref Type: Book Chapter
Baldwin SA, Beal PR, Yao SY, King AE, Cass CE and Young JD (2004). The equilibrative nucleo-side transporter family, SLC29. Pflugers Arch 447(5), 735-743.
Ballerini P, Di Iorio P, Ciccarelli R, Caciagli F, Poli A, Beraudi A, Buccella S, D’Alimonte I, D’Au-ro M, Nargi E, Patricelli P, Visini D and Traversa U (2005). P2Y1 and cysteinyl leukotriene receptors mediate purine and cysteinyl leukotriene co-release in primary cultures of rat mi-croglia. Int J Immunopathol Pharmacol 18(2), 255-268.
Baraldi PG, Cacciari B, Romagnoli R, Merighi S, Varani K, Borea PA and Spalluto G (2000). A(3) adenosine receptor ligands: history and perspectives. Med Res Rev 20(2), 103-128.
Barer R, Ross Kf and Tkaczyk S (1953). Refractometry of living cells. Nature 171(4356), 720-724.
Bardoni R., Goldstein PA, Lee CJ, Gu JG and MacDermott AB. (1997). ATP P2X receptors me-diate fast synaptic transmission in the dorsal horn of the rat spinal cord. J.Neurosci. 17(14), 5297-5304.
Bargas J, Ayala GX, Vilchis C, Pineda JC and Galarraga E (1999). Ca2+-activated outward cur-rents in neostriatal neurons. Neuroscience 88(2), 479-488.
Barnard EA, Burnstock G and Webb TE (1994). G protein-coupled receptors for ATP and other nucleotides: a new receptor family. Trends Pharmacol Sci 15(3), 67-70.
Barrera NP, Ormond SJ, Henderson RM, Murrell-Lagnado RD and Edwardson JM (2005). Atomic force microscopy imaging demonstrates that P2X2 receptors are trimers but that P2X6 receptor subunits do not oligomerize. J Biol Chem 280(11), 10759-10765.
Baurand A, Raboisson P, Freund M, Leon C, Cazenave JP, Bourguignon JJ and Gachet C (2001). Inhibition of platelet function by administration of MRS2179, a P2Y1 receptor antagonist. Eur J Pharmacol 412(3), 213-221.
Bean BP (1990). ATP-activated channels in rat and bullfrog sensory neurons: concentration de-pendence and kinetics. J Neurosci 10(1), 1-10.
Bean BP, Williams CA and Ceelen PW (1990). ATP-activated channels in rat and bullfrog senso-ry neurons: current-voltage relation and single-channel behavior. J Neurosci 10(1), 11-19.
Benvenuti S, Saccardi R, Luciani P, Urbani S, Deledda C, Cellai I, Francini F, Squecco R, Rosati F, Danza G, Gelmini S, Greeve I, Rossi M, Maggi R, Serio M and Peri A (2006). Neuronal dif-ferentiation of human mesenchymal stem cells: changes in the expression of the Alzheimer’s disease-related gene seladin-1. Exp Cell Res 312(13), 2592-2604.
Bergner A and Sanderson MJ (2002). ATP stimulates Ca2+ oscillations and contraction in air-way smooth muscle cells of mouse lung slices. Am J Physiol Lung Cell Mol Physiol 283(6), L1271-L1279.
Beukers MW, Chang LC, von Frijtag Drabbe Kunzel JK, Mulder-Krieger T, Spanjersberg RF, Brussee J and IJzerman AP (2004). New, non-adenosine, high-potency agonists for the hu-man adenosine A2B receptor with an improved selectivity profile compared to the reference agonist N-ethylcarboxamidoadenosine. J Med Chem 47(15), 3707-3709.
Biber K, Fiebich BL, Gebicke-Harter P and van Calker D (1999). Carbamazepine-induced up-regulation of adenosine A1-receptors in astrocyte cultures affects coupling to the phosphoi-nositol signaling pathway. Neuropsychopharmacology 20(3), 271-278.
Blatz AL and Magleby KL (1984). Ion conductance and selectivity of single calcium-activated potassium channels in cultured rat muscle. J Gen Physiol 84(1), 1-23.
Blatz AL and Magleby KL (1986). Single apamin-blocked Ca-activated K+ channels of small conductance in cultured rat skeletal muscle. Nature 323(6090), 718-720.
Bo X, Kim M, Nori SL, Schoepfer R, Burnstock G and North RA (2003). Tissue distribution of

References 147
P2X4 receptors studied with an ectodomain antibody. Cell Tissue Res 313(2), 159-165.Bodin P and Burnstock G (2001). Purinergic signalling: ATP release. Neurochem Res 26(8-9),
959-969.Boehm S (1998). Selective inhibition of M-type potassium channels in rat sympathetic neurons
by uridine nucleotide preferring receptors. Br J Pharmacol 124(6), 1261-1269.Bofill-Cardona E, Vartian N, Nanoff C, Freissmuth M and Boehm S (2000). Two different sign-
aling mechanisms involved in the excitation of rat sympathetic neurons by uridine nucle-otides. Mol Pharmacol 57(6), 1165-1172.
Bogdanov Y, Rubino A and BURNSTOCK G (1998). Characterisation of subtypes of the P2X and P2Y families of ATP receptors in the foetal human heart. Life Sci 62(8), 697-703.
Bona E, Aden U, Gilland E, Fredholm BB and Hagberg H (1997). Neonatal cerebral hypox-ia-ischemia: the effect of adenosine receptor antagonists. Neuropharmacology 36(9), 1327-1338.
Borowiec A, Lechward K, Tkacz-Stachowska K and Skladanowski AC (2006). Adenosine as a metabolic regulator of tissue function: production of adenosine by cytoplasmic 5’-nucleoti-dases. Acta Biochim Pol 53(2), 269-278.
Bowler JW, Bailey RJ, North RA and Surprenant A (2003). P2X4, P2Y1 and P2Y2 receptors on rat alveolar macrophages. Br J Pharmacol 140(3), 567-575.
Bowser DN and Khakh BS (2004). ATP excites interneurons and astrocytes to increase synaptic inhibition in neuronal networks. J Neurosci 24(39), 8606-8620.
Boyer JL, Adams M, Ravi RG, Jacobson KA and Harden TK (2002). 2-Chloro N(6)-methyl-(N)-methanocarba-2’-deoxyadenosine-3’,5’-bisphosphate is a selective high affinity P2Y(1) re-ceptor antagonist. Br J Pharmacol 135(8), 2004-2010.
Boyer JL, Mohanram A, Camaioni E, Jacobson KA and Harden TK (1998). Competitive and se-lective antagonism of P2Y1 receptors by N6-methyl 2’-deoxyadenosine 3’,5’-bisphosphate. Br J Pharmacol 124(1), 1-3.
Brake AJ, Wagenbach MJ and Julius D (1994). New structural motif for ligand-gated ion chan-nels defined by an ionotropic ATP receptor. Nature 371(6497), 519-523.
Brand A, Vissiennon Z, Eschke D and Nieber K (2001). Adenosine A(1) and A(3) receptors me-diate inhibition of synaptic transmission in rat cortical neurons. Neuropharmacology 40(1), 85-95.
Brandle U, Kohler K and Wheeler-Schilling TH (1998). Expression of the P2X7-receptor subunit in neurons of the rat retina. Brain Res Mol Brain Res 62(1), 106-109.
Brandle U, Zenner HP and Ruppersberg JP (1999). Gene expression of P2X-receptors in the de-veloping inner ear of the rat. Neurosci Lett 273(2), 105-108.
Bringmann A, Pannicke T, Weick M, Biedermann B, Uhlmann S, Kohen L, Wiedemann P and Reichenbach A (2002). Activation of P2Y receptors stimulates potassium and cation cur-rents in acutely isolated human Muller (glial) cells. Glia 37(2), 139-152.
Brink C, Dahlen SE, Drazen J, Evans JF, Hay DW, Nicosia S, Serhan CN, Shimizu T and Yokomi-zo T (2003). International Union of Pharmacology XXXVII. Nomenclature for leukotriene and lipoxin receptors. Pharmacol Rev 55(1), 195-227.
Brinley YFJ Jr., Kandel ER. and Marshall WH. (1960). Potassium outflux from rabbit cortex dur-ing spreading depression. J Neurophysiol 23, 246-256.
Broch OJ and Ueland PM (1980). Regional and subcellular distribution of S-adenosylhomo-cysteine hydrolase in the adult rat brain. J Neurochem 35(2), 484-488.
Brown DA and Adams PR (1980). Muscarinic suppression of a novel voltage-sensitive K+ cur-rent in a vertebrate neurone. Nature 283(5748), 673-676.
Brown J and Brown CA (2002a). Evaluation of reactive blue 2 derivatives as selective antagonists for P2Y receptors. Vascul Pharmacol 39(6), 309-315.
Brown SG, King BF, Kim YC, Burnstock G and Jacobson KA (2000). Activity of novel adenine nucleotide derivatives as agonists and antagonists at recombinant rat P2X receptors. Drug Dev Res 49, 253-259.
Brown SG, Townsend-Nicholson A, Jacobson KA, Burnstock G and King BF (2002b). Heterom-

Elisabetta Coppi148
ultimeric P2X(1/2) receptors show a novel sensitivity to extracellular pH. J Pharmacol Exp Ther 300(2), 673-680.
Bruns RF and Fergus JH (1990). Allosteric enhancement of adenosine A1 receptor binding and function by 2-amino-3-benzoylthiophenes. Mol Pharmacol 38(6), 939-949.
Buell G, Lewis C, Collo G, North RA and Surprenant A (1996). An antagonist-insensitive P2X receptor expressed in epithelia and brain. EMBO J 15(1), 55-62.
Burke SP and Nadler JV (1988). Regulation of glutamate and aspartate release from slices of the hippocampal CA1 area: effects of adenosine and baclofen. J Neurochem 51(5), 1541-1551.
Burnstock G (1972). Purinergic nerves. Pharmacol Rev 24(3), 509-581.Burnstock G (1976). Do some nerve cells release more than one transmitter? Neuroscience 1(4),
239-248.Burnstock G (1978). A basis for distinguishing two types of purinergic receptor. R.W.Straub and
L.Bolis. Cell Membrane Receptors for Drugs and Hormones: A Multidisciplinary Approach. 107-118. Raven Press .Ref Type: Book Chapter
Burnstock G, Campbell G, Bennett M and Holman Me (1963). Inhibition of the smooth muscle on the taenia coli. Nature 200, 581-582.
Burnstock G, Campbell G, Satchell D and Smythe A (1970). Evidence that adenosine triphos-phate or a related nucleotide is the transmitter substance released by non-adrenergic inhibi-tory nerves in the gut. Br J Pharmacol 40(4), 668-688.
Burnstock G, Cocks T, Kasakov L and Wong HK (1978). Direct evidence for ATP release from non-adrenergic, non-cholinergic (“purinergic”) nerves in the guinea-pig taenia coli and bladder. Eur J Pharmacol 49(2), 145-149.
Burnstock G and Knight GE (2004). Cellular distribution and functions of P2 receptor subtypes in different systems. Int Rev Cytol 240, 31-304.
Calabresi P, Centonze D and Bernardi G (2000). Cellular factors controlling neuronal vulner-ability in the brain: a lesson from the striatum. Neurology 55(9), 1249-1255.
Calabresi P, Misgeld U and Dodt HU (1987). Intrinsic membrane properties of neostriatal neu-rons can account for their low level of spontaneous activity. Neuroscience 20(1), 293-303.
Camaioni E, Boyer JL, Mohanram A, Harden TK and Jacobson KA (1998). Deoxyadenos-ine bisphosphate derivatives as potent antagonists at P2Y1 receptors. J Med Chem 41(2), 183-190.
Cantiello HF, Jackson GR, Jr., Grosman CF, Prat AG, Borkan SC, Wang Y, Reisin IL, O’Riordan CR and Ausiello DA (1998). Electrodiffusional ATP movement through the cystic fibrosis transmembrane conductance regulator. Am J Physiol 274(3 Pt 1), C799-C809.
Caplan AI and Bruder SP (2001). Mesenchymal stem cells: building blocks for molecular medi-cine in the 21st century. Trends Mol Med 7(6), 259-264.
Caplan LR (1998). Stroke treatment: promising but still struggling. JAMA 279(16), 1304-1306.Capra V, Ravasi S, Accomazzo MR, Citro S, Grimoldi M, Abbracchio MP and Rovati GE (2005).
CysLT1 receptor is a target for extracellular nucleotide-induced heterologous desensitiza-tion: a possible feedback mechanism in inflammation. J Cell Sci 118(Pt 23), 5625-5636.
Castell DO (1975). The lower esophageal sphincter. Physiologic and clinical aspects. Ann Intern Med 83(3), 390-401.
Catterall WA, Striessnig J, Snutch TP and Perez-Reyes E (2003). International Union of Phar-macology. XL. Compendium of voltage-gated ion channels: calcium channels. Pharmacol Rev 55(4), 579-581.
Cavaliere F, Amadio S, Sancesario G, Bernardi G and Volonte C (2004). Synaptic P2X7 and ox-ygen/glucose deprivation in organotypic hippocampal cultures. J Cereb Blood Flow Metab 24(4), 392-398.
Cavaliere F, D’Ambrosi N, Ciotti MT, Mancino G, Sancesario G, Bernardi G and Volonte C (2001a). Glucose deprivation and chemical hypoxia: neuroprotection by P2 receptor antag-onists. Neurochem Int 38(3), 189-197.
Cavaliere F, D’Ambrosi N, Sancesario G, Bernardi G and Volonte C (2001b). Hypoglycaemia-

References 149
induced cell death: features of neuroprotection by the P2 receptor antagonist basilen blue. Neurochem Int 38(3), 199-207.
Cavaliere F, Florenzano F, Amadio S, Fusco FR, Viscomi MT, D’Ambrosi N, Vacca F, Sancesario G, Bernardi G, Molinari M and Volonte C (2003). Up-regulation of P2X2, P2X4 receptor and ischemic cell death: prevention by P2 antagonists. Neuroscience 120(1), 85-98.
Charles AC, Merrill JE, Dirksen ER and Sanderson MJ (1991). Intercellular signaling in glial cells: calcium waves and oscillations in response to mechanical stimulation and glutamate. Neuron 6(6), 983-992.
Charles AC, Naus CC, Zhu D, Kidder GM, Dirksen ER and Sanderson MJ (1992). Intercellular calcium signaling via gap junctions in glioma cells. J Cell Biol 118(1), 195-201.
Charlton SJ, Brown CA, Weisman GA, Turner JT, Erb L and Boarder MR (1996). PPADS and suramin as antagonists at cloned P2Y- and P2U-purinoceptors. Br J Pharmacol 118(3), 704-710.
Chaudry IH (1982). Does ATP cross the cell plasma membrane. Yale J Biol Med 55(1), 1-10.Chen BC, Lee CM and Lin WW (1996). Inhibition of ecto-ATPase by PPADS, suramin and re-
active blue in endothelial cells, C6 glioma cells and RAW 264.7 macrophages. Br J Pharma-col 119(8), 1628-1634.
Chen CC, Akopian AN, Sivilotti L, Colquhoun D, BURNSTOCK G and Wood JN (1995). A P2X purinoceptor expressed by a subset of sensory neurons. Nature 377(6548), 428-431.
Chen JF, Huang Z, Ma J, Zhu J, Moratalla R, Standaert D, Moskowitz MA, Fink JS and Schwarzschild MA (1999). A(2A) adenosine receptor deficiency attenuates brain injury in-duced by transient focal ischemia in mice. J Neurosci 19(21), 9192-9200.
Chessell IP, Simon J, Hibell AD, Michel AD, Barnard EA and Humphrey PP (1998). Cloning and functional characterisation of the mouse P2X7 receptor. FEBS Lett 439(1-2), 26-30.
Chhatriwala M, Ravi RG, Patel RI, Boyer JL, Jacobson KA and Harden TK (2004). Induction of novel agonist selectivity for the ADP-activated P2Y1 receptor versus the ADP-activated P2Y12 and P2Y13 receptors by conformational constraint of an ADP analog. J Pharmacol Exp Ther 311(3), 1038-1043.
Choi DW (1990). Possible mechanisms limiting N-methyl-D-aspartate receptor overactiva-tion and the therapeutic efficacy of N-methyl-D-aspartate antagonists. Stroke 21(11 Sup-pl), III20-III22.
Ciana P, Fumagalli M, Trincavelli ML, Verderio C, Rosa P, Lecca D, Ferrario S, Parravicini C, Ca-pra V, Gelosa P, Guerrini U, Belcredito S, Cimino M, Sironi L, Tremoli E, Rovati GE, Martini C and Abbracchio MP (2006). The orphan receptor GPR17 identified as a new dual uracil nucleotides/cysteinyl-leukotrienes receptor. EMBO J
Ciccarelli R, D’Alimonte I, Santavenere C, D’Auro M, Ballerini P, Nargi E, Buccella S, NicosiaFol-co S, Caciagli F and Di Iorio P (2004). Cysteinyl-leukotrienes are released from astrocytes and increase astrocyte proliferation and glial fibrillary acidic protein via cys-LT1 receptors and mitogen-activated protein kinase pathway. Eur J Neurosci 20(6), 1514-1524.
Ciceri P, Rabuffetti M, Monopoli A and Nicosia S (2001). Production of leukotrienes in a model of focal cerebral ischaemia in the rat. Br J Pharmacol 133(8), 1323-1329.
Clapham DE (1995). Calcium signaling. Cell 80(2), 259-268.Cloues R. (1995). Properties of ATP-gated channels recorded from rat sympathetic neurons:
voltage dependence and regulation by Zn2+ ions. J. Neurophysiol. 73(1), 312- 319.Collewijn H and Harreveld AV (1966). Membrane potential of cerebral cortical cells during
reading depression and asphyxia. Exp Neurol 15(4), 425-436.Collo G, Neidhart S, Kawashima E, Kosco-Vilbois M, North RA and Buell G (1997). Tissue dis-
tribution of the P2X7 receptor. Neuropharmacology 36(9), 1277-1283.Collo G, North RA, Kawashima E, Merlo-Pich E, Neidhart S, Surprenant A and Buell G (1996).
Cloning OF P2X5 and P2X6 receptors and the distribution and properties of an extended family of ATP-gated ion channels. J Neurosci 16(8), 2495-2507.
Communi D, Gonzalez NS, Detheux M, Brezillon S, Lannoy V, Parmentier M and Boeynaems JM (2001). Identification of a novel human ADP receptor coupled to G(i). J Biol Chem

Elisabetta Coppi150
276(44), 41479-41485.Communi D, Robaye B and Boeynaems JM (1999). Pharmacological characterization of the hu-
man P2Y11 receptor. Br J Pharmacol 128(6), 1199-1206.Corradetti R, Lo CG, Moroni F, Passani MB and Pepeu G (1984). Adenosine decreases aspartate
and glutamate release from rat hippocampal slices. Eur J Pharmacol 104(1-2), 19-26.Corsi C, Melani A, Bianchi L and Pedata F (2000). Striatal A2A adenosine receptor antagonism
differentially modifies striatal glutamate outflow in vivo in young and aged rats. Neurore-port 11(11), 2591-2595.
Corsi C, Melani A, Bianchi L, Pepeu G and Pedata F (1999). Striatal A2A adenosine receptors differentially regulate spontaneous and K+-evoked glutamate release in vivo in young and aged rats. Neuroreport 10(4), 687-691.
Costenla AR, Lopes LV, de Mendonca A and Ribeiro JA (2001). A functional role for adenos-ine A3 receptors: modulation of synaptic plasticity in the rat hippocampus. Neurosci Lett 302(1), 53-57.
Crack BE, Pollard CE, Beukers MW, Roberts SM, Hunt SF, Ingall AH, McKechnie KC, IJzerman AP and Leff P (1995). Pharmacological and biochemical analysis of FPL 67156, a novel, se-lective inhibitor of ecto-ATPase. Br J Pharmacol 114(2), 475-481.
Cunha RA, Johansson B, Fredholm BB, Ribeiro JA and Sebastiao AM (1995). Adenosine A2A receptors stimulate acetylcholine release from nerve terminals of the rat hippocampus. Neu-rosci Lett 196(1-2), 41-44.
Cunha RA, Johansson B, van dP, I, Sebastiao AM, Ribeiro JA and Fredholm BB (1994). Evi-dence for functionally important adenosine A2a receptors in the rat hippocampus. Brain Res 649(1-2), 208-216.
Cunha RA and Ribeiro JA (2000a). ATP as a presynaptic modulator. Life Sci 68(2), 119-137.Cunha RA, Sebastiao AM and Ribeiro JA (1998). Inhibition by ATP of hippocampal synaptic
transmission requires localized extracellular catabolism by ecto-nucleotidases into adenos-ine and channeling to adenosine A(1) receptors. Journal of Neuroscience 18(6), 1987-1995.
Cunha RA, Vizi ES, Ribeiro JA and Sebastiao AM (1996). Preferential release of ATP and its ex-tracellular catabolism as a source of adenosine upon high- but not low-frequency stimula-tion of rat hippocampal slices. J Neurochem 67(5), 2180-2187.
Curro D and Preziosi P (1998). Non-adrenergic non-cholinergic relaxation of the rat stomach. Gen Pharmacol 31(5), 697-703.
D’Ambrosi N, Cavaliere F, Merlo D, Milazzo L, Mercanti D and Volonte C (2000). Antagonists of P2 receptor prevent NGF-dependent neuritogenesis in PC12 cells. Neuropharmacology 39(6), 1083-1094.
D’Ambrosi N, Murra B, Cavaliere F, Amadio S, Bernardi G, BURNSTOCK G and Volonte C (2001). Interaction between ATP and nerve growth factor signalling in the survival and neuritic outgrowth from PC12 cells. Neuroscience 108(3), 527-534.
D’Ambrosi N, Murra B, Vacca F and Volonte C (2004). Pathways of survival induced by NGF and extracellular ATP after growth factor deprivation. Prog Brain Res 146, 93-100.
Dal Ben D, Lambertucci C, Taffi S, Vttori S, Volpini R, Klotz KN, and Cristalli G (2006). Molecu-lar modeling study of 2-phenylethynyladenosine (PEAdo) derivatives as highly selective A3 adenosine receptor ligands. Purinergic Signalling 2, 589-594.
Daval JL and Nicolas F (1994). Opposite effects of cyclohexyladenosine and theophylline on hy-poxic damage in cultured neurons. Neurosci Lett 175(1-2), 114-116.
Dave S and Mogul DJ (1996). ATP receptor activation potentiates a voltage-dependent Ca chan-nel in hippocampal neurons. Brain Res 715(1-2), 208-216.
Davies JA, Annels SJ, Dickie BG, Ellis Y and Knott NJ (1995). A comparison between the stim-ulated and paroxysmal release of endogenous amino acids from rat cerebellar, striatal and hippocampal slices: a manifestation of spreading depression? J Neurol Sci 131(1), 8-14.
Davis CW, Dowell ML, Lethem M and Van Scott M (1992). Goblet cell degranulation in isolated canine tracheal epithelium: response to exogenous ATP, ADP, and adenosine. Am J Physiol

References 151
262(5 Pt 1), C1313-C1323.De Keyser J, Sulter G and Luiten PG (1999). Clinical trials with neuroprotective drugs in acute
ischaemic stroke: are we doing the right thing? Trends Neurosci 22(12), 535-540.De M, Austin KF, and Dudley MW (1993). Differential distribution of A3 receptors in rat brain.
Society of Neuroscience. Ref Type: Abstract.
Deckert J and Jorgensen MB (1988). Evidence for pre- and postsynaptic localization of adeno-sine A1 receptors in the CA1 region of rat hippocampus: a quantitative autoradiographic study. Brain Res 446(1), 161-164.
Deshpande JK, Siesjo BK and Wieloch T (1987). Calcium accumulation and neuronal damage in the rat hippocampus following cerebral ischemia. J Cereb Blood Flow Metab 7(1), 89-95.
Deuchars SA, Atkinson L, Brooke RE, Musa H, Milligan CJ, Batten TF, Buckley NJ, Parson SH and Deuchars J (2001). Neuronal P2X7 receptors are targeted to presynaptic terminals in the central and peripheral nervous systems. J Neurosci 21(18), 7143-7152.
Deussen A (2000). Metabolic flux rates of adenosine in the heart. Naunyn Schmiedebergs Arch Pharmacol 362(4-5), 351-363.
Di Virgilio F, Ferrari D, Falzoni S, Chiozzi P, Munerati M, Steinberg TH and Baricordi OR (1996). P2 purinoceptors in the immune system. Ciba Found Symp 198, 290-302.
Ding S and Sachs F (1999). Single channel properties of P2X2 purinoceptors. J Gen Physiol 113(5), 695-720.
Dirnagl U, Iadecola C and Moskowitz MA (1999). Pathobiology of ischaemic stroke: an integrat-ed view. Trends Neurosci 22(9), 391-397.
Diverse-Pierluissi M, Dunlap K and Westhead EW (1991). Multiple actions of extracellular ATP on calcium currents in cultured bovine chromaffin cells. Proc Natl Acad Sci U S A 88(4), 1261-1265.
Dixon AK, Gubitz AK, Sirinathsinghji DJ, Richardson PJ and Freeman TC (1996). Tissue distri-bution of adenosine receptor mRNAs in the rat. Br J Pharmacol 118(6), 1461-1468.
Dixon AK, Widdowson L and Richardson PJ (1997). Desensitisation of the adenosine A1 recep-tor by the A2A receptor in the rat striatum. J Neurochem 69(1), 315-321.
Douglas WW and Poisner AM (1966). Evidence that the secreting adrenal chromaffin cell re-leases catecholamines directly from ATP-rich granules. J Physiol 183(1), 236-248.
Dowdall MJ, Boyne AF and Whittaker VP (1974). Adenosine triphosphate. A constituent of cholinergic synaptic vesicles. Biochem J 140(1), 1-12.
Drakulich DA, Spellmon C and Hexum TD (2004). Effect of the ecto-ATPase inhibitor, ARL 67156, on the bovine chromaffin cell response to ATP. Eur J Pharmacol 485(1-3), 137-140.
Drazen JM (2003). Leukotrienes in asthma. Adv Exp Med Biol 525, 1-5.Drury AN and Szent-Gyorgyi A (1929). The physiological activity of adenine compounds with
especial reference to their action upon the mammalian heart. J Physiol 68(3), 213-237.Duan S, Anderson CM, Keung EC, Chen Y, Chen Y and Swanson RA (2003). P2X7 receptor-me-
diated release of excitatory amino acids from astrocytes. J Neurosci 23(4), 1320-1328.Dunwiddie TV and Diao L (2000). Regulation of extracellular adenosine in rat hippocampal
slices is temperature dependent: role of adenosine transporters. Neuroscience 95(1), 81-88.Dunwiddie TV, Diao L, Kim HO, Jiang JL and Jacobson KA (1997a). Activation of hippocampal
adenosine A3 receptors produces a desensitization of A1 receptor-mediated responses in rat hippocampus. J Neurosci 17(2), 607-614.
Dunwiddie TV, Diao L and Proctor WR (1997b). Adenine nucleotides undergo rapid, quan-titative conversion to adenosine in the extracellular space in rat hippocampus. J Neurosci 17(20), 7673-7682.
Duval M, Beaudoin AR, Bkaily G, Gendron FP and Orleans-Juste P (2003). Characterization of the NTPDase activities in the mesentery pre- and post-capillary circuits of the guinea pig. Can J Physiol Pharmacol 81(3), 212-219.
Dux E, Fastbom J, Ungerstedt U, Rudolphi K and Fredholm BB (1990). Protective effect of ad-enosine and a novel xanthine derivative propentofylline on the cell damage after bilateral

Elisabetta Coppi152
carotid occlusion in the gerbil hippocampus. Brain Res 516(2), 248-256.Dux E, Schubert P and Kreutzberg GW (1992). Ultrastructural localization of calcium in ischem-
ic hippocampal slices: the influence of adenosine and theophylline. J Cereb Blood Flow Me-tab 12(3), 520-524.
Edwards FA, Konnerth A, Sakmann B and Takahashi T (1989). A thin slice preparation for patch clamp recordings from neurones of the mammalian central nervous system. Pflugers Arch. 414(5), 600-612.
Edwards FA, Gibb AJ and Colquhoun D (1992a). ATP receptor-mediated synaptic currents in the central nervous system. Nature 359(6391), 144-147.
Edwards FA and Konnerth A (1992b). Patch-clamping cells in sliced tissue preparations. Meth-ods Enzymol 207, 208-222.
Ellenbogen KA, O’Neill G, Prystowsky EN, Camm JA, Meng L, Lieu HD, Jerling M, Shreeniwas R, Belardinelli L and Wolff AA (2005). Trial to evaluate the management of paroxysmal su-praventricular tachycardia during an electrophysiology study with tecadenoson. Circulation 111(24), 3202-3208.
Eltzschig HK, Abdulla P, Hoffman E, Hamilton KE, Daniels D, Schonfeld C, Loffler M, Reyes G, Duszenko M, Karhausen J, Robinson A, Westerman KA, Coe IR and Colgan SP (2005). HIF-1-dependent repression of equilibrative nucleoside transporter (ENT) in hypoxia. J Exp Med 202(11), 1493-1505.
Ennion SJ and Evans RJ (2002). Conserved cysteine residues in the extracellular loop of the hu-man P2X(1) receptor form disulfide bonds and are involved in receptor trafficking to the cell surface. Mol Pharmacol 61(2), 303-311.
Erb L, Garrad R, Wang Y, Quinn T, Turner JT and Weisman GA (1995). Site-directed mutagen-esis of P2U purinoceptors. Positively charged amino acids in transmembrane helices 6 and 7 affect agonist potency and specificity. J Biol Chem 270(9), 4185-4188.
Erb L, Liao Z, Seye CI and Weisman GA (2006). P2 receptors: intracellular signaling. Pflugers Arch 452(5), 552-562.
Erdmann AA, Gao ZG, Jung U, Foley J, Borenstein T, Jacobson KA and Fowler DH (2005). Acti-vation of Th1 and Tc1 cell adenosine A2A receptors directly inhibits IL-2 secretion in vitro and IL-2-driven expansion in vivo. Blood 105(12), 4707-4714.
Etherington LA and Frenguelli BG (2004). Endogenous adenosine modulates epileptiform ac-tivity in rat hippocampus in a receptor subtype-dependent manner. Eur J Neurosci 19(9), 2539-2550.
Evans RJ, Derkach V and Surprenant A (1992). ATP mediates fast synaptic transmission in mammalian neurons. Nature 357(6378), 503-505.
Evans RJ, Lewis C, Virginio C, Lundstrom K, Buell G, Surprenant A and North RA (1996). Ionic permeability of, and divalent cation effects on, two ATP-gated cation channels (P2X recep-tors) expressed in mammalian cells. J Physiol 497 ( Pt 2)(413-422.
Faber ES and Sah P (2003). Calcium-activated potassium channels: multiple contributions to neuronal function. Neuroscientist 9(3), 181-194.
Falzoni S, Munerati M, Ferrari D, Spisani S, Moretti S and Di Virgilio F (1995). The purinergic P2Z receptor of human macrophage cells. Characterization and possible physiological role. J Clin Invest 95(3), 1207-1216.
Fedorova IM, Jacobson MA, Basile A and Jacobson KA (2003). Behavioral characterization of mice lacking the A3 adenosine receptor: sensitivity to hypoxic neurodegeneration. Cell Mol Neurobiol 23(3), 431-447.
Feoktistov I and Biaggioni I (1997). Adenosine A2B receptors. Pharmacol Rev 49(4), 381-402.Ferguson DR (1999). Urothelial function. BJU Int 84(3), 235-242.Ferguson G, Watterson KR and Palmer TM (2000). Subtype-specific kinetics of inhibitory ad-
enosine receptor internalization are determined by sensitivity to phosphorylation by G pro-tein-coupled receptor kinases. Mol Pharmacol 57(3), 546-552.
Fernandez-Fernandez JM, Abogadie FC, Milligan G, Delmas P and Brown DA (2001). Multiple pertussis toxin-sensitive G-proteins can couple receptors to GIRK channels in rat sympa-

References 153
thetic neurons when expressed heterologously, but only native G(i)-proteins do so in situ. Eur J Neurosci 14(2), 283-292.
Ferrari D, Chiozzi P, Falzoni S, Hanau S and Di Virgilio F (1997). Purinergic modulation of in-terleukin-1 beta release from microglial cells stimulated with bacterial endotoxin. J Exp Med 185(3), 579-582.
Ferrè S, von Euler G, Johansson B, Fredholm BB and Fuxe K (1991). Stimulation of high-affinity adenosine A2 receptors decreases the affinity of dopamine D2 receptors in rat striatal mem-branes. Proc Natl Acad Sci U S A 88(16), 7238-7241.
Fieber LA and Adams DJ (1991). Adenosine triphosphate-evoked currents in cultured neurones dissociated from rat parasympathetic cardiac ganglia. J Physiol 434, 239-256.
Fiebich BL, Biber K, Lieb K, van Calker D, Berger M, Bauer J and Gebicke-Haerter PJ (1996). Cyclooxygenase-2 expression in rat microglia is induced by adenosine A2a-receptors. Glia 18(2), 152-160.
Filippov AK and Brown DA (1996). Activation of nucleotide receptors inhibits high-threshold calcium currents in NG108-15 neuronal hybrid cells. Eur J Neurosci 8(6), 1149-1155.
Filippov AK, Fernandez-Fernandez JM, Marsh SJ, Simon J, Barnard EA and Brown DA (2004). Activation and inhibition of neuronal G protein-gated inwardly rectifying K(+) channels by P2Y nucleotide receptors. Mol Pharmacol 66(3), 468-477.
Filippov AK, Selyanko AA, Robbins J and Brown DA (1994). Activation of nucleotide receptors inhibits M-type K current [IK(M)] in neuroblastoma x glioma hybrid cells. Pflugers Arch 429(2), 223-230.
Filippov AK, Simon J, Barnard EA and Brown DA (2003). Coupling of the nucleotide P2Y4 re-ceptor to neuronal ion channels. Br J Pharmacol 138(2), 400-406.
Filippov AK, Webb TE, Barnard EA and Brown DA (1998). P2Y2 nucleotide receptors expressed heterologously in sympathetic neurons inhibit both N-type Ca2+ and M-type K+ currents. J Neurosci 18(14), 5170-5179.
Filippov AK, Webb TE, Barnard EA and Brown DA (1999). Dual coupling of heterologously-ex-pressed rat P2Y6 nucleotide receptors to N-type Ca2+ and M-type K+ currents in rat sym-pathetic neurones. Br J Pharmacol 126(4), 1009-1017.
Fleming KM and Mogul DJ (1997). Adenosine A3 receptors potentiate hippocampal calci-um current by a PKA-dependent/PKC-independent pathway. Neuropharmacology 36(3), 353-362.
Flores RV, Hernandez-Perez MG, Aquino E, Garrad RC, Weisman GA and Gonzalez FA (2005). Agonist-induced phosphorylation and desensitization of the P2Y2 nucleotide receptor. Mol Cell Biochem 280(1-2), 35-45.
Florio C, Prezioso A, Papaioannou A and Vertua R (1998b). Adenosine A1 receptors modulate anxiety in CD1 mice. Psychopharmacology (Berl) 136(4), 311-319.
Florio C, Prezioso A, Papaioannou A and Vertua R (1998a). Adenosine A1 receptors modulate anxiety in CD1 mice. Psychopharmacology (Berl) 136(4), 311-319.
Fowler JC (1990). Adenosine antagonists alter the synaptic response to in vitro ischemia in the rat hippocampus. Brain Res 509(2), 331-334.
Franke H and Illes P (2006). Involvement of P2 receptors in the growth and survival of neurons in the CNS. Pharmacol Ther 109(3), 297-324.
Franke H, Kittner H, Grosche J and Illes P (2003). Enhanced P2Y1 receptor expression in the brain after sensitisation with d-amphetamine. Psychopharmacology (Berl) 167(2), 187-194.
Fraser H, Gao Z, Ozeck MJ and Belardinelli L (2003). N-[3-(R)-tetrahydrofuranyl]-6-aminopu-rine riboside, an A1 adenosine receptor agonist, antagonizes catecholamine-induced lipoly-sis without cardiovascular effects in awake rats. J Pharmacol Exp Ther 305(1), 225-231.
Fredholm BB (1995). Purinoceptors in the nervous system. Pharmacol Toxicol 76(4), 228-239.Fredholm BB, Arslan G, Halldner L, Kull B, Schulte G and Wasserman W (2000). Structure and
function of adenosine receptors and their genes. Naunyn Schmiedebergs Arch Pharmacol 362(4-5), 364-374.
Fredholm BB, Chen JF, Masino SA and Vaugeois JM (2005). Actions of adenosine at its receptors

Elisabetta Coppi154
in the CNS: insights from knockouts and drugs. Annu Rev Pharmacol Toxicol 45, 385-412.Fredholm BB and Dunwiddie TV (1988). How does adenosine inhibit transmitter release?
Trends Pharmacol Sci 9(4), 130-134.Fredholm BB, IJzerman AP, Jacobson KA, Klotz KN and Linden J (2001). International Union
of Pharmacology. XXV. Nomenclature and classification of adenosine receptors. Pharmacol Rev 53(4), 527-552.
Fredholm BB and Svenningsson P (2003). Adenosine-dopamine interactions: development of a concept and some comments on therapeutic possibilities. Neurology 61(11 Suppl 6), S5-S9.
Fredriksson R, Lagerstrom MC, Lundin LG and Schioth HB (2003). The G-protein-coupled re-ceptors in the human genome form five main families. Phylogenetic analysis, paralogon groups, and fingerprints. Mol Pharmacol 63(6), 1256-1272.
Frenguelli BG, Llaudet E and Dale N (2006). Real-time measurements of ATP and adenosine re-lease during oxygen-glucose deprivation in area CA1 of rat hippocampal slices. 24-5-2006. Paper presented at the 8th International Symposium on Adenosine and Adenine Nucle-otides, Univesity of Ferrara, Ferrara, Italy, 24-28 May 2006. 24-5-2006. Ref Type: Confer-ence Proceeding
Fugate SE and Cudd LA (2006). Cangrelor for treatment of coronary thrombosis. Ann Pharma-cother 40(5), 925-930.
Fujii S (2004). ATP- and adenosine-mediated signaling in the central nervous system: the role of extracellular ATP in hippocampal long-term potentiation. J Pharmacol Sci 94(2), 103-106.
Fujii S, Ito K, Osada H, Hamaguchi T, Kuroda Y and Kato H (1995a). Extracellular phosphor-ylation of membrane protein modifies theta burst-induced long-term potentiation in CA1 neurons of guinea-pig hippocampal slices. Neurosci Lett 187(2), 133-136.
Fujii S, Kato H, Furuse H, Ito K, Osada H, Hamaguchi T and Kuroda Y (1995b). The mechanism of ATP-induced long-term potentiation involves extracellular phosphorylation of mem-brane proteins in guinea-pig hippocampal CA1 neurons. Neurosci Lett 187(2), 130-132.
Fujii S, Kato H and Kuroda Y (1999). Extracellular adenosine 5’-triphosphate plus activation of glutamatergic receptors induces long-term potentiation in CA1 neurons of guinea pig hip-pocampal slices. Neurosci Lett 276(1), 21-24.
Fujii S, Kato H and Kuroda Y (2002). Cooperativity between extracellular adenosine 5’-triphos-phate and activation of N-methyl-D-aspartate receptors in long-term potentiation induc-tion in hippocampal CA1 neurons. Neuroscience 113(3), 617-628.
Fulgenzi A, Dell’Antonio G, Foglieni C, Dal Cin E, Ticozzi P, Franzone JS and Ferrero ME (2005). Inhibition of chemokine expression in rat inflamed paws by systemic use of the antihyperal-gesic oxidized ATP. BMC Immunol 6, 18-25
Fumagalli M, Brambilla R, D’Ambrosi N, Volonte C, Matteoli M, Verderio C and Abbracchio MP (2003). Nucleotide-mediated calcium signaling in rat cortical astrocytes: Role of P2X and P2Y receptors. Glia 43(3), 218-03.
Gaarder A, Jonsen J, Laland S, Hellem A and Owren Pa (1961). Adenosine diphosphate in red cells as a factor in the adhesiveness of human blood platelets. Nature 192, 531-532.
Gachet C (2005). The platelet P2 receptors as molecular targets for old and new antiplatelet drugs. Pharmacol Ther 108(2), 180-192.
Galietta LJ, Falzoni S, Di Virgilio F, Romeo G and Zegarra-Moran O (1997). Characteriza-tion of volume-sensitive taurine- and Cl(-)-permeable channels. Am J Physiol 273(1 Pt 1), C57-C66.
Galvez A, Gimenez-Gallego G, Reuben JP, Roy-Contancin L, Feigenbaum P, Kaczorowski GJ and Garcia ML (1990). Purification and characterization of a unique, potent, peptidyl probe for the high conductance calcium-activated potassium channel from venom of the scorpion Buthus tamulus. J Biol Chem 265(19), 11083-11090.
Gamper N, Reznikov V., Yamada Y. Yang J. and Shapiro MS. (2004). Phosphatidylinositol [cor-rection] 4,5-bisphosphate signals underlie receptor-specific Gq/11-mediated modulation of N-type Ca2+ channels. J Neurosci 24(48), 10980-10992.

References 155
Gandia L, Garcia AG and Morad M (1993). ATP modulation of calcium channels in chromaffin cells. J Physiol 470, 55-72.
Gao Y and Phillis JW (1994). CGS 15943, an adenosine A2 receptor antagonist, reduces cerebral ischemic injury in the Mongolian gerbil. Life Sci 55(3), L61-L65.
Gao ZG, Mamedova L, Tchilibon S, Gross AS and Jacobson KA (2004). 2,2’-Pyridylisatogen to-sylate antagonizes P2Y1 receptor signaling without affecting nucleotide binding. Biochem Pharmacol 68(2), 231-237.
Gardos G (1958). The function of calcium in the potassium permeability of human erythrocytes. Biochim Biophys Acta 30(3), 653-654.
Gendron FP, Chalimoniuk M, Strosznajder J, Shen S, Gonzalez FA, Weisman GA and Sun GY (2003). P2X7 nucleotide receptor activation enhances IFN gamma-induced type II nitric oxide synthase activity in BV-2 microglial cells. J Neurochem 87(2), 344-352.
Gerasimovskaya EV, Ahmad S, White CW, Jones PL, Carpenter TC and Stenmark KR (2002). Extracellular ATP is an autocrine/paracrine regulator of hypoxia-induced adventitial fi-broblast growth. Signaling through extracellular signal-regulated kinase-1/2 and the Egr-1 transcription factor. J Biol Chem 277(47), 44638-44650.
Gerfen CR and Young WS, III (1988). Distribution of striatonigral and striatopallidal peptider-gic neurons in both patch and matrix compartments: an in situ hybridization histochemis-try and fluorescent retrograde tracing study. Brain Res 460(1), 161-167.
Glynn IM (1968). Membrane adenosine triphosphatase and cation transport. Br Med Bull 24(2), 165-169.
Goldberg JA and Wilson CJ (2005). Control of spontaneous firing patterns by the selective cou-pling of calcium currents to calcium-activated potassium currents in striatal cholinergic in-terneurons. J Neurosci 25(44), 10230-10238.
Gomes P, Srinivas SP, Van Driessche W, Vereecke J and Himpens B (2005a). ATP release through connexin hemichannels in corneal endothelial cells. Invest Ophthalmol Vis Sci 46(4), 1208-1218.
Gomes P, Srinivas SP, Vereecke J and Himpens B (2005b). ATP-dependent paracrine intercellu-lar communication in cultured bovine corneal endothelial cells. Invest Ophthalmol Vis Sci 46(1), 104-113.
Gordon JL (1986). Extracellular ATP: effects, sources and fate. Biochem J 233(2), 309-319.Gotz T, Kraushaar U, Geiger J, Lubke J, Berger T and Jonas P (1997). Functional properties of
AMPA and NMDA receptors expressed in identified types of basal ganglia neurons. J Neu-rosci 17(1), 204-215.
Gourine AV, Dale N, Gourine VN and Spyer KM (2004). Fever in systemic inflammation: roles of purines. Front Biosci 9, 1011-1022.
Grafstein B (1956). Mechanism of spreading cortical depression. J Neurophysiol 19(2), 154-171.Greco NJ, Tonon G, Chen W, Luo X, Dalal R and Jamieson GA (2001). Novel structurally altered
P(2X1) receptor is preferentially activated by adenosine diphosphate in platelets and meg-akaryocytic cells. Blood 98(1), 100-107.
Green HN and Stoner HB (1950). Biological Actions of theAdenine Nucleotides. H.K. Lewis and Co., London.. Ref Type: Book.
Gribkoff VK, Bauman LA and VanderMaelen CP (1990). The adenosine antagonist 8-cy-clopentyltheophylline reduces the depression of hippocampal neuronal responses during hypoxia. Brain Res 512(2), 353-357.
Griffith and Jarvis. Nucleoside and nucleobase transport systems in mammalian cells. 1286. 1996. Biochem Biophys Acta.
Grygorczyk R, Tabcharani JA and Hanrahan JW (1996). CFTR channels expressed in CHO cells do not have detectable ATP conductance. J Membr Biol 151(2), 139-148.
Hafting T and Sand O (2000). Purinergic activation of BK channels in clonal kidney cells (Vero cells). Acta Physiol Scand 170(2), 99-109.

Elisabetta Coppi156
Hagberg H, Andersson P, Lacarewicz J, Jacobson I, Butcher S and Sandberg M (1987). Extracel-lular adenosine, inosine, hypoxanthine, and xanthine in relation to tissue nucleotides and purines in rat striatum during transient ischemia. J Neurochem 49(1), 227-231.
Hamill OP, Marty A, Neher E, Sakmann B and Sigworth FJ (1981). Improved patch-clamp tech-niques for high-resolution current recording from cells and cell-free membrane patches. Pflugers Arch 391(2), 85-100.
Hansen AJ and Nedergaard M (1988). Brain ion homeostasis in cerebral ischemia. Neurochem Pathol 9, 195-209.
Hansen MA, Bennett MR and Barden JA (1999a). Distribution of purinergic P2X receptors in the rat heart. J Auton Nerv Syst 78(1), 1-9.
Hansen MA, Dutton JL, Balcar VJ, Barden JA and Bennett MR (1999b). P2X (purinergic) recep-tor distributions in rat blood vessels. J Auton Nerv Syst 75(2-3), 147-155.
Hardy AR, Conley PB, Luo J, Benovic JL, Poole AW and Mundell SJ (2005). P2Y1 and P2Y12 receptors for ADP desensitize by distinct kinase-dependent mechanisms. Blood 105(9), 3552-3560.
Hauser RA, Hubble JP and Truong DD (2003). Randomized trial of the adenosine A(2A) recep-tor antagonist istradefylline in advanced PD. Neurology 61(3), 297-303.
He ML, Zemkova H, Koshimizu TA, Tomic M and Stojilkovic SS (2003). Intracellular calcium measurements as a method in studies on activity of purinergic P2X receptor channels. Am J Physiol Cell Physiol 285(2), C467-C479.
Hechler B, Toselli P, Ravanat C, Gachet C and Ravid K (2001). Mpl ligand increases P2Y1 recep-tor gene expression in megakaryocytes with no concomitant change in platelet response to ADP. Mol Pharmacol 60(5), 1112-1120.
Hede SE, Amstrup J, Klaerke DA and Novak I (2005). P2Y2 and P2Y4 receptors regulate pancre-atic Ca(2+)-activated K+ channels differently. Pflugers Arch., 450(6), 429-436.
Heine C, Heimrich B, Vogt J, Wegner A, Illes P and Franke H (2006). P2 receptor-stimulation influences axonal outgrowth in the developing hippocampus in vitro. Neuroscience 138(1), 303-311.
Henriksen Z, Hiken JF, Steinberg TH and Jorgensen NR (2006). The predominant mechanism of intercellular calcium wave propagation changes during long-term culture of human oste-oblast-like cells. Cell Calcium 39(5), 435-444.
Hentschel S, Lewerenz A and Nieber K (2003). Activation of A(3) receptors by endogenous ad-enosine inhibits synaptic transmission during hypoxia in rat cortical neurons. Restor Neurol Neurosci 21(1-2), 55-63.
Herold CL, Qi AD, Harden TK and Nicholas RA (2004). Agonist versus antagonist action of ATP at the P2Y4 receptor is determined by the second extracellular loop. J Biol Chem 279(12), 11456-11464.
Herreras O and Jing J (1993a). Blockade of antidromic invasion of CA1 pyramidal cells during synaptic activation of NMDA receptors. Brain Res 616(1-2), 330-334.
Herreras O and Somjen GG (1993b). Effects of prolonged elevation of potassium on hippocam-pus of anesthetized rats. Brain Res 617(2), 194-204.
Herreras O and Somjen GG (1993c). Propagation of spreading depression among dendrites and somata of the same cell population. Brain Res 610(2), 276-282.
Hettinger BD, Lee A, Linden J and Rosin DL (2001). Ultrastructural localization of adenosine A2A receptors suggests multiple cellular sites for modulation of GABAergic neurons in rat striatum. J Comp Neurol 431(3), 331-346.
Heubach JF, Graf EM, Leutheuser J, Bock M, Balana B, Zahanich I, Christ T, Boxberger S, Wet-twer E and Ravens U (2004). Electrophysiological properties of human mesenchymal stem cells. J Physiol 554(Pt 3), 659-672.
Hillion J, Canals M, Torvinen M, Casado V, Scott R, Terasmaa A, Hansson A, Watson S, Olah ME, Mallol J, Canela EI, Zoli M, Agnati LF, Ibanez CF, Lluis C, Franco R, Ferre S and Fuxe K (2002). Coaggregation, cointernalization, and codesensitization of adenosine A2A recep-

References 157
tors and dopamine D2 receptors. J Biol Chem 277(20), 18091-18097.Hoehn K, Watson TW and MacVicar BA (1993). Multiple types of calcium channels in acutely
isolated rat neostriatal neurons. J Neurosci 13(3), 1244-1257.Hofer A and Dermietzel R (1998). Visualization and functional blocking of gap junction
hemichannels (connexons) with antibodies against external loop domains in astrocytes. Glia 24(1), 141-154.
Hoffman CJ, Clark FJ and Ochs S (1973). Intracortical impedance changes during spreading de-pression. J Neurobiol 4(5), 471-486.
Hogg RC, Chipperfield H, Whyte KA, Stafford MR, Hansen MA, Cool SM, Nurcombe V and Adams DJ (2004). Functional maturation of isolated neural progenitor cells from the adult rat hippocampus. Eur J Neurosci 19(9), 2410-2420.
Holgate ST (2005). The Quintiles Prize Lecture 2004. The identification of the adenosine A2B re-ceptor as a novel therapeutic target in asthma. Br J Pharmacol 145(8), 1009-1015.
Hollopeter G, Jantzen HM, Vincent D, Li G, England L, Ramakrishnan V, Yang RB, Nurden P, Nurden A, Julius D and Conley PB (2001). Identification of the platelet ADP receptor tar-geted by antithrombotic drugs. Nature 409(6817), 202-207.
Horrigan FT and Aldrich RW (2002). Coupling between voltage sensor activation, Ca2+ bind-ing and channel opening in large conductance (BK) potassium channels. J Gen Physiol 120(3), 267-305.
Houston D, Ohno M, Nicholas RA, Jacobson KA and Harden TK (2006). [32P]2-iodo-N6-me-thyl-(N)-methanocarba-2’-deoxyadenosine-3’,5’-bisphosphat e ([32P]MRS2500), a novel radioligand for quantification of native P2Y1 receptors. Br J Pharmacol 147(5), 459-467.
Hu GY, Hvalby O, Walaas SI, Albert KA, Skjeflo P, Andersen P and Greengard P (1987). Protein kinase C injection into hippocampal pyramidal cells elicits features of long term potentia-tion. Nature 328(6129), 426-429.
Hu HZ, Gao N, Zhu MX, Liu S, Ren J, Gao C, Xia Y and Wood JD (2003). Slow excitatory syn-aptic transmission mediated by P2Y1 receptors in the guinea-pig enteric nervous system. J Physiol 550(Pt 2), 493-504.
Huang CM and Kao LS (1996). Nerve growth factor, epidermal growth factor, and insulin differ-entially potentiate ATP-induced [Ca2+]i rise and dopamine secretion in PC12 cells. J Neu-rochem 66(1), 124-130.
Hugel S and Schlichter R (2000). Presynaptic P2X receptors facilitate inhibitory GABAer-gic transmission between cultured rat spinal cord dorsal horn neurons. J Neurosci 20(6), 2121-2130.
Hussl S and Boehm S (2006). Functions of neuronal P2Y receptors. Pflugers Arch 452(5), 538-551.
Hutchison AJ, Webb RL, Oei HH, Ghai GR, Zimmerman MB and Williams M (1989). CGS 21680C, an A2 selective adenosine receptor agonist with preferential hypotensive activity. J Pharmacol Exp Ther 251(1), 47-55.
Ikeda M (2006). Characterization of functional P2X(1) receptors in mouse megakaryocytes. Thromb Res
Ikeuchi Y and Nishizaki T (1995). ATP-evoked potassium currents in rat striatal neurons are mediated by a P2 purinergic receptor. Neurosci Lett 190(2), 89-92.
Ikeuchi Y and Nishizaki T (1996a). P2 purinoceptor-operated potassium channel in rat cerebel-lar neurons. Biochem Biophys Res Commun 218(1), 67-71.
Ikeuchi Y, Nishizaki T, Mori M and Okada Y (1996b). Regulation of the potassium current and cytosolic Ca2+ release induced by 2-methylthio ATP in hippocampal neurons. Biochem Bi-ophys Res Commun 218(2), 428-433.
Iqbal J, Vollmayer P, Braun N, Zimmermann H and Muller CE (2005). A capillary electrophore-sis method for the characterization of ecto-nucleoside triphosphate diphosphohydrolases (NTPDases) and the analysis of inhibitors by in-capillary enzymatic microreaction. Purin-ergic Signalling 1, 349-358.
Ishii TM, Silvia C, Hirschberg B, Bond CT, Adelman JP and Maylie J (1997). A human interme-

Elisabetta Coppi158
diate conductance calcium-activated potassium channel. Proc Natl Acad Sci U S A 94(21), 11651-11656.
Izzo PN, Graybiel AM and Bolam JP (1987). Characterization of substance P- and [Met]enkephalin-immunoreactive neurons in the caudate nucleus of cat and ferret by a sin-gle section Golgi procedure. Neuroscience 20(2), 577-587.
Jacobson KA, Jarvis MF and Williams M (2002). Purine and pyrimidine (P2) receptors as drug targets. J Med Chem 45(19), 4057-4093.
Jacobson KA, Park KS, Jiang JL, Kim YC, Olah ME, Stiles GL and Ji XD (1997). Pharmacologi-cal characterization of novel A3 adenosine receptor-selective antagonists. Neuropharmacol-ogy 36(9), 1157-1165.
Jain M, Armstrong RJ, Barker RA and Rosser AE (2001). Cellular and molecular aspects of stri-atal development. Brain Res Bull 55(4), 533-540.
James S and Richardson PJ (1993). Production of adenosine from extracellular ATP at the stri-atal cholinergic synapse. J Neurochem 60(1), 219-227.
Jarvis MF, Bianchi B, Uchic JT, Cartmell J, Lee CH, Williams M and Faltynek C (2004). [3H]A-317491, a novel high-affinity non-nucleotide antagonist that specifically labels human P2X2/3 and P2X3 receptors. J Pharmacol Exp Ther 310(1), 407-416.
Jarvis MF and Williams M (1989). Direct autoradiographic localization of adenosine A2 recep-tors in the rat brain using the A2-selective agonist, [3H]CGS 21680. Eur J Pharmacol 168(2), 243-246.
Jenkinson KM and Reid JJ (2000). The P(2)-purinoceptor antagonist suramin is a competitive antagonist at vasoactive intestinal peptide receptors in the rat gastric fundus. Br J Pharma-col 130(7), 1632-1638.
Jeong LS, Jin DZ, Kim HO, Shin DH, Moon HR, Gunaga P, Chun MW, Kim YC, Melman N, Gao ZG and Jacobson KA (2003). N6-substituted D-4’-thioadenosine-5’-methyluronamides: potent and selective agonists at the human A3 adenosine receptor. J Med Chem 46(18), 3775-3777.
Ji X, Kim YC, Ahern DG, Linden J and Jacobson KA (2001). [3H]MRS 1754, a selective antago-nist radioligand for A(2B) adenosine receptors. Biochem Pharmacol 61(6), 657-663.
Ji XD, Gallo-Rodriguez C and Jacobson KA (1994). A selective agonist affinity label for A3 ad-enosine receptors. Biochem Biophys Res Commun 203(1), 570-576.
Jiang LH, Mackenzie AB, North RA and Surprenant A (2000a). Brilliant blue G selectively blocks ATP-gated rat P2X(7) receptors. Mol Pharmacol 58(1), 82-88.
Jiang LH, Rassendren F, Surprenant A and North RA (2000b). Identification of amino acid resi-dues contributing to the ATP-binding site of a purinergic P2X receptor. J Biol Chem 275(44), 34190-34196.
Jiang Q, Guo D, Lee BX, Van Rhee AM, Kim YC, Nicholas RA, Schachter JB, Harden TK and Jacobson KA (1997). A mutational analysis of residues essential for ligand recognition at the human P2Y1 receptor. Mol Pharmacol 52(3), 499-507.
Jiang Y, Jahagirdar BN, Reinhardt RL, Schwartz RE, Keene CD, Ortiz-Gonzalez XR, Reyes M, Lenvik T, Lund T, Blackstad M, Du J, Aldrich S, Lisberg A, Low WC, Largaespada DA and Verfaillie CM (2002). Pluripotency of mesenchymal stem cells derived from adult marrow. Nature 418(6893), 41-49.
Jin J, Dasari VR, Sistare FD and Kunapuli SP (1998). Distribution of P2Y receptor subtypes on haematopoietic cells. Br J Pharmacol 123(5), 789-794.
Johansson B, Halldner L, Dunwiddie TV, Masino SA, Poelchen W, Gimenez-Llort L, Escorihue-la RM, Fernandez-Teruel A, Wiesenfeld-Hallin Z, Xu XJ, Hardemark A, Betsholtz C, Her-lenius E and Fredholm BB (2001). Hyperalgesia, anxiety, and decreased hypoxic neuro-protection in mice lacking the adenosine A1 receptor. Proc Natl Acad Sci U S A 98(16), 9407-9412.
Johnson RG, Jr. (1987). Proton pumps and chemiosmotic coupling as a generalized mechanism for neurotransmitter and hormone transport. Ann N Y Acad Sci 493, 162-177.
Juranyi Z, Sperlagh B and Vizi ES (1999). Involvement of P2 purinoceptors and the nitric oxide

References 159
pathway in [3H]purine outflow evoked by short-term hypoxia and hypoglycemia in rat hip-pocampal slices. Brain Res 823(1-2), 183-190.
Kaku T, Hada J and Hayashi Y (1994). Endogenous adenosine exerts inhibitory effects upon the development of spreading depression and glutamate release induced by microdialysis with high K+ in rat hippocampus. Brain Res 658(1-2), 39-48.
Kalckar HM. Biological phosphorylations: development of concepts. 1969. Englewood Cliffs, NJ: Prentice Hall. Ref Type: Conference Proceeding
Kasakov L, Ellis J, Kirkpatrick K, Milner P and Burnstock G (1988). Direct evidence for concom-itant release of noradrenaline, adenosine 5’-triphosphate and neuropeptide Y from sympa-thetic nerve supplying the guinea-pig vas deferens. J Auton Nerv Syst 22(1), 75-82.
Kawaguchi Y (1992). Large aspiny cells in the matrix of the rat neostriatum in vitro: physiologi-cal identification, relation to the compartments and excitatory postsynaptic currents. J Neu-rophysiol 67(6), 1669-1682.
Kawaguchi Y (1993). Physiological, morphological, and histochemical characterization of three classes of interneurons in rat neostriatum. J Neurosci 13(11), 4908-4923.
Kawaguchi Y, Wilson CJ and Emson PC (1989). Intracellular recording of identified neostriatal patch and matrix spiny cells in a slice preparation preserving cortical inputs. J Neurophysiol 62(5), 1052-1068.
Kawamura M, Gachet C, Inoue K and Kato F (2004). Direct excitation of inhibitory interneu-rons by extracellular ATP mediated by P2Y1 receptors in the hippocampal slice. J Neurosci 24(48), 10835-10845.
Kawano S, Otsu K, Kuruma A, Shoji S, Yanagida E, Muto Y, Yoshikawa F, Hirayama Y, Mikoshiba K and Furuichi T (2006). ATP autocrine/paracrine signaling induces calcium oscillations and NFAT activation in human mesenchymal stem cells. Cell Calcium 39(4), 313-324.
Kawasaki K, Czeh G and Somjen GG (1988). Prolonged exposure to high potassium concentra-tion results in irreversible loss of synaptic transmission in hippocampal tissue slices. Brain Res 457(2), 322-329.
Kennedy C, Qi AD, Herold CL, Harden TK and Nicholas RA (2000). ATP, an agonist at the rat P2Y(4) receptor, is an antagonist at the human P2Y(4) receptor. Mol Pharmacol 57(5), 926-931.
Khakh BS. (2001). Molecular physiology of P2X receptors and ATP signalling at synapses. Nat.Rev.Neurosci. 2(3), 165-174.
Khakh BS, Burnstock G, Kennedy C, King BF, North RA, Seguela P, Voigt M and Humphrey PP (2001). International union of pharmacology. XXIV. Current status of the nomenclature and properties of P2X receptors and their subunits. Pharmacol Rev 53(1), 107-118.
Khakh BS and Henderson G (1998). ATP receptor-mediated enhancement of fast excitatory neurotransmitter release in the brain. Mol Pharmacol 54(2), 372-378.
Khakh BS, Humphrey PP and Henderson G (1997). ATP-gated cation channels (P2X purinocep-tors) in trigeminal mesencephalic nucleus neurons of the rat. J Physiol 498 (Pt 3)(709-715.
Kharlamov A, Jones SC and Kim DK (2002). Suramin reduces infarct volume in a model of focal brain ischemia in rats. Exp Brain Res 147(3), 353-359.
Kidd EJ, Grahames CB, Simon J, Michel AD, Barnard EA and Humphrey PP (1995). Locali-zation of P2X purinoceptor transcripts in the rat nervous system. Mol Pharmacol 48(4), 569-573.
Kim M, Spelta V, Sim J, North RA and Surprenant A (2001). Differential assembly of rat pu-rinergic P2X7 receptor in immune cells of the brain and periphery. J Biol Chem 276(26), 23262-23267.
Kim YC, Ji X, Melman N, Linden J and Jacobson KA (2000). Anilide derivatives of an 8-phenylx-anthine carboxylic congener are highly potent and selective antagonists at human A(2B) ad-enosine receptors. J Med Chem 43(6), 1165-1172.
Kim YC, Ji XD and Jacobson KA (1996). Derivatives of the triazoloquinazoline adenosine an-tagonist (CGS15943) are selective for the human A3 receptor subtype. J Med Chem 39(21),

Elisabetta Coppi160
4142-4148.King BF (1998). Cardiovascular biology of purines. Molecular biology of P2X purinoceptors. Ref Type: Book ChapterKing BF, Townsend-Nicholson A, Wildman SS, Thomas T, Spyer KM and BURNSTOCK G
(2000). Coexpression of rat P2X2 and P2X6 subunits in Xenopus oocytes. J Neurosci 20(13), 4871-4877.
Kishore BK, Ginns SM, Krane CM, Nielsen S and Knepper MA (2000). Cellular localization of P2Y(2) purinoceptor in rat renal inner medulla and lung. Am J Physiol Renal Physiol 278(1), F43-F51.
Kitagawa H, Mori A, Shimada J, Mitsumoto Y and Kikuchi T (2002). Intracerebral adenosine infusion improves neurological outcome after transient focal ischemia in rats. Neurol Res 24(3), 317-323.
Klapperstuck M, Buttner C, Nickel P, Schmalzing G, Lambrecht G and Markwardt F (2000). An-tagonism by the suramin analogue NF279 on human P2X(1) and P2X(7) receptors. Eur J Pharmacol 387(3), 245-252.
Knaus HG, Schwarzer C, Koch RO, Eberhart A, Kaczorowski GJ, Glossmann H, Wunder F, Pongs O, Garcia ML and Sperk G (1996). Distribution of high-conductance Ca(2+)-activated K+ channels in rat brain: targeting to axons and nerve terminals. J Neurosci 16(3), 955-963.
Koh SD, Dick GM and Sanders KM (1997). Small-conductance Ca(2+)-dependent K+ chan-nels activated by ATP in murine colonic smooth muscle. Am J Physiol 273(6 Pt 1), C2010-C2021.
Kohler M, Hirschberg B, Bond CT, Kinzie JM, Marrion NV, Maylie J and Adelman JP (1996). Small-conductance, calcium-activated potassium channels from mammalian brain. Science 273(5282), 1709-1714.
Koizumi S, Saito Y, Nakazawa K, Nakajima K, Sawada JI, Kohsaka S, Illes P and Inoue K (2002). Spatial and temporal aspects of Ca2+ signaling mediated by P2Y receptors in cultured rat hippocampal astrocytes. Life Sci.; 72(4-5), 431-442.
Kong W, Engel K and Wang J (2004). Mammalian nucleoside transporters. Curr Drug Metab 5(1), 63-84.
Koroleva VI and Bures J (1996). The use of spreading depression waves for acute and long-term monitoring of the penumbra zone of focal ischemic damage in rats. Proc Natl Acad Sci U S A 93(8), 3710-3714.
Koshimizu TA, Van Goor F, Tomic M, Wong AO, Tanoue A, Tsujimoto G and Stojilkovic SS (2000). Characterization of calcium signaling by purinergic receptor-channels expressed in excitable cells. Mol Pharmacol 58(5), 936-945.
Kow LM and Van Harreveld A (1972). Ion and water movements in isolated chicken retinas dur-ing spreading depression. Neurobiology 2(2), 61-69.
Krishtal OA, Marchenko SM and Obukhov AG (1988). Cationic channels activated by extracel-lular ATP in rat sensory neurons. Neuroscience 27(3), 995-1000.
Kukulski F and Komoszynski M (2003). Purification and characterization of NTPDase1 (ecto-apyrase) and NTPDase2 (ecto-ATPase) from porcine brain cortex synaptosomes. Eur J Bio-chem 270(16), 3447-3454.
Kull B, Arslan G, Nilsson C, Owman C, Lorenzen A, Schwabe U and Fredholm BB (1999). Dif-ferences in the order of potency for agonists but not antagonists at human and rat adenosine A2A receptors. Biochem Pharmacol 57(1), 65-75.
Labasi JM, Petrushova N, Donovan C, McCurdy S, Lira P, Payette MM, Brissette W, Wicks JR, Audoly L and Gabel CA (2002). Absence of the P2X7 receptor alters leukocyte function and attenuates an inflammatory response. J Immunol 168(12), 6436-6445.
Lambrecht G, Braun K, Damer M, Ganso M, Hildebrandt C, Ullmann H, Kassack MU and Nik-kel P (2002). Structure-activity relationships of suramin and pyridoxal-5’-phosphate deriva-tives as P2 receptor antagonists. Curr Pharm Des 8(26), 2371-2399.
Lammer A, Gunther A, Beck A, Krugel U, Kittner H, Schneider D, Illes P and Franke H (2006).

References 161
Neuroprotective effects of the P2 receptor antagonist PPADS on focal cerebral ischaemia-induced injury in rats. Eur J Neurosci 23(10), 2824-2828.
Lappas CM, Rieger JM and Linden J (2005). A2A adenosine receptor induction inhibits IFN-gamma production in murine CD4+ T cells. J Immunol 174(2), 1073-1080.
Latini S, Bordoni F, Corradetti R, Pepeu G and Pedata F (1998). Temporal correlation between adenosine outflow and synaptic potential inhibition in rat hippocampal slices during ischemia-like conditions. Brain Res 794(2), 325-328.
Latini S, Bordoni F, Corradetti R, Pepeu G and Pedata F (1999a). Effect of A2A adenosine recep-tor stimulation and antagonism on synaptic depression induced by in vitro ischaemia in rat hippocampal slices. Br J Pharmacol 128(5), 1035-1044.
Latini S, Bordoni F, Pedata F and Corradetti R (1999b). Extracellular adenosine concentrations during in vitro ischaemia in rat hippocampal slices. Br J Pharmacol 127(3), 729-739.
Latini S, Corsi C, Pedata F and Pepeu G (1995). The source of brain adenosine outflow during ischemia and electrical stimulation. Neurochem Int 27(3), 239-244.
Latini S, Pazzagli M, Pepeu G and Pedata F (1996). A2 adenosine receptors: their presence and neuromodulatory role in the central nervous system. Gen Pharmacol 27(6), 925-933.
Latini S and Pedata F (2001). Adenosine in the central nervous system: release mechanisms and extracellular concentrations. J Neurochem 79(3), 463-484.
Laudadio MA and Psarropoulou C (2004). The A3 adenosine receptor agonist 2-Cl-IB-MECA facilitates epileptiform discharges in the CA3 area of immature rat hippocampal slices. Epi-lepsy Res 59(2-3), 83-94.
Lazarowski ER, Boucher RC and Harden TK (2000). Constitutive release of ATP and evidence for major contribution of ecto-nucleotide pyrophosphatase and nucleoside diphosphoki-nase to extracellular nucleotide concentrations. J Biol Chem 275(40), 31061-31068.
Leão AAP (1944). Spreading depression of activity in the cerebral cortex. J Neurophysiol 7, 359-390.
Leão AAP (1947). Further observations on the spreading depression of activity in the cerebral cortex. J Neurophysiol 10, 409-414.
Leão AAP and Martin-Ferreira H. (1953). Alteraçao de impedancia electrica no decurso de de-pressão alastrante da atividade do córtex cerebral. Ann Acad Brasil Cienc 25, 259-266.
Lechner SG, Dorostkar MM, Mayer M, Edelbauer H, Pankevych H and Boehm S (2004). Au-toinhibition of transmitter release from PC12 cells and sympathetic neurons through a P2Y receptor-mediated inhibition of voltage-gated Ca2+ channels. Eur J Neurosci 20(11), 2917-2928.
Lechner SG, Hussl S, Schicker KW, Drobny H and Boehm S. (2005). Presynaptic inhibition via a phospholipase C- and phosphatidylinositol bisphosphate-dependent regulation of neuronal Ca2+ channels. Mol Pharmacol 68(5), 1387-1396.
Lee HY, Bardini M and BURNSTOCK G (2000). P2X receptor immunoreactivity in the male genital organs of the rat. Cell Tissue Res 300(2), 321-330.
Lee JM, Zipfel GJ and Choi DW (1999). The changing landscape of ischaemic brain injury mech-anisms. Nature 399(6738 Suppl), A7-14.
Lee YC, Chien CL, Sun CN, Huang CL, Huang NK, Chiang MC, Lai HL, Lin YS, Chou SY, Wang CK, Tai MH, Liao WL, Lin TN, Liu FC and Chern Y (2003). Characterization of the rat A2A adenosine receptor gene: a 4.8-kb promoter-proximal DNA fragment confers selective ex-pression in the central nervous system. Eur J Neurosci 18(7), 1786-1796.
Lemoli RM, Ferrari D, Fogli M, Rossi L, Pizzirani C, Forchap S, Chiozzi P, Vaselli D, Bertolini F, Foutz T, Aluigi M, Baccarani M and Di Virgilio F (2004). Extracellular nucleotides are potent stimulators of human hematopoietic stem cells in vitro and in vivo. Blood 104(6), 1662-1670.
Leon C, Hechler B, Vial C, Leray C, Cazenave JP and Gachet C (1997). The P2Y1 receptor is an ADP receptor antagonized by ATP and expressed in platelets and megakaryoblastic cells. FEBS Lett 403(1), 26-30.
Lewis C, Neidhart S, Holy C, North RA, Buell G and Surprenant A (1995). Coexpression of P2X2

Elisabetta Coppi162
and P2X3 receptor subunits can account for ATP-gated currents in sensory neurons. Nature 377(6548), 432-435.
Li AH, Moro S, Melman N, Ji XD and Jacobson KA (1998). Structure-activity relationships and molecular modeling of 3, 5-diacyl-2,4-dialkylpyridine derivatives as selective A3 adenosine receptor antagonists. J Med Chem 41(17), 3186-3201.
Li C, Ramjeesingh M and Bear CE (1996). Purified cystic fibrosis transmembrane con-ductance regulator (CFTR) does not function as an ATP channel. J Biol Chem 271(20), 11623-11626.
Li CM, Campbell SJ, Kumararatne DS, Hill AV and Lammas DA (2002). Response heterogeneity of human macrophages to ATP is associated with P2X7 receptor expression but not to poly-morphisms in the P2RX7 promoter. FEBS Lett 531(2), 127-131.
Li GR, Sun H, Deng X and Lau CP (2005). Characterization of ionic currents in human mesen-chymal stem cells from bone marrow. Stem Cells 23(3), 371-382.
Liang BT (1998). Protein kinase C-dependent activation of KATP channel enhances adenosine-induced cardioprotection. Biochem J 336 ( Pt 2)(337-343.
Lim W, Kim SJ, Yan HD and Kim J (1997). Ca2+-channel-dependent and -independent inhi-bition of exocytosis by extracellular ATP in voltage-clamped rat adrenal chromaffin cells. Pflugers Arch 435(1), 34-42.
Lin Y and Phillis JW (1992). Deoxycoformycin and oxypurinol: protection against focal ischem-ic brain injury in the rat. Brain Res 571(2), 272-280.
Linden J (2001). Molecular approach to adenosine receptors: receptor-mediated mechanisms of tissue protection. Annu Rev Pharmacol Toxicol 41, 775-787.
Linden J, Taylor HE, Robeva AS, Tucker AL, Stehle JH, Rivkees SA, Fink JS and Reppert SM (1993). Molecular cloning and functional expression of a sheep A3 adenosine receptor with widespread tissue distribution. Mol Pharmacol 44(3), 524-532.
Lipton P (1999). Ischemic cell death in brain neurons. Physiol Rev 79(4), 1431-1568.Liu DM and Adams DJ (2001). Ionic selectivity of native ATP-activated (P2X) receptor channels
in dissociated neurones from rat parasympathetic ganglia. J Physiol 534(Pt. 2), 423-435.Liu SF, McCormack DG, Evans TW and Barnes PJ (1989a). Characterization and distribu-
tion of P2-purinoceptor subtypes in rat pulmonary vessels. J Pharmacol Exp Ther 251(3), 1204-1210.
Liu SF, McCormack DG, Evans TW and Barnes PJ (1989b). Evidence for two P2-purinoceptor subtypes in human small pulmonary arteries. Br J Pharmacol 98(3), 1014-1020.
Lopes LV, Rebola N, Pinheiro PC, Richardson PJ, Oliveira CR and Cunha RA (2003). Ade-nosine A3 receptors are located in neurons of the rat hippocampus. Neuroreport 14(12), 1645-1648.
Lopez HS and Adams PR (1989). A G Protein Mediates the Inhibition of the Voltage-Dependent Potassium M Current by Muscarine, LHRH, Substance P and UTP in Bullfrog Sympathetic Neurons. Eur J Neurosci 1(5), 529-542.
Lupica CR, Proctor WR and Dunwiddie TV (1992). Presynaptic inhibition of excitatory synaptic transmission by adenosine in rat hippocampus: analysis of unitary EPSP variance measured by whole-cell recording. J Neurosci 12(10), 3753-3764.
Luthardt J, Borvendeg SJ, Sperlagh B, Poelchen W, Wirkner K and Illes P (2003a). P2Y(1) recep-tor activation inhibits NMDA receptor-channels in layer V pyramidal neurons of the rat prefrontal and parietal cortex. Neurochem Int 42(2), 161-172.
Ma W, Korngreen A, Weil S, Cohen EB, Priel A, Kuzin L and Silberberg SD (2006). Pore prop-erties and pharmacological features of the P2X receptor channel in airway ciliated cells. J Physiol 571(Pt 3), 503-517.
Macdonald RL and Stoodley M (1998). Pathophysiology of cerebral ischemia. Neurol Med Chir (Tokyo) 38(1), 1-11.
Macek TA, Schaffhauser H and Conn PJ (1998). Protein kinase C and A3 adenosine receptor ac-tivation inhibit presynaptic metabotropic glutamate receptor (mGluR) function and uncou-ple mGluRs from GTP-binding proteins. J Neurosci 18(16), 6138-6146.

References 163
Maconi A, Pastorin G, Da Ros T, Spalluto G, Gao ZG, Jacobson KA, Baraldi PG, Cacciari B, Va-rani K, Moro S and Borea PA (2002). Synthesis, biological properties, and molecular mod-eling investigation of the first potent, selective, and water-soluble human A(3) adenosine receptor antagonist. J Med Chem 45(17), 3579-3582.
Malmsjo M, Adner M, Harden TK, Pendergast W, Edvinsson L and Erlinge D (2000). The sta-ble pyrimidines UDPbetaS and UTPgammaS discriminate between the P2 receptors that mediate vascular contraction and relaxation of the rat mesenteric artery. Br J Pharmacol 131(1), 51-56.
Mamedova L, Capra V, Accomazzo MR, Gao ZG, Ferrario S, Fumagalli M, Abbracchio MP, Ro-vati GE and Jacobson KA (2005). CysLT1 leukotriene receptor antagonists inhibit the effects of nucleotides acting at P2Y receptors. Biochem Pharmacol 71(1-2), 115-125.
Marcoli M, Raiteri L, Bonfanti A, Monopoli A, Ongini E, Raiteri M and Maura G (2003). Sensi-tivity to selective adenosine A1 and A2A receptor antagonists of the release of glutamate in-duced by ischemia in rat cerebrocortical slices. Neuropharmacology 45(2), 201-210.
Mark MD, Ruppersberg JP and Herlitze S (2000). Regulation of GIRK channel deactivation by Galpha(q) and Galpha(i/o) pathways. Neuropharmacology 39(12), 2360-2373.
Marteau F, Le Poul E, Communi D, Communi D, Labouret C, Savi P, Boeynaems JM and Gonzal-ez NS (2003). Pharmacological characterization of the human P2Y13 receptor. Mol Phar-macol 64(1), 104-112.
Martinson J (1965). The effect of graded vagal stimulation on gastric motility, secretion and blood flow in the cat. Acta Physiol Scand 65(4), 300-309.
Masino SA, Diao L, Illes P, Zahniser NR, Larson GA, Johansson B, Fredholm BB and Dunwiddie TV (2002a). Modulation of hippocampal glutamatergic transmission by ATP is dependent on adenosine a(1) receptors. J Pharmacol Exp Ther 303(1), 356-363.
Meera P, Wallner M and Toro L (2000). A neuronal beta subunit (KCNMB4) makes the large conductance, voltage- and Ca2+-activated K+ channel resistant to charybdotoxin and ibe-riotoxin. Proc Natl Acad Sci U S A 97(10), 5562-5567.
Meghji P, Skladanowski AC, Newby AC, Slakey LL and Pearson JD (1993). Effect of 5’-deoxy-5’-isobutylthioadenosine on formation and release of adenosine from neonatal and adult rat ventricular myocytes. Biochem J 291 ( Pt 3)(833-839.
Melani A, Amadio S, Gianfriddo M, Vannucchi MG, Volonte C, Bernardi G, Pedata F and San-cesario G (2006). P2X7 receptor modulation on microglial cells and reduction of brain in-farct caused by middle cerebral artery occlusion in rat. J Cereb Blood Flow Metab 26(7), 974-982.
Melani A, Pantoni L, Bordoni F, Gianfriddo M, Bianchi L, Vannucchi MG, Bertorelli R, Mono-poli A and Pedata F (2003). The selective A2A receptor antagonist SCH 58261 reduces stri-atal transmitter outflow, turning behavior and ischemic brain damage induced by perma-nent focal ischemia in the rat. Brain Res 959(2), 243-250.
Melani A, Pantoni L, Corsi C, Bianchi L, Monopoli A, Bertorelli R, Pepeu G and Pedata F (1999). Striatal outflow of adenosine, excitatory amino acids, gamma-aminobutyric acid, and tau-rine in awake freely moving rats after middle cerebral artery occlusion: correlations with neurological deficit and histopathological damage. Stroke 30(11), 2448-2454.
Melani A, Turchi D, Vannucchi MG, Cipriani S, Gianfriddo M and Pedata F (2005). ATP extra-cellular concentrations are increased in the rat striatum during in vivo ischemia. Neurochem Int 47(6), 442-448.
Mellor EA, Maekawa A, Austen KF and Boyce JA (2001). Cysteinyl leukotriene receptor 1 is also a pyrimidinergic receptor and is expressed by human mast cells. Proc Natl Acad Sci U S A 98(14), 7964-7969.
Mendoza-Fernandez V, Andrew RD and Barajas-Lopez C (2000). ATP inhibits glutamate syn-aptic release by acting at P2Y receptors in pyramidal neurons of hippocampal slices. J Phar-macol Exp Ther 293(1), 172-179.
Meng H, Sakakibara M, Nakazawa H and Tokimasa T (2003). Pyridoxalphosphate-6-azophenyl-2’,4’-disulfonic acid can antagonize the purinoceptor-mediated inhibition of M-current in

Elisabetta Coppi164
bullfrog sympathetic neurons. Neurosci Lett 337(2), 93-96.Meyer PT, Elmenhorst D, Bier D, Holschbach MH, Matusch A, Coenen HH, Zilles K and Bauer
A (2005). Quantification of cerebral A1 adenosine receptors in humans using [18F]CPFPX and PET: an equilibrium approach. Neuroimage 24(4), 1192-1204.
Meyerhof W, Muller-Brechlin R and Richter D (1991). Molecular cloning of a novel putative G-protein coupled receptor expressed during rat spermiogenesis. FEBS Lett 284(2), 155-160.
Min JY, Sullivan MF, Yang Y, Zhang JP, Converso KL, Morgan JP and Xiao YF (2002). Significant improvement of heart function by cotransplantation of human mesenchymal stem cells and fetal cardiomyocytes in postinfarcted pigs. Ann Thorac Surg 74(5), 1568-1575.
Mio K, Kubo Y, Ogura T, Yamamoto T and Sato C (2005). Visualization of the trimeric P2X2 receptor with a crown-capped extracellular domain. Biochem Biophys Res Commun 337(3), 998-1005.
Mishra SK, Braun N, Shukla V, Fullgrabe M, Schomerus C, Korf HW, Gachet C, Ikehara Y, Se-vigny J, Robson SC and Zimmermann H (2006). Extracellular nucleotide signaling in adult neural stem cells: synergism with growth factor-mediated cellular proliferation. Develop-ment 133(4), 675-684.
Mohanty JG, Raible DG, McDermott LJ, Pelleg A and Schulman ES (2001). Effects of purine and pyrimidine nucleotides on intracellular Ca2+ in human eosinophils: activation of puriner-gic P2Y receptors. J Allergy Clin Immunol 107(5), 849-855.
Monopoli A, Lozza G, Forlani A, Mattavelli A and Ongini E (1998). Blockade of adenosine A2A receptors by SCH 58261 results in neuroprotective effects in cerebral ischaemia in rats. Neu-roreport 9(17), 3955-3959.
Moore D, Chambers J, Waldvogel H, Faull R and Emson P (2000). Regional and cellular distri-bution of the P2Y(1) purinergic receptor in the human brain: striking neuronal localisation. J Comp Neurol 421(3), 374-384.
Moore DJ, Chambers JK, Wahlin JP, Tan KB, Moore GB, Jenkins O, Emson PC and Murdock PR (2001). Expression pattern of human P2Y receptor subtypes: a quantitative reverse tran-scription-polymerase chain reaction study. Biochim Biophys Acta 1521(1-3), 107-119.
Moore KA, Nicoll RA and Schmitz D (2003). Adenosine gates synaptic plasticity at hippocampal mossy fiber synapses. Proc Natl Acad Sci U S A 100(24), 14397-14402.
Mori M, Heuss C, Gahwiler BH and Gerber U (2001). Fast synaptic transmission mediated by P2X receptors in CA3 pyramidal cells of rat hippocampal slice cultures. J Physiol 535(Pt 1), 115-123.
Mori M, Nishizaki T and Okada Y (1992). Protective effect of adenosine on the anoxic damage of hippocampal slice. Neuroscience 46(2), 301-307.
Moriyama T, Iida T, Kobayashi K, Higashi T, Fukuoka T, Tsumura H, Leon C, Suzuki N, Inoue K, Gachet C, Noguchi K and Tominaga M (2003). Possible involvement of P2Y2 metabo-tropic receptors in ATP-induced transient receptor potential vanilloid receptor 1-mediated thermal hypersensitivity. J Neurosci 23(14), 6058-6062.
Morley P, Hogan MJ and Hakim AM (1994). Calcium-mediated mechanisms of ischemic injury and protection. Brain Pathol 4(1), 37-47.
Moro S, Guo D, Camaioni E, Boyer JL, Harden TK and Jacobson KA (1998). Human P2Y1 re-ceptor: molecular modeling and site-directed mutagenesis as tools to identify agonist and antagonist recognition sites. J Med Chem 41(9), 1456-1466.
Muijlwijk-Koezen JE, Timmerman H, van der GH, Menge WM, Frijtag Von Drabbe KJ, de Groote M and IJzerman AP (2000). Isoquinoline and quinazoline urea analogues as antago-nists for the human adenosine A(3) receptor. J Med Chem 43(11), 2227-2238.
Mule F and Serio R (2003). NANC inhibitory neurotransmission in mouse isolated stomach: involvement of nitric oxide, ATP and vasoactive intestinal polypeptide. Br J Pharmacol 140(2), 431-437.
Muller CE (2002). P2-pyrimidinergic receptors and their ligands. Curr Pharm Des 8(26), 2353-2369.
Muller CE (2003). Medicinal chemistry of adenosine A3 receptor ligands. Curr Top Med Chem

References 165
3(4), 445-462.Muller CE, Iqbal J, Baqi Y, Zimmermann H, Rollich A and Stephan H (2006). Polyoxometalates-
a new class of potent ecto-nucleoside triphosphate diphosphohydrolase (NTPDase) inhibi-tors. Bioorg Med Chem Lett 16(23), 5943-5947.
Muller M and Somjen GG (1999). Intrinsic optical signals in rat hippocampal slices during hy-poxia-induced spreading depression-like depolarization. J Neurophysiol 82(4), 1818-1831.
Muller M and Somjen GG (2000). Na(+) and K(+) concentrations, extra- and intracellular voltages, and the effect of TTX in hypoxic rat hippocampal slices. J Neurophysiol 83(2), 735-745.
Nakata H, Yoshioka K and Kamiya T (2004). Purinergic-receptor oligomerization: implications for neural functions in the central nervous system. Neurotox Res 6(4), 291-297.
Nakata H, Yoshioka K, Kamiya T, Tsuga H and Oyanagi K (2005). Functions of heteromeric as-sociation between adenosine and P2Y receptors. J Mol Neurosci 26(2-3), 233-238.
Nakatsuka T and Gu JG (2001). ATP P2X receptor-mediated enhancement of glutamate re-lease and evoked EPSCs in dorsal horn neurons of the rat spinal cord. J Neurosci 21(17), 6522-6531.
Nakazawa K, Inoue K, Ito K, Koizumi S and Inoue K (1995). Inhibition by suramin and reac-tive blue 2 of GABA and glutamate receptor channels in rat hippocampal neurons. Naunyn Schmiedebergs Arch Pharmacol 351(2), 202-208.
Nandanan E, Camaioni E, Jang SY, Kim YC, Cristalli G, Herdewijn P, Secrist JA, III, Tiwari KN, Mohanram A, Harden TK, Boyer JL and Jacobson KA (1999). Structure-activity relation-ships of bisphosphate nucleotide derivatives as P2Y1 receptor antagonists and partial ago-nists. J Med Chem 42(9), 1625-1638.
Nandanan E, Jang SY, Moro S, Kim HO, Siddiqui MA, Russ P, Marquez VE, Busson R, Herdew-ijn P, Harden TK, Boyer JL and Jacobson KA (2000). Synthesis, biological activity, and mo-lecular modeling of ribose-modified deoxyadenosine bisphosphate analogues as P2Y(1) re-ceptor ligands. J Med Chem 43(5), 829-842.
Newman GC, Hospod FE, Trowbridge SD, Motwani S and Liu Y (1998). Restoring adenine nu-cleotides in a brain slice model of cerebral reperfusion. J Cereb Blood Flow Metab 18(6), 675-685.
Nicke A, Kerschensteiner D and Soto F (2005). Biochemical and functional evidence for hetero-meric assembly of P2X1 and P2X4 subunits. J Neurochem 92(4), 925-933.
Nieber K and Hentschel S (2006). Signalling pathways of the adenosine A3 receptors in rat corti-cal neurons. 2006. Paper presented at the 8th International Symposium on Adenosine and Adenine Nucleotides,Univesity of Ferrara,Ferrara,Italy,24-28 May 2006. Ref Type: Confer-ence Proceeding
Nieber K, Poelchen W and Illes P (1997). Role of ATP in fast excitatory synaptic potentials in lo-cus coeruleus neurones of the rat. Br J Pharmacol 122(3), 423-430.
Nisenbaum ES, Wilson CJ, Foehring RC and Surmeier DJ (1996). Isolation and characterization of a persistent potassium current in neostriatal neurons. J Neurophysiol 76(2), 1180-1194.
Nishimura S, Mohri M, Okada Y and Mori M (1990). Excitatory and inhibitory effects of ade-nosine on the neurotransmission in the hippocampal slices of guinea pig. Brain Res 525(1), 165-169.
Norenberg W and Illes P (2000a). Neuronal P2X receptors: localisation and functional proper-ties. Naunyn Schmiedebergs Arch Pharmacol 362(4-5), 324-339.
Norenberg W, von K, I, Meyer A, Illes P and Starke K (2000b). M-type K+ currents in rat cul-tured thoracolumbar sympathetic neurones and their role in uracil nucleotide-evoked no-radrenaline release. Br J Pharmacol 129(4), 709-723.
Nori S, Fumagalli L, Bo X, Bogdanov Y and BURNSTOCK G (1998). Coexpression of mRNAs for P2X1, P2X2 and P2X4 receptors in rat vascular smooth muscle: an in situ hybridization and RT-PCR study. J Vasc Res 35(3), 179-185.
North RA (2002). Molecular physiology of P2X receptors. Physiol Rev 82(4), 1013-1067.

Elisabetta Coppi166
North RA and Surprenant A (2000). Pharmacology of cloned P2X receptors. Annu Rev Pharma-col Toxicol 40(563-580.
O’Connor SE, Dainty IA and Leff P (1991). Further subclassification of ATP receptors based on agonist studies. Trends Pharmacol Sci 12(4), 137-141.
O’Kane EM and Stone TW (1998). Interaction between adenosine A1 and A2 receptor-mediated responses in the rat hippocampus in vitro. Eur J Pharmacol 362(1), 17-25.
O’Regan MH, Simpson RE, Perkins LM and Phillis JW (1992). The selective A2 adenosine re-ceptor agonist CGS 21680 enhances excitatory transmitter amino acid release from the ischemic rat cerebral cortex. Neurosci Lett 138(1), 169-172.
Obara K, Lepor H and Walden PD (1998). Localization of P2Y1 purinoceptor transcripts in the rat penis and urinary bladder. J Urol 160(2), 587-591.
Obeidat AS and Andrew RD (1998). Spreading depression determines acute cellular dam-age in the hippocampal slice during oxygen/glucose deprivation. Eur J Neurosci 10(11), 3451-3461.
Obeidat AS, Jarvis CR and Andrew RD (2000). Glutamate does not mediate acute neuronal damage after spreading depression induced by O2/glucose deprivation in the hippocampal slice. J Cereb Blood Flow Metab 20(2), 412-422.
Ochs S and Van Harreveld A (1956). Cerebral impedance changes after circulatory arrest. Am J Physiol 187(1), 180-192.
Ohno M, Costanzi S, Kim HS, Kempeneers V, Vastmans K, Herdewijn P, Maddileti S, Gao ZG, Harden TK and Jacobson KA (2004). Nucleotide analogues containing 2-oxa-bicyclo[2.2.1]heptane and l-alpha-threofuranosyl ring systems: interactions with P2Y re-ceptors. Bioorg Med Chem 12(21), 5619-5630.
Ortinau S, Laube B and Zimmermann H (2003). ATP inhibits NMDA receptors after heterol-ogous expression and in cultured hippocampal neurons and attenuates NMDA-mediated neurotoxicity. J Neurosci 23(12), 4996-5003.
Ota S, Yoshiura K, Takahashi M, Hata Y, Kohmoto O, Kawabe T, Shimada T, Hiraishi H, Mutoh H, Terano A and . (1994). P2 purinergic receptor regulation of mucus glycoprotein secretion by rabbit gastric mucous cells in a primary culture. Gastroenterology 106(6), 1485-1492.
Otsuguro K, Ito S, Ohta T and Nakazato Y (1996). Influence of purines and pyrimidines on cir-cular muscle of the rat proximal stomach. Eur J Pharmacol 317(1), 97-105.
Palmer RK, Boyer JL, Schachter JB, Nicholas RA and Harden TK (1998). Agonist action of ad-enosine triphosphates at the human P2Y1 receptor. Mol Pharmacol 54(6), 1118-1123.
Palmer TM, Benovic JL and Stiles GL (1995). Agonist-dependent phosphorylation and desensi-tization of the rat A3 adenosine receptor. Evidence for a G-protein-coupled receptor kinase-mediated mechanism. J Biol Chem 270(49), 29607-29613.
Palmer TM and Stiles GL (2000). Identification of threonine residues controlling the agonist-de-pendent phosphorylation and desensitization of the rat A(3) adenosine receptor. Mol Phar-macol 57(3), 539-545.
Pankratov Y, Castro E, Miras-Portugal MT and Krishtal O (1998). A purinergic component of the excitatory postsynaptic current mediated by P2X receptors in the CA1 neurons of the rat hippocampus. Eur J Neurosci 10(12), 3898-3902.
Pankratov Y, Lalo U, Krishtal O and Verkhratsky A (2002). Ionotropic P2X purinoreceptors me-diate synaptic transmission in rat pyramidal neurones of layer II/III of somato-sensory cor-tex. J Physiol 542(Pt 2), 529-536.
Pankratov Y, Lalo U, Verkhratsky A and North RA. (2006). Vesicular release of ATP at central synapses. Pflugers Arch. 452(5), 589-597.
Pascual O, Casper KB, Kubera C, Zhang J, Revilla-Sanchez R, Sul JY, Takano H, Moss SJ, Mc-Carthy K and Haydon PG (2005). Astrocytic purinergic signaling coordinates synaptic net-works. Science 310(5745), 113-116.
Pearson RA, Dale N, Llaudet E and Mobbs P (2005). ATP released via gap junction hemichan-nels from the pigment epithelium regulates neural retinal progenitor proliferation. Neuron 46(5), 731-744.

References 167
Pearson T, Damian K, Lynas RE and Frenguelli BG (2006). Sustained elevation of extracellular adenosine and activation of A1 receptors underlie the post-ischaemic inhibition of neuro-nal function in rat hippocampus in vitro. J Neurochem 97(5), 1357-1368.
Pedata F, Corsi C, Melani A, Bordoni F and Latini S (2001). Adenosine extracellular brain con-centrations and role of A2A receptors in ischemia. Ann N Y Acad Sci 939(74-84.
Pedata F, Latini S, Pugliese AM and Pepeu G (1993). Investigations into the adenosine outflow from hippocampal slices evoked by ischemia-like conditions. J Neurochem 61(1), 284-289.
Pedata F, Pepeu G and Spignoli G (1984). Biphasic effect of methylxanthines on acetylcholine re-lease from electrically-stimulated brain slices. Br J Pharmacol 83(1), 69-73.
Peoples RW and Li C (1998). Inhibition of NMDA-gated ion channels by the P2 purinoceptor antagonists suramin and reactive blue 2 in mouse hippocampal neurones. Br J Pharmacol 124(2), 400-408.
Phillis JW (1995). The effects of selective A1 and A2a adenosine receptor antagonists on cerebral ischemic injury in the gerbil. Brain Res 705(1-2), 79-84.
Phillis JW (2004). Adenosine and adenine nucleotides as regulators of cerebral blood flow: roles of acidosis, cell swelling, and KATP channels. Crit Rev Neurobiol 16(4), 237-270.
Phillis JW, Edstrom JP, Kostopoulos GK and Kirkpatrick JR (1979). Effects of adenosine and ad-enine nucleotides on synaptic transmission in the cerebral cortex. Can J Physiol Pharmacol 57(11), 1289-1312.
Phillis JW, O’Regan MH and Perkins LM (1993). Adenosine 5’-triphosphate release from the normoxic and hypoxic in vivo rat cerebral cortex. Neurosci Lett 151(1), 94-96.
Picher M and Boucher RC (2003). Human airway ecto-adenylate kinase. A mechanism to prop-agate ATP signaling on airway surfaces. J Biol Chem 278(13), 11256-11264.
Pineda JC, Galarraga E, Bargas J, Cristancho M and Aceves J (1992). Charybdotoxin and apamin sensitivity of the calcium-dependent repolarization and the afterhyperpolarization in neos-triatal neurons. J Neurophysiol 68(1), 287-294.
Pittenger MF, Mackay AM, Beck SC, Jaiswal RK, Douglas R, Mosca JD, Moorman MA, Simonet-ti DW, Craig S and Marshak DR (1999). Multilineage potential of adult human mesenchy-mal stem cells. Science 284(5411), 143-147.
Plenz D and Kitai ST (1998). Up and down states in striatal medium spiny neurons simultane-ously recorded with spontaneous activity in fast-spiking interneurons studied in cortex-striatum-substantia nigra organotypic cultures. J Neurosci 18(1), 266-283.
Plum F (2001). Neuroprotection in acute ischemic stroke. JAMA 285(13), 1760-1761.Poletto Chaves LA, Pontelli EP and Varanda WA (2006). P2X receptors in mouse Leydig cells.
Am J Physiol Cell Physiol 290(4), C1009-C1017.Pooler AM, Guez DH, Benedictus R and Wurtman RJ (2005). Uridine enhances neurite out-
growth in nerve growth factor-differentiated PC12 [corrected]. Neuroscience 134(1), 207-214.
Popoli P, Betto P, Reggio R and Ricciarello G (1995). Adenosine A2A receptor stimulation en-hances striatal extracellular glutamate levels in rats. Eur J Pharmacol 287(2), 215-217.
Poucher SM, Keddie JR, Singh P, Stoggall SM, Caulkett PW, Jones G and Coll MG (1995). The in vitro pharmacology of ZM 241385, a potent, non-xanthine A2a selective adenosine recep-tor antagonist. Br J Pharmacol 115(6), 1096-1102.
Powell AD, Teschemacher AG and Seward EP (2000). P2Y purinoceptors inhibit exocytosis in adrenal chromaffin cells via modulation of voltage-operated calcium channels. J Neurosci 20(2), 606-616.
Press NJ, Taylor RJ, Fullerton JD, Tranter P, McCarthy C, Keller TH, Brown L, Cheung R, Chris-tie J, Haberthuer S, Hatto JD, Keenan M, Mercer MK, Press NE, Sahri H, Tuffnell AR, Tweed M and Fozard JR (2005). A new orally bioavailable dual adenosine A2B/A3 receptor antago-nist with therapeutic potential. Bioorg Med Chem Lett 15(12), 3081-3085.
Prince DA and Stevens CF (1992). Adenosine decreases neurotransmitter release at central syn-apses. Proc Natl Acad Sci U S A 89(18), 8586-8590.
Pugliese AM, Coppi E, Spalluto G, Corradetti R and Pedata F (2006). A3 adenosine receptor an-

Elisabetta Coppi168
tagonists delay irreversible synaptic failure caused by oxygen and glucose deprivation in the rat CA1 hippocampus in vitro. Br J Pharmacol 147(5), 524-532.
Pugliese AM, Latini S, Corradetti R and Pedata F (2003). Brief, repeated, oxygen-glucose dep-rivation episodes protect neurotransmission from a longer ischemic episode in the in vitro hippocampus: role of adenosine receptors. Br J Pharmacol 140(2), 305-314.
Rae J, Cooper K, Gates P and Watsky M (1991). Low access resistance perforated patch record-ings using amphotericin B. J Neurosci Methods 37(1), 15-26.
Ralevic V and Burnstock G (1998). Receptors for purines and pyrimidines. Pharmacol Rev 50(3), 413-492.
Ramkumar V, Stiles GL, Beaven MA and Ali H (1993). The A3 adenosine receptor is the unique adenosine receptor which facilitates release of allergic mediators in mast cells. J Biol Chem 268(23), 16887-16890.
Rebola N, Pinheiro PC, Oliveira CR, Malva JO and Cunha RA (2003). Subcellular localization of adenosine A(1) receptors in nerve terminals and synapses of the rat hippocampus. Brain Res 987(1), 49-58.
Reisin IL, Prat AG, Abraham EH, Amara JF, Gregory RJ, Ausiello DA and Cantiello HF (1994). The cystic fibrosis transmembrane conductance regulator is a dual ATP and chloride chan-nel. J Biol Chem 269(32), 20584-20591.
Rettinger J, Braun K, Hochmann H, Kassack MU, Ullmann H, Nickel P, Schmalzing G and Lam-brecht G (2005). Profiling at recombinant homomeric and heteromeric rat P2X receptors identifies the suramin analogue NF449 as a highly potent P2X1 receptor antagonist. Neu-ropharmacology 48(3), 461-468.
Rettinger J and Schmalzing G (2003). Activation and desensitization of the recombinant P2X1 receptor at nanomolar ATP concentrations. J Gen Physiol 121(5), 451-461.
Reyes M, Dudek A, Jahagirdar B, Koodie L, Marker PH and Verfaillie CM (2002). Origin of en-dothelial progenitors in human postnatal bone marrow. J Clin Invest 109(3), 337-346.
Reyes M, Lund T, Lenvik T, Aguiar D, Koodie L and Verfaillie CM (2001). Purification and ex vivo expansion of postnatal human marrow mesodermal progenitor cells. Blood 98(9), 2615-2625.
Rieger JM, Brown ML, Sullivan GW, Linden J and Macdonald TL (2001). Design, synthesis, and evaluation of novel A2A adenosine receptor agonists. J Med Chem 44(4), 531-539.
Rivkees SA, Price SL and Zhou FC (1995). Immunohistochemical detection of A1 adenosine re-ceptors in rat brain with emphasis on localization in the hippocampal formation, cerebral cortex, cerebellum, and basal ganglia. Brain Res 677(2), 193-203.
Robbins J (2001). KCNQ potassium channels: physiology, pathophysiology, and pharmacology. Pharmacol Ther 90(1), 1-19.
Roberts JA, Vial C, Digby HR, Agboh KC, Wen H, Atterbury-Thomas A and Evans RJ (2006). Molecular properties of P2X receptors. Pflugers Arch 452(5), 486-500.
Rodrigues RJ, Almeida T, Richardson PJ, Oliveira CR and Cunha RA (2005). Dual presynaptic control by ATP of glutamate release via facilitatory P2X1, P2X2/3, and P2X3 and inhibitory P2Y1, P2Y2, and/or P2Y4 receptors in the rat hippocampus. J Neurosci 25(27), 6286-6295.
Romagnoli R, Baraldi PG, Pavani MG, Tabrizi MA, Moorman AR, Di Virgilio F, Cattabriga E, Pancaldi C, Gessi S and Borea PA (2004). Synthesis, radiolabeling, and preliminary bio-logical evaluation of [3H]-1-[(S)-N,O-bis-(isoquinolinesulfonyl)-N-methyl-tyrosyl]-4-(o-tolyl)-p iperazine, a potent antagonist radioligand for the P2X7 receptor. Bioorg Med Chem Lett 14(22), 5709-5712.
Rosenblueth A and Garcia RJ (1966). Some phenomena usually associated with spreading de-pression. Acta Physiol Lat Am 16(2), 141-179.
Rosin DL, Hettinger BD, Lee A and Linden J (2003). Anatomy of adenosine A2A receptors in brain: morphological substrates for integration of striatal function. Neurology 61(11 Suppl 6), S12-S18.
Rosin DL, Robeva A, Woodard RL, Guyenet PG and Linden J (1998). Immunohistochemical localization of adenosine A2A receptors in the rat central nervous system. J Comp Neurol

References 169
401(2), 163-186.Ross GW, Abbott RD, Petrovitch H, Morens DM, Grandinetti A, Tung KH, Tanner CM, Masaki
KH, Blanchette PL, Curb JD, Popper JS and White LR (2000). Association of coffee and caf-feine intake with the risk of Parkinson disease. JAMA 283(20), 2674-2679.
Ruan HZ, Birder LA, Xiang Z, Chopra B, Buffington T, Tai C, Roppolo JR, de Groat WC and Burnstock G (2006). Expression of P2X and P2Y receptors in the intramural parasympa-thetic ganglia of the cat urinary bladder. Am J Physiol Renal Physiol 290(5), F1143-F1152.
Ruan HZ and BURNSTOCK G (2003). Localisation of P2Y1 and P2Y4 receptors in dorsal root, nodose and trigeminal ganglia of the rat. Histochem Cell Biol 120(5), 415-426.
Rubini P, Pinkwart C, Franke H, Gerevich Z, Norenberg W and Illes P (2006). Regulation of in-tracellular Ca2+ by P2Y1 receptors may depend on the developmental stage of cultured rat striatal neurons. J Cell Physiol 209(1), 81-93.
Ryu JK, Choi HB, Hatori K, Heisel RL, Pelech SL, McLarnon JG and Kim SU (2003). Adenosine triphosphate induces proliferation of human neural stem cells: Role of calcium and p70 ri-bosomal protein S6 kinase. J Neurosci Res 72(3), 352-362.
Ryu JK, Kim J, Choi SH, Oh YJ, Lee YB, Kim SU and Jin BK (2002). ATP-induced in vivo neuro-toxicity in the rat striatum via P2 receptors. Neuroreport 13(13), 1611-1615.
Sabirov RZ, Dutta AK and Okada Y (2001). Volume-dependent ATP-conductive large-conduct-ance anion channel as a pathway for swelling-induced ATP release. J Gen Physiol 118(3), 251-266.
Safiulina VF, Kasyanov AM, Sokolova E, Cherubini E and Giniatullin R (2005). ATP contributes to the generation of network-driven giant depolarizing potentials in the neonatal rat hip-pocampus. J Physiol 565(Pt 3), 981-992.
Sak K, Boeynaems JM and Everaus H (2003). Involvement of P2Y receptors in the differentiation of haematopoietic cells. J Leukoc Biol 73(4), 442-447.
Salvatore CA, Jacobson MA, Taylor HE, Linden J and Johnson RG (1993). Molecular cloning and characterization of the human A3 adenosine receptor. Proc Natl Acad Sci U S A 90(21), 10365-10369.
Salvatore CA, Tilley SL, Latour AM, Fletcher DS, Koller BH and Jacobson MA (2000). Disrup-tion of the A(3) adenosine receptor gene in mice and its effect on stimulated inflammatory cells. J Biol Chem 275(6), 4429-4434.
Sasaki Y, Hoshi M, Akazawa C, Nakamura Y, Tsuzuki H, Inoue K and Kohsaka S (2003). Selec-tive expression of Gi/o-coupled ATP receptor P2Y12 in microglia in rat brain. Glia 44(3), 242-250.
Saurin W, Hofnung M and Dassa E (1999). Getting in or out: early segregation between import-ers and exporters in the evolution of ATP-binding cassette (ABC) transporters. J Mol Evol 48(1), 22-41.
Scamps F and Vassort G (1994). Pharmacological profile of the ATP-mediated increase in L-type calcium current amplitude and activation of a non-specific cationic current in rat ventricu-lar cells. Br J Pharmacol 113(3), 982-986.
Scemes E, Duval N and Meda P (2003). Reduced expression of P2Y1 receptors in connexin43-null mice alters calcium signaling and migration of neural progenitor cells. J Neurosci 23(36), 11444-11452.
Scheibler P, Pesic M, Franke H, Reinhardt R, Wirkner K, Illes P and Norenberg W (2004). P2X2 and P2Y1 immunofluorescence in rat neostriatal medium-spiny projection neurones and cholinergic interneurones is not linked to respective purinergic receptor function. Br J Pharmacol 143(1), 119-131.
Schindler CW, Karcz-Kubicha M, Thorndike EB, Muller CE, Tella SR, Ferre S and Goldberg SR (2005). Role of central and peripheral adenosine receptors in the cardiovascular responses to intraperitoneal injections of adenosine A1 and A2A subtype receptor agonists. Br J Phar-macol 144(5), 642-650.
Schindler M, Harris CA, Hayes B, Papotti M and Humphrey PP (2001). Immunohistochemi-cal localization of adenosine A1 receptors in human brain regions. Neurosci Lett 297(3),

Elisabetta Coppi170
211-215.Schipke CG, Boucsein C, Ohlemeyer C, Kirchhoff F and Kettenmann H (2002). Astrocyte Ca2+
waves trigger responses in microglial cells in brain slices. FASEB J 16(2), 255-257.Schubert P, Komp W and Kreutzberg GW (1979). Correlation of 5’-nucleotidase activity and se-
lective transneuronal transfer of adenosine in the hippocampus. Brain Res 168(2), 419-424.Schwarz EJ, Alexander GM, Prockop DJ and Azizi SA (1999). Multipotential marrow strom-
al cells transduced to produce L-DOPA: engraftment in a rat model of Parkinson disease. Hum Gene Ther 10(15), 2539-2549.
Sebastiao AM, de Mendonca A, Moreira T and Ribeiro JA (2001). Activation of synaptic NMDA receptors by action potential-dependent release of transmitter during hypoxia impairs re-covery of synaptic transmission on reoxygenation. J Neurosci 21(21), 8564-8571.
Sebastiao AM and Ribeiro JA (1996). Adenosine A2 receptor-mediated excitatory actions on the nervous system. Prog Neurobiol 48(3), 167-189.
Sesti C, Koyama M, Broekman MJ, Marcus AJ and Levi R (2003). Ectonucleotidase in sympathet-ic nerve endings modulates ATP and norepinephrine exocytosis in myocardial ischemia. J Pharmacol Exp Ther 306(1), 238-244.
Shake JG, Gruber PJ, Baumgartner WA, Senechal G, Meyers J, Redmond JM, Pittenger MF and Martin BJ (2002). Mesenchymal stem cell implantation in a swine myocardial infarct mod-el: engraftment and functional effects. Ann Thorac Surg 73(6), 1919-1925.
Shapiro MS, Roche JP, Kaftan EJ, Cruzblanca H, Mackie K and Hille B (2000). Reconstitution of muscarinic modulation of the KCNQ2/KCNQ3 K(+) channels that underlie the neuronal M current. J Neurosci 20(5), 1710-1721.
Sharpe NA and Tepper JM (1998). Postnatal development of excitatory synaptic input to the rat neostriatum: an electron microscopic study. Neuroscience 84(4), 1163-1175.
Shibuya I, Tanaka K, Hattori Y, Uezono Y, Harayama N, Noguchi J, Ueta Y, Izumi F and Yamas-hita H (1999). Evidence that multiple P2X purinoceptors are functionally expressed in rat supraoptic neurones. J Physiol 514 ( Pt 2)(351-367.
Sick TJ, Solow EL and Roberts EL, Jr. (1987). Extracellular potassium ion activity and electro-physiology in the hippocampal slice: paradoxical recovery of synaptic transmission during anoxia. Brain Res 418(2), 227-234.
Siesjo BK (1989). Calcium and cell death. Magnesium 8(5-6), 223-237.Silinsky EM (1975). On the association between transmitter secretion and the release of adenine
nucleotides from mammalian motor nerve terminals. J Physiol 247(1), 145-162.Silinsky EM and Redman RS (1996). Synchronous release of ATP and neurotransmitter within
milliseconds of a motor nerve impulse in the frog. J Physiol 492 ( Pt 3)(815-822.Sim JA, Young MT, Sung HY, North RA and Surprenant A. (2004). Reanalysis of P2X7 receptor
expression in rodent brain. J Neurosci. 24(28), 6307-6314.Simon J, Filippov AK, Goransson S, Wong YH, Frelin C, Michel AD, Brown DA and Barnard EA
(2002). Characterization and channel coupling of the P2Y(12) nucleotide receptor of brain capillary endothelial cells. J Biol Chem 277(35), 31390-31400.
Simpson RE, O’Regan MH, Perkins LM and Phillis JW (1992). Excitatory transmitter amino acid release from the ischemic rat cerebral cortex: effects of adenosine receptor agonists and antagonists. J Neurochem 58(5), 1683-1690.
Skladchikova G, Ronn LC, Berezin V and Bock E (1999). Extracellular adenosine triphosphate affects neural cell adhesion molecule (NCAM)-mediated cell adhesion and neurite out-growth. J Neurosci Res 57(2), 207-218.
Smart ML, Panchal RG, Bowser DN, Williams DA and Petrou S (2002). Pore formation is not associated with macroscopic redistribution of P2X7 receptors. Am J Physiol Cell Physiol 283(1), C77-C84.
Snow RW, Taylor CP and Dudek FE (1983). Electrophysiological and optical changes in slices of rat hippocampus during spreading depression. J Neurophysiol 50(3), 561-572.
Solle M, Labasi J, Perregaux DG, Stam E, Petrushova N, Koller BH, Griffiths RJ and Gabel CA (2001). Altered cytokine production in mice lacking P2X(7) receptors. J Biol Chem 276(1),

References 171
125-132.Somjen GG (2001). Mechanisms of spreading depression and hypoxic spreading depression-like
depolarization. Physiol Rev 81(3), 1065-1096.Soto F, Garcia-Guzman M, Karschin C and Stuhmer W (1996). Cloning and tissue distribution
of a novel P2X receptor from rat brain. Biochem Biophys Res Commun 223(2), 456-460.Soulet C, Sauzeau V, Plantavid M, Herbert JM, Pacaud P, Payrastre B and Savi P (2004). Gi-de-
pendent and -independent mechanisms downstream of the P2Y12 ADP-receptor. J Thromb Haemost 2(1), 135-146.
Sperlagh B, Kofalvi A, Deuchars J, Atkinson L, Milligan CJ, Buckley NJ and Vizi ES (2002). In-volvement of P2X7 receptors in the regulation of neurotransmitter release in the rat hippoc-ampus. J Neurochem 81(6), 1196-1211.
Spignoli G, Pedata F and Pepeu G (1984). A1 and A2 adenosine receptors modulate acetylcho-line release from brain slices. Eur J Pharmacol 97(3-4), 341-342.
Stern EA, Kincaid AE and Wilson CJ (1997). Spontaneous subthreshold membrane potential fluctuations and action potential variability of rat corticostriatal and striatal neurons in vivo. J Neurophysiol 77(4), 1697-1715.
Stevens B and Fields RD (2000). Response of Schwann cells to action potentials in development. Science 287(5461), 2267-2271.
Stojilkovic SS, Tomic M, He ML, Yan Z, Koshimizu TA and Zemkova H (2005). Molecular dis-section of purinergic P2X receptor channels. Ann N Y Acad Sci 1048(116-130.
Stone TW, Nikbakht MR and O’Kane EM (2004). From messengers to molecules: memories are made of these. Eurekah.com and Kluwer Academic. Plenum Publishers. Ref Type: Book Chapter.
Stout CE, Costantin JL, Naus CC and Charles AC (2002). Intercellular calcium signaling in astro-cytes via ATP release through connexin hemichannels. J Biol Chem 277(12), 10482-10488.
Strange K, Emma F and Jackson PS (1996). Cellular and molecular physiology of volume-sensi-tive anion channels. Am J Physiol 270(3 Pt 1), C711-C730.
Su C, Bevan JA and Burnstock G (1971). [3H]adenosine triphosphate: release during stimula-tion of enteric nerves. Science 173(994), 336-338.
Surprenant A, Rassendren F, Kawashima E, North RA and Buell G (1996). The cytolytic P2Z receptor for extracellular ATP identified as a P2X receptor (P2X7). Science 272(5262), 735-738.
Swanson TH, Drazba JA and Rivkees SA (1995). Adenosine A1 receptors are located predomi-nantly on axons in the rat hippocampal formation. J Comp Neurol 363(4), 517-531.
Takahashi T (1978). Intracellular recording from visually identified motoneurons in rat spinal cord slices. Proc.R.Soc.Lond B Biol.Sci. 202(1148), 417-421.
Takigawa T and Alzheimer C (1999). G protein-activated inwardly rectifying K+ (GIRK) cur-rents in dendrites of rat neocortical pyramidal cells. J Physiol 517 ( Pt 2)(385-390.
Takigawa T and Alzheimer C (2002). Phasic and tonic attenuation of EPSPs by inward rectifier K+ channels in rat hippocampal pyramidal cells. J Physiol 539(Pt 1), 67-75.
Tanaka E, Yamamoto S, Kudo Y, Mihara S and Higashi H (1997). Mechanisms underlying the rapid depolarization produced by deprivation of oxygen and glucose in rat hippocampal CA1 neurons in vitro. J Neurophysiol 78(2), 891-902.
Tepper JM, Sharpe NA, Koos TZ and Trent F (1998). Postnatal development of the rat neostria-tum: electrophysiological, light- and electron-microscopic studies. Dev Neurosci 20(2-3), 125-145.
Tepper JM and Trent F (1993). In vivo studies of the postnatal development of rat neostriatal neurons. Prog Brain Res 99, 35-50.
Tokimasa T and Akasu T (1990). ATP regulates muscarine-sensitive potassium current in dis-sociated bull-frog primary afferent neurones. J Physiol 426, 241-264.
Tolhurst G, Vial C, Leon C, Gachet C, Evans RJ and Mahaut-Smith MP (2005). Interplay be-tween P2Y(1), P2Y(12), and P2X(1) receptors in the activation of megakaryocyte cation
Elisabetta Coppi172
influx currents by ADP: evidence that the primary megakaryocyte represents a fully func-tional model of platelet P2 receptor signaling. Blood 106(5), 1644-1651.
Tominaga K, Shibata S and Watanabe S (1992). A neuroprotective effect of adenosine A1-recep-tor agonists on ischemia-induced decrease in 2-deoxyglucose uptake in rat hippocampal slices. Neurosci Lett 145(1), 67-70.
Tominaga M, Wada M and Masu M (2001). Potentiation of capsaicin receptor activity by me-tabotropic ATP receptors as a possible mechanism for ATP-evoked pain and hyperalgesia. Proc Natl Acad Sci U S A 98(12), 6951-6956.
Torres GE, Egan TM and Voigt MM (1998a). N-Linked glycosylation is essential for the func-tional expression of the recombinant P2X2 receptor. Biochemistry 37(42), 14845-14851.
Torres GE, Egan TM and Voigt MM (1998b). Topological analysis of the ATP-gated ionotropic [correction of ionotrophic] P2X2 receptor subunit. FEBS Lett 425(1), 19-23.
Torres GE, Egan TM and Voigt MM (1999). Hetero-oligomeric assembly of P2X receptor subu-nits. Specificities exist with regard to possible partners. J Biol Chem 274(10), 6653-6659.
Torres M, Pintor J and Miras-Portugal MT (1990). Presence of ectonucleotidases in cultured chromaffin cells: hydrolysis of extracellular adenine nucleotides. Arch Biochem Biophys 279(1), 37-44.
Touzani O, Roussel S and MacKenzie ET (2001). The ischaemic penumbra. Curr Opin Neurol 14(1), 83-88.
Townsend-Nicholson A, King BF, Wildman SS and Burnstock G (1999). Molecular cloning, functional characterization and possible cooperativity between the murine P2X4 and P2X4a receptors. Brain Res Mol Brain Res 64(2), 246-254.
Trincavelli ML, Marroni M, Tuscano D, Ceruti S, Mazzola A, Mitro N, Abbracchio MP and Mar-tini C (2004). Regulation of A2B adenosine receptor functioning by tumour necrosis factor a in human astroglial cells. J Neurochem 91(5), 1180-1190.
Trincavelli ML, Tuscano D, Cecchetti P, Falleni A, Benzi L, Klotz KN, Gremigni V, Cattabeni F, Lucacchini A and Martini C (2000). Agonist-induced internalization and recycling of the human A(3) adenosine receptors: role in receptor desensitization and resensitization. J Neu-rochem 75(4), 1493-1501.
Trincavelli ML, Tuscano D, Marroni M, Falleni A, Gremigni V, Ceruti S, Abbracchio MP, Jacob-son KA, Cattabeni F and Martini C (2002a). A3 adenosine receptors in human astrocytoma cells: agonist-mediated desensitization, internalization, and down-regulation. Mol Pharma-col 62(6), 1373-1384.
Trincavelli ML, Tuscano D, Marroni M, Klotz KN, Lucacchini A and Martini C (2002b). Involve-ment of mitogen protein kinase cascade in agonist-mediated human A(3) adenosine recep-tor regulation. Biochim Biophys Acta 1591(1-3), 55-62.
Troadec JD, Thirion S, Petturiti D, Bohn MT and Poujeol P (1999). ATP acting on P2Y receptors triggers calcium mobilization in primary cultures of rat neurohypophysial astrocytes (pitui-cytes). Pflugers Arch 437(5), 745-753.
Urbani S, Caporale R, Lombardini L, Bosi A and Saccardi R (2006). Use of CFDA-SE for evalu-ating the in vitro proliferation pattern of human mesenchymal stem cells. Cytotherapy 8(3), 243-253.
Valera S, Hussy N, Evans RJ, Adami N, North RA, Surprenant A and Buell G (1994). A new class of ligand-gated ion channel defined by P2x receptor for extracellular ATP. Nature 371(6497), 516-519.
van Calker D, Muller M and Hamprecht B (1979). Adenosine regulates via two different types of receptors, the accumulation of cyclic AMP in cultured brain cells. J Neurochem 33(5), 999-1005.
van der Klein PA, Kourounakis AP and IJzerman AP (1999). Allosteric modulation of the ad-enosine A(1) receptor. Synthesis and biological evaluation of novel 2-amino-3-benzoylthi-ophenes as allosteric enhancers of agonist binding. J Med Chem 42(18), 3629-3635.
van Giezen JJ and Humphries RG (2005). Preclinical and clinical studies with selective reversible direct P2Y12 antagonists. Semin Thromb Hemost 31(2), 195-204.

References 173
Van Harreveld A (1959). Compounds in brain extracts causing spreading depression of cerebral cortical activity and contraction of crustacean muscle. J Neurochem 3(4), 300-315.
Van Harreveld A and SCHADE JP (1959). Chloride movements in cerebral cortex after circula-tory arrest and during spreading depression. J Cell Comp Physiol 54, 65-84.
Van Harreveld A and Stamm JS (1953). Spreading cortical convulsions and depressions. J Neu-rophysiol 16(4), 352-366.
Varani K, Gessi S, Merighi S, Vincenzi F, Cattabriga E, Benini A, Klotz KN, Baraldi PG, Tabrizi MA, Lennan SM, Leung E and Borea PA (2005). Pharmacological characterization of nov-el adenosine ligands in recombinant and native human A2B receptors. Biochem Pharmacol 70(11), 1601-1612.
Varani K, Portaluppi F, Gessi S, Merighi S, Ongini E, Belardinelli L and Borea PA (2000). Dose and time effects of caffeine intake on human platelet adenosine A(2A) receptors : functional and biochemical aspects. Circulation 102(3), 285-289.
Virginio C, MacKenzie A, Rassendren FA, North RA and Surprenant A (1999). Pore dilation of neuronal P2X receptor channels. Nat Neurosci 2(4), 315-321.
Virginio C, North RA and Surprenant A (1998). Calcium permeability and block at homomer-ic and heteromeric P2X2 and P2X3 receptors, and P2X receptors in rat nodose neurones. J Physiol 510 ( Pt 1)(27-35.
Volonte C and Merlo D (1996). Selected P2 purinoceptor modulators prevent glutamate-evoked cytotoxicity in cultured cerebellar granule neurons. J Neurosci Res 45(2), 183-193.
Volpini R, Costanzi S, Lambertucci C, Taffi S, Vittori S, Klotz KN and Cristalli G (2002). N(6)-alkyl-2-alkynyl derivatives of adenosine as potent and selective agonists at the human ad-enosine A(3) receptor and a starting point for searching A(2B) ligands. J Med Chem 45(15), 3271-3279.
Volpini R, Dal Ben D, Lambertucci C, Vittori S, Klotz KN and Cristalli G (2006). Trisubstitut-ed adenosines as potent and selective agonists for the A3 adenosine receptor subtype. 10-9-2006. XXII Congresso Nazionale della Società Chimica Italiana, Florence, Italy, 10-15 sep-tember 2006. 10-9-2007. Ref Type: Conference Proceeding.
Volpini R, Lambertucci C, Taffi S, Vttori S, Klotz KN and Cristalli G (2005). A3 adenosine re-ceptors: synthesis and biological evaluation of new potent and selective ligands. 7, 297-300. Collection Symposium Series. Ref Type: Conference Proceeding.
von Kugelgen I (2006). Pharmacological profiles of cloned mammalian P2Y-receptor subtypes. Pharmacol Ther 110(3), 415-432.
von Kugelgen I, Koch H and Starke K (1997). P2-receptor-mediated inhibition of serotonin re-lease in the rat brain cortex. Neuropharmacology 36(9), 1221-1227.
von Kugelgen I, Spath L and Starke K (1994). Evidence for P2-purinoceptor-mediated inhibition of noradrenaline release in rat brain cortex. Br J Pharmacol 113(3), 815-822.
von Lubitz DK (1999). Adenosine and cerebral ischemia: therapeutic future or death of a brave concept? Eur J Pharmacol 371(1), 85-102.
von Lubitz DK, Lin RC and Jacobson KA (1995). Cerebral ischemia in gerbils: effects of acute and chronic treatment with adenosine A2A receptor agonist and antagonist. Eur J Pharma-col 287(3), 295-302.
von Lubitz DK, Lin RC, Popik P, Carter MF and Jacobson KA (1994). Adenosine A3 receptor stimulation and cerebral ischemia. Eur J Pharmacol 263(1-2), 59-67.
von Lubitz DK, Simpson KL and Lin RC (2001). Right thing at a wrong time? Adenosine A3 re-ceptors and cerebroprotection in stroke. Ann N Y Acad Sci 939, 85-96.
Vranic II, Matic M, Perunicic J, Simic T, Soskic L and Milic N (2006). Adenosine cardiopro-tection study in clinical setting of paroxysmal supraventricular tachycardia. Prostaglandins Leukot Essent Fatty Acids 74(6), 365-371.
Vulchanova L, Arvidsson U, Riedl M, Wang J, Buell G, Surprenant A, North RA and Elde R (1996). Differential distribution of two ATP-gated channels (P2X receptors) determined by

Elisabetta Coppi174
immunocytochemistry. Proc Natl Acad Sci U S A 93(15), 8063-8067.Vulchanova L, Riedl MS, Shuster SJ, Buell G, Surprenant A, North RA and Elde R (1997). Immu-
nohistochemical study of the P2X2 and P2X3 receptor subunits in rat and monkey sensory neurons and their central terminals. Neuropharmacology 36(9), 1229-1242.
Vyskocil F, Kritz N and Bures J (1972). Potassium-selective microelectrodes used for measuring the extracellular brain potassium during spreading depression and anoxic depolarization in rats. Brain Res 39(1), 255-259.
Waldo GL, Corbitt J, Boyer JL, Ravi G, Kim HS, Ji XD, Lacy J, Jacobson KA and Harden TK (2002). Quantitation of the P2Y(1) receptor with a high affinity radiolabeled antagonist. Mol Pharmacol 62(5), 1249-1257.
Wang CZ, Namba N, Gonoi T, Inagaki N and Seino S (1996). Cloning and pharmacological char-acterization of a fourth P2X receptor subtype widely expressed in brain and peripheral tis-sues including various endocrine tissues. Biochem Biophys Res Commun 220(1), 196-202.
Wang J, Chambers G, Cottrell JE and Kass IS (2000). Differential fall in ATP accounts for ef-fects of temperature on hypoxic damage in rat hippocampal slices. J Neurophysiol 83(6), 3462-3472.
Wang L, Jacobsen SE, Bengtsson A and Erlinge D (2004). P2 receptor mRNA expression profiles in human lymphocytes, monocytes and CD34+ stem and progenitor cells. BMC Immunol 5, 16-22.
Wang L, Karlsson L, Moses S, Hultgardh-Nilsson A, Andersson M, Borna C, Gudbjartsson T, Jern S and Erlinge D (2002). P2 receptor expression profiles in human vascular smooth muscle and endothelial cells. J Cardiovasc Pharmacol 40(6), 841-853.
Webb TE, Boluyt MO and Barnard EA (1996). Molecular biology of P2Y purinoceptors: expres-sion in rat heart. J Auton Pharmacol 16(6), 303-307.
Weiss SM, Benwell K, Cliffe IA, Gillespie RJ, Knight AR, Lerpiniere J, Misra A, Pratt RM, Revell D, Upton R and Dourish CT (2003). Discovery of nonxanthine adenosine A2A receptor an-tagonists for the treatment of Parkinson’s disease. Neurology 61(11 Suppl 6), S101-S106.
Weissman TA, Riquelme PA, Ivic L, Flint AC and Kriegstein AR (2004). Calcium waves propa-gate through radial glial cells and modulate proliferation in the developing neocortex. Neu-ron 43(5), 647-661.
Werner P, Seward EP, Buell GN and North RA (1996). Domains of P2X receptors involved in de-sensitization. Proc Natl Acad Sci U S A 93(26), 15485-15490.
Westfall DP, Stitzel RE and Rowe JN (1978). The postjunctional effects and neural release of pu-rine compounds in the guinea-pig vas deferens. Eur J Pharmacol 50(1), 27-38.
White PJ, Rose’Meyer RB and Hope W (1996). Functional characterization of adenosine recep-tors in the nucleus tractus solitarius mediating hypotensive responses in the rat. Br J Phar-macol 117(2), 305-308.
White PJ, Webb TE and Boarder MR (2003). Characterization of a Ca2+ response to both UTP and ATP at human P2Y11 receptors: evidence for agonist-specific signaling. Mol Pharma-col 63(6), 1356-1363.
White TD (1978). Release of ATP from a synaptosomal preparation by elevated extracellular K+ and by veratridine. J Neurochem 30(2), 329-336.
White TD and Leslie RA (1982). Depolarization-induced release of adenosine 5’-triphosphate from isolated varicosities derived from the myenteric plexus of the guinea pig small intes-tine. J Neurosci 2(2), 206-215.
Wieraszko A (1996). Extracellular ATP as a neurotransmitter: its role in synaptic plasticity in the hippocampus. Acta Neurobiol Exp (Wars ) 56(2), 637-648.
Wieraszko A and Seyfried TN (1989). ATP-induced synaptic potentiation in hippocampal slices. Brain Res 491(2), 356-359.
Wilson CJ (1993). The generation of natural firing patterns in neostriatal neurons. Prog Brain Res 99, 277-297.
Wilson CJ and Groves PM (1981). Spontaneous firing patterns of identified spiny neurons in the rat neostriatum. Brain Res 220(1), 67-80.

References 175
Wirkner K, Gunther A, Weber M, Guzman SJ, Krause T, Fuchs J, Koles L, Norenberg W and Il-les P (2006). Modulation of NMDA Receptor Current in Layer V Pyramidal Neurons of the Rat Prefrontal Cortex by P2Y Receptor Activation. Cereb Cortex
Wirkner K, Koles L, Thummler S, Luthardt J, Poelchen W, Franke H, Furst S and Illes P (2002). Interaction between P2Y and NMDA receptors in layer V pyramidal neurons of the rat pre-frontal cortex. Neuropharmacology 42(4), 476-488.
Wu LG and Saggau P (1994). Adenosine inhibits evoked synaptic transmission primarily by re-ducing presynaptic calcium influx in area CA1 of hippocampus. Neuron 12(5), 1139-1148.
Xiang Z, Bo X and Burnstock G (1998). Localization of ATP-gated P2X receptor immunoreac-tivity in rat sensory and sympathetic ganglia. Neurosci Lett 256(2), 105-108.
Xiang Z, Bo X and Burnstock G (1999). P2X receptor immunoreactivity in the rat cochlea, ves-tibular ganglion and cochlear nucleus. Hear Res 128(1-2), 190-196.
Xiang Z and Burnstock G (2005). Distribution of P2Y2 receptors in the guinea pig enteric nerv-ous system and its coexistence with P2X2 and P2X3 receptors, neuropeptide Y, nitric oxide synthase and calretinin. Histochem Cell Biol 124(5), 379-390.
Xiang Z and Burnstock G (2006a). Distribution of P2Y(6) and P2Y(12) receptor: their colocali-zation with calbindin, calretinin and nitric oxide synthase in the guinea pig enteric nervous system. Histochem Cell Biol 125(4), 327-336.
Xiang Z, Lv J, Jiang P, Chen C, Jiang B and BURNSTOCK G (2006b). Expression of P2X recep-tors on immune cells in the rat liver during postnatal development. Histochem Cell Biol 126(4), 453-463.
Xu K, Bastia E and Schwarzschild M (2005). Therapeutic potential of adenosine A(2A) receptor antagonists in Parkinson’s disease. Pharmacol Ther 105(3), 267-310.
Yamamoto C (1975). Recording of electrical activity from microscopically identified neurons of the mammalian brain. Experientia 31(3), 309-311.
Yamamoto S, Tanaka E, Shoji Y, Kudo Y, Inokuchi H and Higashi H (1997). Factors that reverse the persistent depolarization produced by deprivation of oxygen and glucose in rat hippoc-ampal CA1 neurons in vitro. J Neurophysiol 78(2), 903-911.
Yamazaki Y, Fujii S, Nakamura T, Miyakawa H, Kudo Y, Kato H and Ito K (2002). Changes in [Ca2+](i) during adenosine triphosphate-induced synaptic plasticity in hippocampal CA1 neurons of the guinea pig. Neurosci Lett 324(1), 65-68.
Yan L, Bertarelli DC, Hayallah AM, Meyer H, Klotz KN and Muller CE (2006). A new synthesis of sulfonamides by aminolysis of p-nitrophenylsulfonates yielding potent and selective ad-enosine A2B receptor antagonists. J Med Chem 49(14), 4384-4391.
Yawo H and Chuhma N (1993). Preferential inhibition of omega-conotoxin-sensitive presynap-tic Ca2+ channels by adenosine autoreceptors. Nature 365(6443), 256-258.
Yoshioka K, Hosoda R, Kuroda Y and Nakata H (2002a). Hetero-oligomerization of adenosine A1 receptors with P2Y1 receptors in rat brains. FEBS Lett 531(2), 299-303.
Yoshioka K, Saitoh O and Nakata H (2001). Heteromeric association creates a P2Y-like adenos-ine receptor. Proc Natl Acad Sci U S A 98(13), 7617-7622.
Yoshioka K, Saitoh O and Nakata H (2002b). Agonist-promoted heteromeric oligomerization between adenosine A(1) and P2Y(1) receptors in living cells. FEBS Lett 523(1-3), 147-151.
Yu L, Huang Z, Mariani J, Wang Y, Moskowitz M and Chen JF (2004). Selective inactivation or reconstitution of adenosine A2A receptors in bone marrow cells reveals their significant contribution to the development of ischemic brain injury. Nat Med 10(10), 1081-1087.
Zablocki JA, Wu L, Shryock J and Belardinelli L (2004). Partial A(1) adenosine receptor agonists from a molecular perspective and their potential use as chronic ventricular rate control agents during atrial fibrillation (AF). Curr Top Med Chem 4(8), 839-854.
Zampighi GA, Loo DD, Kreman M, Eskandari S and Wright EM (1999). Functional and mor-phological correlates of connexin50 expressed in Xenopus laevis oocytes. J Gen Physiol 113(4), 507-524.
Zemkova H, Balik A, Jiang Y, Kretschmannova K and Stojilkovic SS (2006). Roles of purinergic P2X receptors as pacemaking channels and modulators of calcium-mobilizing pathway in

Elisabetta Coppi176
pituitary gonadotrophs. Mol Endocrinol 20(6), 1423-1436.Zetterstrom T and Fillenz M (1990). Adenosine agonists can both inhibit and enhance in vivo
striatal dopamine release. Eur J Pharmacol 180(1), 137-143.Zhang L and Sanderson MJ (2003). Oscillations in ciliary beat frequency and intracellular cal-
cium concentration in rabbit tracheal epithelial cells induced by ATP. J Physiol 546(Pt 3), 733-749.
Zhao HB, Yu N and Fleming CR (2005). Gap junctional hemichannel-mediated ATP release and hearing controls in the inner ear. Proc Natl Acad Sci U S A 102(51), 18724-18729.
Zhao LR, Duan WM, Reyes M, Keene CD, Verfaillie CM and Low WC (2002). Human bone marrow stem cells exhibit neural phenotypes and ameliorate neurological deficits after grafting into the ischemic brain of rats. Exp Neurol 174(1), 11-20.
Zhao Z, Francis CE and Ravid K (1997). An A3-subtype adenosine receptor is highly expressed in rat vascular smooth muscle cells: its role in attenuating adenosine-induced increase in cAMP. Microvasc Res 54(3), 243-252.
Zhou AM, Li WB, Li QJ, Liu HQ, Feng RF and Zhao HG (2004). A short cerebral ischemic pre-conditioning up-regulates adenosine receptors in the hippocampal CA1 region of rats. Neu-rosci Res 48(4), 397-404.
Zhou QY, Li C, Olah ME, Johnson RA, Stiles GL and Civelli O (1992). Molecular cloning and characterization of an adenosine receptor: the A3 adenosine receptor. Proc Natl Acad Sci U S A 89(16), 7432-7436.
Zimmermann H (1986). Hydrolysis of ATP and formation of adenosine at the surface of cholin-ergic nerve endings. Cellular biology of ectoenzymes. Ref Type: Book Chapter.
Zimmermann H (1996). Biochemistry, localization and functional roles of ecto-nucleotidases in the nervous system. Prog Neurobiol 49(6), 589-618.
Zimmermann H (2000). Extracellular metabolism of ATP and other nucleotides. Naunyn Schmiedebergs Arch Pharmacol 362(4-5), 299-309.
Zimmermann H, Braun N, Kegel B and Heine P (1998). New insights into molecular structure and function of ectonucleotidases in the nervous system. Neurochem Int 32(5-6), 421-425.
Zimmermann H and Denston CR (1976). Adenosine triphosphate in cholinergic vesicles isolat-ed from the electric organ of Electrophorus electricus. Brain Res 111(2), 365-376.
Zimmermann H. (2006). Nucleotide signaling in nervous system development. Pflugers Arch. 452(5), 573-588.
Zizzo MG, Mule F and Serio R (2006). Mechanisms underlying hyperpolarization evoked by P2Y receptor activation in mouse distal colon. Eur J Pharmacol 544(1-3), 174-180.
Zona C, Marchetti C, Volonte C, Mercuri NB and Bernardi G (2000). Effect of P2 purinocep-tor antagonists on kainate-induced currents in rat cultured neurons. Brain Res 882(1-2), 26-35.
Zuker CS (1996). The biology of vision of Drosophila. Proc Natl Acad Sci U S A 93(2), 571-576.

premio firenze university presstesi di dottorato
Coppi E., Purines as Transmitter Molecules. Electrophysiological Studies on Purinergic Signalling in Different Cell Systems, 2007
Natali I., The Ur-Portrait. Stephen Hero ed il processo di creazione artistica in A Portrait of the Artist as a Young Man, 2007
Petretto L., Imprenditore ed Università nello start-up di impresa. Ruoli e relazioni critiche, 2007Mannini M., Molecular Magnetic Materials on Solid Surfaces, 2007Bracardi M., La Materia e lo Spirito. Mario Ridolfi nel paesaggio umbro, 2007

Finito di stampare pressola tipografia editrice Polistampa