prenatal screening for congenital anomalies in south ... screening for congenital anomalies in south...
TRANSCRIPT
Prenatal Screening for
Congenital Anomalies
in South Australia 2009
South Australian Birth Defects Register
Women’s and Children’s Hospital
Adelaide, South Australia
May 2013
The South Australian Birth Defects Register
Location Specialist Advisors to the Register
Health Informatics, Planning, Performance Prof Eric Haan, Clinical Genetics
Outcomes (HIPPO) Unit A/Prof Bruce Foster, Orthopaedic Surgery
Women’s and Children’s Hospital Campus Mr Peter Cundy, Orthopaedic Surgery
Women’s and Children’s Health Network Prof David David, Craniofacial Surgery
Ground Floor, Angas Building Dr Malcolm Richardson, Cardiology
72 King William Road Dr Hilary Boucaut, Urology
North Adelaide, South Australia 5006 Dr Steve Santoreneos, Neurosurgery
Telephone: (08) 8161 7368 A/Prof Tom Revesz, Haematology/Oncology
Email: [email protected]
SABDR Website:
http://www.wch.sa.gov.au/services/az/other/phru/birthdefect.html
Staff
A/Prof Peter Baghurst, Head, SA Birth Defects Register (2008-2012)
Dr Wendy Scheil, Public Health Physician, Pregnancy Outcome Unit, SA Health
Dr Catherine Gibson, Manager
Ms Heather Scott, Register Officer/A/Manager (from July 2010)
Mrs Rosie Rice, Register Officer
Advisory Committee
Dr Judy Jaensch, Paediatrician
Dr Geoffrey Martin, General Practitioner
Dr Karen Shand, Obstetrician
Dr Brian Peat, Obstetrician
Dr Wendy Scheil, Representing SA Health Epidemiology Branch
Dr Catherine Gibson, Representing the SA Birth Defects Register
Ms Heather Scott, Representing the SA Birth Defects Register
Prof Eric Haan, Clinical Geneticist
Suggested Citation
Gibson CS, Scott H, Baghurst P, Scheil W. Prenatal Screening for Congenital Anomalies in South Australia,
2009. Adelaide. SA Birth Defects Register, Women’s and Children’s Health Network, 2013.
ISSN 1033-6907
Contents
1
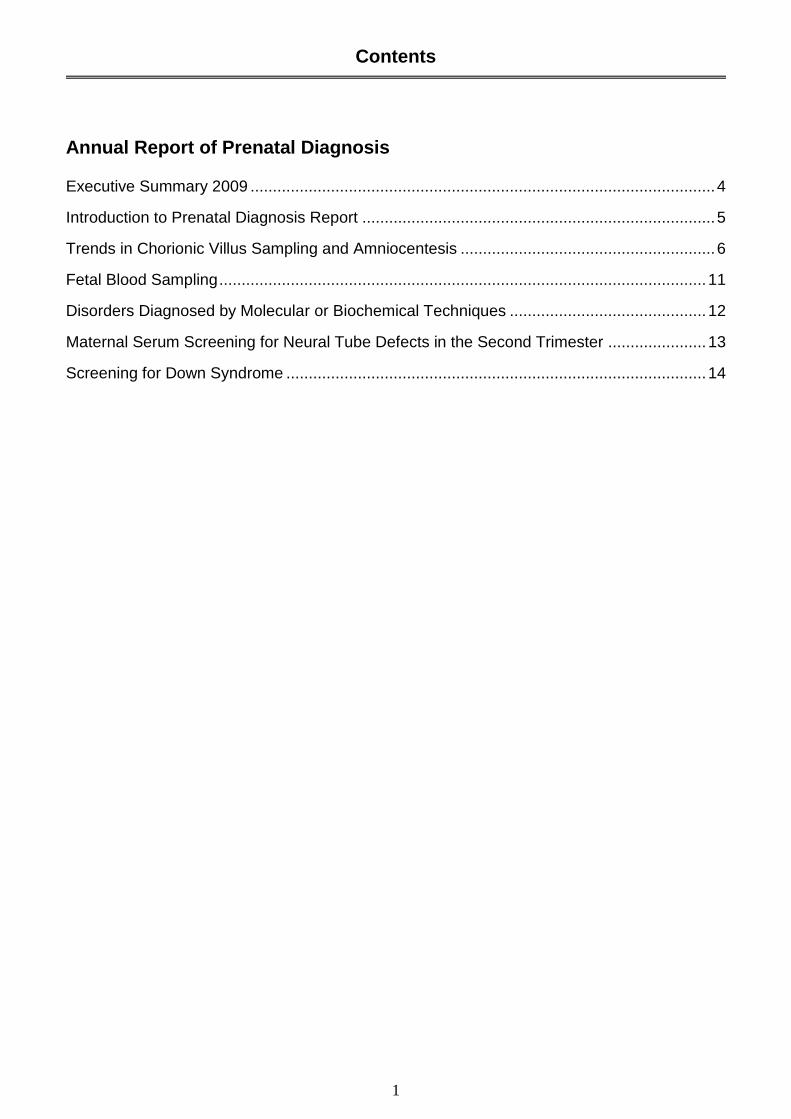
Annual Report of Prenatal Diagnosis
Executive Summary 2009 ........................................................................................................ 4
Introduction to Prenatal Diagnosis Report ............................................................................... 5
Trends in Chorionic Villus Sampling and Amniocentesis ......................................................... 6
Fetal Blood Sampling ............................................................................................................. 11
Disorders Diagnosed by Molecular or Biochemical Techniques ............................................ 12
Maternal Serum Screening for Neural Tube Defects in the Second Trimester ...................... 13
Screening for Down Syndrome .............................................................................................. 14
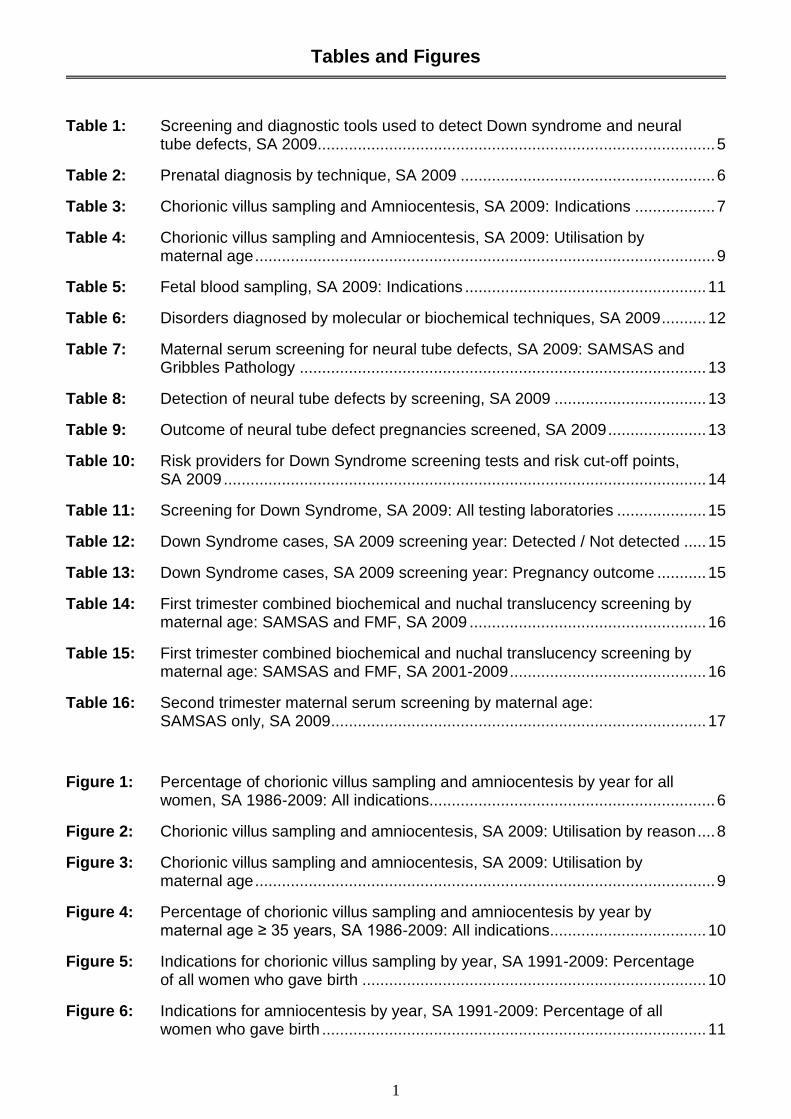
Tables and Figures
1
Table 1: Screening and diagnostic tools used to detect Down syndrome and neural tube defects, SA 2009......................................................................................... 5
Table 2: Prenatal diagnosis by technique, SA 2009 ......................................................... 6
Table 3: Chorionic villus sampling and Amniocentesis, SA 2009: Indications .................. 7
Table 4: Chorionic villus sampling and Amniocentesis, SA 2009: Utilisation by maternal age ....................................................................................................... 9
Table 5: Fetal blood sampling, SA 2009: Indications ...................................................... 11
Table 6: Disorders diagnosed by molecular or biochemical techniques, SA 2009 .......... 12
Table 7: Maternal serum screening for neural tube defects, SA 2009: SAMSAS and Gribbles Pathology ........................................................................................... 13
Table 8: Detection of neural tube defects by screening, SA 2009 .................................. 13
Table 9: Outcome of neural tube defect pregnancies screened, SA 2009 ...................... 13
Table 10: Risk providers for Down Syndrome screening tests and risk cut-off points, SA 2009 ............................................................................................................ 14
Table 11: Screening for Down Syndrome, SA 2009: All testing laboratories .................... 15
Table 12: Down Syndrome cases, SA 2009 screening year: Detected / Not detected ..... 15
Table 13: Down Syndrome cases, SA 2009 screening year: Pregnancy outcome ........... 15
Table 14: First trimester combined biochemical and nuchal translucency screening by maternal age: SAMSAS and FMF, SA 2009 ..................................................... 16
Table 15: First trimester combined biochemical and nuchal translucency screening by maternal age: SAMSAS and FMF, SA 2001-2009 ............................................ 16
Table 16: Second trimester maternal serum screening by maternal age: SAMSAS only, SA 2009.................................................................................... 17
Figure 1: Percentage of chorionic villus sampling and amniocentesis by year for all women, SA 1986-2009: All indications................................................................ 6
Figure 2: Chorionic villus sampling and amniocentesis, SA 2009: Utilisation by reason .... 8
Figure 3: Chorionic villus sampling and amniocentesis, SA 2009: Utilisation by maternal age ....................................................................................................... 9
Figure 4: Percentage of chorionic villus sampling and amniocentesis by year by maternal age ≥ 35 years, SA 1986-2009: All indications ................................... 10
Figure 5: Indications for chorionic villus sampling by year, SA 1991-2009: Percentage of all women who gave birth ............................................................................. 10
Figure 6: Indications for amniocentesis by year, SA 1991-2009: Percentage of all women who gave birth ...................................................................................... 11
South Australian Birth Defects Register Staff
1
South Australian Birth Defects Register Staff
Left to Right: Mrs Rosie Rice, Dr Wendy Scheil, Dr Catherine Gibson
Associate Professor Peter Baghurst, Ms Heather Scott
Executive Summary 2009
1
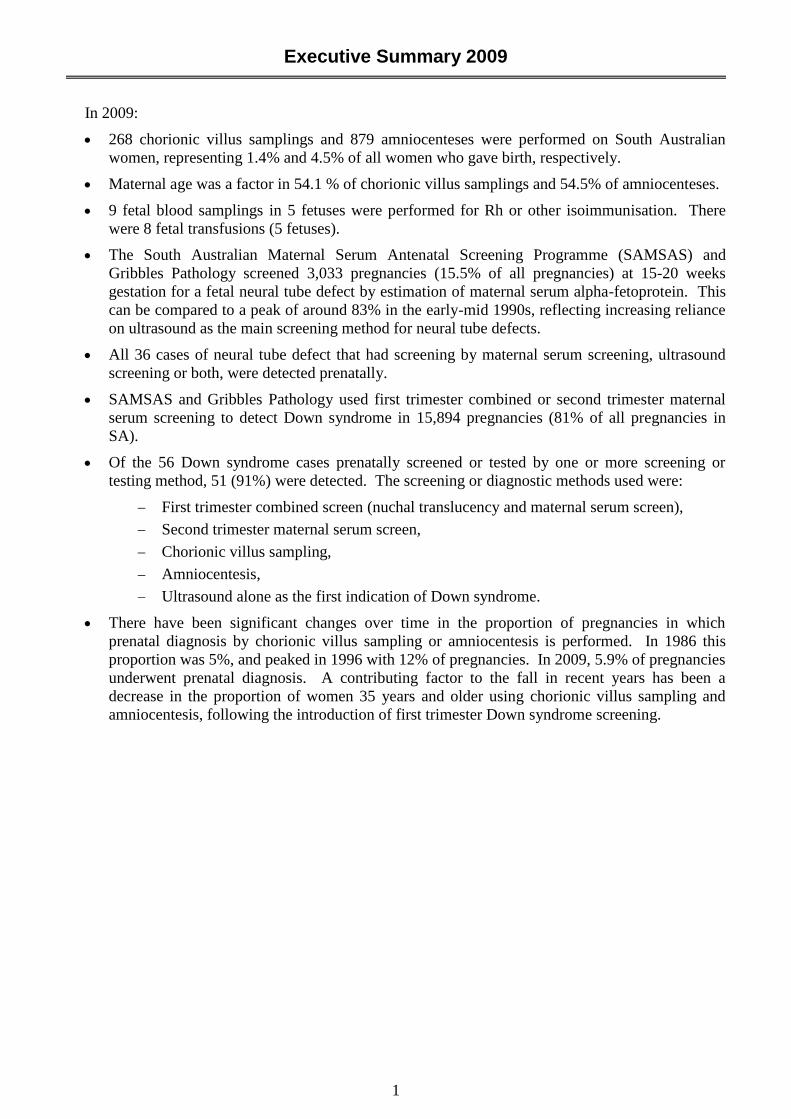
In 2009:
268 chorionic villus samplings and 879 amniocenteses were performed on South Australian
women, representing 1.4% and 4.5% of all women who gave birth, respectively.
Maternal age was a factor in 54.1 % of chorionic villus samplings and 54.5% of amniocenteses.
9 fetal blood samplings in 5 fetuses were performed for Rh or other isoimmunisation. There
were 8 fetal transfusions (5 fetuses).
The South Australian Maternal Serum Antenatal Screening Programme (SAMSAS) and
Gribbles Pathology screened 3,033 pregnancies (15.5% of all pregnancies) at 15-20 weeks
gestation for a fetal neural tube defect by estimation of maternal serum alpha-fetoprotein. This
can be compared to a peak of around 83% in the early-mid 1990s, reflecting increasing reliance
on ultrasound as the main screening method for neural tube defects.
All 36 cases of neural tube defect that had screening by maternal serum screening, ultrasound
screening or both, were detected prenatally.
SAMSAS and Gribbles Pathology used first trimester combined or second trimester maternal
serum screening to detect Down syndrome in 15,894 pregnancies (81% of all pregnancies in
SA).
Of the 56 Down syndrome cases prenatally screened or tested by one or more screening or
testing method, 51 (91%) were detected. The screening or diagnostic methods used were:
First trimester combined screen (nuchal translucency and maternal serum screen),
Second trimester maternal serum screen,
Chorionic villus sampling,
Amniocentesis,
Ultrasound alone as the first indication of Down syndrome.
There have been significant changes over time in the proportion of pregnancies in which
prenatal diagnosis by chorionic villus sampling or amniocentesis is performed. In 1986 this
proportion was 5%, and peaked in 1996 with 12% of pregnancies. In 2009, 5.9% of pregnancies
underwent prenatal diagnosis. A contributing factor to the fall in recent years has been a
decrease in the proportion of women 35 years and older using chorionic villus sampling and
amniocentesis, following the introduction of first trimester Down syndrome screening.
Introduction
1
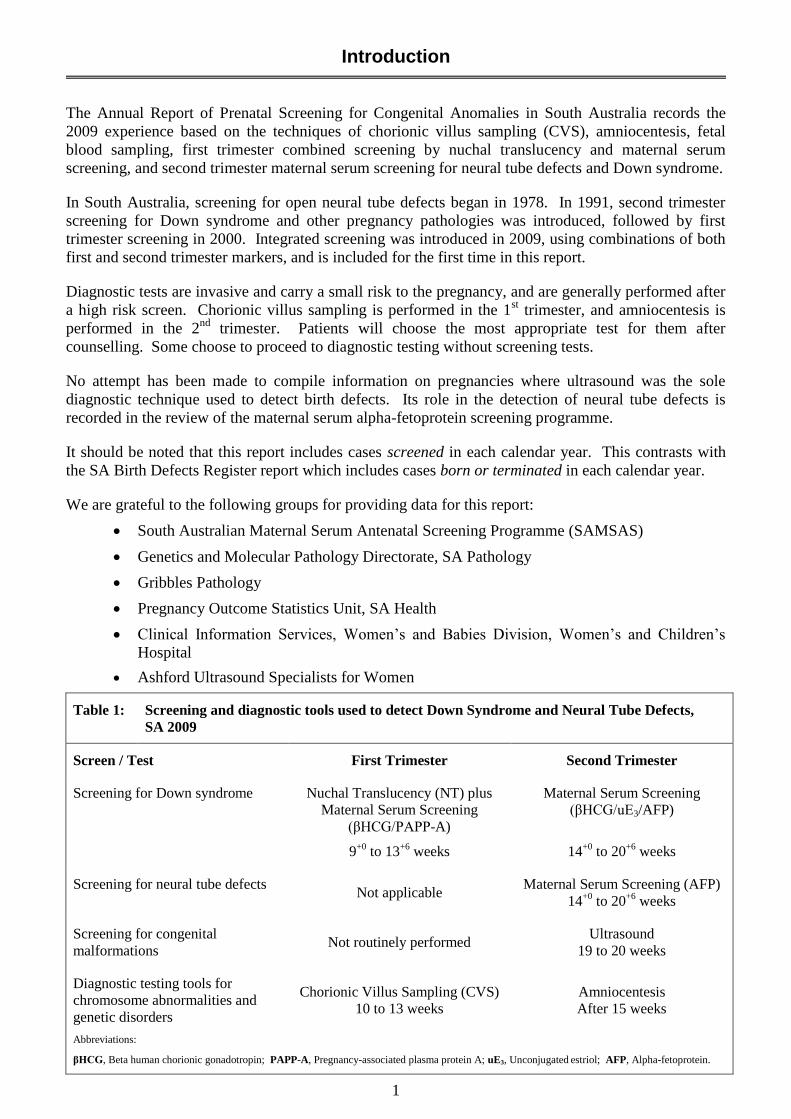
The Annual Report of Prenatal Screening for Congenital Anomalies in South Australia records the
2009 experience based on the techniques of chorionic villus sampling (CVS), amniocentesis, fetal
blood sampling, first trimester combined screening by nuchal translucency and maternal serum
screening, and second trimester maternal serum screening for neural tube defects and Down syndrome.
In South Australia, screening for open neural tube defects began in 1978. In 1991, second trimester
screening for Down syndrome and other pregnancy pathologies was introduced, followed by first
trimester screening in 2000. Integrated screening was introduced in 2009, using combinations of both
first and second trimester markers, and is included for the first time in this report.
Diagnostic tests are invasive and carry a small risk to the pregnancy, and are generally performed after
a high risk screen. Chorionic villus sampling is performed in the 1st trimester, and amniocentesis is
performed in the 2nd
trimester. Patients will choose the most appropriate test for them after
counselling. Some choose to proceed to diagnostic testing without screening tests.
No attempt has been made to compile information on pregnancies where ultrasound was the sole
diagnostic technique used to detect birth defects. Its role in the detection of neural tube defects is
recorded in the review of the maternal serum alpha-fetoprotein screening programme.
It should be noted that this report includes cases screened in each calendar year. This contrasts with
the SA Birth Defects Register report which includes cases born or terminated in each calendar year.
We are grateful to the following groups for providing data for this report:
South Australian Maternal Serum Antenatal Screening Programme (SAMSAS)
Genetics and Molecular Pathology Directorate, SA Pathology
Gribbles Pathology
Pregnancy Outcome Statistics Unit, SA Health
Clinical Information Services, Women’s and Babies Division, Women’s and Children’s
Hospital
Ashford Ultrasound Specialists for Women
Table 1: Screening and diagnostic tools used to detect Down Syndrome and Neural Tube Defects,
SA 2009
Screen / Test First Trimester Second Trimester
Screening for Down syndrome Nuchal Translucency (NT) plus
Maternal Serum Screening
(βHCG/PAPP-A)
9+0
to 13+6
weeks
Maternal Serum Screening
(βHCG/uE3/AFP)
14+0
to 20+6
weeks
Screening for neural tube defects Not applicable
Maternal Serum Screening (AFP)
14+0
to 20+6
weeks
Screening for congenital
malformations Not routinely performed
Ultrasound
19 to 20 weeks
Diagnostic testing tools for
chromosome abnormalities and
genetic disorders
Chorionic Villus Sampling (CVS)
10 to 13 weeks
Amniocentesis
After 15 weeks
Abbreviations:
βHCG, Beta human chorionic gonadotropin; PAPP-A, Pregnancy-associated plasma protein A; uE3, Unconjugated estriol; AFP, Alpha-fetoprotein.
Trends in Chorionic Villus Sampling and Amniocentesis
1
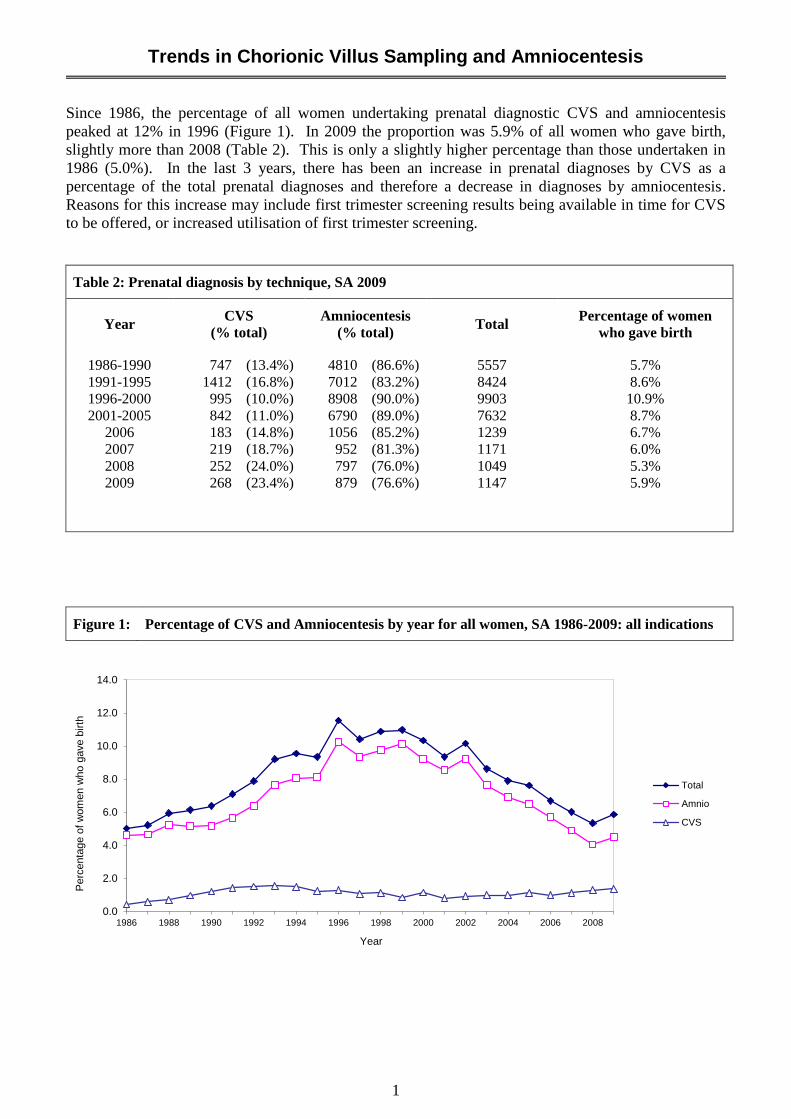
Since 1986, the percentage of all women undertaking prenatal diagnostic CVS and amniocentesis
peaked at 12% in 1996 (Figure 1). In 2009 the proportion was 5.9% of all women who gave birth,
slightly more than 2008 (Table 2). This is only a slightly higher percentage than those undertaken in
1986 (5.0%). In the last 3 years, there has been an increase in prenatal diagnoses by CVS as a
percentage of the total prenatal diagnoses and therefore a decrease in diagnoses by amniocentesis.
Reasons for this increase may include first trimester screening results being available in time for CVS
to be offered, or increased utilisation of first trimester screening.
Table 2: Prenatal diagnosis by technique, SA 2009
Year CVS
(% total)
Amniocentesis
(% total) Total
Percentage of women
who gave birth
1986-1990 747 (13.4%) 4810 (86.6%) 5557 5.7%
1991-1995 1412 (16.8%) 7012 (83.2%) 8424 8.6%
1996-2000 995 (10.0%) 8908 (90.0%) 9903 10.9%
2001-2005 842 (11.0%) 6790 (89.0%) 7632 8.7%
2006 183 (14.8%) 1056 (85.2%) 1239 6.7%
2007 219 (18.7%) 952 (81.3%) 1171 6.0%
2008 252 (24.0%) 797 (76.0%) 1049 5.3%
2009 268 (23.4%) 879 (76.6%) 1147 5.9%
Figure 1: Percentage of CVS and Amniocentesis by year for all women, SA 1986-2009: all indications
0.0
2.0
4.0
6.0
8.0
10.0
12.0
14.0
1986 1988 1990 1992 1994 1996 1998 2000 2002 2004 2006 2008
Perc
enta
ge o
f w
om
en w
ho g
ave b
irth
Year
Total
Amnio
CVS
Chorionic Villus Sampling and Amniocentesis
1
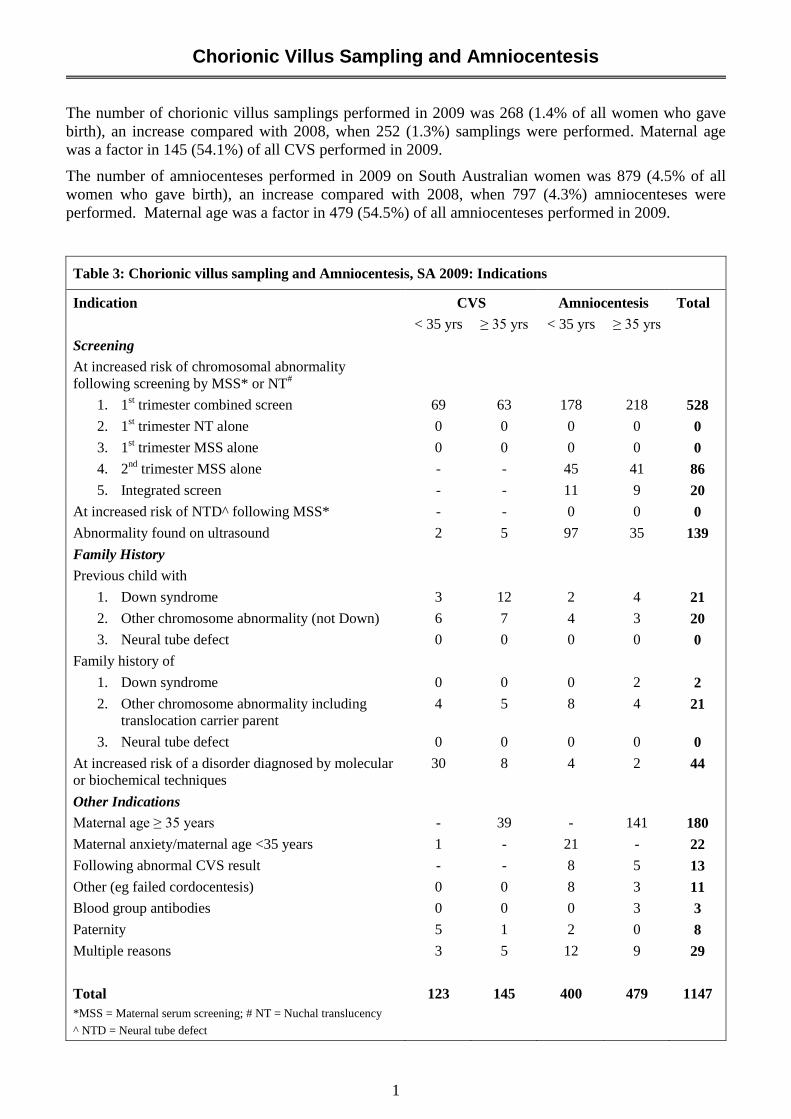
The number of chorionic villus samplings performed in 2009 was 268 (1.4% of all women who gave
birth), an increase compared with 2008, when 252 (1.3%) samplings were performed. Maternal age
was a factor in 145 (54.1%) of all CVS performed in 2009.
The number of amniocenteses performed in 2009 on South Australian women was 879 (4.5% of all
women who gave birth), an increase compared with 2008, when 797 (4.3%) amniocenteses were
performed. Maternal age was a factor in 479 (54.5%) of all amniocenteses performed in 2009.
Table 3: Chorionic villus sampling and Amniocentesis, SA 2009: Indications
Indication CVS Amniocentesis Total
< 35 yrs ≥ 35 yrs < 35 yrs ≥ 35 yrs
Screening
At increased risk of chromosomal abnormality
following screening by MSS* or NT#
1. 1st trimester combined screen 69 63 178 218 528
2. 1st trimester NT alone 0 0 0 0 0
3. 1st trimester MSS alone 0 0 0 0 0
4. 2nd
trimester MSS alone - - 45 41 86
5. Integrated screen - - 11 9 20
At increased risk of NTD^ following MSS* - - 0 0 0
Abnormality found on ultrasound 2 5 97 35 139
Family History
Previous child with
1. Down syndrome 3 12 2 4 21
2. Other chromosome abnormality (not Down) 6 7 4 3 20
3. Neural tube defect 0 0 0 0 0
Family history of
1. Down syndrome 0 0 0 2 2
2. Other chromosome abnormality including
translocation carrier parent
4 5 8 4 21
3. Neural tube defect 0 0 0 0 0
At increased risk of a disorder diagnosed by molecular
or biochemical techniques
30 8 4 2 44
Other Indications
Maternal age ≥ 35 years - 39 - 141 180
Maternal anxiety/maternal age <35 years 1 - 21 - 22
Following abnormal CVS result - - 8 5 13
Other (eg failed cordocentesis) 0 0 8 3 11
Blood group antibodies 0 0 0 3 3
Paternity 5 1 2 0 8
Multiple reasons 3 5 12 9 29
Total 123 145 400 479 1147
*MSS = Maternal serum screening; # NT = Nuchal translucency
^ NTD = Neural tube defect
Trends in Chorionic Villus Sampling and Amniocentesis
1
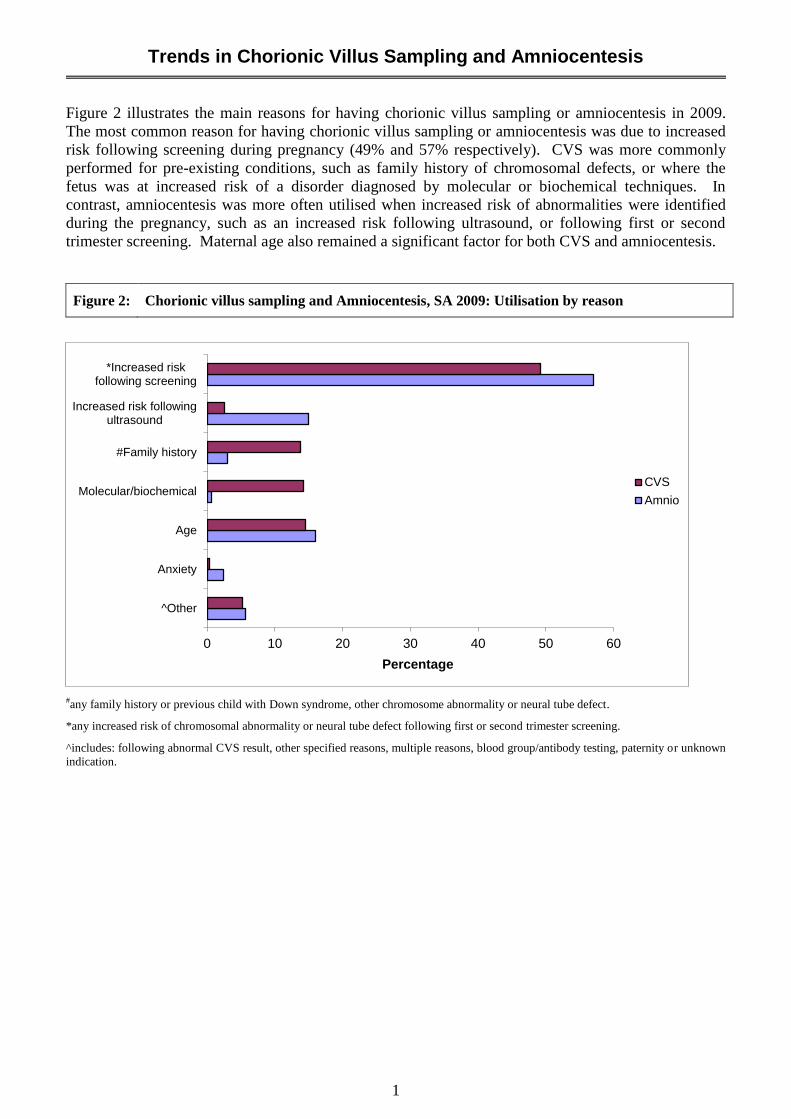
Figure 2 illustrates the main reasons for having chorionic villus sampling or amniocentesis in 2009.
The most common reason for having chorionic villus sampling or amniocentesis was due to increased
risk following screening during pregnancy (49% and 57% respectively). CVS was more commonly
performed for pre-existing conditions, such as family history of chromosomal defects, or where the
fetus was at increased risk of a disorder diagnosed by molecular or biochemical techniques. In
contrast, amniocentesis was more often utilised when increased risk of abnormalities were identified
during the pregnancy, such as an increased risk following ultrasound, or following first or second
trimester screening. Maternal age also remained a significant factor for both CVS and amniocentesis.
Figure 2: Chorionic villus sampling and Amniocentesis, SA 2009: Utilisation by reason
#any family history or previous child with Down syndrome, other chromosome abnormality or neural tube defect.
*any increased risk of chromosomal abnormality or neural tube defect following first or second trimester screening.
^includes: following abnormal CVS result, other specified reasons, multiple reasons, blood group/antibody testing, paternity or unknown
indication.
0 10 20 30 40 50 60
^Other
Anxiety
Age
Molecular/biochemical
#Family history
Increased risk followingultrasound
*Increased riskfollowing screening
Percentage
CVS
Amnio
Trends in Chorionic Villus Sampling and Amniocentesis
2
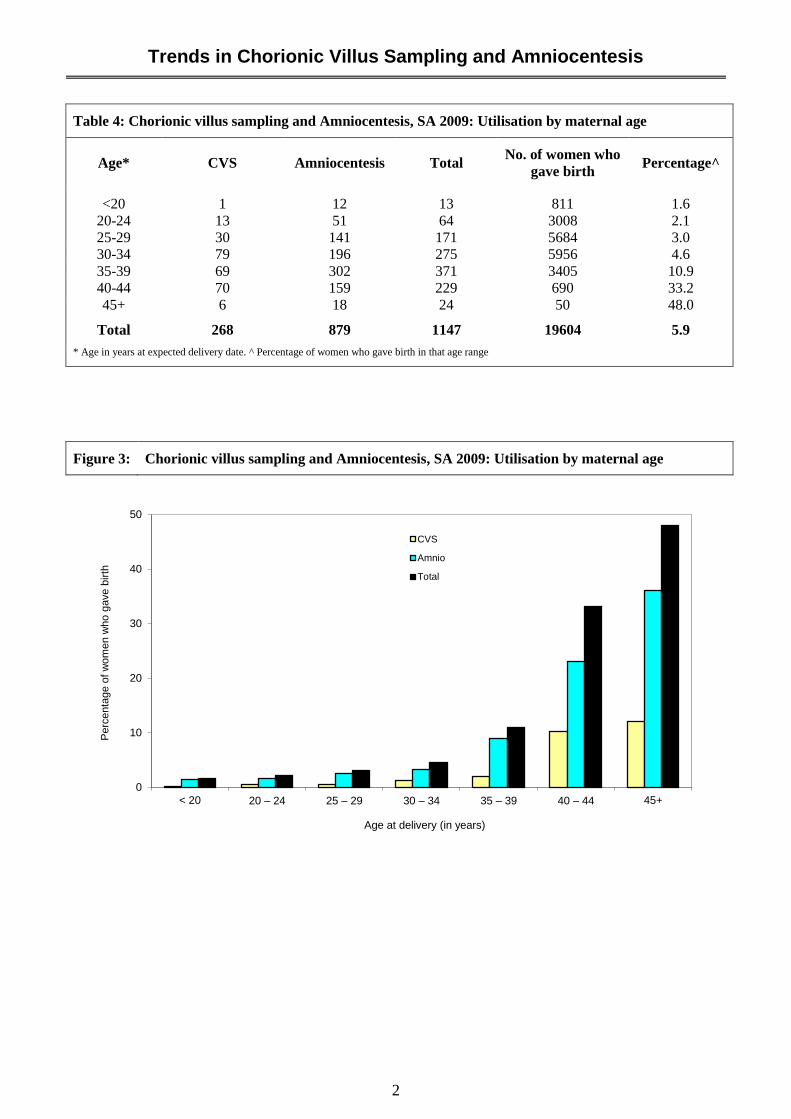
Table 4: Chorionic villus sampling and Amniocentesis, SA 2009: Utilisation by maternal age
Age* CVS Amniocentesis Total No. of women who
gave birth Percentage^
<20 1 12 13 811 1.6
20-24 13 51 64 3008 2.1
25-29 30 141 171 5684 3.0
30-34 79 196 275 5956 4.6
35-39 69 302 371 3405 10.9
40-44 70 159 229 690 33.2
45+ 6 18 24 50 48.0
Total 268 879 1147 19604 5.9
* Age in years at expected delivery date. ^ Percentage of women who gave birth in that age range
Figure 3: Chorionic villus sampling and Amniocentesis, SA 2009: Utilisation by maternal age
0
10
20
30
40
50
< 20 20 – 24 25 – 29 30 – 34 35 – 39 40 – 44 45+
Perc
enta
ge o
f w
om
en w
ho g
ave b
irth
Age at delivery (in years)
CVS
Amnio
Total
Trends in Chorionic Villus Sampling and Amniocentesis
3
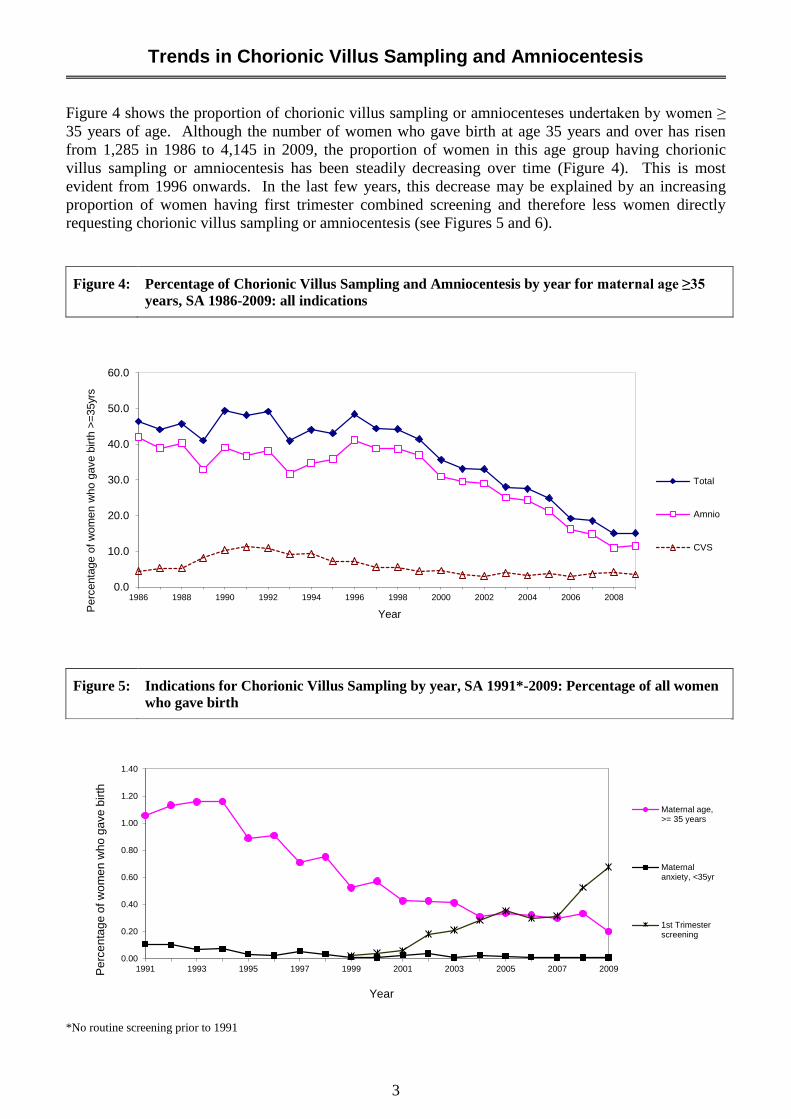
Figure 4 shows the proportion of chorionic villus sampling or amniocenteses undertaken by women ≥
35 years of age. Although the number of women who gave birth at age 35 years and over has risen
from 1,285 in 1986 to 4,145 in 2009, the proportion of women in this age group having chorionic
villus sampling or amniocentesis has been steadily decreasing over time (Figure 4). This is most
evident from 1996 onwards. In the last few years, this decrease may be explained by an increasing
proportion of women having first trimester combined screening and therefore less women directly
requesting chorionic villus sampling or amniocentesis (see Figures 5 and 6).
Figure 4: Percentage of Chorionic Villus Sampling and Amniocentesis by year for maternal age ≥35
years, SA 1986-2009: all indications
Figure 5: Indications for Chorionic Villus Sampling by year, SA 1991*-2009: Percentage of all women
who gave birth
*No routine screening prior to 1991
0.0
10.0
20.0
30.0
40.0
50.0
60.0
1986 1988 1990 1992 1994 1996 1998 2000 2002 2004 2006 2008
Perc
enta
ge o
f w
om
en w
ho g
ave b
irth
>=
35yrs
Year
Total
Amnio
CVS
0.00
0.20
0.40
0.60
0.80
1.00
1.20
1.40
1991 1993 1995 1997 1999 2001 2003 2005 2007 2009Pe
rce
nta
ge
of w
om
en
wh
o g
ave
birth
Year
Maternal age,>= 35 years
Maternalanxiety, <35yr
1st Trimesterscreening
Trends in Chorionic Villus Sampling and Amniocentesis
4
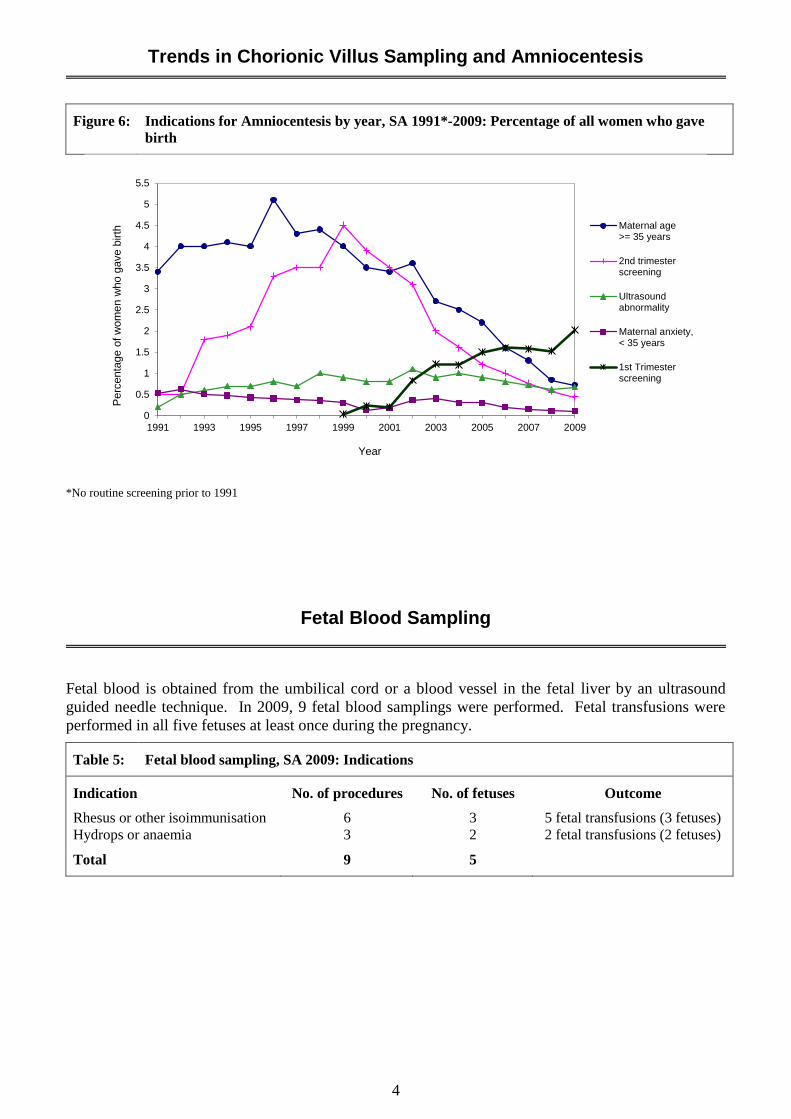
Figure 6: Indications for Amniocentesis by year, SA 1991*-2009: Percentage of all women who gave
birth
*No routine screening prior to 1991
Fetal Blood Sampling
Fetal blood is obtained from the umbilical cord or a blood vessel in the fetal liver by an ultrasound
guided needle technique. In 2009, 9 fetal blood samplings were performed. Fetal transfusions were
performed in all five fetuses at least once during the pregnancy.
Table 5: Fetal blood sampling, SA 2009: Indications
Indication No. of procedures No. of fetuses Outcome
Rhesus or other isoimmunisation 6 3 5 fetal transfusions (3 fetuses)
Hydrops or anaemia 3 2 2 fetal transfusions (2 fetuses)
Total 9 5
0
0.5
1
1.5
2
2.5
3
3.5
4
4.5
5
5.5
1991 1993 1995 1997 1999 2001 2003 2005 2007 2009
Perc
enta
ge o
f w
om
en w
ho g
ave b
irth
Year
Maternal age>= 35 years
2nd trimesterscreening
Ultrasoundabnormality
Maternal anxiety,< 35 years
1st Trimesterscreening
Disorders diagnosed by molecular or biochemical techniques
1
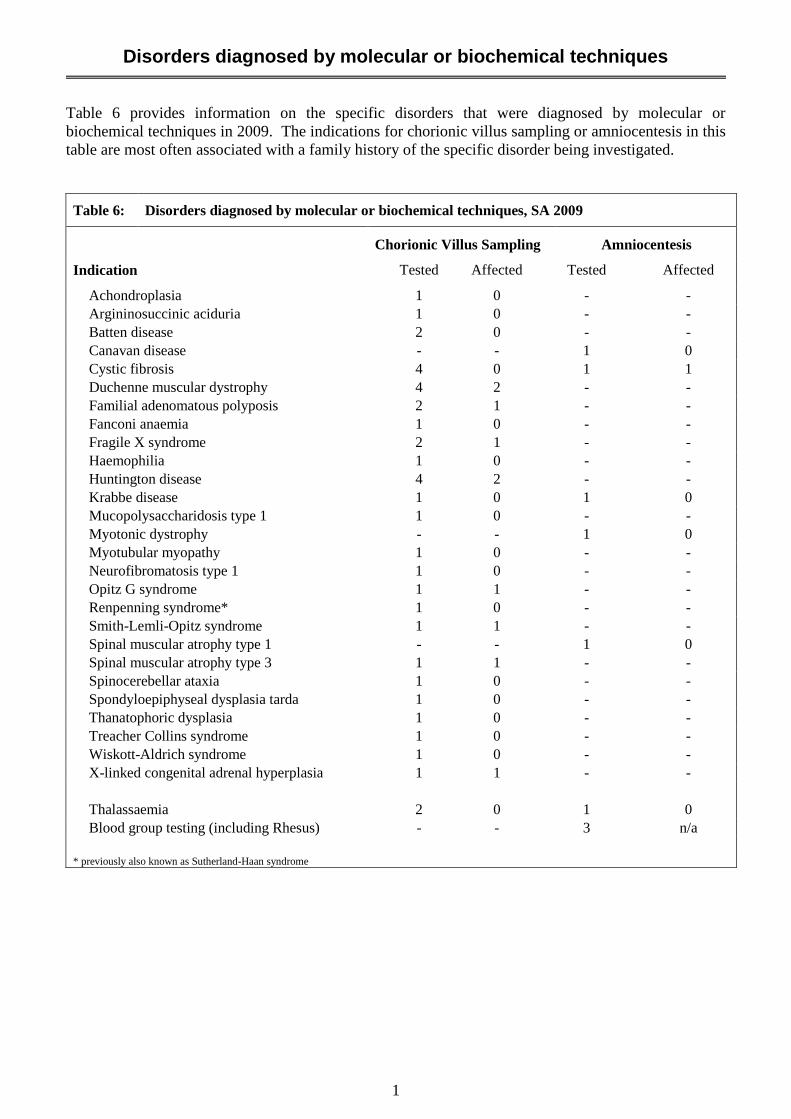
Table 6 provides information on the specific disorders that were diagnosed by molecular or
biochemical techniques in 2009. The indications for chorionic villus sampling or amniocentesis in this
table are most often associated with a family history of the specific disorder being investigated.
Table 6: Disorders diagnosed by molecular or biochemical techniques, SA 2009
Chorionic Villus Sampling Amniocentesis
Indication Tested Affected Tested Affected
Achondroplasia 1 0 - -
Argininosuccinic aciduria 1 0 - -
Batten disease 2 0 - -
Canavan disease - - 1 0
Cystic fibrosis 4 0 1 1
Duchenne muscular dystrophy 4 2 - -
Familial adenomatous polyposis 2 1 - -
Fanconi anaemia 1 0 - -
Fragile X syndrome 2 1 - -
Haemophilia 1 0 - -
Huntington disease 4 2 - -
Krabbe disease 1 0 1 0
Mucopolysaccharidosis type 1 1 0 - -
Myotonic dystrophy - - 1 0
Myotubular myopathy 1 0 - -
Neurofibromatosis type 1 1 0 - -
Opitz G syndrome 1 1 - -
Renpenning syndrome* 1 0 - -
Smith-Lemli-Opitz syndrome 1 1 - -
Spinal muscular atrophy type 1 - - 1 0
Spinal muscular atrophy type 3 1 1 - -
Spinocerebellar ataxia 1 0 - -
Spondyloepiphyseal dysplasia tarda 1 0 - -
Thanatophoric dysplasia 1 0 - -
Treacher Collins syndrome 1 0 - -
Wiskott-Aldrich syndrome 1 0 - -
X-linked congenital adrenal hyperplasia 1 1 - -
Thalassaemia 2 0 1 0
Blood group testing (including Rhesus) - - 3 n/a
* previously also known as Sutherland-Haan syndrome
Maternal Serum Screening for Neural Tube Defects in the 2nd Trimester
1
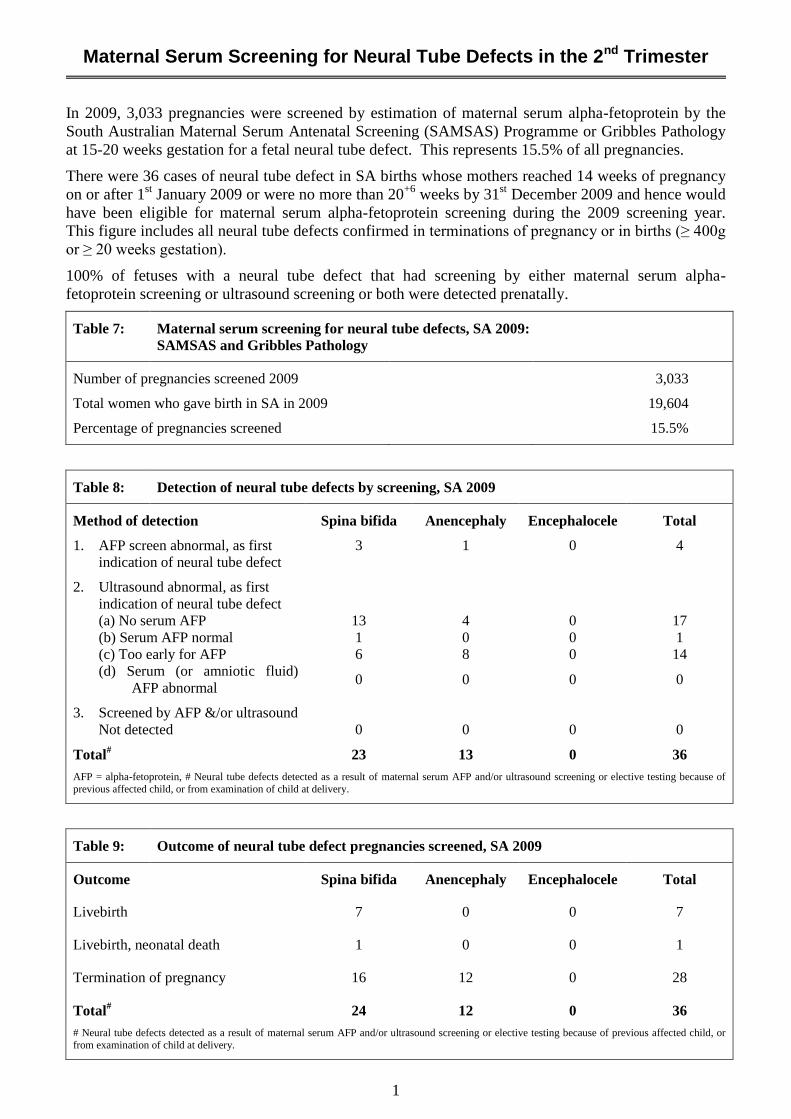
In 2009, 3,033 pregnancies were screened by estimation of maternal serum alpha-fetoprotein by the
South Australian Maternal Serum Antenatal Screening (SAMSAS) Programme or Gribbles Pathology
at 15-20 weeks gestation for a fetal neural tube defect. This represents 15.5% of all pregnancies.
There were 36 cases of neural tube defect in SA births whose mothers reached 14 weeks of pregnancy
on or after 1st January 2009 or were no more than 20
+6 weeks by 31
st December 2009 and hence would
have been eligible for maternal serum alpha-fetoprotein screening during the 2009 screening year.
This figure includes all neural tube defects confirmed in terminations of pregnancy or in births (≥ 400g
or ≥ 20 weeks gestation).
100% of fetuses with a neural tube defect that had screening by either maternal serum alpha-
fetoprotein screening or ultrasound screening or both were detected prenatally.
Table 7: Maternal serum screening for neural tube defects, SA 2009:
SAMSAS and Gribbles Pathology
Number of pregnancies screened 2009 3,033
Total women who gave birth in SA in 2009 19,604
Percentage of pregnancies screened 15.5%
Table 8: Detection of neural tube defects by screening, SA 2009
Method of detection Spina bifida Anencephaly Encephalocele Total
1. AFP screen abnormal, as first 3 1 0 4
indication of neural tube defect
2. Ultrasound abnormal, as first
indication of neural tube defect
(a) No serum AFP 13 4 0 17
(b) Serum AFP normal 1 0 0 1
(c) Too early for AFP 6 8 0 14
(d) Serum (or amniotic fluid)
AFP abnormal 0 0 0 0
3. Screened by AFP &/or ultrasound
Not detected 0 0 0 0
Total# 23 13 0 36
AFP = alpha-fetoprotein, # Neural tube defects detected as a result of maternal serum AFP and/or ultrasound screening or elective testing because of
previous affected child, or from examination of child at delivery.
Table 9: Outcome of neural tube defect pregnancies screened, SA 2009
Outcome Spina bifida Anencephaly Encephalocele Total
Livebirth 7 0 0 7
Livebirth, neonatal death 1 0 0 1
Termination of pregnancy 16 12 0 28
Total# 24 12 0 36
# Neural tube defects detected as a result of maternal serum AFP and/or ultrasound screening or elective testing because of previous affected child, or
from examination of child at delivery.
Screening for Down Syndrome
1
There are both screening and diagnostic tests for Down syndrome during pregnancy. The screening
tests include nuchal translucency (NT) screening, 1st trimester maternal serum screening (MSS), and
the most commonly used first trimester test, combined NT and first trimester MSS. Second trimester
MSS is also available if 1st trimester screening has not been performed. Integrated screening is now
offered for patients who have had both 1st and 2
nd trimester screening.
Diagnostic tests are invasive and carry a small risk to the pregnancy; they are chorionic villus sampling
(CVS) performed in the 1st trimester, and amniocentesis performed in the 2
nd trimester. They are
generally performed after a high risk screen. Patients will choose the most appropriate test for them
after counselling. Some choose to proceed to diagnostic testing without screening tests.
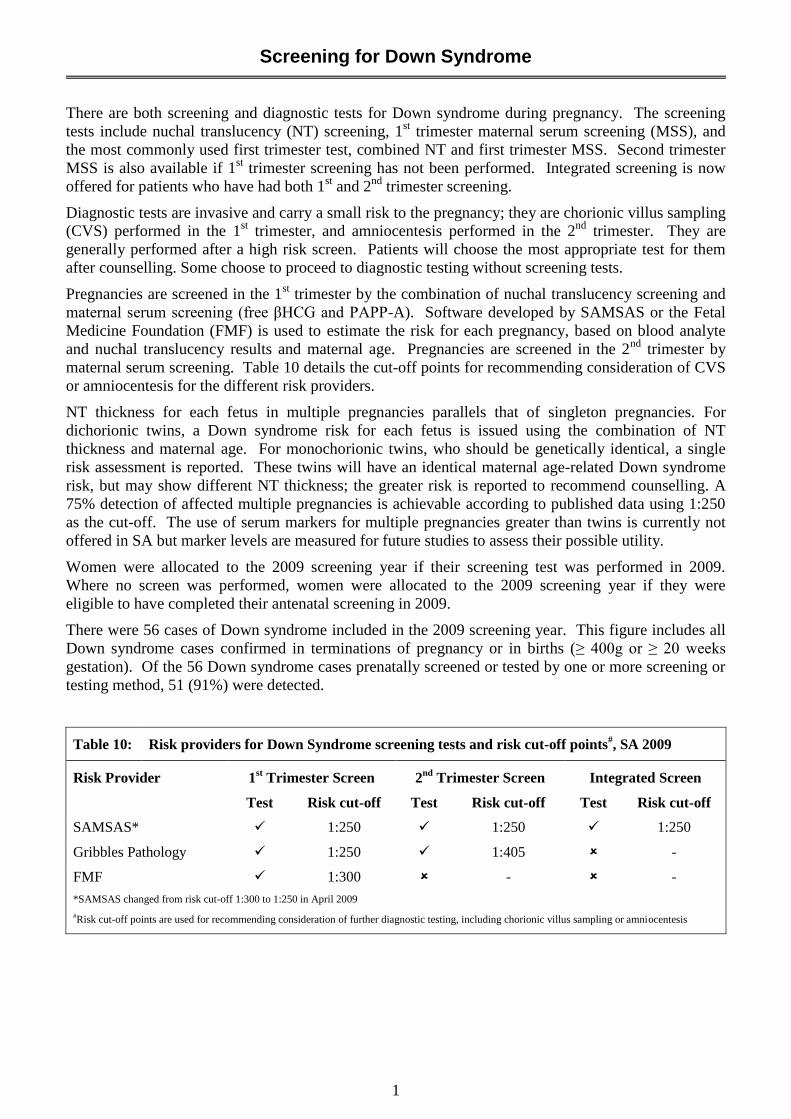
Pregnancies are screened in the 1st trimester by the combination of nuchal translucency screening and
maternal serum screening (free βHCG and PAPP-A). Software developed by SAMSAS or the Fetal
Medicine Foundation (FMF) is used to estimate the risk for each pregnancy, based on blood analyte
and nuchal translucency results and maternal age. Pregnancies are screened in the 2nd
trimester by
maternal serum screening. Table 10 details the cut-off points for recommending consideration of CVS
or amniocentesis for the different risk providers.
NT thickness for each fetus in multiple pregnancies parallels that of singleton pregnancies. For
dichorionic twins, a Down syndrome risk for each fetus is issued using the combination of NT
thickness and maternal age. For monochorionic twins, who should be genetically identical, a single
risk assessment is reported. These twins will have an identical maternal age-related Down syndrome
risk, but may show different NT thickness; the greater risk is reported to recommend counselling. A
75% detection of affected multiple pregnancies is achievable according to published data using 1:250
as the cut-off. The use of serum markers for multiple pregnancies greater than twins is currently not
offered in SA but marker levels are measured for future studies to assess their possible utility.
Women were allocated to the 2009 screening year if their screening test was performed in 2009.
Where no screen was performed, women were allocated to the 2009 screening year if they were
eligible to have completed their antenatal screening in 2009.
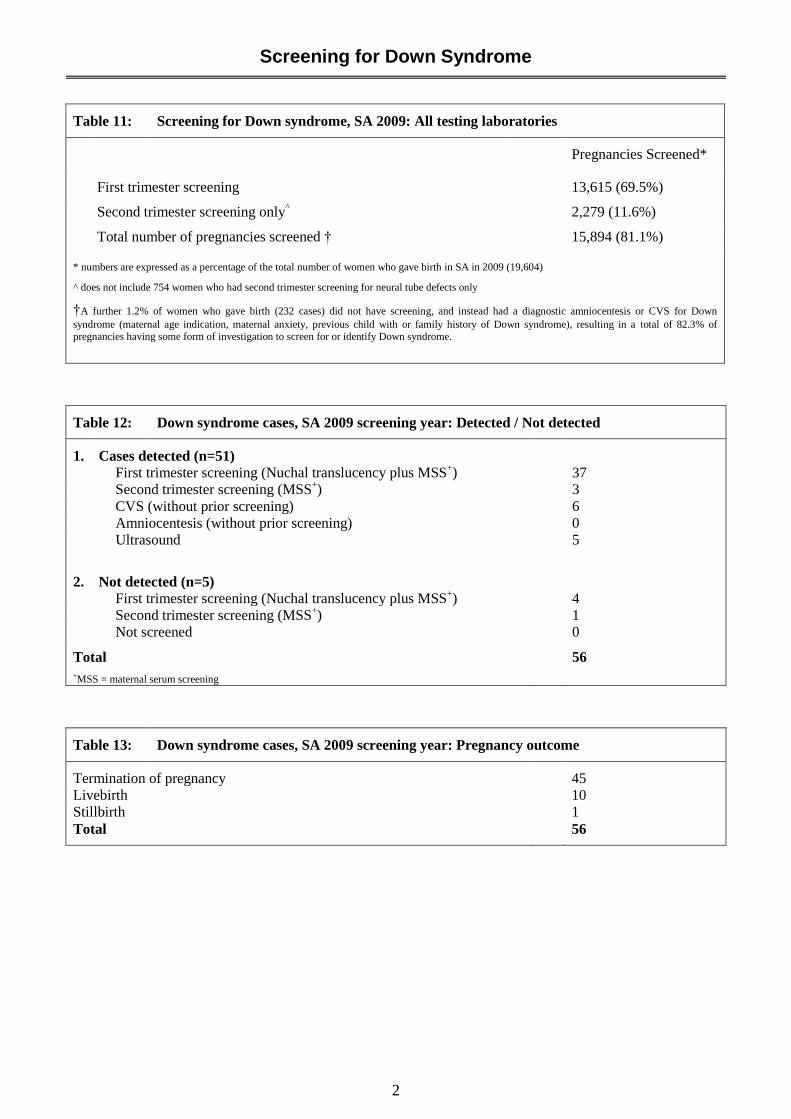
There were 56 cases of Down syndrome included in the 2009 screening year. This figure includes all
Down syndrome cases confirmed in terminations of pregnancy or in births (≥ 400g or ≥ 20 weeks
gestation). Of the 56 Down syndrome cases prenatally screened or tested by one or more screening or
testing method, 51 (91%) were detected.
Table 10: Risk providers for Down Syndrome screening tests and risk cut-off points#, SA 2009
Risk Provider 1st Trimester Screen 2
nd Trimester Screen Integrated Screen
Test Risk cut-off Test Risk cut-off Test Risk cut-off
SAMSAS* 1:250 1:250 1:250
Gribbles Pathology 1:250 1:405 -
FMF 1:300 - -
*SAMSAS changed from risk cut-off 1:300 to 1:250 in April 2009
#Risk cut-off points are used for recommending consideration of further diagnostic testing, including chorionic villus sampling or amniocentesis
Screening for Down Syndrome
2
Table 11: Screening for Down syndrome, SA 2009: All testing laboratories
Pregnancies Screened*
First trimester screening 13,615 (69.5%)
Second trimester screening only^
2,279 (11.6%)
Total number of pregnancies screened † 15,894 (81.1%)
* numbers are expressed as a percentage of the total number of women who gave birth in SA in 2009 (19,604)
^ does not include 754 women who had second trimester screening for neural tube defects only
†A further 1.2% of women who gave birth (232 cases) did not have screening, and instead had a diagnostic amniocentesis or CVS for Down
syndrome (maternal age indication, maternal anxiety, previous child with or family history of Down syndrome), resulting in a total of 82.3% of pregnancies having some form of investigation to screen for or identify Down syndrome.
Table 12: Down syndrome cases, SA 2009 screening year: Detected / Not detected
1. Cases detected (n=51)
First trimester screening (Nuchal translucency plus MSS+) 37
Second trimester screening (MSS+) 3
CVS (without prior screening) 6
Amniocentesis (without prior screening) 0
Ultrasound 5
2. Not detected (n=5)
First trimester screening (Nuchal translucency plus MSS+) 4
Second trimester screening (MSS+) 1
Not screened 0
Total 56 +MSS = maternal serum screening
Table 13: Down syndrome cases, SA 2009 screening year: Pregnancy outcome
Termination of pregnancy 45
Livebirth 10
Stillbirth 1
Total 56
Screening for Down Syndrome
3
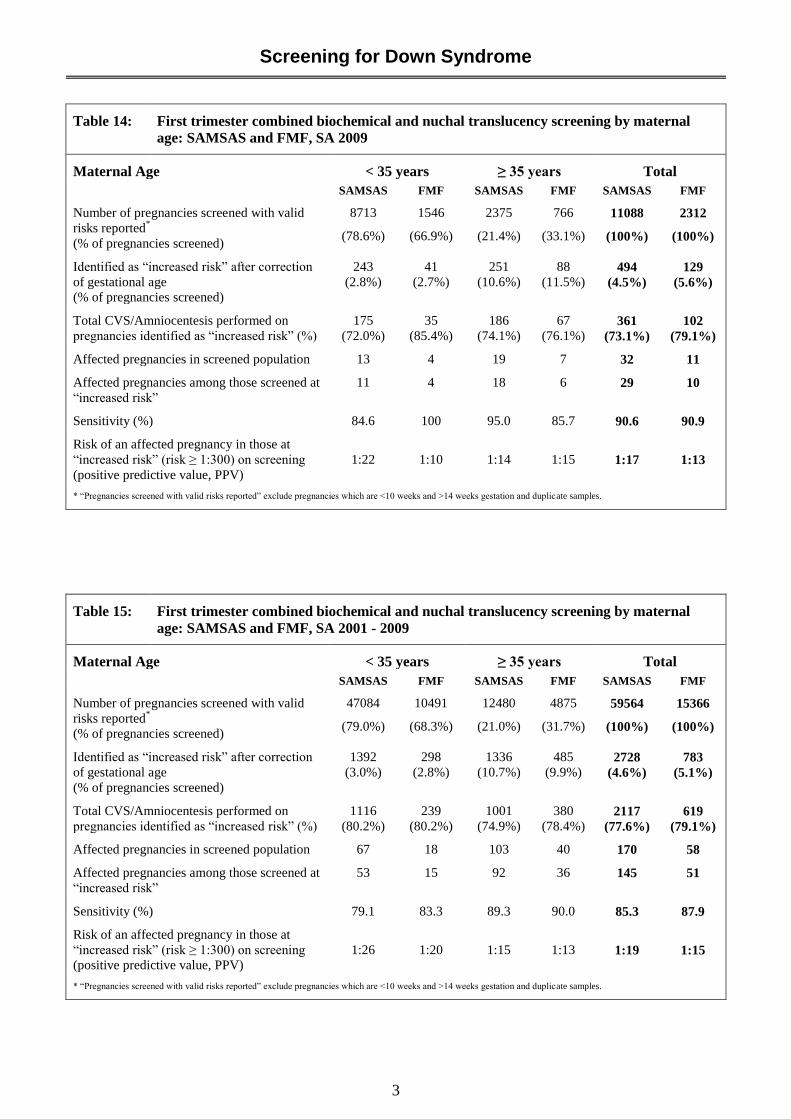
Table 14: First trimester combined biochemical and nuchal translucency screening by maternal
age: SAMSAS and FMF, SA 2009
Maternal Age < 35 years ≥ 35 years Total
SAMSAS FMF SAMSAS FMF SAMSAS FMF
Number of pregnancies screened with valid
risks reported*
(% of pregnancies screened)
8713
(78.6%)
1546
(66.9%)
2375
(21.4%)
766
(33.1%)
11088
(100%)
2312
(100%)
Identified as “increased risk” after correction
of gestational age
(% of pregnancies screened)
243
(2.8%)
41
(2.7%)
251
(10.6%)
88
(11.5%) 494
(4.5%)
129
(5.6%)
Total CVS/Amniocentesis performed on
pregnancies identified as “increased risk” (%)
175
(72.0%)
35
(85.4%)
186
(74.1%)
67
(76.1%) 361
(73.1%)
102
(79.1%)
Affected pregnancies in screened population 13 4 19 7 32 11
Affected pregnancies among those screened at
“increased risk”
11 4 18 6 29 10
Sensitivity (%) 84.6 100 95.0 85.7 90.6 90.9
Risk of an affected pregnancy in those at
“increased risk” (risk ≥ 1:300) on screening
(positive predictive value, PPV)
1:22 1:10 1:14 1:15 1:17 1:13
* “Pregnancies screened with valid risks reported” exclude pregnancies which are <10 weeks and >14 weeks gestation and duplicate samples.
Table 15: First trimester combined biochemical and nuchal translucency screening by maternal
age: SAMSAS and FMF, SA 2001 - 2009
Maternal Age < 35 years ≥ 35 years Total
SAMSAS FMF SAMSAS FMF SAMSAS FMF
Number of pregnancies screened with valid
risks reported*
(% of pregnancies screened)
47084
(79.0%)
10491
(68.3%)
12480
(21.0%)
4875
(31.7%)
59564
(100%)
15366
(100%)
Identified as “increased risk” after correction
of gestational age
(% of pregnancies screened)
1392
(3.0%)
298
(2.8%)
1336
(10.7%)
485
(9.9%) 2728
(4.6%)
783
(5.1%)
Total CVS/Amniocentesis performed on
pregnancies identified as “increased risk” (%)
1116
(80.2%)
239
(80.2%)
1001
(74.9%)
380
(78.4%) 2117
(77.6%)
619
(79.1%)
Affected pregnancies in screened population 67 18 103 40 170 58
Affected pregnancies among those screened at
“increased risk”
53 15 92 36 145 51
Sensitivity (%) 79.1 83.3 89.3 90.0 85.3 87.9
Risk of an affected pregnancy in those at
“increased risk” (risk ≥ 1:300) on screening
(positive predictive value, PPV)
1:26 1:20 1:15 1:13 1:19 1:15
* “Pregnancies screened with valid risks reported” exclude pregnancies which are <10 weeks and >14 weeks gestation and duplicate samples.
Screening for Down Syndrome
4
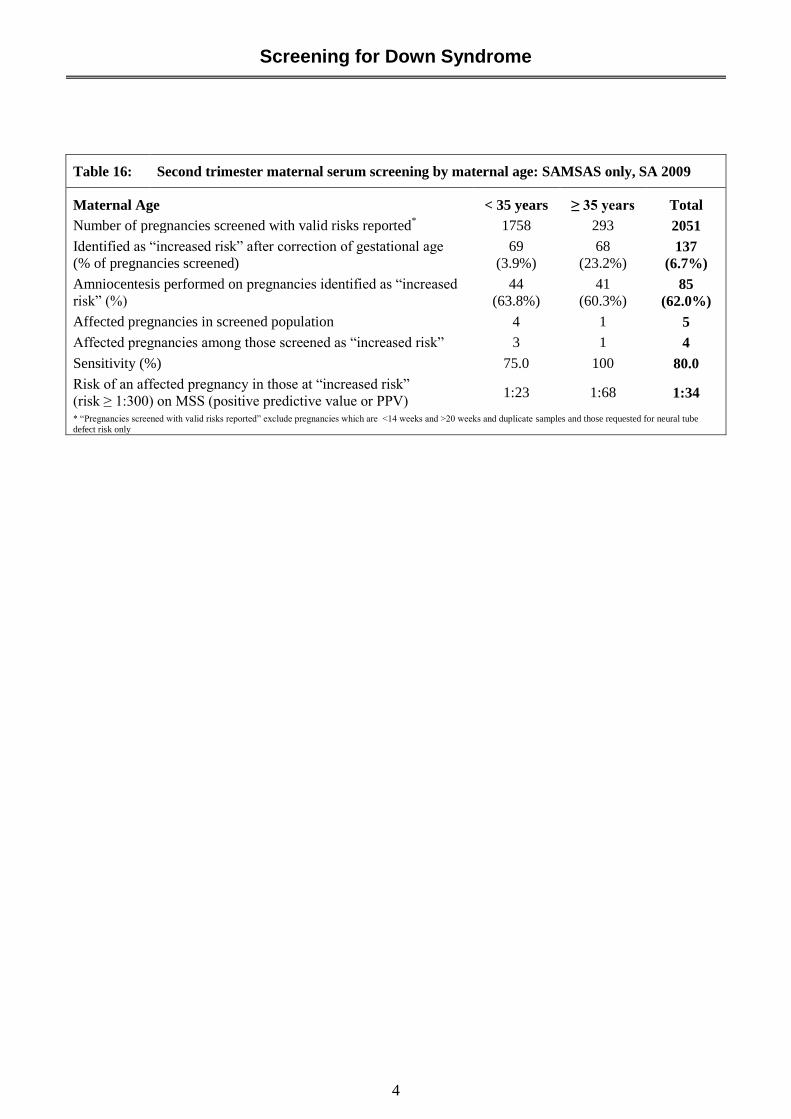
Table 16: Second trimester maternal serum screening by maternal age: SAMSAS only, SA 2009
Maternal Age < 35 years ≥ 35 years Total
Number of pregnancies screened with valid risks reported*
1758 293 2051
Identified as “increased risk” after correction of gestational age
(% of pregnancies screened)
69
(3.9%)
68
(23.2%) 137
(6.7%)
Amniocentesis performed on pregnancies identified as “increased
risk” (%)
44
(63.8%)
41
(60.3%) 85
(62.0%)
Affected pregnancies in screened population 4 1 5
Affected pregnancies among those screened as “increased risk” 3 1 4
Sensitivity (%) 75.0 100 80.0
Risk of an affected pregnancy in those at “increased risk”
(risk ≥ 1:300) on MSS (positive predictive value or PPV) 1:23 1:68 1:34
* “Pregnancies screened with valid risks reported” exclude pregnancies which are <14 weeks and >20 weeks and duplicate samples and those requested for neural tube
defect risk only