preparation and characterization of ceria-based electrolytes for
TRANSCRIPT

J. Iran. Chem. Soc., Vol. 7, No. 3, September 2010, pp. 564-584. JOURNAL OF THE Iranian
Chemical Society
Preparation and Characterization of Ceria-Based Electrolytes forIntermediate Temperature Solid Oxide Fuel Cells (IT-SOFC)
A. Samson Nesaraja,*, I. Arul Rajb and R. Pattabiramanb
aDepartment of Chemistry, Karunya University, Coimbatore-641 114, India bFuel Cells Section, Central Electrochemical Research Institute, Karaikudi-630 006, India
(Received 1 January 2009, Accepted 14 July 2009)
Solid-oxide fuel cells (SOFCs) can be used for clean, efficient and environment-friendly energy conversion with a variety of fuels at high temperature (1273 K). The high temperature operation accelerates unwanted reactions and creates materials challenges; so, intermediate-temperature SOFCs (IT-SOFCs) have been developed. Reduction of the operating temperature (between 873-1073 K) requires solid electrolyte materials with higher conductivities. In this study, partially substituted ceria as solid electrolyte is experimented systematically for use in solid oxide fuel cells operating below 1073 K (intermediate temperature range). Nine compositions namely, CeO2, Ce0.95Gd0.05O2-� (CGO9505), Ce0.90Gd0.10O2-� (CGO9010), Ce0.85Gd0.15O2-� (CGO8515), Ce0.80Gd0.20O2-� (CGO8020), Ce0.95Sm0.05O2-� (SDC9505), Ce0.90Sm0.10O2-� (SDC9010), Ce0.85Sm0.15O2-� (SDC8515) and Ce0.80Sm0.20O2-� (SDC8020) were synthesized by Glycine Nitrate (GN) combustion technique and investigated. The physical properties and the other relevant features of the data obtained are analyzed with a view to use these alternate electrolyte materials in IT-SOFC. Keywords: Solid oxide fuel cell, Ceria based electrolyte, Combustion synthesis, Physical properties
INTRODUCTION
Interest in partially substituted ceria as solid electrolyte for use in solid oxide fuel cells, as an alternative to yttria-stabilized zirconia (YSZ), has been growing [1-3]. Advantages of using ceria-based electrolytes are high ionic conductivity and enhanced electrode reactions due to an electrocatalytic effect via the Ce3+/Ce4+ couple, resulting in a mixed conductivity zone. The combination of these effects is expected to lower the operation temperature of SOFC from 1273 K for YSZ-based cells to 1073 K for ceria-based cells, delivering similar performance. This reduction in operating temperature would increase the stack lifetime, relieve *Corresponding author. E-mail: [email protected]
materials constraints and allow flexibility to the use of metallic separators and, hence, lower fabrication cost. However, the use of CeO2-based electrolytes in SOFCs has been disregarded for many years because of their mixed conduction in reducing atmosphere, which is caused by the formation of electronic charge carriers resulting from the partial reduction of ceria. In fact, the ionic conducting domain of ceria increases greatly with the decrease of temperature. It was found that the partially substituted ceria electrolyte would have an ionic transference number in excess of 0.9 under realistic SOFC anodic conditions at 773 K [4]. In addition, it was demonstrated that partially substituted ceria electrolyte based SOFC could be operated at high current density even at 973 K, and that the electronic conduction would cause leakage current when the cell was operated at low current density and

Samson Nesaraj et al.
565
at temperatures above 773 K [5]. Therefore, it has been widely expected that ceria-based alternate electrolytes can be employed in ITSOFC system operating between 773-1073 K without reduction in cell performance [6-8]. Several trivalent rare-earth oxides form solid solutions with ceria. Among the several trivalent partially rare earth substituted ceria electrolytes, Ce1-xGdxO2-� (CGO) and Ce1-x
SmxO2-� (SDC) exhibit conductivity exceeding that of YSZ at 1073 K (>0.1 S cm-1). Dense ceramics are needed for electrolytes; however, it is difficult to obtain a densely doped ceria ceramic from powders synthesized by conventional solid state reaction techniques at sintering temperature 1923 K in air [9]. Sintering at too high a temperature entails high-energy costs and does not allow co-firing of doped ceria with the adjoining cell components. The soft-chemistry routes such as co-precipitation and sol-gel are good choices to reduce the sintering temperature for dense ceramics [10-11]. During these processes, calcination is the key step for better ceramics; however, there is a lack of published literature on the synthesis of partially rare earth substituted ceria electrolytes by low temperature combustion route and also on the sintering behavior of these types of electrolyte materials. In this research work, a set of partially rare earth substituted ceria-based electrolytes, such as, Ce1-xGdxO2-� (Cerium Gadolinium Oxide-CGO) and Ce1-xSmxO2-� (Samaria doped Ceria-SDC), where x = 0, 0.05, 0.10, 0.15 and 0.20 were synthesized by combustion method using glycine as the fuel and systematically characterized by XRD, TGA/DTA, FTIR, particle size analysis, density measurements and BET surface area measurements. The sintering behavior for the ceria-based electrolytes was also studied. The sintered components were characterized by SEM and porosity measurements. The electrical properties of the sintered components were studied by A.C. impedance spectroscopy.
EXPERIMENTAL The following nine compositions namely, CeO2, Ce0.95Gd0.05O2-� (CGO9505), Ce0.90Gd0.10O2-� (CGO9010), Ce0.85Gd0.15O2-� (CGO8515), Ce0.80Gd0.20O2-� (CGO8020), Ce0.95Sm0.05O2-� (SDC9505), Ce0.90Sm0.10O2-� (SDC9010), Ce0.85Sm0.15O2-� (SDC8515) and Ce0.80Sm0.20O2-� (SDC8020) were synthesized and characterized. The chemicals used in the
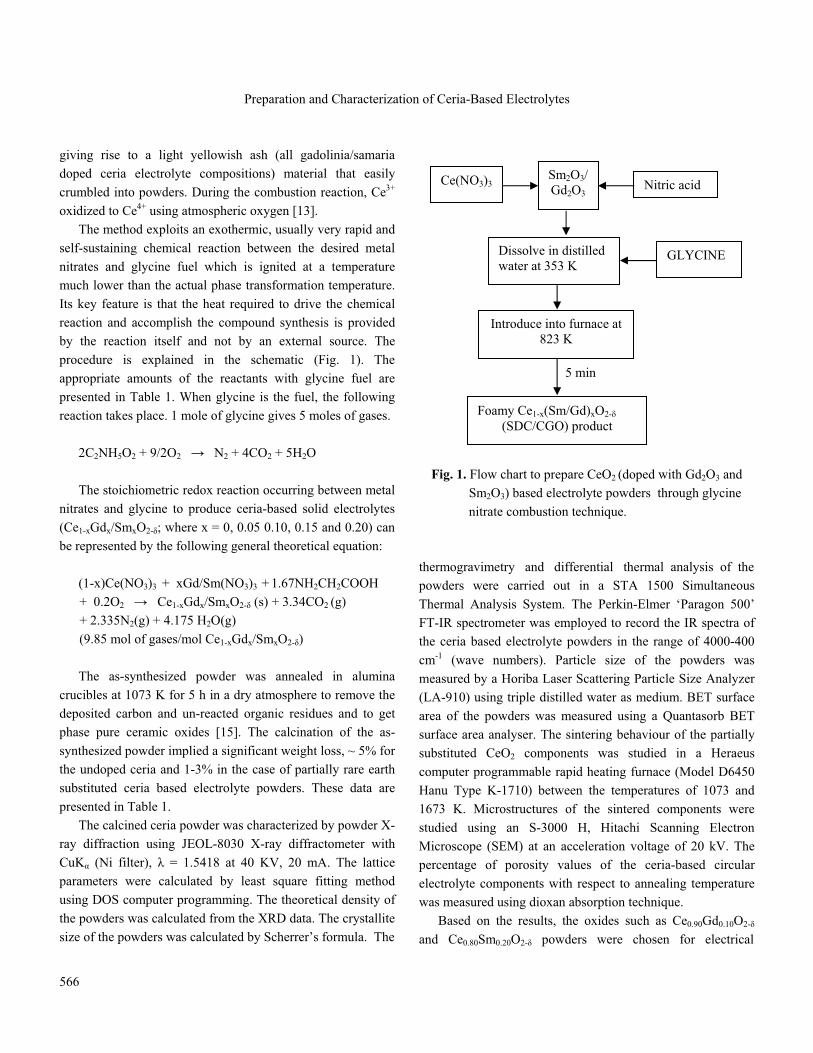
preparative method were: Ce(NO3)3.6H2O (99.00%; CDH, India), Gd2O3 (99.99%, IRE, India), Sm2O3 (99.99%, IRE, India) and NH2-CH2COOH (99.99%, CDH, India). Gd(NO3)3 and Sm(NO3)3 were prepared by dissolving Gd2O3 and Sm2O3 respectively in concentrated HNO3. In a typical experiment, respective stoichiometric amounts of cerium nitrate and gadolinium/samarium nitrate salts were dissolved in a minimum quantity of triple distilled water along with appropriate quantity of glycine (fuel and complexant) in a flat bottomed 250 ml capacity quartz crucible. The complexation of metal ion by the fuel molecule increases the solubility of metal ions in the solution [12]. A stoichiometric composition denotes a fuel to metal nitrate ratio at which the fuel can react completely with all of the metal nitrates in the mixture, in such a way that no residual fuel or nitrate remains in the product materials. Based on the theory proposed earlier [12], the stoichiometric compositions of the redox mixtures for the combustion were calculated using the total oxidizing (O) and reducing (F) valencies of the components which serve as the numerical coefficients for the stoichiometric balance, so that the equivalence ratio, �c (i.e., O:F = 1) is unity and the energy released by the combustion is maximum [13]. Based on the propellant chemistry, the species Ce3+, Gd3+, Sm3+, C and H are considered to be reducing with corresponding valencies +3, +3, +3, +4 and +1. Elemental oxygen is considered to be an oxidizing species with a valency of -2. The valency of nitrogen is considered to be zero. Based on these considerations, cerium nitrate, gadolinium nitrate and samarium nitrate will have an oxidizing valency of -15 and glycine will have a reducing valency of +9. The mixed solution was heated in a heating mantle which was maintained at 353 K to remove the excess nitric acid. The resulting clear solution was introduced into a muffle furnace maintained at 823 K. Initially, the solution boiled to undergo dehydration followed by decomposition with the evolution of large amounts of gases (N2 and CO2). The mixture then frothed and swelled, forming foam which ruptured with a flame and glowed to incandescence. The recorded flame temperature was above 1273 K [14]. During the incandescence the foam further swelled to the capacity of the crucible. The gases evolved resulted in the yield of fine-particles of ceria by dissipating the heat which inhibited sintering of the product. Thus, the combustion reaction was completed within a few seconds,
Preparation and Characterization of Ceria-Based Electrolytes
566
giving rise to a light yellowish ash (all gadolinia/samaria doped ceria electrolyte compositions) material that easily crumbled into powders. During the combustion reaction, Ce3+ oxidized to Ce4+ using atmospheric oxygen [13]. The method exploits an exothermic, usually very rapid and self-sustaining chemical reaction between the desired metal nitrates and glycine fuel which is ignited at a temperature much lower than the actual phase transformation temperature. Its key feature is that the heat required to drive the chemical reaction and accomplish the compound synthesis is provided by the reaction itself and not by an external source. The procedure is explained in the schematic (Fig. 1). The appropriate amounts of the reactants with glycine fuel are presented in Table 1. When glycine is the fuel, the following reaction takes place. 1 mole of glycine gives 5 moles of gases. 2C2NH5O2 + 9/2O2 � N2 + 4CO2 + 5H2O
The stoichiometric redox reaction occurring between metal nitrates and glycine to produce ceria-based solid electrolytes (Ce1-xGdx/SmxO2-�; where x = 0, 0.05 0.10, 0.15 and 0.20) can be represented by the following general theoretical equation: (1-x)Ce(NO3)3 + xGd/Sm(NO3)3 + 1.67NH2CH2COOH + 0.2O2 � Ce1-xGdx/SmxO2-� (s) + 3.34CO2 (g) + 2.335N2(g) + 4.175 H2O(g) (9.85 mol of gases/mol Ce1-xGdx/SmxO2-�) The as-synthesized powder was annealed in alumina crucibles at 1073 K for 5 h in a dry atmosphere to remove the deposited carbon and un-reacted organic residues and to get phase pure ceramic oxides [15]. The calcination of the as-synthesized powder implied a significant weight loss, ~ 5% for the undoped ceria and 1-3% in the case of partially rare earth substituted ceria based electrolyte powders. These data are presented in Table 1. The calcined ceria powder was characterized by powder X-ray diffraction using JEOL-8030 X-ray diffractometer with CuK� (Ni filter), � = 1.5418 at 40 KV, 20 mA. The lattice parameters were calculated by least square fitting method using DOS computer programming. The theoretical density of the powders was calculated from the XRD data. The crystallite size of the powders was calculated by Scherrer’s formula. The
5 min
Fig. 1. Flow chart to prepare CeO2 (doped with Gd2O3 and Sm2O3) based electrolyte powders through glycine
nitrate combustion technique.
thermogravimetry and differential thermal analysis of the powders were carried out in a STA 1500 Simultaneous Thermal Analysis System. The Perkin-Elmer ‘Paragon 500’ FT-IR spectrometer was employed to record the IR spectra of the ceria based electrolyte powders in the range of 4000-400 cm-1 (wave numbers). Particle size of the powders was measured by a Horiba Laser Scattering Particle Size Analyzer (LA-910) using triple distilled water as medium. BET surface area of the powders was measured using a Quantasorb BET surface area analyser. The sintering behaviour of the partially substituted CeO2 components was studied in a Heraeus computer programmable rapid heating furnace (Model D6450 Hanu Type K-1710) between the temperatures of 1073 and 1673 K. Microstructures of the sintered components were studied using an S-3000 H, Hitachi Scanning Electron Microscope (SEM) at an acceleration voltage of 20 kV. The percentage of porosity values of the ceria-based circular electrolyte components with respect to annealing temperature was measured using dioxan absorption technique. Based on the results, the oxides such as Ce0.90Gd0.10O2-� and Ce0.80Sm0.20O2-� powders were chosen for electrical
Sm2O3/ Gd2O3
Nitric acid
Dissolve in distilled water at 353 K
Introduce into furnace at 823 K
Foamy Ce1-x(Sm/Gd)xO2-1 (SDC/CGO) product
GLYCINE
Ce(NO3)3

Samson Nesaraj et al.
567
conductivity measurements. The respective oxide powder was mixed with a binder (about 2 wt%) (Poly Vinyl Butyral) and pressed as circular specimens (diameter 1.0 cm and thickness 0.275 cm approximately) at 625 Mpa using a hydraulic machine (Peeco, Howrah, India). The binder present in the specimens was burnt out at 873 K in 1 h with a heating rate of 5 K min-1 from room temperature. Then, the specimens were sintered at 1573 K for 3 h in air with a heating rate of 20 K min-1 from 873 K. Silver paste (Dupont, Japan) was applied on both sides of the sintered specimens and curing was brought about at 973 K for 1 h. The A.C. conductivity of these pellets was obtained using two probes impedance spectroscopy. The measurements were made from 773 to 973 K in air at 100 °C interval using a frequency response analyser (Schlumberger, SI 1255) attached to electrochemical interface, 1286 (Solatron Schlumberger). The amplitude of AC signal imposed on the samples was 500 mV. The current collectors were platinum mesh and current leads were platinum wires.
RESULTS AND DISCUSSION
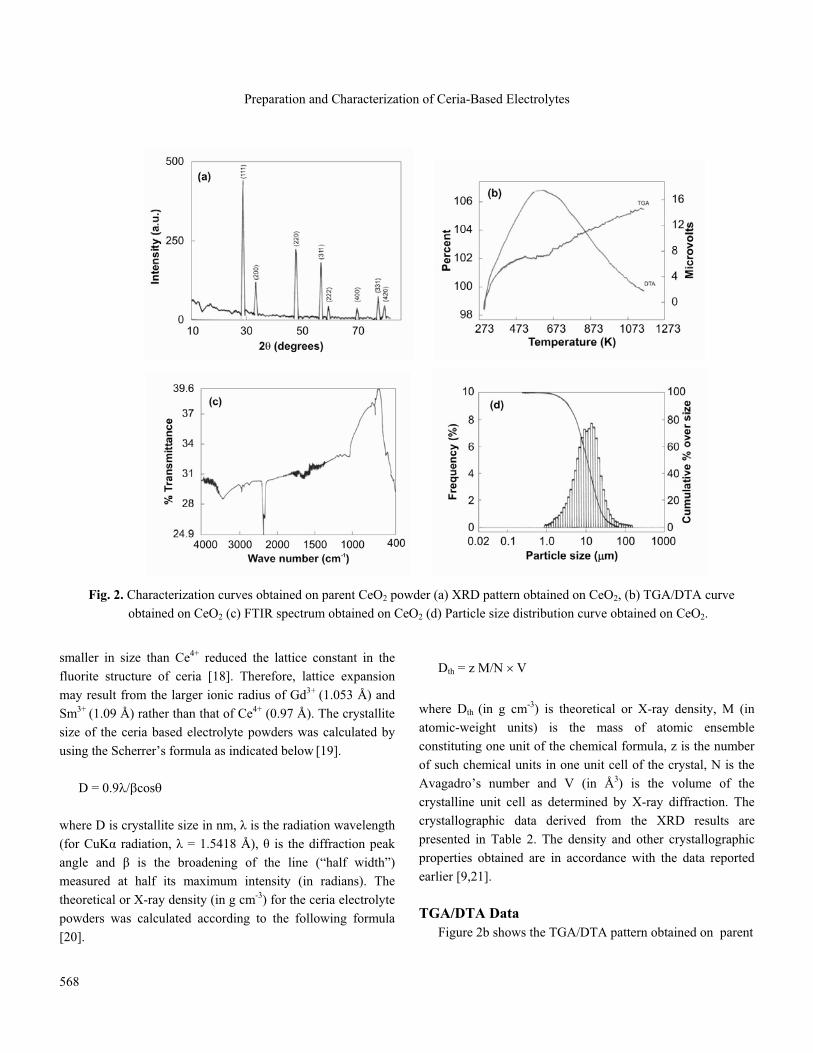
XRD Data The observed XRD pattern for the undoped CeO2 powder is shown in Fig. 2a. The XRD patterns of the doped ceria based electrolyte powders are shown in Figs. 3a-h. The XRD patterns for all the nine ceria compositions exhibited very
sharp peaks. The XRD pattern of the parent CeO2 was matched with the standard data for CeO2 (JCPDS card No. 40593) which exhibited a cubic (f.c.) structure with lattice parameter a = 5.38554 Å against the reported value of a = 5.4110 Å. The XRD patterns of the doped CeO2 powders were matched with the data for CeO2 which was indexed in JCPDS card No. 34-0394. No other peak corresponding to any impurity was observed in the XRD patterns of the ceria compositions. The XRD patterns of the Ce1-xGdxO2-�/Ce1-xSmxO2-� (x = 0.05, 0.10, 0.15 and 0.20) were symmetrical with those of CeO2. The results show that the lattice parameter of the unit cell of Ce1-xSmxO2-� increases linearly with an increase in SmO1.5 [2], whereas, in both systems of Ce1-xGdxO2-� and Ce1-x
SmxO2-�, the lattice parameter increased when compared with that of parent CeO2. No linear increase in the lattice parameters was observed as a function of the substitution. However, the increase in the lattice parameters with the substitution of Gd3+ or Sm3+ for Ce4+, indicated the complete solubility over the investigated range. The rare earth oxides were more soluble in the ceria lattice than were the alkaline earth oxides [16]. Furthermore, as it was postulated earlier, the results show that the doped rare earth ion can substitute for Ce4+ ion with the formation of oxygen vacancy (vacancy model) and can occupy the interstitial sites (interstitial model) [17]. Similarly, it was found that the substitution of ions
Table 1. Precursor Chemicals Used for Synthesizing Fine Particles of CeO2 (Partially Substituted with Gd2O3 and Sm2O3)
Sample Ce(NO3)3
(g) Gd2O3
a/Sm2O3a
(g) Glycine
(g) Yield
(g) wt. after calcination at
1073 K for 5 h (g) Reduction in wt.
(%)
CeO2 4.34 - 10 1.71 1.63 4.67 Ce0.95Gd0.05O2-1 16.50 0.36/0 40 7.01 6.87 1.99 Ce0.90Gd0.10O2-1 15.63 0.72/0 40 6.96 6.90 0.86 Ce0.85Gd0.15O2-1 14.76 1.08/0 40 6.80 6.68 1.76 Ce0.80Gd0.20O2-1 13.89 1.45/0 40 6.97 6.76 3.01 Ce0.95Sm0.05O2-1 16.50 0/0.34 40 7.02 6.82 2.85 Ce0.90Sm0.10O2-1 15.63 0/0.69 40 6.87 6.77 1.45 Ce0.85Sm0.15O2-1 14.76 0/1.04 40 6.91 6.73 2.60 Ce0.80Sm0.20O2-1 13.89 0/1.39 40 6.81 6.64 2.49
aConverted as corresponding nitrates by dissolving in concentrated nitric acid.
Preparation and Characterization of Ceria-Based Electrolytes
568
smaller in size than Ce4+ reduced the lattice constant in the fluorite structure of ceria [18]. Therefore, lattice expansion may result from the larger ionic radius of Gd3+ (1.053 Å) and Sm3+ (1.09 Å) rather than that of Ce4+ (0.97 Å). The crystallite size of the ceria based electrolyte powders was calculated by using the Scherrer’s formula as indicated below [19]. D = 0.90;�cos7 where D is crystallite size in nm, � is the radiation wavelength (for CuK� radiation, � = 1.5418 Å), � is the diffraction peak angle and � is the broadening of the line (“half width”) measured at half its maximum intensity (in radians). The theoretical or X-ray density (in g cm-3) for the ceria electrolyte powders was calculated according to the following formula [20].
Dth = z M/N . V
where Dth (in g cm-3) is theoretical or X-ray density, M (in atomic-weight units) is the mass of atomic ensemble constituting one unit of the chemical formula, z is the number of such chemical units in one unit cell of the crystal, N is the Avagadro’s number and V (in Å3) is the volume of the crystalline unit cell as determined by X-ray diffraction. The crystallographic data derived from the XRD results are presented in Table 2. The density and other crystallographic properties obtained are in accordance with the data reported earlier [9,21]. TGA/DTA Data Figure 2b shows the TGA/DTA pattern obtained on parent
Fig. 2. Characterization curves obtained on parent CeO2 powder (a) XRD pattern obtained on CeO2, (b) TGA/DTA curve obtained on CeO2 (c) FTIR spectrum obtained on CeO2 (d) Particle size distribution curve obtained on CeO2.

Samson Nesaraj et al.
569
Fig. 3. Powder XRD patterns obtained on (a) Ce0.95Gd0.05O2-�, (b) Ce0.90Gd0.10O2-�, (c) Ce0.85Gd0.15O2-�, (d) Ce0.80Gd0.20O2-�, (e) Ce0.95Sm0.05O2-�, (f) Ce0.90Sm0.10O2-�, (g) Ce0.85Gd0.15O2-� and (h) Ce0.80Sm0.20O2-�.

Preparation and Characterization of Ceria-Based Electrolytes
570
CeO2 oxide powder. The TGA/DTA patterns obtained on Gd2O3/Sm2O3 doped CeO2 powders are indicated in Figs. 4a-4h. From these TGA patterns, it is understood that the weight of all the samples rose between 4 to 8% at 1173 K which may be due to the absorption of oxygen of doped/undoped CeO2 based electrolytes during the high temperature treatment in the atmospheric air as reported for ceramic oxides [22]. Also, the weight loss observed in these samples during the heat treatment is due to the loss of oxygen resulting in the formation of oxygen vacancy as reported [22]. The DTA patterns of all the samples revealed that a broad peak is observed for each sample in the range of 500 to 650 K. This behavior may be due to the weight loss/weight gain processes found for each sample at the specific range of temperature mentioned above.
Based on the results of TGA/DTA, it is clear that all ceria-based electrolytes (both CGO and SDC) were found to exhibit absorption of oxygen from air during high temperature treatment. Also, there was no specific correlation between the composition and the observed TGA/DTA patterns for all the ceria-based compositions.
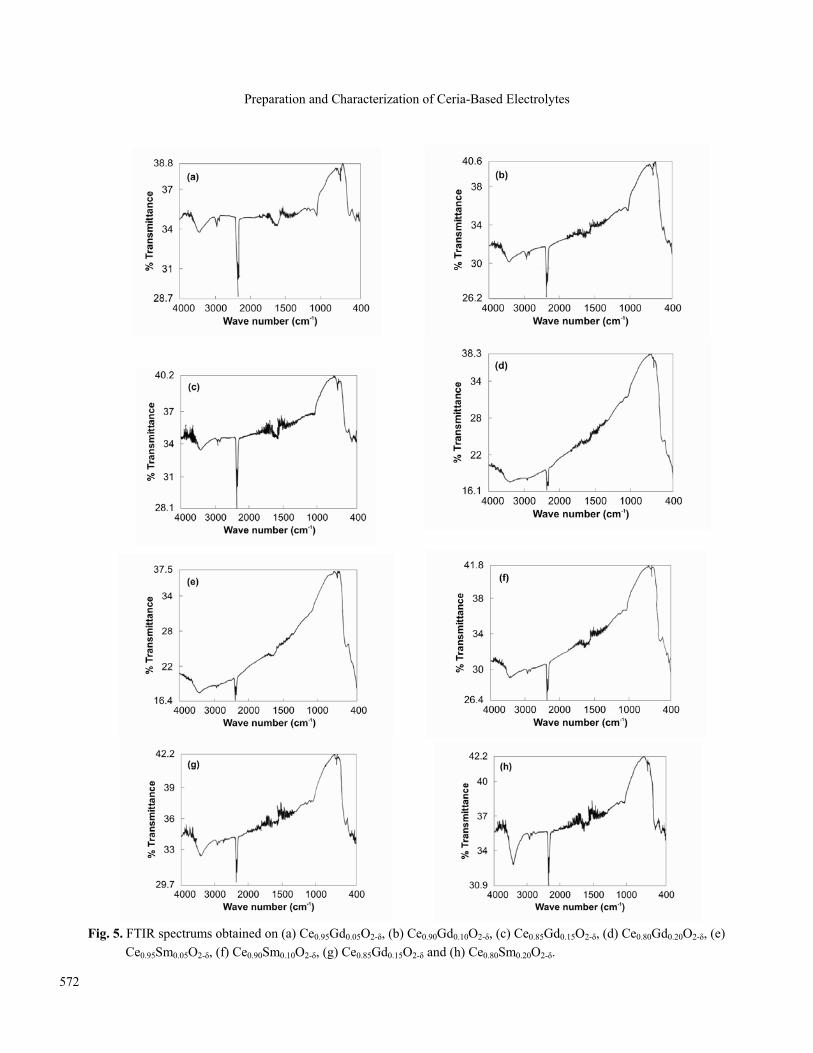
FTIR Data Figure 2c shows the FTIR spectrum obtained on parentCeO2 oxide powder. The FTIR spectrums obtained onGd2O3/Sm2O3 doped with CeO2 powders are indicated in Figs. 5a-5h. From the FTIR spectrums, it is found that all the samples exhibited an absorption band at 668 cm-1 which is the characteristic peak of CeO2 as reported in literature [23-24]. The peak observed at 1600 cm-1 for all the samples is related
Table 2. Crystallographic Properties Obtained on Ceria Based Solid Electrolyte Powders
Properties/powder Crystal structure Unit cell parameter (Å)
Unit cell volume (Å3)
Theoretical X-ray density (g cm-3)
Crystallite size (nm)
CeO2
Ce0.95Gd0.05O2-�
Ce0.90Gd0.10O2-� Ce0.85Gd0.15O2-� Ce0.80Gd0.20O2-� Ce0.95Sm0.05O2-� Ce0.90Sm0.10O2-� Ce0.85Sm0.15O2-� Ce0.80Sm0.20O2-�
Cubic (F.C.)
Cubic (F.C.)
Cubic (F.C.)
Cubic (F.C.)
Cubic (F.C.)
Cubic (F.C.)
Cubic (F.C.)
Cubic (F.C.)
Cubic (F.C.)
5.38554
5.41765
5.39664
5.41931
5.39986
5.41163
5.40063
5.42729
5.41839
156.2024
159.0130
157.1702
159.1592
157.4517
158.4835
157.5191
159.8634
159.0782
7.3179
7.2076
7.3114
7.2391
7.3369
7.2173
7.2662
7.1643
7.2043
10.678
10.666
12.556
10.666
12.556
10.679
14.242
10.666
10.670

Samson Nesaraj et al.
571
Fig. 4. TGA/DTA patterns obtained on (a) Ce0.95Gd0.05O2-�, (b) Ce0.90Gd0.10O2-�, (c) Ce0.85Gd0.15O2-�, (d) Ce0.80Gd0.20O2-�, (e) Ce0.95Sm0.05O2-�, (f) Ce0.90Sm0.10O2-�, (g) Ce0.85Gd0.15O2-� and (h) Ce0.80Sm0.20O2-�.
Preparation and Characterization of Ceria-Based Electrolytes
572
Fig. 5. FTIR spectrums obtained on (a) Ce0.95Gd0.05O2-�, (b) Ce0.90Gd0.10O2-�, (c) Ce0.85Gd0.15O2-�, (d) Ce0.80Gd0.20O2-�, (e) Ce0.95Sm0.05O2-�, (f) Ce0.90Sm0.10O2-�, (g) Ce0.85Gd0.15O2-� and (h) Ce0.80Sm0.20O2-�.

Samson Nesaraj et al.
573
to the H-O-H bend mode which confirms the presence of moisture in the sample [25]. The peak which appeared at 3400 cm-1 for all the samples may be related to the O-H stretching vibration of H2O in the sample [23]. The above information also confirmed the presence of moisture in all the samples. Consequently, the powder with very low particle size and high surface area can absorb moisture [26]. The peak observed at 2340 cm-1 for the samples may be due to the presence of dissolved or atmospheric CO2 in the sample [27]. Thus, CeO2, with very low particle size and high surface area, can absorb the moisture and CO2 which may be available in the atmospheric air [28]. All the Gd2O3/Sm2O3 doped CeO2 samples showed bands similar to that of CeO2 which brought out the structural symmetry of all the samples.
Particle Characteristics Particle size and BET surface area measurements. Figure 2d shows the particle size distribution curve obtained on parent CeO2 oxide powder. The particle size distribution curve obtained on Gd2O3/Sm2O3 doped with CeO2 powders are shown in Figs. 6a-6h. The particle characteristics of the ceria based electrolyte powders are presented in Table 3 where the median particle diameter represents the particle diameter equal to 50% of the cumulative distribution and mean particle diameter represents the arithmetically averaged value of the frequency distribution. The particle size distribution data clearly show that the median particle diameter of all the samples is less than 11 �m and the mean particle diameter is in the range of 10 to 60 �m. The production of the bulk volume of gases (9.85 mol of gases/mol CeO2) during combustion reaction promotes the disintegration of the over-inflated precursor solution yielding particles with lower particle size as reported above [29]. Also, it is found that the median particle diameter values were increased proportionally with an increase in the dopant concentration levels. However, no trend was found in the mean particle diameter values. Normally, the amount of dopant concentration levels will have no effect on the particle size of the powders [30]. Similar effect was observed for BET surface area of the ceria powders, which was in the range 2.1 and 2.4 m2 g-1 for all the compositions. The particle size pattern, observed in higher size region, may be due to the presence of bigger unbroken agglomerates in the powder as reported in literature [31].
Density measurements. The bulk, tap and absolute density values (measured using a pycnometer with xylene liquid) of the partially substituted cerium oxide based electrolyte materials were measured. The bulk, tap density and absolute density values were measured following the procedure already reported [32-33]. The density data for ceria based electrolyte powders are presented in Table 3. It can be seen that the bulk density varied between 0.17 and 0.32 g cm-3, tap density ranged between 0.36 and 0.65 g cm-3 and absolute density ranged between 2.8 to 4.9 g cm-3 for ceria based powders. These specific properties reveal that small particle size, high surface area and low density of ceria based powders are evidences of characteristics known for ceramic oxides synthesized through ignition processes as reported [34].
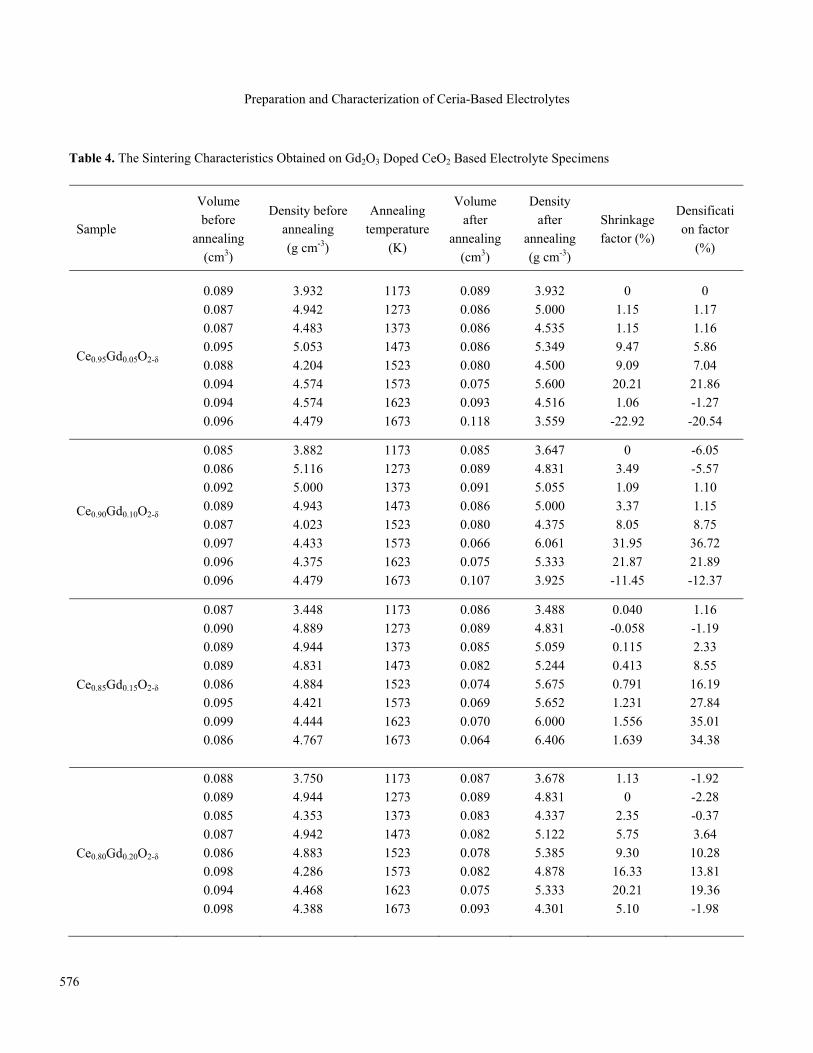
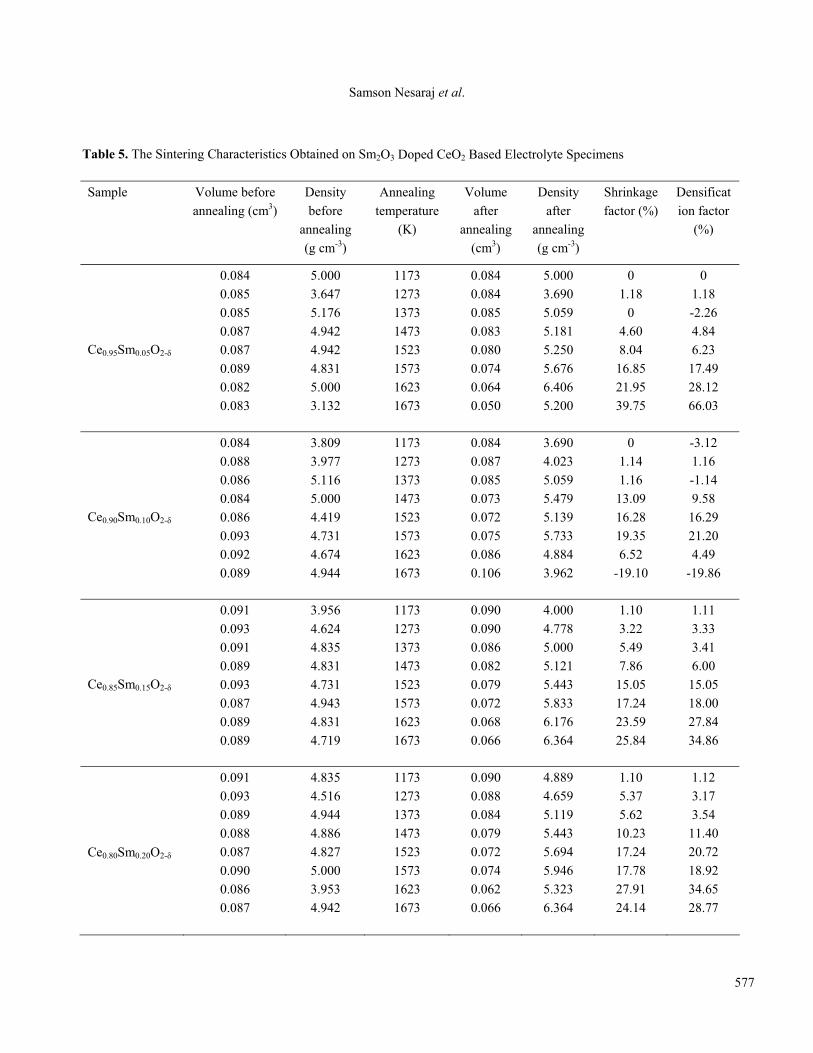
Sintering Characteristics The calcined powders were uniaxially pressed into circular components (10 mm diameter and 1 mm thickness) at a pressure of 625 Mpa in a hydraulic pressing machine. The pressed circular components were subjected to annealing at different temperatures ranging from 1073 to 1673 K with a heating rate of 20 K min-1 in air. The holding time at each temperature was 3 h. The sintered specimens were cooled to room temperature at a cooling rate of 20 K min-1. Prior to sintering and after sintering the volume and density values were measured to assess the powder compaction and sintering behaviour. The sintering data obtained on Gd2O3/Sm2O3 doped CeO2 specimens are presented in Tables 4 and 5. It was found that both the density and volume of the specimens increased gradually with the increase of sintering temperature upto 1573 K. Further increase in temperature beyond 1573 K caused deformation of the shape of pellets resulting in decrease in the density of the specimens, accounting for the densifications and shrinkages carrying negative signs [35]. The percentage realization of sintered density (after sintering at 1573 K for 3 h) to the theoretical density in partially substituted CeO2 based electrolytes is presented in Table 6. To explain the sintering behaviour uniformly for all the specimens, the sintering temperature was considered as 1573 K. The apparent porosity values were also measured for the sintered compacts as a function of sintering temperature by a dioxan adsorption method [36]. The apparent percentage

Preparation and Characterization of Ceria-Based Electrolytes
574
Fig. 6. Particle distribution curves obtained on (a) Ce0.95Gd0.05O2-�, (b) Ce0.90Gd0.10O2-�, (c) Ce0.85Gd0.15O2-�, (d) Ce0.80Gd0.20O2-�, (e) Ce0.95Sm0.05O2-�, (f) Ce0.90Sm0.10O2-�, (g) Ce0.85Gd0.15O2-� and (h) Ce0.80Sm0.20O2-�.

Samson Nesaraj et al.
575
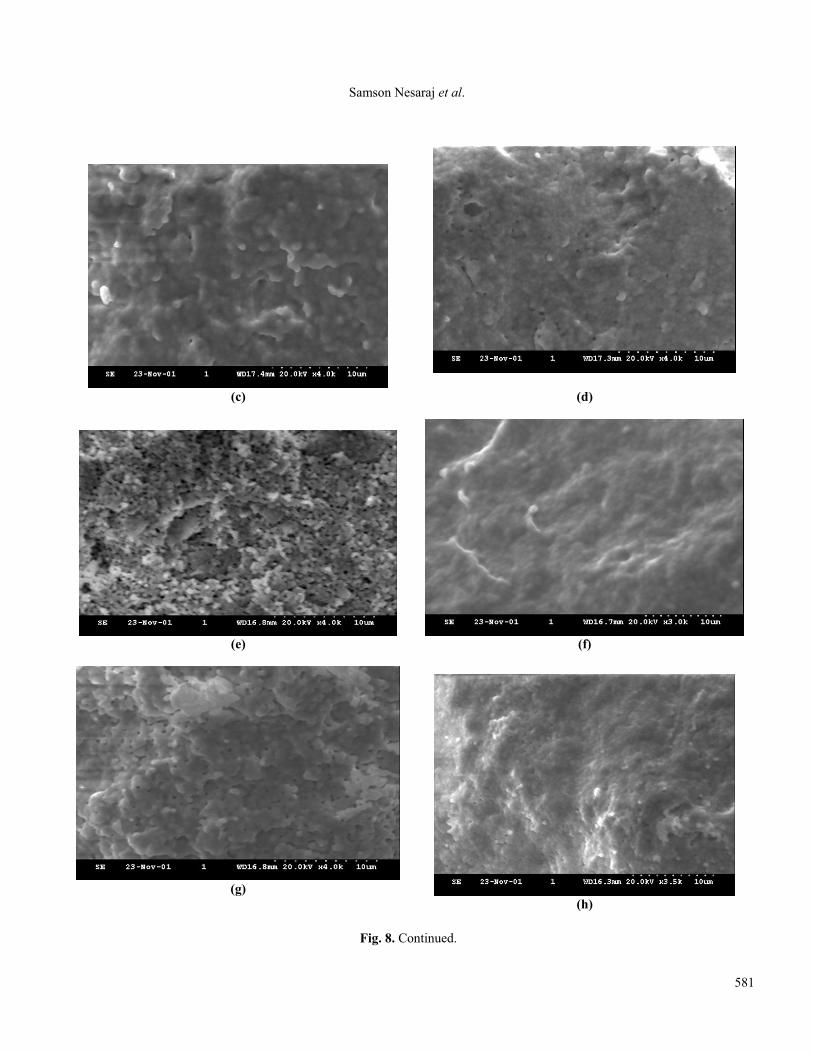
porosity data obtained on Gd2O3/Sm2O3 substituted CeO2 electrolyte specimens with respect to sintering temperature are presented in Tables 7 and 8. From the porosity data, it is clear that the porosity of the specimens decreased with an increase in annealing temperature as reported earlier [37]. The bar chart depicting the sintered density of the doped CeO2 as well as the theoretical density is displayed in Fig. 7. The results show that Ce1-xGdxO2-� and Ce1-xSmxO2-� electrolytes attained 66 to 82% and 78 to 82% of theoretical density respectively after sintering at 1573 K for 3 h. The surface microstructure of the sintered components is presented in Figs. 8a-h. From the SEM studies, one may conclude that the sintered specimens showed some pores. Pore sizes of approximately 2 to 3 μm were observed after sintering. Also, it was found that the grains were arranged uniformly. In addition, it was noticed that the surface was not smooth enough after sintering. Thus, pores found in ceramics can be removed by controlled sintering processes [38]. The sintering data revealed that the two compositions Ce0.90Gd0.10O2-� and Ce0.80Sm0.20O2-� possessed better sintering characteristics (attained > 80% of theoretical density after the sintering process took place at 1573 K for 3 h). It was reported earlier that ceria-based electrolytes partially substituted with 10 mol% of Gd2O3 and 20 mol% of Sm2O3 are known to have superior oxygen-ion conducting properties [7,8]. We found out, however, that highly densified electrolyte could alone be suitable for application in SOFC system [39]. Hence, the
specimens such as Ce0.90Gd0.10O2-� and Ce0.80Sm0.20O2-� were investigated further.
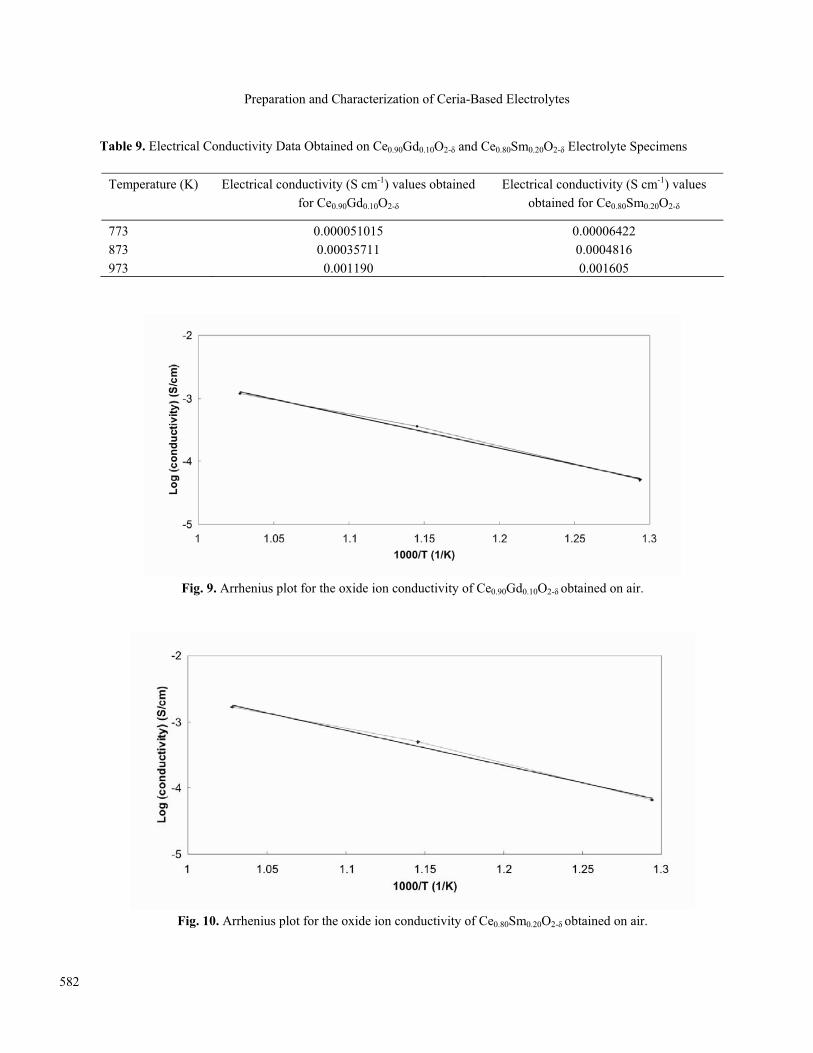
Electrical Conductivity Measurements The electrical conductivity values were calculated based on the impedance measurements carried out for the specimens Ce0.90Gd0.10O2-� and Ce0.80Sm0.20O2-� at different temperatures which are presented in Table 9. The data show that the oxide ion conductivity values were increased gradually with an increase in the temperature and attained the maximum value of 0.001190 S cm-1 and 0.001605 S cm-1, respectively for the specimens Ce0.90Gd0.10O2-� and Ce0.80Sm0.20O2-� at 973 K [40]. The oxide ion conductivity obtained for Ce0.90Gd0.10O2-� specimen at 973 K was considerably low compared with the reported data [41-43]. The ceria-based ceramic comes out as a highly dense specimen (over 98% theoretical density) when sintered at 1773 K [9]. If the grain boundary conductivity is low, it would result in very low total conductivity (10-3 S cm-1) [44]. Moreover, a conductivity of 10-3 S cm-1 was obtained for both specimens (about an order of magnitude lower than expected (10-2 S cm-1)) at high temperatures, which may be due to the lower sinterability of the specimens. The temperature dependence of electrical conductivity can be expressed by the Arrhenius equation, � = A/T exp (-Ea/KT)
Table 3. Particle Characteristics Obtained on CeO2 Based Electrolyte Materials
Sl. No. Sample Median particle diameter
(�m)
Mean particle diameter (�m)
BET surface area (m2 g-1)
Bulk density (g cm-3)
Tap density
(g cm-3)
Absolute density (g cm-3)
1 CeO2 11.06 14.24 2.112 0.223 0.420 3.381 2 Ce0.95Gd0.05O2-1 9.36 10.39 2.183 0.207 0.450 3.625 3 Ce0.90Gd0.10O2-1 8.85 9.79 2.213 0.216 0.490 3.868 4 Ce0.85Gd0.15O2-1 8.68 36.40 2.178 0.175 0.364 2.890 5 Ce0.80Gd0.20O2-1 8.08 51.30 2.321 0.178 0.386 2.916 6 Ce0.95Sm0.05O2-1 10.80 11.89 2.198 0.327 0.654 4.941 7 Ce0.90Sm0.10O2-1 9.04 51.18 2.233 0.204 0.408 3.728 8 Ce0.85Sm0.15O2-1 8.86 41.96 2.328 0.297 0.530 3.668 9 Ce0.80Sm0.20O2-1 9.13 61.21 2.432 0.182 0.413 4.226
Preparation and Characterization of Ceria-Based Electrolytes
576
Table 4. The Sintering Characteristics Obtained on Gd2O3 Doped CeO2 Based Electrolyte Specimens
Sample
Volume before
annealing (cm3)
Density before annealing (g cm-3)
Annealing temperature
(K)
Volume after
annealing (cm3)
Density after
annealing (g cm-3)
Shrinkage factor (%)
Densification factor
(%)
Ce0.95Gd0.05O2-�
0.089 0.087 0.087 0.095 0.088 0.094 0.094 0.096
3.932 4.942 4.483 5.053 4.204 4.574 4.574 4.479
1173 1273 1373 1473 1523 1573 1623 1673
0.089 0.086 0.086 0.086 0.080 0.075 0.093 0.118
3.932 5.000 4.535 5.349 4.500 5.600 4.516 3.559
0 1.15 1.15 9.47 9.09
20.21 1.06
-22.92
0 1.17 1.16 5.86 7.04
21.86 -1.27 -20.54
Ce0.90Gd0.10O2-�
0.085 0.086 0.092 0.089 0.087 0.097 0.096 0.096
3.882 5.116 5.000 4.943 4.023 4.433 4.375 4.479
1173 1273 1373 1473 1523 1573 1623 1673
0.085 0.089 0.091 0.086 0.080 0.066 0.075 0.107
3.647 4.831 5.055 5.000 4.375 6.061 5.333 3.925
0 3.49 1.09 3.37 8.05
31.95 21.87 -11.45
-6.05 -5.57 1.10 1.15 8.75
36.72 21.89 -12.37
Ce0.85Gd0.15O2-�
0.087 0.090 0.089 0.089 0.086 0.095 0.099 0.086
3.448 4.889 4.944 4.831 4.884 4.421 4.444 4.767
1173 1273 1373 1473 1523 1573 1623 1673
0.086 0.089 0.085 0.082 0.074 0.069 0.070 0.064
3.488 4.831 5.059 5.244 5.675 5.652 6.000 6.406
0.040 -0.058 0.115 0.413 0.791 1.231 1.556 1.639
1.16 -1.19 2.33 8.55
16.19 27.84 35.01 34.38
Ce0.80Gd0.20O2-�
0.088 0.089 0.085 0.087 0.086 0.098 0.094 0.098
3.750 4.944 4.353 4.942 4.883 4.286 4.468 4.388
1173 1273 1373 1473 1523 1573 1623 1673
0.087 0.089 0.083 0.082 0.078 0.082 0.075 0.093
3.678 4.831 4.337 5.122 5.385 4.878 5.333 4.301
1.13 0
2.35 5.75 9.30
16.33 20.21 5.10
-1.92 -2.28 -0.37 3.64
10.28 13.81 19.36 -1.98
Samson Nesaraj et al.
577
Table 5. The Sintering Characteristics Obtained on Sm2O3 Doped CeO2 Based Electrolyte Specimens
Sample Volume before annealing (cm3)
Density before
annealing (g cm-3)
Annealing temperature
(K)
Volume after
annealing (cm3)
Density after
annealing (g cm-3)
Shrinkage factor (%)
Densification factor
(%)
Ce0.95Sm0.05O2-�
0.084 0.085 0.085 0.087 0.087 0.089 0.082 0.083
5.000 3.647 5.176 4.942 4.942 4.831 5.000 3.132
1173 1273 1373 1473 1523 1573 1623 1673
0.084 0.084 0.085 0.083 0.080 0.074 0.064 0.050
5.000 3.690 5.059 5.181 5.250 5.676 6.406 5.200
0 1.18
0 4.60 8.04
16.85 21.95 39.75
0 1.18 -2.26 4.84 6.23
17.49 28.12 66.03
Ce0.90Sm0.10O2-�
0.084 0.088 0.086 0.084 0.086 0.093 0.092 0.089
3.809 3.977 5.116 5.000 4.419 4.731 4.674 4.944
1173 1273 1373 1473 1523 1573 1623 1673
0.084 0.087 0.085 0.073 0.072 0.075 0.086 0.106
3.690 4.023 5.059 5.479 5.139 5.733 4.884 3.962
0 1.14 1.16
13.09 16.28 19.35 6.52
-19.10
-3.12 1.16 -1.14 9.58
16.29 21.20 4.49
-19.86
Ce0.85Sm0.15O2-�
0.091 0.093 0.091 0.089 0.093 0.087 0.089 0.089
3.956 4.624 4.835 4.831 4.731 4.943 4.831 4.719
1173 1273 1373 1473 1523 1573 1623 1673
0.090 0.090 0.086 0.082 0.079 0.072 0.068 0.066
4.000 4.778 5.000 5.121 5.443 5.833 6.176 6.364
1.10 3.22 5.49 7.86
15.05 17.24 23.59 25.84
1.11 3.33 3.41 6.00
15.05 18.00 27.84 34.86
Ce0.80Sm0.20O2-�
0.091 0.093 0.089 0.088 0.087 0.090 0.086 0.087
4.835 4.516 4.944 4.886 4.827 5.000 3.953 4.942
1173 1273 1373 1473 1523 1573 1623 1673
0.090 0.088 0.084 0.079 0.072 0.074 0.062 0.066
4.889 4.659 5.119 5.443 5.694 5.946 5.323 6.364
1.10 5.37 5.62
10.23 17.24 17.78 27.91 24.14
1.12 3.17 3.54
11.40 20.72 18.92 34.65 28.77

Preparation and Characterization of Ceria-Based Electrolytes
578
Table 6. The %Realization of Sintered Density (after Sintering at 1573 K for 3 h) with Theoretical Density in Partially Substituted CeO2 Based Electrolyte Materials
Sample Theoretical density
(g cm-3) Sintering
temperature (K)
Sintered density (g cm-3)
%Realization of sintered density with theoretical density
Ce0.95Gd0.05O2-1 7.2076 1573 5.600 77.69 Ce0.90Gd0.10O2-1 7.3114 1573 6.061 82.90 Ce0.85Gd0.15O2-1 7.2391 1573 5.652 78.08 Ce0.80Gd0.20O2-1 7.3369 1573 4.878 66.48 Ce0.95Sm0.05O2-1 7.2173 1573 5.676 78.64 Ce0.90Sm0.10O2-1 7.2662 1573 5.733 78.90 Ce0.85Sm0.15O2-1 7.1643 1573 5.833 81.42 Ce0.80Sm0.20O2-1 7.2043 1573 5.946 82.53
Table 7. The Apparent Percentage Porosity Data Obtained on Gd2O3 Substituted CeO2 Electrolyte Specimens with Respect to Sintering Temperature
Sample Sintering temperature (K) Apparent porosity (%)
Ce0.90Gd0.10O2-�
1173 1273 1373 1523 1573 1623 1673
57.79 34.67 34.35 36.44 26.34
- <1.0
Ce0.90Gd0.10O2-�
1173 1273 1373 1473 1523 1573 1623 1673
22.79 54.26 31.85 44.77 36.48 29.29 12.99 9.04
Ce0.85Gd0.15O2-�
1173 1273 1373 1473 1523 1573 1673
33.73 43.77 34.03 23.67 13.02 <1.0 <1.0
Ce0.80Gd0.20O2-�
1173 1273 1373 1473 1523 1573 1623
44.56 32.83 22.33 23.44 24.74 <1.0 <1.0

Samson Nesaraj et al.
579
The Arrhenius plots obtained for the specimens Ce0.90Gd0.10O2-� and Ce0.80Sm0.20O2-� are shown in Fig. 9 and Fig. 10, respectively. The slope of the log� vs. 1000/T plot gives the activation energy, Ea. The activation energy of Ce0.90Gd0.10O2-� electrolyte specimen was calculated as 1.0263 eV which is higher than (0.78 eV) reported in literature [45-46]. The activation energy for Ce0.80Sm0.20O2-� was 1.04946 eV
which is also higher than the reported value (1.01 eV) for Ce0.80Sm0.20O2-� [47]. The ionic conductivity as well as the activation energy values of Ce0.80Sm0.20O2-� system was found to be higher than that of the Ce0.90Gd0.10O2-� system as reported earlier [48]. By optimising the processing and sintering conditions, it would be possible to increase the grain boundary conductivity so that the conductivity values of doped
Table 8. The Apparent Percentage Porosity Data Obtained on Sm2O3 Substituted CeO2 Electrolyte Specimens with Respect to Sintering Temperature
Sample Sintering temperature (K) Apparent porosity (%)
Ce0.95Sm0.05O2-�
1173 1273 1373 1523 1573 1623 1673
57.79 34.67 34.35 36.44 26.34
- <1.0
Ce0.90Sm0.10O2-�
1173 1273 1373 1523 1573 1623 1673
34.67 44.56 45.42 26.75 13.00 22.52 18.28
Ce0.85Sm0.15O2-�
1173 1373 1473 1523 1573 1623 1673
32.26 33.73 11.77 24.62 <1.0
- <1.0
Ce0.80Sm0.20O2-�
1173 1273 1373 1473 1523 1573 1623 1673
64.52 33.12 46.23 36.62 27.11 13.17 15.54 <1.0

Preparation and Characterization of Ceria-Based Electrolytes
580
Fig. 7. Bar chart depicting percentage realization of sintered density (after sintering at 1573 K for 3 h) of doped ceria based electrolyte specimens with that of their theoretical density values.
(a)
(b)
Fig. 8. SEM photograph obtained on sintered CeO2 specimens (a) Ce0.95Gd0.05O2-�, (b) Ce0.90Gd0.10O2-�, (c) Ce0.85Gd0.15O2-�,
(d) Ce0.80Gd0.20O2-�, (e) Ce0.95Sm0.05O2-�, (f) Ce0.90Sm0.10O2-�, (g) Ce0.85Gd0.15O2-� and (h) Ce0.80Sm0.20O2-�.
Samson Nesaraj et al.
581
(c)
(d)
(e)
(f)
(g)
(h)
Fig. 8. Continued.
Preparation and Characterization of Ceria-Based Electrolytes
582
Table 9. Electrical Conductivity Data Obtained on Ce0.90Gd0.10O2-� and Ce0.80Sm0.20O2-� Electrolyte Specimens
Temperature (K) Electrical conductivity (S cm-1) values obtained for Ce0.90Gd0.10O2-�
Electrical conductivity (S cm-1) values obtained for Ce0.80Sm0.20O2-�
773 873 973
0.000051015 0.00035711
0.001190
0.00006422 0.0004816 0.001605
Fig. 9. Arrhenius plot for the oxide ion conductivity of Ce0.90Gd0.10O2-� obtained on air.
Fig. 10. Arrhenius plot for the oxide ion conductivity of Ce0.80Sm0.20O2-� obtained on air.

Samson Nesaraj et al.
583
ceria based electrolytes would approach the target values of 10-2 S cm-1 at intermediate temperatures [7-8,48-49].
CONCLUSIONS The chemical route (glycine nitrate combustion technique) for the preparation of Ce1-xGdxO2-� (where x = 0, 0.05, 0.10. 0.15 and 0.20) and Ce1-xSmxO2-� (where x = 0, 0.05, 0.10. 0.15 and 0.20) is demonstrated. The sintered (1073 K for 5 h) partially substituted ceria compositions crystallize in cubic (F.C.) fluorite structure. The diffraction patterns of the Gd2O3 and Sm2O3 doped CeO2 (x = 0.05, 0.10, 0.15 and 0.20) are symmetrical to that of CeO2 except for the slight shifts in the diffraction angles. These shifts are due to the complete dissolution of the additives in the fluorite lattice. The TGA/DTA measurements showed that both the CGO and SDC compositions exhibited absorption of oxygen from air. The FTIR spectra of all the Gd2O3/Sm2O3 doped CeO2 (CGO/SDC) samples showed peaks similar to that of CeO2 which exhibited the structural symmetry in the samples. The mean particle diameter for these materials ranged between 8 to 11 �m depending upon the degree of substitution. The BET surface area values ranged between 2.1 and 2.4 m2 g-1. The sintering experiments showed that Ce1-xGdxO2-� may be sintered at 1573 K for 3 h with slow heating/ cooling rate (<5 K min-1) to realize between 66 to 82% of theoretical density, because internal surface cracks appeared when the temperature was raised to beyond 1573 K causing undesirable increase in the volume and decreasing the densification. The Ce1-xSmxO2-� may be sintered at 1573 K for 3 h with slow heating/ cooling rate (<5 K min-1) to realize between 78 to 82% of theoretical density. The apparent porosity (%) values decreased with an increase in the sintering temperature. The Ce0.90Gd0.10O2-� and Ce0.80Sm0.20O2-� show the oxide ion conductivity of 0.001190 and 0.001605 S cm-1, respectively at 973 K in air. Hence, it can be suggested that the specimens have to be densified close to the theoretical density in order to be considered as the candidate electrolytes for ITSOFC systems. This is what we have planned out.
ACKNOWLEDGEMENTS
One of the authors (ASN) thanks Council of Scientific and
Industrial Research (CSIR), Government of India, for awarding Senior Research Fellowship to carry out his Ph.D. research work in Central Electrochemical Research Institute, Karaikudi, India. He also thanks the management of Karunya University for promoting high temperature fuel cell research activity at Karunya University. REFERENCES
[1] A. Tsoga, A. Gupta, A. Naoumidis, P. Nikolopoulos, Acta Mater. 48 (2000) 4709.
[2] Z. Zhan, T.-L. Wen, H. Tu, Z.-Y. Lu, J. Electrochem. Soc. 148 (2001) A 427.
[3] H. Yoshida, K. Miura, J.-I. Fujita, T. Inagaki, J. Am. Ceram. Soc. 82 (1999) 219.
[4] B.C.H. Steele, in: U. Bossel (Ed.), Proc. of the 1st European SOFC Forum, European SOFC Forum, Lucerne, 1994, pp. 375.
[5] D. Rajiv, L. Richards Von, J.D. Carter, W. Xiaoping, K. Michael, J. Electrochem. Soc. 146 (1999) 1273.
[6] J.P.P. Huijsmans, F.P.F. Van Berkel, G.M. Christie, J. Power Sources 71 (1998) 107.
[7] C. Milliken, S. Guruswamy, A. Khandkar, J. Electrochem. Soc. 146 (1999) 872.
[8] J.A. Livermore Stephanie, W. Cotton John, R. Mark Ormerod, J. Power Sources 86 (2000) 411.
[9] Y. Gu, G. Li, G. Meng, D. Peng, Mater. Res. Bull. 35 (2000) 297.
[10] N.M. Sammes, Z. Cai, Solid State Ionics 100 (1997) 39. [11] W. Huang, P. Shuk, M. Greenblatt, Solid State Ionics
100 (1997) 23. [12] S.R. Jain, K.C. Adiga, Combustion and Flame 40
(1981) 71. [13] R.D. Purohit, B.P. Sharma, K.T. Pillai, A.K. Tyagi,
Mat. Res. Bull. 36 (2001) 2711. [14] J.J. Kingsley, K. Suresh, K.C. Patil, J. Mater. Sci. 25
(1990) 1305. [15] K. Boopathy, A. Samson Nesaraj, V. Rajendran, Bull.
Mater. Sci. 31 (2008) 149. [16] H. Yahiro, K. Eguchi, H. Arai, Solid State Ionics 21
(1986) 37. [17] K. Higashi, K. Sonoda, H. Ono, S. Sameshima, Y.
Hirata, J. Mater. Res. 14 (1999) 957.

Preparation and Characterization of Ceria-Based Electrolytes
584
[18] H. Yahiro, K. Eguchi, H. Arai, Solid State Ionics 36
(1988) 71. [19] M.D. Shaji Kumar, T.M. Srinivasan, P. Ramasamy, C.
Subramanian, Mater. Lett. 25 (1994) 171. [20] G.C. Kostogloudis, N. Vasilakos, C. Ftikos, J. Euro.
Ceram. Soc. 17 (1997) 1513. [21] R. Maric, T. Fukui, S. Ohara, H. Yoshida, M.
Nishimura, T. Inagaki, K. Miura, J. Mater. Sci. 35 (2000) 1397.
[22] T. Tsuchida, T. Kan, J. Euro. Ceram. Soc. 21 (2001) 555.
[23] J. Gao, F. Guan, Y. Ma, W. Yang, J. Kang, H. Deng, Y. Qi, Rare Metals 20 (2001) 217.
[24] W. Chengyun, Q. Yitai, X. Yi, Z. Guiwen, W. Changsui, Y. Li, Mater. Sci. Eng. B 39 (1996) 160.
[25] E. Mendelovici, R. Villalba, A. Sagarzazu, Mat. Res. Bull. 29 (1994) 167.
[26] A. Salak, M. Selecka, H. Danninger, Machinability of Powder Metallurgy Steels, Cambridge International Science Publishing, 2005, pp.240.
[27] A. Cuneyt Tas, J. Majewski Peter, A. Fritz, J. Am. Ceram. Soc. 83 (2000) 2954.
[28] D.-H. Kim, H.-G. Kang, S.-K. Kim, U. Paik, J.-G. Park, Jpn. J. Appl. Phys. 45 (2006) 4893.
[29] M. Maria Amala Sekar, S. Sundar Manoharan, K.C. Patil, J. Mater. Science Lett. 9 (1990) 1205.
[30] S.C. Sharma, N.M. Gokhale, R. Dayal, R. Lal, Bull. Mater. Sci. 25 (2002) 15.
[31] L.F.C.P. Lima, A.L.E. Godoy, E.N.S. Muccillo, Mater. Lett. 58 (2004) 172.
[32] A. Venkatraman, A. Hiremath Vijay, S.K. Date, S.D. Kulkarni, Bull. Mater. Sci. 24 (2001) 617.
[33] A. Kumar Sinha, P. Metallurgy, Dhanpat Rai & Sons, New Delhi, 1976, pp. 33.
[34] M.A. Butler, P.F. James, J.D. Jackson, J. Mater. Sci. 31 (1996) 1675.
[35] W. Luan, L. Gao, J. Guo, Ceramics International 25 (1999) 727.
[36] P.C. Warrier, in: R. Gangadharan (Ed.), Refresher
Course on Storage Batteries, CECRI, Karaikudi, India, 1997, pp. 16.1.
[37] M.M. Hasan, A.S.M.A. Haseeb, R. Saidur, H.H. Masjuki, Proc. World Academy of Science, Engineering and Technology 30 (2008) 221.
[38] L. Coble Robert, C. Klemings Merton, Metallurgical Mater. Trans. 2 (1971) 409.
[39] R. Dayal, N.M. Gohale, S.C. Sharma, R. Lal, Trans. Ind. Ceram. Soc. 48 (1989) 58.
[40] A. Samson Nesaraj, I. Arul Raj, R. Pattabiraman, Ind. J. Chem. Tech. 14 (2007) 154.
[41] H.L. Tuller, A.S. Nowick, J. Electrochem. Soc. 122 (1975) 255.
[42] M. Godickemeiner, K. Sasaki, L.J. Gauckler, in: M. Dokiya, O. Yamamoto, H. Tagawa, S.C. Singhal (Eds.), Proc. Fourth International Symposium on Solid Oxide Fuel Cells(SOFC-IV), The Electrochemical Soc. Inc. NJ, 1995, pp. 1072.
[43] M. Sahibsada, R.A. Rudkin, B.C.H. Steele, I.S. Metcalfe, J.A. Kilner, in: U. Stimming, S.C. Singhal, H. Tagawa, W. Lehner (Eds.), Proc. Fifth International Symposium on Solid Oxide Fuel Cells(SOFC-V), The Electrochemical Soc. Inc., NJ, 1997, pp.244.
[44] B.C.H. Steele, K. Zhang, R.A. Rudkin, N. Kiratzis, M. Christie, in: M. Dokiya, O. Yamamoto, H. Tagawa, S.C. Singhal (Eds.), Proc. Fourth International Symposium on Solid Oxide Fuel Cells(SOFC-IV), The Electrochemical Soc. Inc. NJ, 1995, pp. 1028.
[45] J.R. Jurado, J. Mat. Sci. 36 (2001) 1133. [46] T. Ishihara, K. Sato, Y. Takita, J. Am. Ceram. Soc. 79
(1996) 913. [47] H. Yahiro, Y. Eguchi, K. Eguchi, H. Arai, J. Appl.
Electrochem. 18 (1988) 527. [48] K. Eguchi, T. Setoguchi, T. Inoue, H. Arai, Solid State
Ionics 52 (1992) 165. [49] T. Inoue, T. Setoguchi, K. Eguchi, H. Arai, Solid State
Ionics 35 (1989) 285.