preparation of semi-conducting polymer colloids in … report... · preparation of semi-conducting...
TRANSCRIPT
Preparation of semi-conducting polymer colloids in aqueous dispersion for electrically active coatings
University of Massachusetts Lowell
Toxics Use Reduction Institute
Academic Research Program
Technical Report No. 75 July 2013
University of Massachusetts Lowell
Preparation of Semi-conducting Polymer Colloids in Aqueous Dispersion for Electrically Active Coatings
Bin Tan, Maria Francisca Palacios, and Assistant Professor Margaret Sobkowicz-Kline
Department of Plastics Engineering University of Massachusetts Lowell
The Toxics Use Reduction Institute Academic Research Program
Project Manager: Pam Eliason
June 2013
All rights to this report belong to the Toxics Use Reduction Institute. The material may be duplicated with permission by contacting the Institute.
The Toxics Use Reduction Institute is a multi-disciplinary research, education, and policy center established by the Massachusetts Toxics Use Reduction Act of 1989. The Institute sponsors and conducts research, organizes education and training
programs, and provides technical support to promote the reduction in the use of toxic chemicals or the generation of toxic chemical byproducts in industry and commerce. Further information can be obtained by writing the Toxics Use Reduction Institute, University of Massachusetts Lowell, 600 Suffolk Street, Suite 501 Wannalancit Mills, Lowell, MA 01854
©Toxics Use Reduction Institute, University of Massachusetts Lowell
Academic Research Program The Academic Research program is a project of the Toxics Use Reduction Institute (TURI). The program connects the research capabilities of the University of Massachusetts with the emerging needs of Massachusetts manufacturers and the Commonwealth, to advance the investigation, development and evaluation of sustainable technologies that are environmentally, occupationally and economically sound. The program provides research funding to UMass faculty from all campuses, annually, on a competitive basis and encourages faculty/industry partnerships and cross-campus collaboration. Industry partners provide guidance, propose applications for new technologies and, in some cases, evaluate and/or adopt processes and technologies resulting from research. Past projects supported by this program have focused on finding alternatives to the use of toxic chemicals in various plastics applications. These projects are described in more detail on TURI’s website (www.turi.org and click on Research, Academic Research Program).
Notice: This report has been reviewed by the Institute and approved for publication. Approval does not signify that the contents necessarily reflect the views and policies of the Toxics Use Reduction Institute, nor does the mention of trade names or commercial products constitute endorsement or recommendation for use.
1
Contents
ABSTRACT ................................................................................................................................................ i
1. INTRODUCTION ................................................................................................................................... 1
2. EXPERIMENTAL METHODS ................................................................................................................... 2
2.1 Materials ....................................................................................................................................... 2
2.2 Preparation of P3HT colloidal dispersions ...................................................................................... 2
2.3 Characterization of colloids and films ............................................................................................. 3
3. RESULTS AND DISCUSSION ................................................................................................................... 3
3.1 Particle Size of P3HT Colloids ......................................................................................................... 3
3.2 Film Thickness and Morphology of Films Coated from Colloids ....................................................... 8
3.3 Crystal Structure of Films ............................................................................................................... 9
3.4 UV-visible Absorbance Properties ................................................................................................ 16
3.5 Properties of Films Coated from P3HT Colloids............................................................................. 18
3.5.1 UV-visible spectroscopy properties of films ........................................................................... 19
3.5.2 WAXD curves of films ............................................................................................................ 24
4. CONCLUSION ..................................................................................................................................... 27
REFERENCE ............................................................................................................................................ 28
i
ABSTRACT
This report outlines the characterization of poly(3-hexylthiophene) (P3HT) colloids dispersed in aqueous solutions created using a mini-emulsion technique. These colloidal dispersions could be used for coating process to manufacture active layers for electrical devices. Contrast to its counterpart of P3HT solution directly dissolved in organic solvents, these colloidal dispersions are totally environmentally friendly, as only water vapor released into the atmosphere during the coating process of colloidal dispersion, whereas, toxic solvent released into the atmosphere during the coating process of P3HT solution. Subsequently, a blade coating procedure was used to produce films from these colloidal dispersions with varying processing parameters, and the crystallinity development as well as optical absorbance properties of the films coated from these colloids was investigated. The results showed that these colloids were stable for several weeks against aggregation and the size and distribution of these colloids could be tuned by controlling the initial solution concentration and surfactants as well as processing parameters. Additionally, coating parameters such as blade speed and height as well as surface energy have influence on the final properties of films.
1
1. INTRODUCTION
Semiconducting polymers such as poly(3-hexylthiophene) (P3HT) have many potential applications in the field of organic semiconductors including use in solar cells, field-effect transistors and organic light-emitting diodes. This is associated with their beneficial properties such as light weight, flexibility, low-cost solution processing, inexpensive materials and versatile fabrication [1-5]. For this reason, a great deal of research on semiconducting polymer materials has been carried out, particularly on the optical and electronic properties of semiconducting polymers and the electronic devices in which they are used [6, 7]. However, in-depth study of the processing techniques associated with creating these semiconductors has lagged behind.
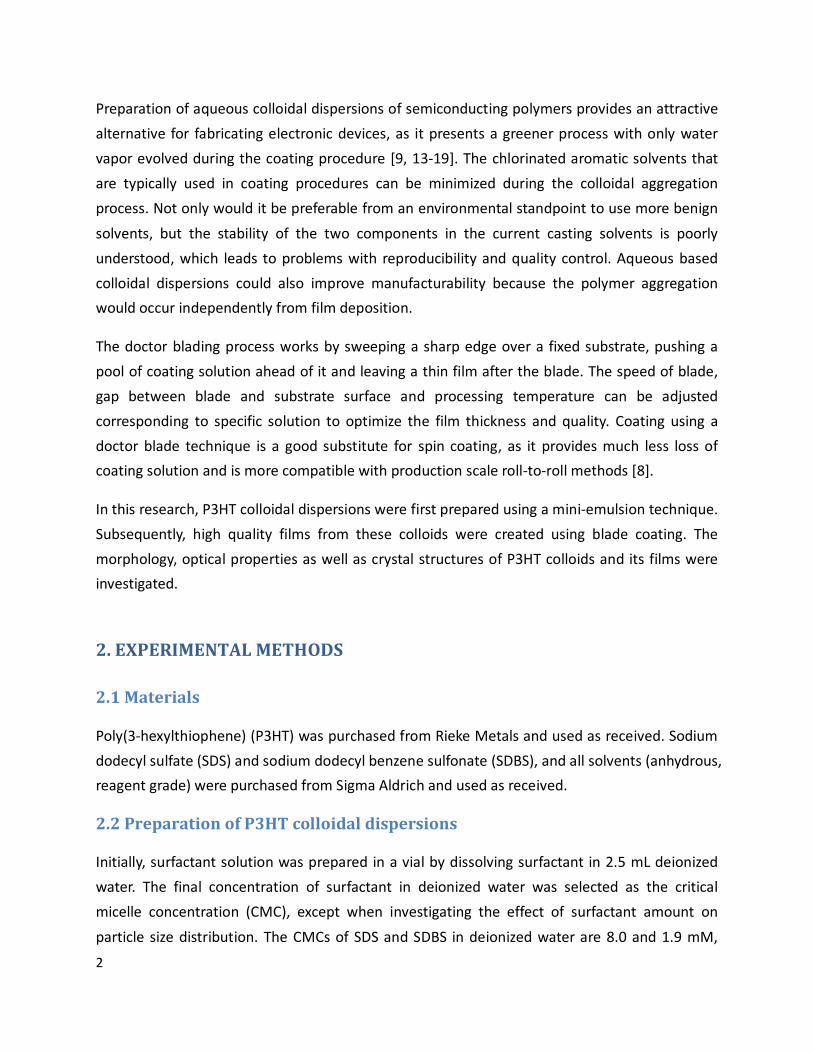
Currently, the most widely used method to produce high performance electronic devices from semiconducting polymers is solution processing using a spin coating technique [8-11]. One clear disadvantage of this method is the volatilization of the toxic organic solvents such as toluene, chlorobenzene and chloroform that are commonly used. The health and safety profiles of the most commonly used solvents are listed in Table 1, along with a common surfactant, sodium dodecyl sulfate (SDS) which is utilized in the dispersion processing method presented here. This research looks at the possibility of using small amounts of SDS in water rather than any of the organic solvents for the processing of semiconducting polymers. The second disadvantage of the common processing technique, spin coating, is that this batch process typically results in significant materials waste and is incompatible with scale up to roll-to-roll methods for industrial applications [8, 12]. Finally, the electronic properties of conjugated polymers rely on the crystallization and nanoscale morphology of the film. The kinetics of drying when casting from organic solvents may not match well with the kinetics of morphology development, leading to non-ideal film morphologies.
Table 1. Health and safety data for commonly used solvents in polymer electronics.
Chemical NFPA Designations Water solubility
OSHA PEL
NIOSH IDHL
LD50 Oral2
Flammability Health Reactivity [g/L] [ppm] [ppm] [mg/kg] Toluene 3 2 0 0.5 g/L 200 500 5580 Chlorobenzene 3 3 0 0.2 g/L 75 1000 1110 Chloroform 2 0 0 8 g/L 50 500 695 SDS 2 0 0 100 g/L -- -- 1288
2
Preparation of aqueous colloidal dispersions of semiconducting polymers provides an attractive alternative for fabricating electronic devices, as it presents a greener process with only water vapor evolved during the coating procedure [9, 13-19]. The chlorinated aromatic solvents that are typically used in coating procedures can be minimized during the colloidal aggregation process. Not only would it be preferable from an environmental standpoint to use more benign
solvents, but the stability of the two components in the current casting solvents is poorly understood, which leads to problems with reproducibility and quality control. Aqueous based colloidal dispersions could also improve manufacturability because the polymer aggregation would occur independently from film deposition.
The doctor blading process works by sweeping a sharp edge over a fixed substrate, pushing a pool of coating solution ahead of it and leaving a thin film after the blade. The speed of blade, gap between blade and substrate surface and processing temperature can be adjusted corresponding to specific solution to optimize the film thickness and quality. Coating using a doctor blade technique is a good substitute for spin coating, as it provides much less loss of coating solution and is more compatible with production scale roll-to-roll methods [8].
In this research, P3HT colloidal dispersions were first prepared using a mini-emulsion technique. Subsequently, high quality films from these colloids were created using blade coating. The morphology, optical properties as well as crystal structures of P3HT colloids and its films were investigated.
2. EXPERIMENTAL METHODS
2.1 Materials
Poly(3-hexylthiophene) (P3HT) was purchased from Rieke Metals and used as received. Sodium dodecyl sulfate (SDS) and sodium dodecyl benzene sulfonate (SDBS), and all solvents (anhydrous, reagent grade) were purchased from Sigma Aldrich and used as received.
2.2 Preparation of P3HT colloidal dispersions
Initially, surfactant solution was prepared in a vial by dissolving surfactant in 2.5 mL deionized water. The final concentration of surfactant in deionized water was selected as the critical micelle concentration (CMC), except when investigating the effect of surfactant amount on particle size distribution. The CMCs of SDS and SDBS in deionized water are 8.0 and 1.9 mM,
3
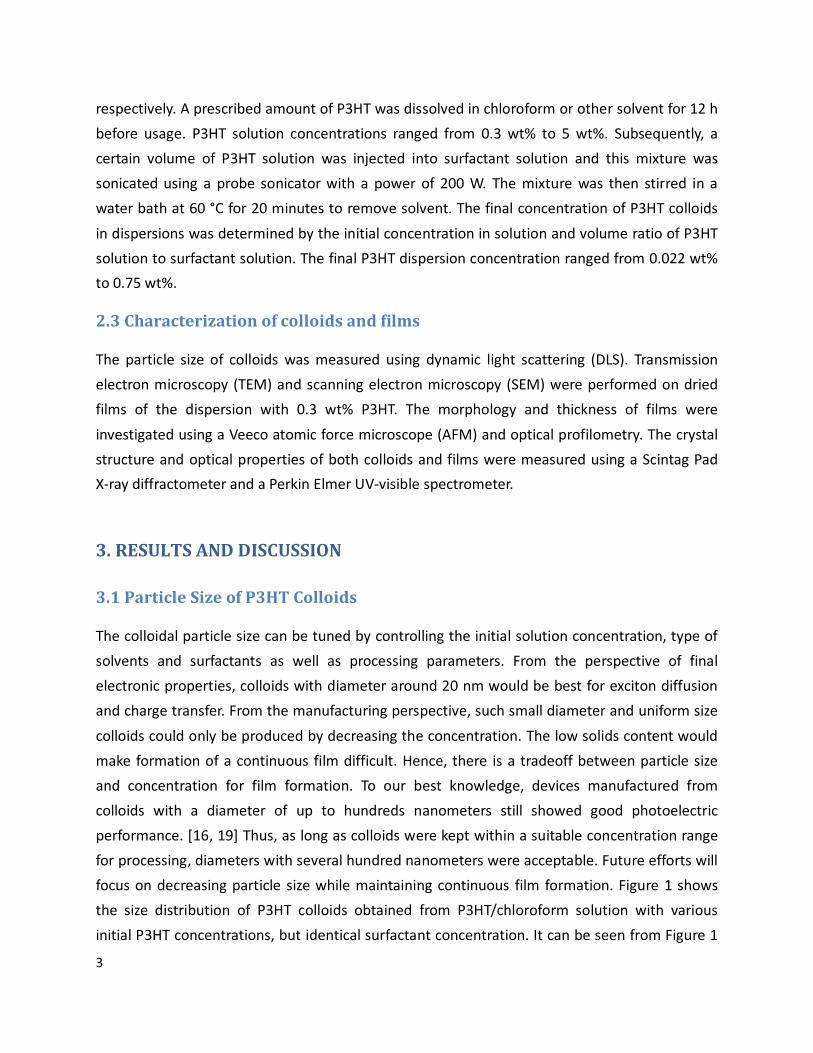
respectively. A prescribed amount of P3HT was dissolved in chloroform or other solvent for 12 h before usage. P3HT solution concentrations ranged from 0.3 wt% to 5 wt%. Subsequently, a certain volume of P3HT solution was injected into surfactant solution and this mixture was sonicated using a probe sonicator with a power of 200 W. The mixture was then stirred in a water bath at 60 °C for 20 minutes to remove solvent. The final concentration of P3HT colloids
in dispersions was determined by the initial concentration in solution and volume ratio of P3HT solution to surfactant solution. The final P3HT dispersion concentration ranged from 0.022 wt% to 0.75 wt%.
2.3 Characterization of colloids and films
The particle size of colloids was measured using dynamic light scattering (DLS). Transmission electron microscopy (TEM) and scanning electron microscopy (SEM) were performed on dried films of the dispersion with 0.3 wt% P3HT. The morphology and thickness of films were investigated using a Veeco atomic force microscope (AFM) and optical profilometry. The crystal structure and optical properties of both colloids and films were measured using a Scintag Pad X-ray diffractometer and a Perkin Elmer UV-visible spectrometer.
3. RESULTS AND DISCUSSION
3.1 Particle Size of P3HT Colloids
The colloidal particle size can be tuned by controlling the initial solution concentration, type of solvents and surfactants as well as processing parameters. From the perspective of final electronic properties, colloids with diameter around 20 nm would be best for exciton diffusion and charge transfer. From the manufacturing perspective, such small diameter and uniform size
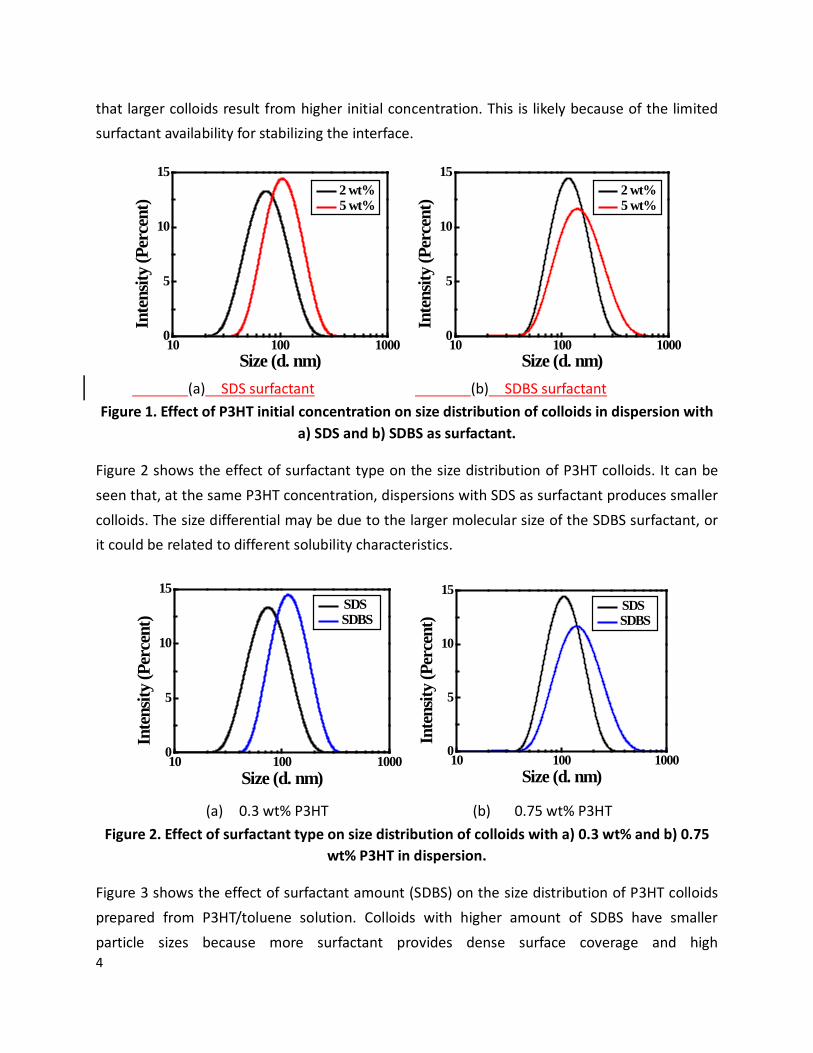
colloids could only be produced by decreasing the concentration. The low solids content would make formation of a continuous film difficult. Hence, there is a tradeoff between particle size and concentration for film formation. To our best knowledge, devices manufactured from colloids with a diameter of up to hundreds nanometers still showed good photoelectric performance. [16, 19] Thus, as long as colloids were kept within a suitable concentration range for processing, diameters with several hundred nanometers were acceptable. Future efforts will focus on decreasing particle size while maintaining continuous film formation. Figure 1 shows the size distribution of P3HT colloids obtained from P3HT/chloroform solution with various initial P3HT concentrations, but identical surfactant concentration. It can be seen from Figure 1
4
that larger colloids result from higher initial concentration. This is likely because of the limited surfactant availability for stabilizing the interface.
10 100 10000
5
10
15
Inte
nsity
(Per
cent
)
Size (d. nm)
2 wt% 5 wt%
10 100 1000
0
5
10
15
Inte
nsity
(Per
cent
)
Size (d. nm)
2 wt% 5 wt%
(a) SDS surfactant (b) SDBS surfactant
Figure 1. Effect of P3HT initial concentration on size distribution of colloids in dispersion with a) SDS and b) SDBS as surfactant.
Figure 2 shows the effect of surfactant type on the size distribution of P3HT colloids. It can be seen that, at the same P3HT concentration, dispersions with SDS as surfactant produces smaller colloids. The size differential may be due to the larger molecular size of the SDBS surfactant, or it could be related to different solubility characteristics.
10 100 10000
5
10
15
Inte
nsity
(Per
cent
)
Size (d. nm)
SDS SDBS
10 100 1000
0
5
10
15
Inte
nsity
(Per
cent
)
Size (d. nm)
SDS SDBS
(a) 0.3 wt% P3HT (b) 0.75 wt% P3HT Figure 2. Effect of surfactant type on size distribution of colloids with a) 0.3 wt% and b) 0.75
wt% P3HT in dispersion.
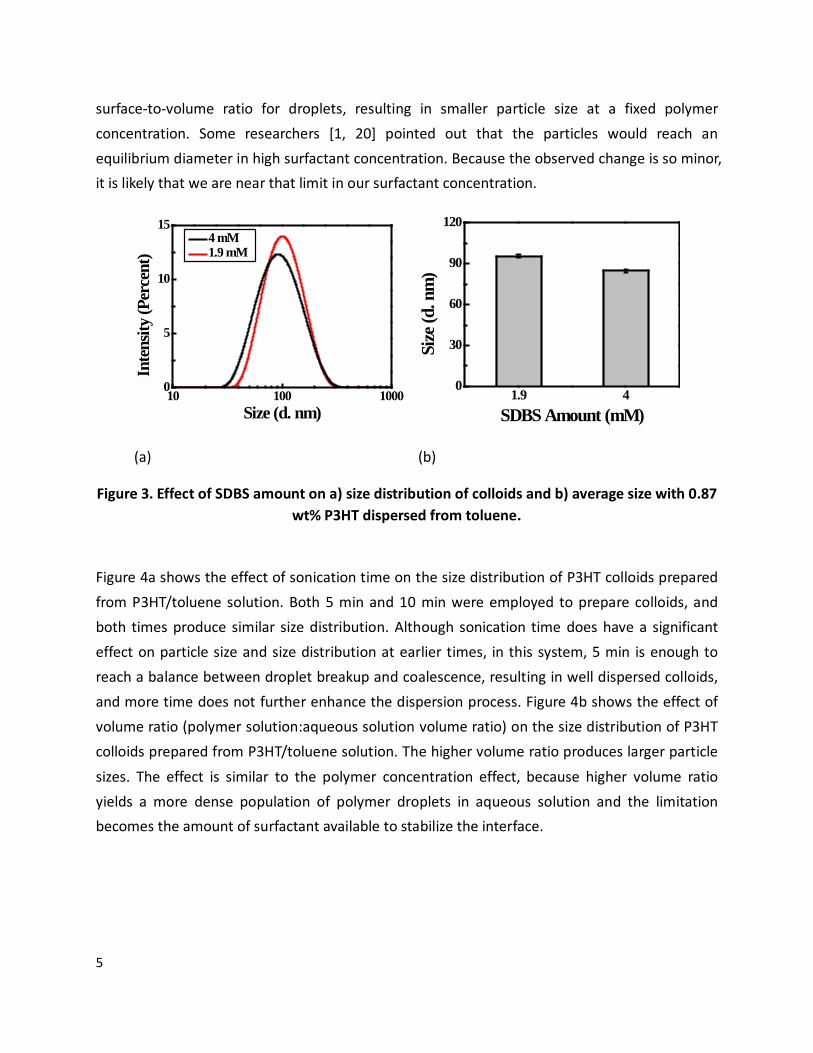
Figure 3 shows the effect of surfactant amount (SDBS) on the size distribution of P3HT colloids prepared from P3HT/toluene solution. Colloids with higher amount of SDBS have smaller particle sizes because more surfactant provides dense surface coverage and high
5
surface-to-volume ratio for droplets, resulting in smaller particle size at a fixed polymer concentration. Some researchers [1, 20] pointed out that the particles would reach an equilibrium diameter in high surfactant concentration. Because the observed change is so minor, it is likely that we are near that limit in our surfactant concentration.
10 100 10000
5
10
15 4 mM 1.9 mM
Inte
nsity
(Per
cent
)
Size (d. nm)
1.9 4
0
30
60
90
120
Size
(d. n
m)
SDBS Amount (mM)
(a) (b)
Figure 3. Effect of SDBS amount on a) size distribution of colloids and b) average size with 0.87 wt% P3HT dispersed from toluene.
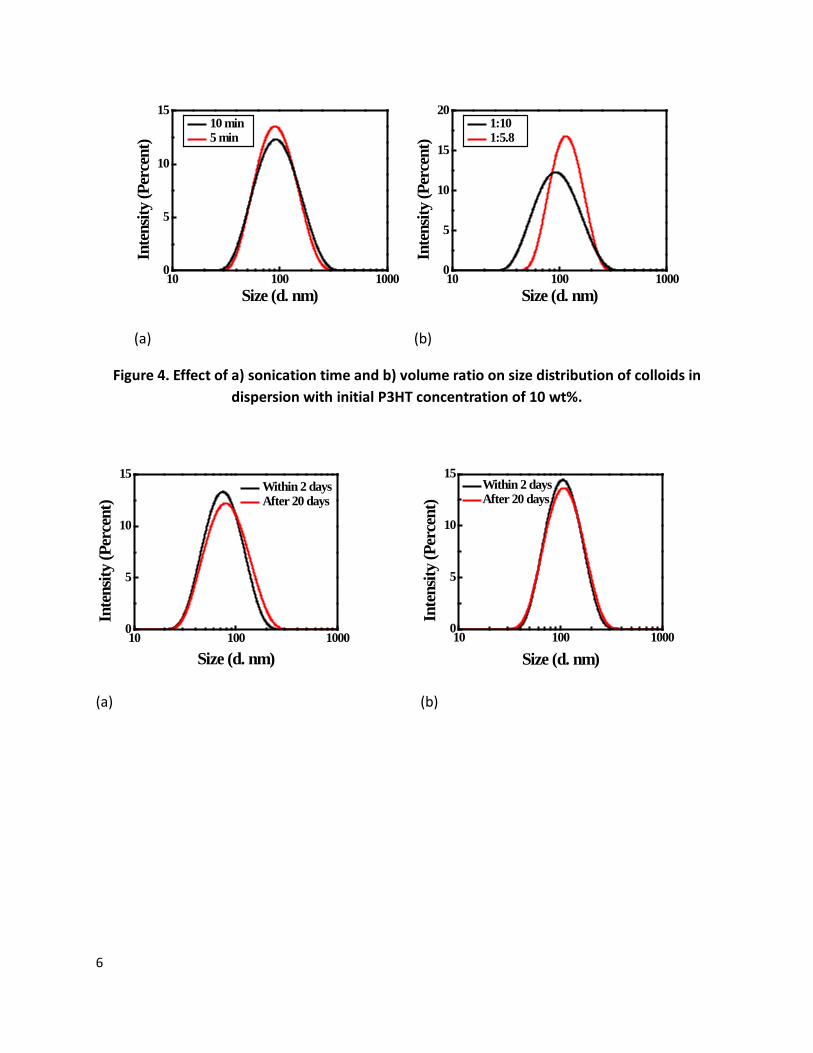
Figure 4a shows the effect of sonication time on the size distribution of P3HT colloids prepared from P3HT/toluene solution. Both 5 min and 10 min were employed to prepare colloids, and both times produce similar size distribution. Although sonication time does have a significant effect on particle size and size distribution at earlier times, in this system, 5 min is enough to reach a balance between droplet breakup and coalescence, resulting in well dispersed colloids, and more time does not further enhance the dispersion process. Figure 4b shows the effect of volume ratio (polymer solution:aqueous solution volume ratio) on the size distribution of P3HT colloids prepared from P3HT/toluene solution. The higher volume ratio produces larger particle
sizes. The effect is similar to the polymer concentration effect, because higher volume ratio yields a more dense population of polymer droplets in aqueous solution and the limitation becomes the amount of surfactant available to stabilize the interface.
6
10 100 10000
5
10
15 10 min 5 min
Inte
nsity
(Per
cent
)
Size (d. nm)
10 100 1000
0
5
10
15
20 1:10 1:5.8
Inte
nsity
(Per
cent
)
Size (d. nm)
(a) (b)
Figure 4. Effect of a) sonication time and b) volume ratio on size distribution of colloids in dispersion with initial P3HT concentration of 10 wt%.
10 100 10000
5
10
15
Inte
nsity
(Per
cent
)
Size (d. nm)
Within 2 days After 20 days
10 100 10000
5
10
15
Inte
nsity
(Per
cent
)
Size (d. nm)
Within 2 days After 20 days
(a) (b)
7
10 100 10000
5
10
15
Inte
nsity
(Per
cent
)
Size (d. nm)
Within 2 days After 20 days
10 100 10000
5
10
15
Inte
nsity
(Per
cent
)
Size (d. nm)
Within 2 days After 20 days
(c) (d)
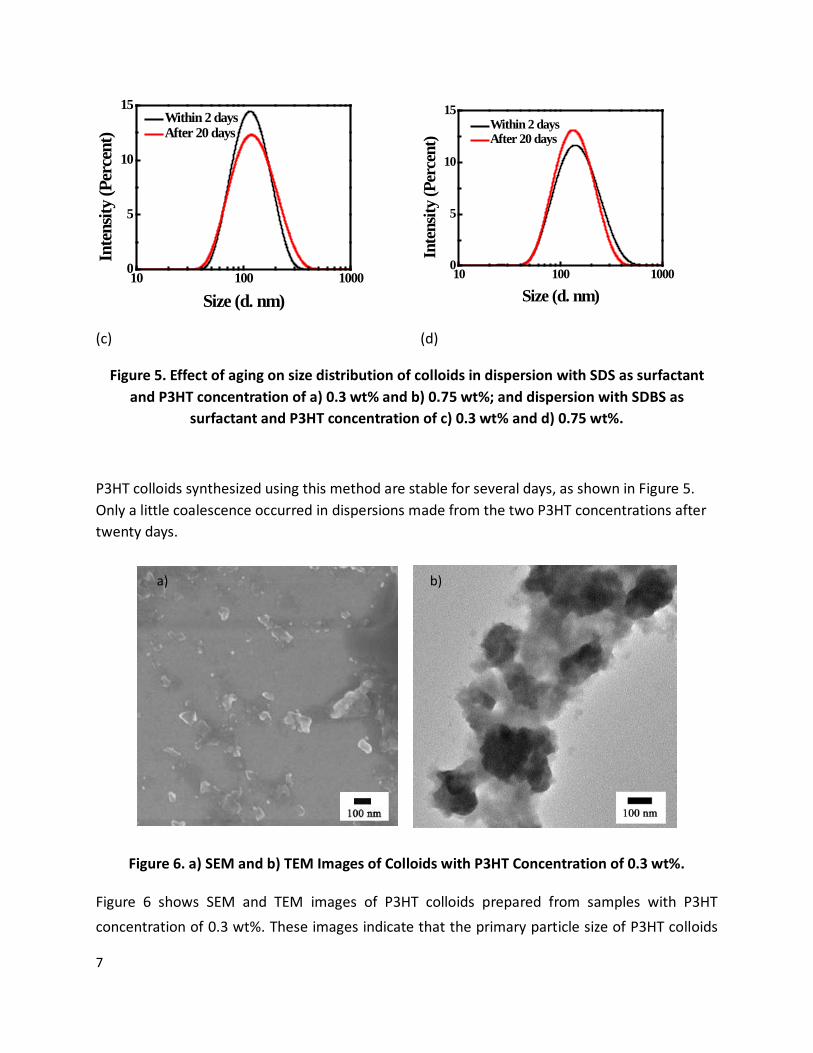
Figure 5. Effect of aging on size distribution of colloids in dispersion with SDS as surfactant and P3HT concentration of a) 0.3 wt% and b) 0.75 wt%; and dispersion with SDBS as
surfactant and P3HT concentration of c) 0.3 wt% and d) 0.75 wt%.
P3HT colloids synthesized using this method are stable for several days, as shown in Figure 5. Only a little coalescence occurred in dispersions made from the two P3HT concentrations after twenty days.
Figure 6. a) SEM and b) TEM Images of Colloids with P3HT Concentration of 0.3 wt%.
Figure 6 shows SEM and TEM images of P3HT colloids prepared from samples with P3HT concentration of 0.3 wt%. These images indicate that the primary particle size of P3HT colloids
a) b)
8
is approximately 100 nm and that, once dried, excess surfactant creates a network that binds particles together.
3.2 Film Thickness and Morphology of Films Coated from Colloids
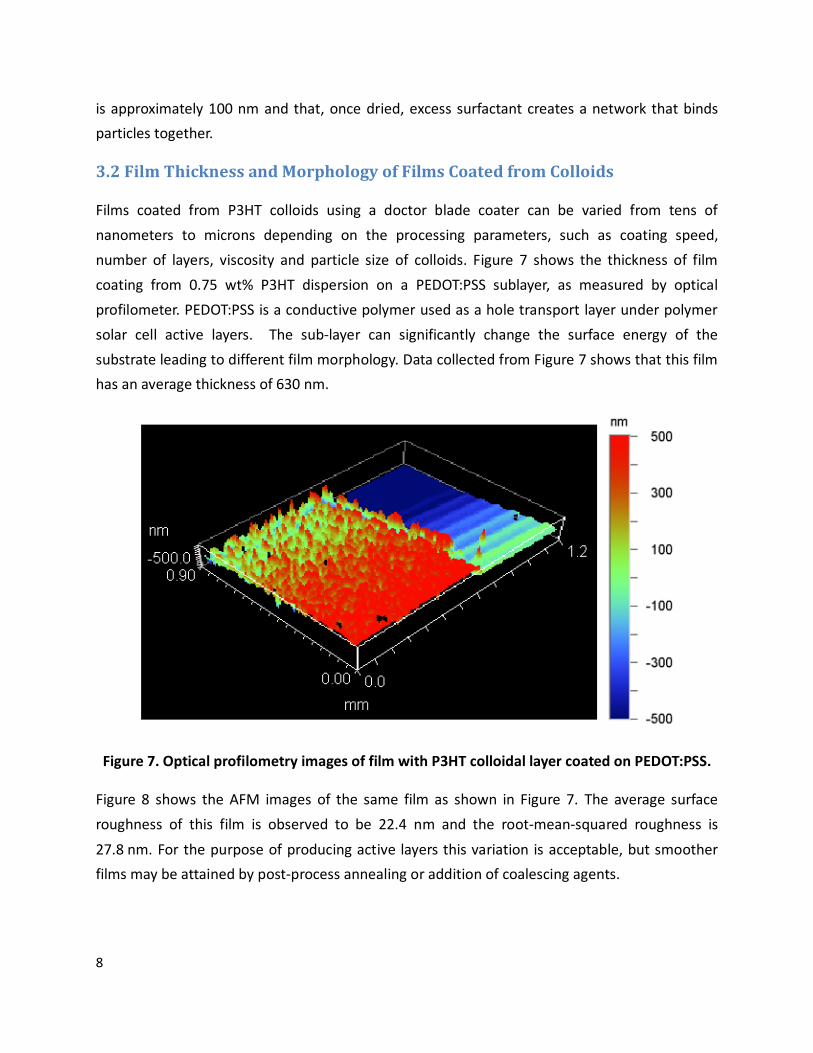
Films coated from P3HT colloids using a doctor blade coater can be varied from tens of nanometers to microns depending on the processing parameters, such as coating speed, number of layers, viscosity and particle size of colloids. Figure 7 shows the thickness of film coating from 0.75 wt% P3HT dispersion on a PEDOT:PSS sublayer, as measured by optical profilometer. PEDOT:PSS is a conductive polymer used as a hole transport layer under polymer solar cell active layers. The sub-layer can significantly change the surface energy of the substrate leading to different film morphology. Data collected from Figure 7 shows that this film has an average thickness of 630 nm.
Figure 7. Optical profilometry images of film with P3HT colloidal layer coated on PEDOT:PSS.
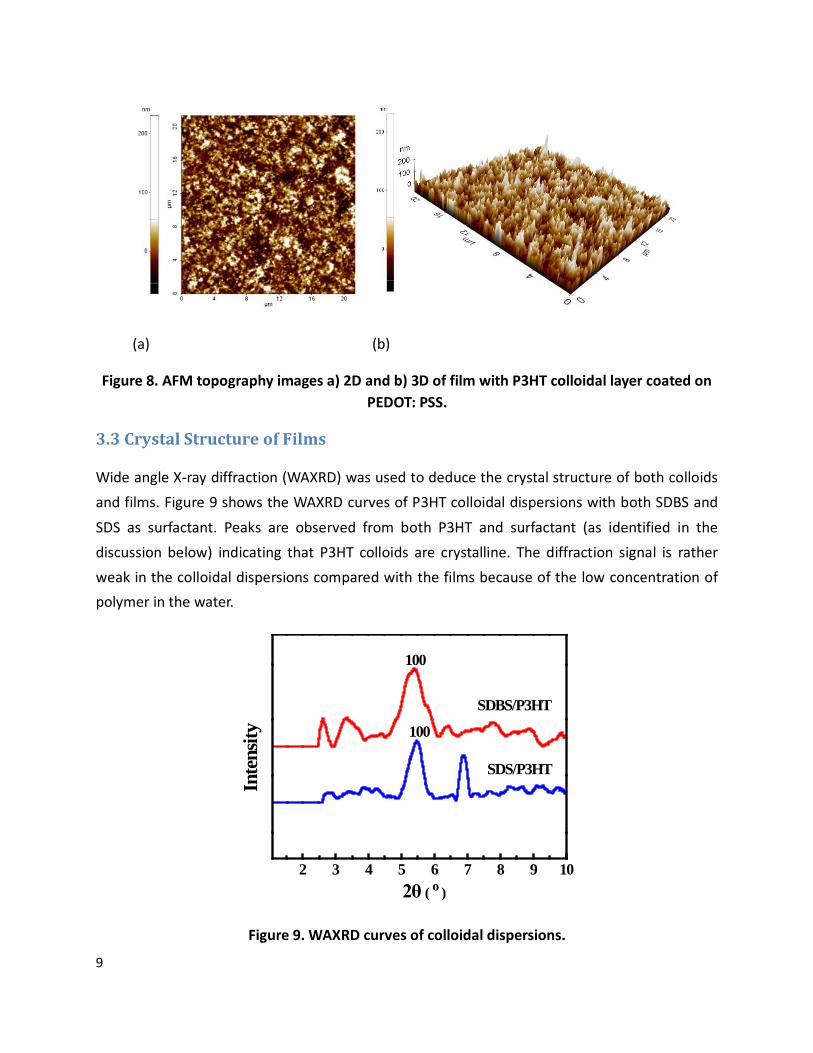
Figure 8 shows the AFM images of the same film as shown in Figure 7. The average surface roughness of this film is observed to be 22.4 nm and the root-mean-squared roughness is
27.8 nm. For the purpose of producing active layers this variation is acceptable, but smoother films may be attained by post-process annealing or addition of coalescing agents.
9
(a) (b)
Figure 8. AFM topography images a) 2D and b) 3D of film with P3HT colloidal layer coated on PEDOT: PSS.
3.3 Crystal Structure of Films
Wide angle X-ray diffraction (WAXRD) was used to deduce the crystal structure of both colloids and films. Figure 9 shows the WAXRD curves of P3HT colloidal dispersions with both SDBS and SDS as surfactant. Peaks are observed from both P3HT and surfactant (as identified in the discussion below) indicating that P3HT colloids are crystalline. The diffraction signal is rather weak in the colloidal dispersions compared with the films because of the low concentration of polymer in the water.
2 3 4 5 6 7 8 9 10
100
Inte
nsity
2θ ( o )
SDS/P3HT
SDBS/P3HT
100
Figure 9. WAXRD curves of colloidal dispersions.
10
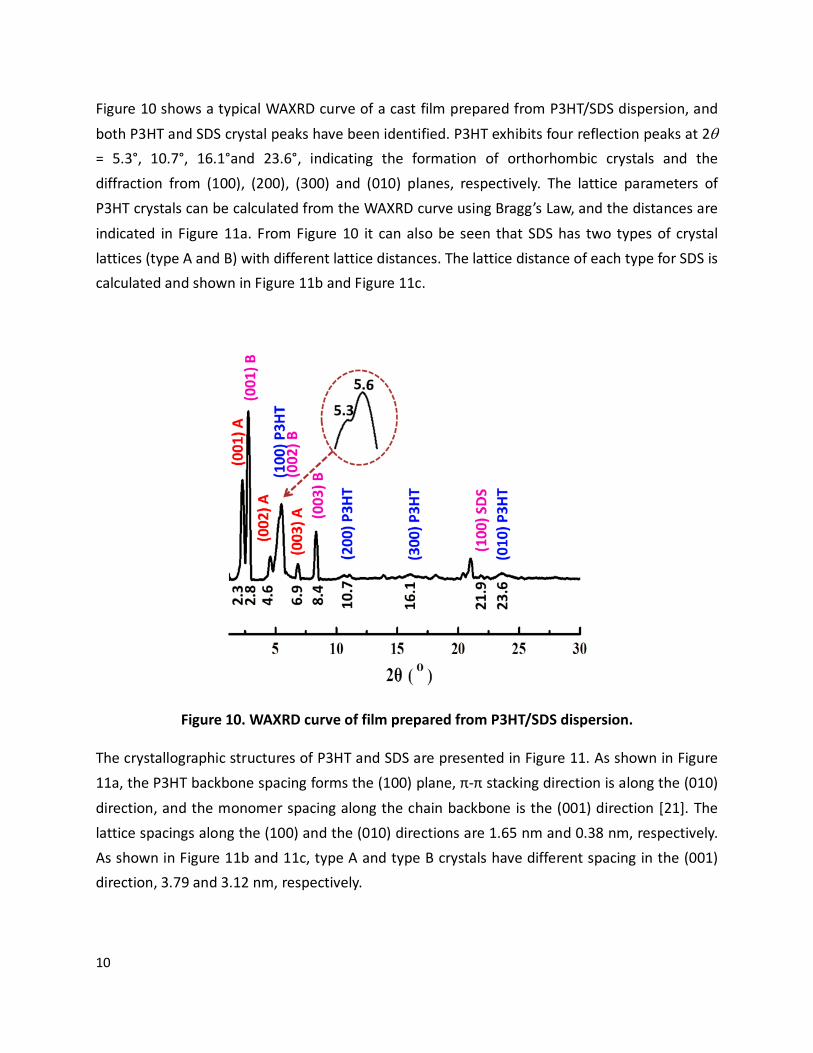
Figure 10 shows a typical WAXRD curve of a cast film prepared from P3HT/SDS dispersion, and
both P3HT and SDS crystal peaks have been identified. P3HT exhibits four reflection peaks at 2θ = 5.3°, 10.7°, 16.1°and 23.6°, indicating the formation of orthorhombic crystals and the diffraction from (100), (200), (300) and (010) planes, respectively. The lattice parameters of P3HT crystals can be calculated from the WAXRD curve using Bragg’s Law, and the distances are
indicated in Figure 11a. From Figure 10 it can also be seen that SDS has two types of crystal lattices (type A and B) with different lattice distances. The lattice distance of each type for SDS is calculated and shown in Figure 11b and Figure 11c.
Figure 10. WAXRD curve of film prepared from P3HT/SDS dispersion.
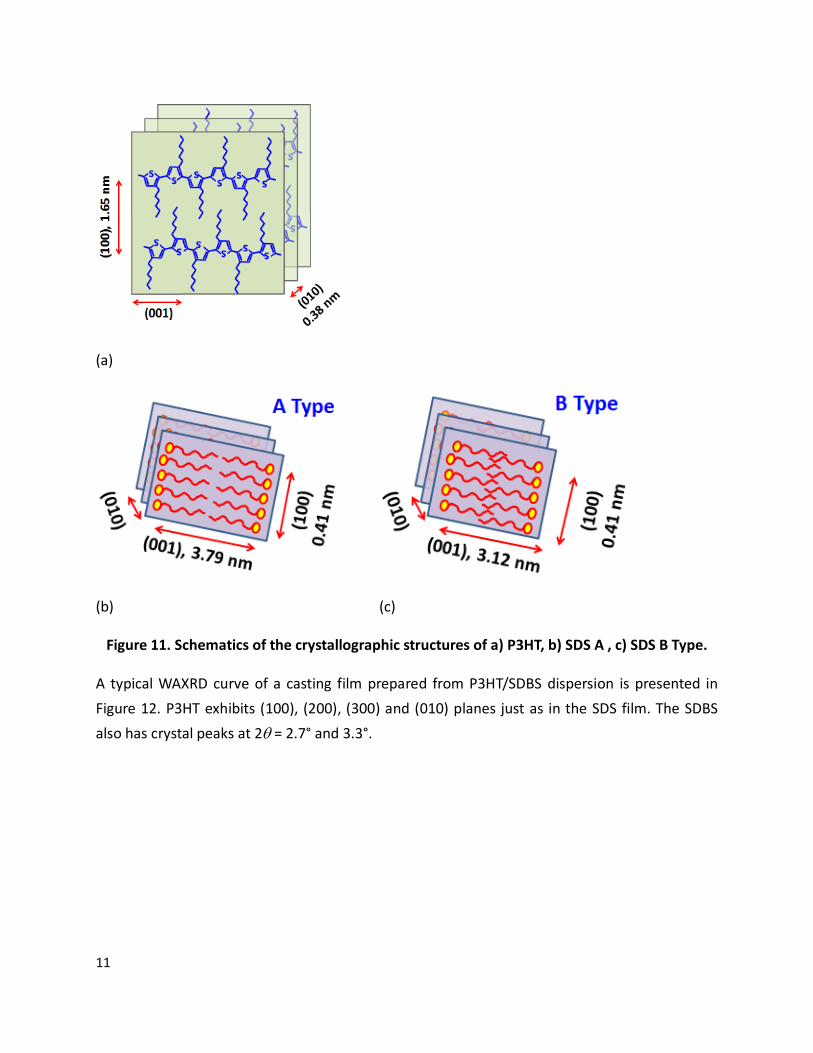
The crystallographic structures of P3HT and SDS are presented in Figure 11. As shown in Figure 11a, the P3HT backbone spacing forms the (100) plane, π-π stacking direction is along the (010) direction, and the monomer spacing along the chain backbone is the (001) direction [21]. The lattice spacings along the (100) and the (010) directions are 1.65 nm and 0.38 nm, respectively. As shown in Figure 11b and 11c, type A and type B crystals have different spacing in the (001) direction, 3.79 and 3.12 nm, respectively.
11
(a)
(b) (c)
Figure 11. Schematics of the crystallographic structures of a) P3HT, b) SDS A , c) SDS B Type.
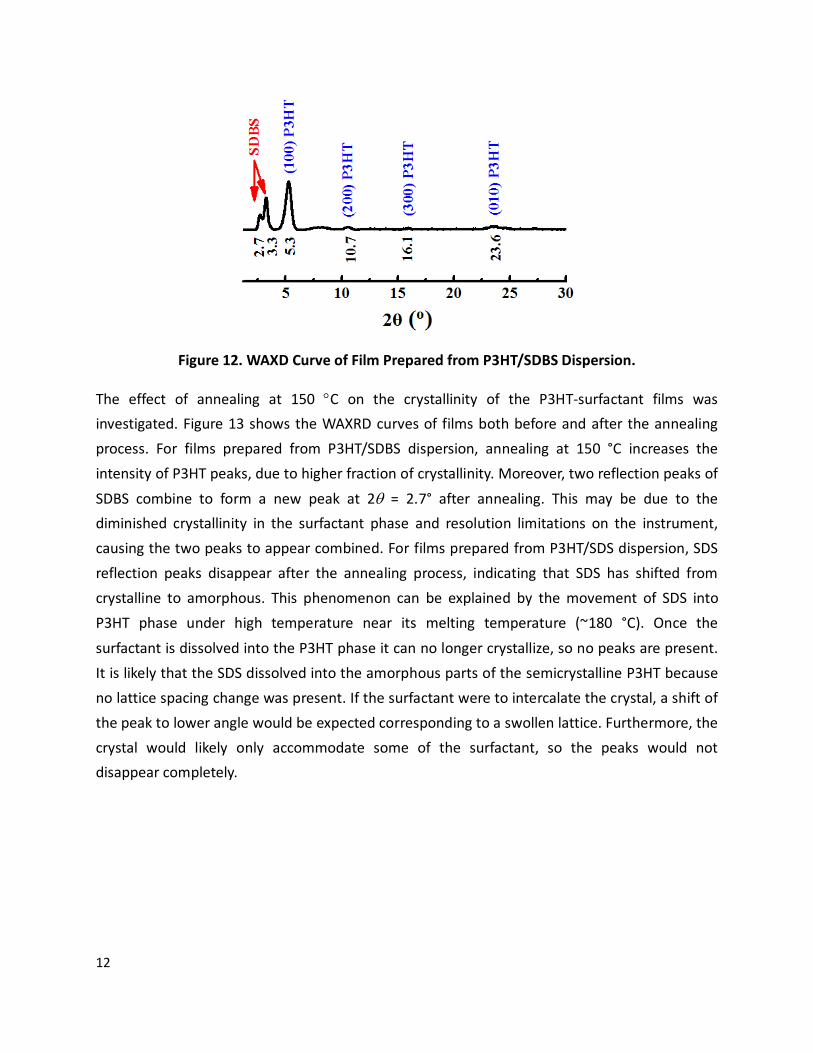
A typical WAXRD curve of a casting film prepared from P3HT/SDBS dispersion is presented in Figure 12. P3HT exhibits (100), (200), (300) and (010) planes just as in the SDS film. The SDBS also has crystal peaks at 2θ = 2.7° and 3.3°.
12
Figure 12. WAXD Curve of Film Prepared from P3HT/SDBS Dispersion.
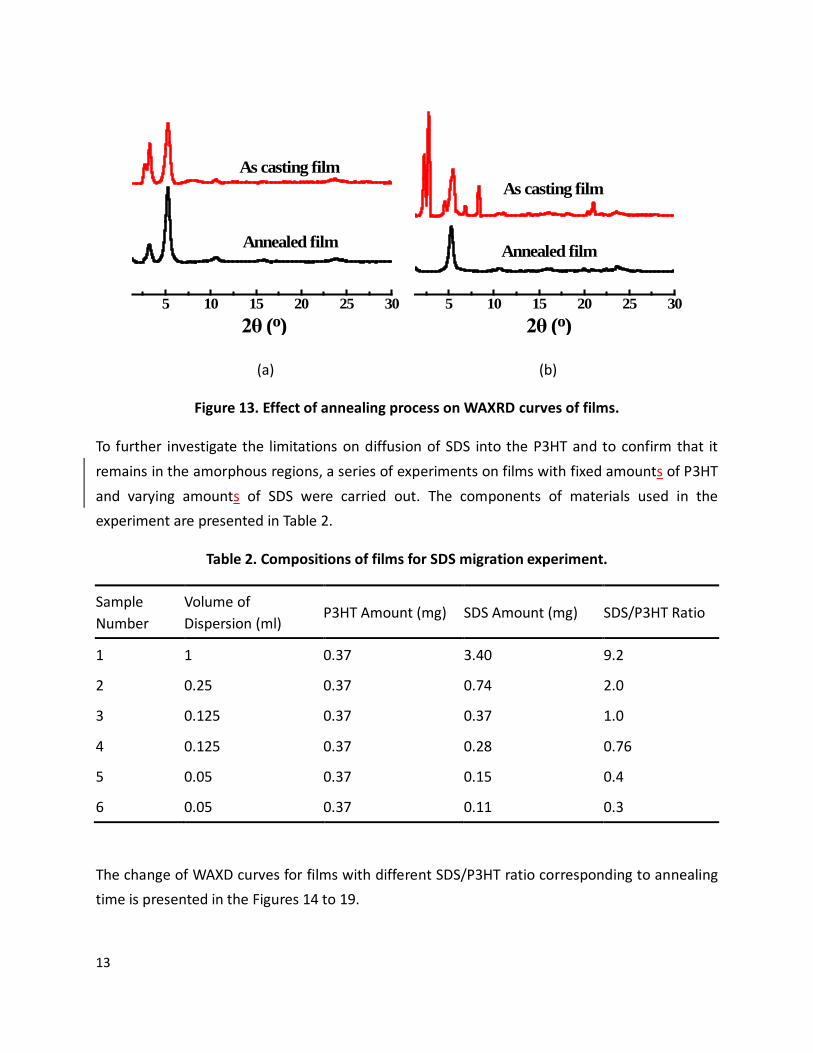
The effect of annealing at 150 °C on the crystallinity of the P3HT-surfactant films was investigated. Figure 13 shows the WAXRD curves of films both before and after the annealing process. For films prepared from P3HT/SDBS dispersion, annealing at 150 °C increases the intensity of P3HT peaks, due to higher fraction of crystallinity. Moreover, two reflection peaks of SDBS combine to form a new peak at 2θ = 2.7° after annealing. This may be due to the diminished crystallinity in the surfactant phase and resolution limitations on the instrument, causing the two peaks to appear combined. For films prepared from P3HT/SDS dispersion, SDS reflection peaks disappear after the annealing process, indicating that SDS has shifted from crystalline to amorphous. This phenomenon can be explained by the movement of SDS into P3HT phase under high temperature near its melting temperature (~180 °C). Once the surfactant is dissolved into the P3HT phase it can no longer crystallize, so no peaks are present. It is likely that the SDS dissolved into the amorphous parts of the semicrystalline P3HT because no lattice spacing change was present. If the surfactant were to intercalate the crystal, a shift of the peak to lower angle would be expected corresponding to a swollen lattice. Furthermore, the crystal would likely only accommodate some of the surfactant, so the peaks would not disappear completely.
13
5 10 15 20 25 30
Annealed film
2θ (o)
As casting film
5 10 15 20 25 302θ (o)
Annealed film
As casting film
(a) (b)
Figure 13. Effect of annealing process on WAXRD curves of films.
To further investigate the limitations on diffusion of SDS into the P3HT and to confirm that it remains in the amorphous regions, a series of experiments on films with fixed amounts of P3HT and varying amounts of SDS were carried out. The components of materials used in the experiment are presented in Table 2.
Table 2. Compositions of films for SDS migration experiment.
Sample Number
Volume of Dispersion (ml)
P3HT Amount (mg) SDS Amount (mg) SDS/P3HT Ratio
1 1 0.37 3.40 9.2
2 0.25 0.37 0.74 2.0
3 0.125 0.37 0.37 1.0
4 0.125 0.37 0.28 0.76
5 0.05 0.37 0.15 0.4
6 0.05 0.37 0.11 0.3
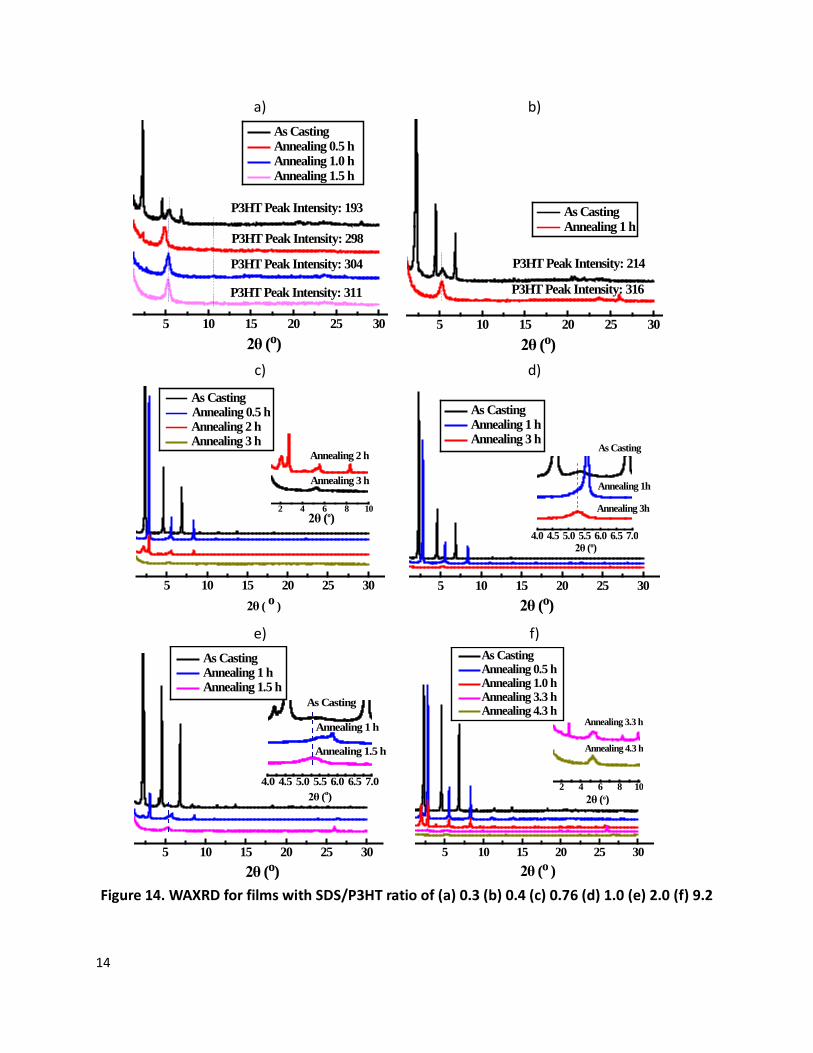
The change of WAXD curves for films with different SDS/P3HT ratio corresponding to annealing time is presented in the Figures 14 to 19.
14
a)
5 10 15 20 25 30
P3HT Peak Intensity: 311
P3HT Peak Intensity: 304
P3HT Peak Intensity: 298
2θ (o)
As Casting Annealing 0.5 h Annealing 1.0 h Annealing 1.5 h
P3HT Peak Intensity: 193
b)
5 10 15 20 25 30
P3HT Peak Intensity: 316
P3HT Peak Intensity: 214
2θ (o)
As Casting Annealing 1 h
c)
5 10 15 20 25 30
2 4 6 8 10
Annealing 3 h
2θ (o)
Annealing 2 h
As Casting Annealing 0.5 h Annealing 2 h Annealing 3 h
2θ ( o )
d)
5 10 15 20 25 30
Annealing 3h
Annealing 1h
4.0 4.5 5.0 5.5 6.0 6.5 7.02θ (o)
2θ (o)
As Casting Annealing 1 h Annealing 3 h
As Casting
e)
5 10 15 20 25 30
4.0 4.5 5.0 5.5 6.0 6.5 7.0
Annealing 1.5 h
Annealing 1 h
As Casting
2θ (o)
2θ (o)
As Casting Annealing 1 h Annealing 1.5 h
f)
5 10 15 20 25 30
2 4 6 8 10
Annealing 4.3 h
Annealing 3.3 h
2θ (o)
As Casting Annealing 0.5 h Annealing 1.0 h Annealing 3.3 h Annealing 4.3 h
2θ (o ) Figure 14. WAXRD for films with SDS/P3HT ratio of (a) 0.3 (b) 0.4 (c) 0.76 (d) 1.0 (e) 2.0 (f) 9.2
15
As shown in Figure 14a and 14b, when SDS/P3HT ratio is relatively low, SDS crystal peaks almost disappear after annealing 1 h. Furthermore, the intensity of P3HT peak gradually enhances with the increase of annealing time. As shown in Figure 14d, when SDS/P3HT ratio is relatively high, SDS crystal lattice first changes from A type to B type after annealing 0.5 h, indicating SDS aliphatic chains begin to intercalate, as illustrated in Figure 11c. Higher SDS/P3HT ratios require more time for SDS crystal peaks to disappear, as the larger amount of SDS fully diffuses into the P3HT phase. We conclude that SDS chains diffuse into P3HT amorphous region during annealing process, as these films can absorb a large amount of SDS and the location of P3HT peak does
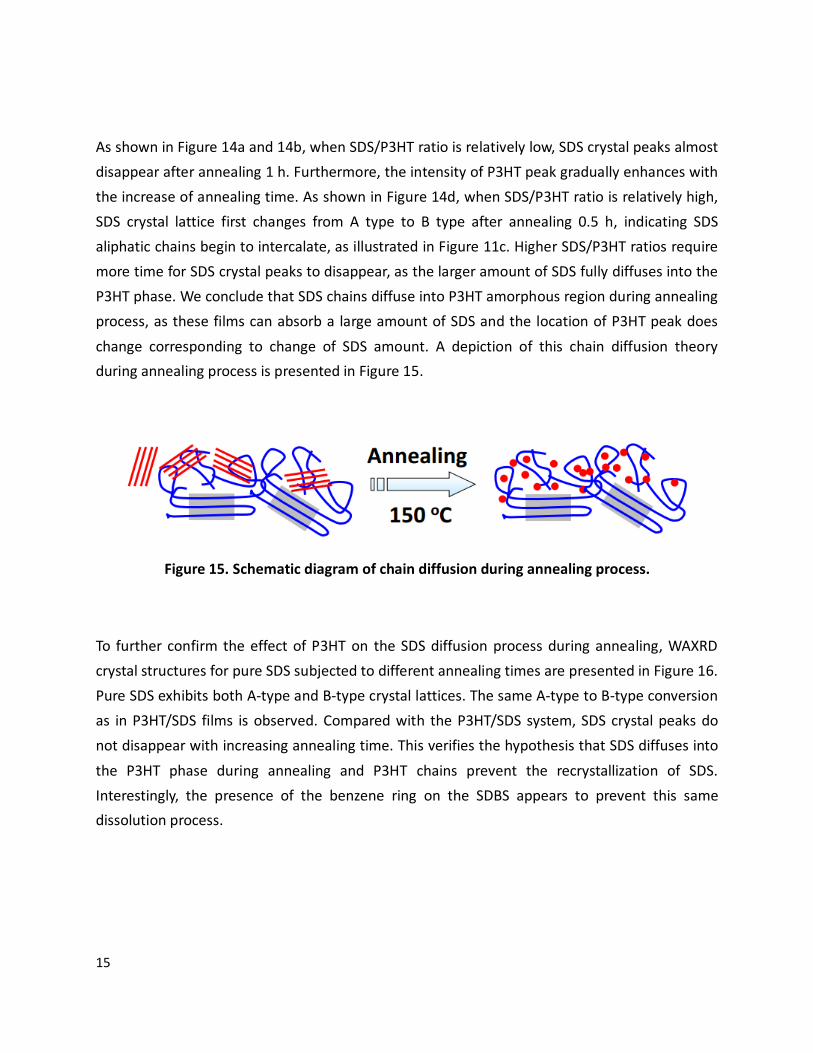
change corresponding to change of SDS amount. A depiction of this chain diffusion theory during annealing process is presented in Figure 15.
Figure 15. Schematic diagram of chain diffusion during annealing process.
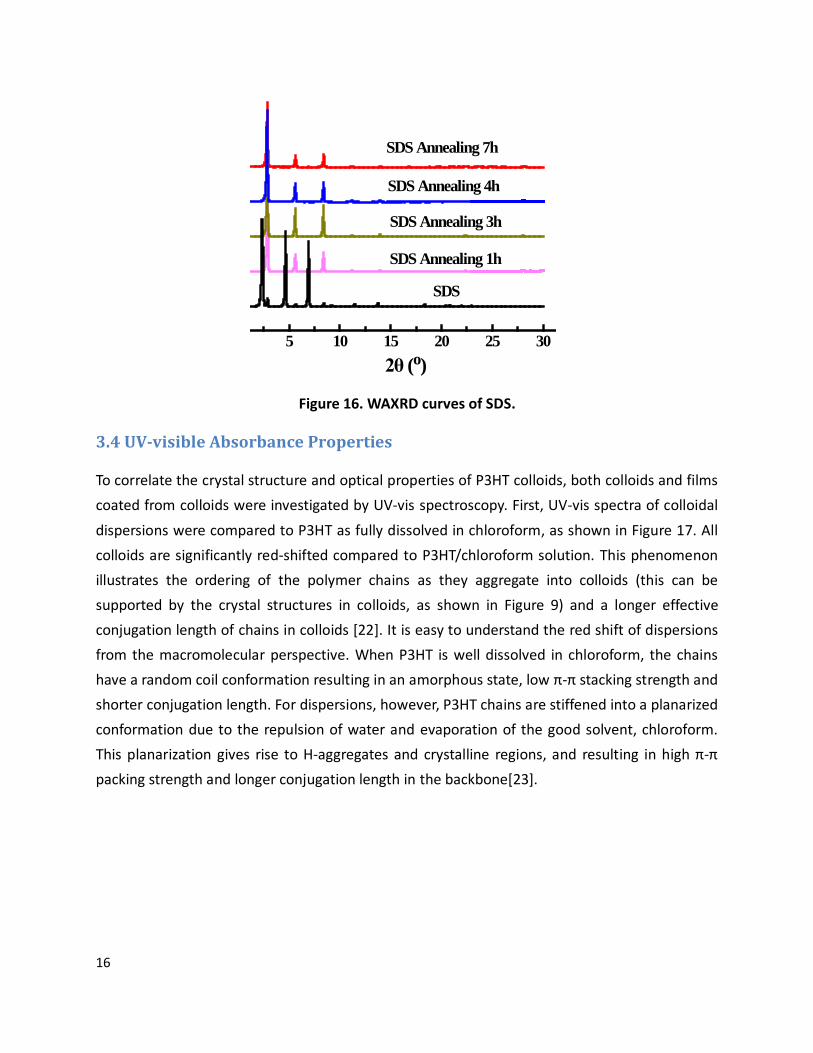
To further confirm the effect of P3HT on the SDS diffusion process during annealing, WAXRD crystal structures for pure SDS subjected to different annealing times are presented in Figure 16. Pure SDS exhibits both A-type and B-type crystal lattices. The same A-type to B-type conversion as in P3HT/SDS films is observed. Compared with the P3HT/SDS system, SDS crystal peaks do not disappear with increasing annealing time. This verifies the hypothesis that SDS diffuses into the P3HT phase during annealing and P3HT chains prevent the recrystallization of SDS. Interestingly, the presence of the benzene ring on the SDBS appears to prevent this same dissolution process.
16
Figure 16. WAXRD curves of SDS.
3.4 UV-visible Absorbance Properties
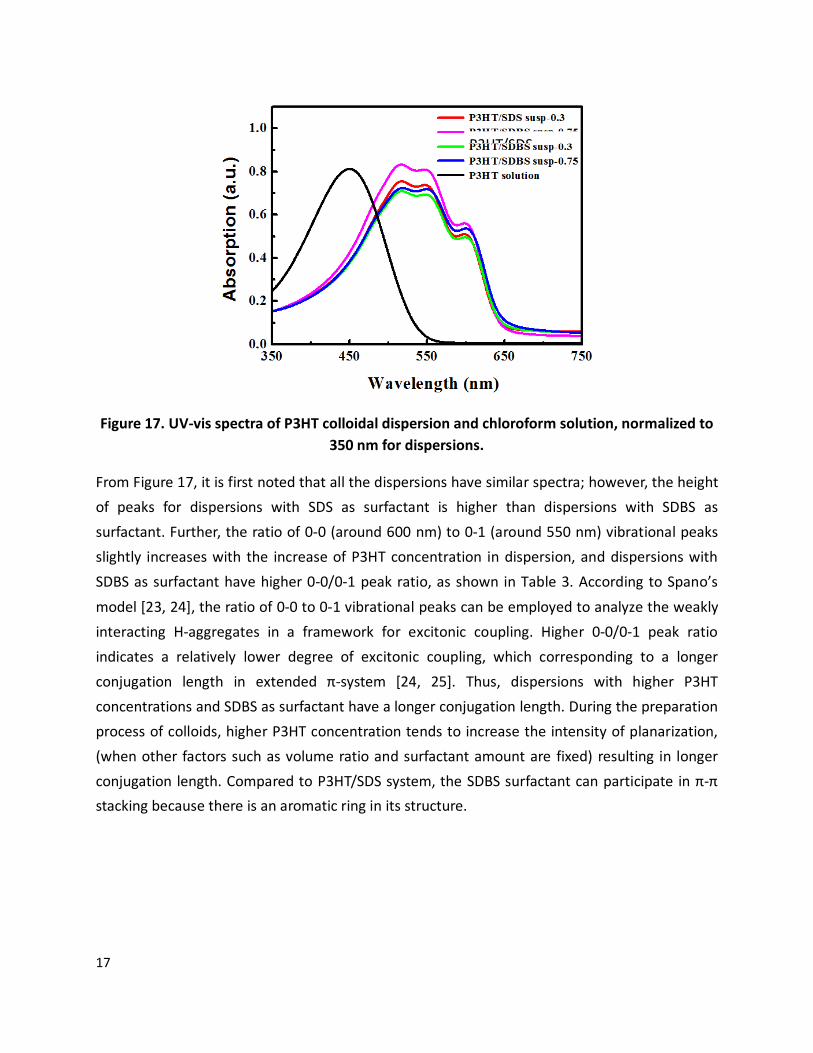
To correlate the crystal structure and optical properties of P3HT colloids, both colloids and films coated from colloids were investigated by UV-vis spectroscopy. First, UV-vis spectra of colloidal dispersions were compared to P3HT as fully dissolved in chloroform, as shown in Figure 17. All colloids are significantly red-shifted compared to P3HT/chloroform solution. This phenomenon illustrates the ordering of the polymer chains as they aggregate into colloids (this can be supported by the crystal structures in colloids, as shown in Figure 9) and a longer effective conjugation length of chains in colloids [22]. It is easy to understand the red shift of dispersions from the macromolecular perspective. When P3HT is well dissolved in chloroform, the chains have a random coil conformation resulting in an amorphous state, low π-π stacking strength and shorter conjugation length. For dispersions, however, P3HT chains are stiffened into a planarized conformation due to the repulsion of water and evaporation of the good solvent, chloroform. This planarization gives rise to H-aggregates and crystalline regions, and resulting in high π-π packing strength and longer conjugation length in the backbone[23].
5 10 15 20 25 30
SDS Annealing 7h
SDS Annealing 4h
SDS Annealing 3h
SDS Annealing 1h
SDS
2θ (o)
17
Figure 17. UV-vis spectra of P3HT colloidal dispersion and chloroform solution, normalized to 350 nm for dispersions.
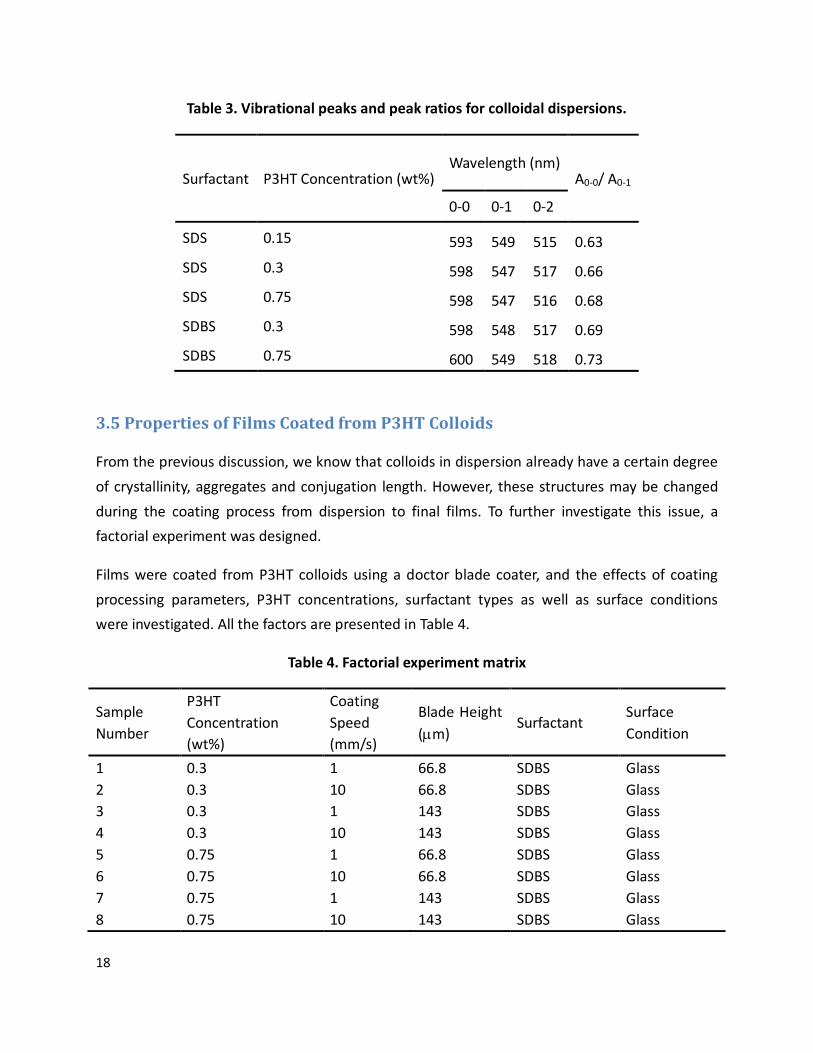
From Figure 17, it is first noted that all the dispersions have similar spectra; however, the height of peaks for dispersions with SDS as surfactant is higher than dispersions with SDBS as surfactant. Further, the ratio of 0-0 (around 600 nm) to 0-1 (around 550 nm) vibrational peaks slightly increases with the increase of P3HT concentration in dispersion, and dispersions with SDBS as surfactant have higher 0-0/0-1 peak ratio, as shown in Table 3. According to Spano’s model [23, 24], the ratio of 0-0 to 0-1 vibrational peaks can be employed to analyze the weakly interacting H-aggregates in a framework for excitonic coupling. Higher 0-0/0-1 peak ratio indicates a relatively lower degree of excitonic coupling, which corresponding to a longer conjugation length in extended π-system [24, 25]. Thus, dispersions with higher P3HT concentrations and SDBS as surfactant have a longer conjugation length. During the preparation process of colloids, higher P3HT concentration tends to increase the intensity of planarization, (when other factors such as volume ratio and surfactant amount are fixed) resulting in longer conjugation length. Compared to P3HT/SDS system, the SDBS surfactant can participate in π-π stacking because there is an aromatic ring in its structure.
P3HT/SDS
18
Table 3. Vibrational peaks and peak ratios for colloidal dispersions.
Surfactant P3HT Concentration (wt%) Wavelength (nm)
A0-0/ A0-1
0-0 0-1 0-2
SDS 0.15 593 549 515 0.63
SDS 0.3 598 547 517 0.66
SDS 0.75 598 547 516 0.68
SDBS 0.3 598 548 517 0.69
SDBS 0.75 600 549 518 0.73
3.5 Properties of Films Coated from P3HT Colloids
From the previous discussion, we know that colloids in dispersion already have a certain degree of crystallinity, aggregates and conjugation length. However, these structures may be changed during the coating process from dispersion to final films. To further investigate this issue, a factorial experiment was designed.
Films were coated from P3HT colloids using a doctor blade coater, and the effects of coating processing parameters, P3HT concentrations, surfactant types as well as surface conditions were investigated. All the factors are presented in Table 4.
Table 4. Factorial experiment matrix
Sample Number
P3HT Concentration (wt%)
Coating Speed (mm/s)
Blade Height (µm)
Surfactant Surface Condition
1 0.3 1 66.8 SDBS Glass 2 0.3 10 66.8 SDBS Glass 3 0.3 1 143 SDBS Glass 4 0.3 10 143 SDBS Glass 5 0.75 1 66.8 SDBS Glass 6 0.75 10 66.8 SDBS Glass 7 0.75 1 143 SDBS Glass 8 0.75 10 143 SDBS Glass
19
Sample Number
P3HT Concentration (wt%)
Coating Speed (mm/s)
Blade Height (µm)
Surfactant Surface Condition
9 0.3 1 66.8 SDS Glass 10 0.3 10 66.8 SDS Glass 11 0.3 1 143 SDS Glass 12 0.3 10 143 SDS Glass 13 0.75 1 66.8 SDS Glass 14 0.75 10 66.8 SDS Glass 15 0.75 1 143 SDS Glass 16 0.75 10 143 SDS Glass 17 0.3 1 66.8 SDBS PEDOT 18 0.3 10 66.8 SDBS PEDOT 19 0.3 1 143 SDBS PEDOT 20 0.3 10 143 SDBS PEDOT 21 0.75 1 66.8 SDBS PEDOT 22 0.75 10 66.8 SDBS PEDOT 23 0.75 1 143 SDBS PEDOT 24 0.75 10 143 SDBS PEDOT 25 0.3 1 66.8 SDS PEDOT 26 0.3 10 66.8 SDS PEDOT 27 0.3 1 143 SDS PEDOT 28 0.3 10 143 SDS PEDOT 29 0.75 1 66.8 SDS PEDOT 30 0.75 10 66.8 SDS PEDOT 31 0.75 1 143 SDS PEDOT 32 0.75 10 143 SDS PEDOT
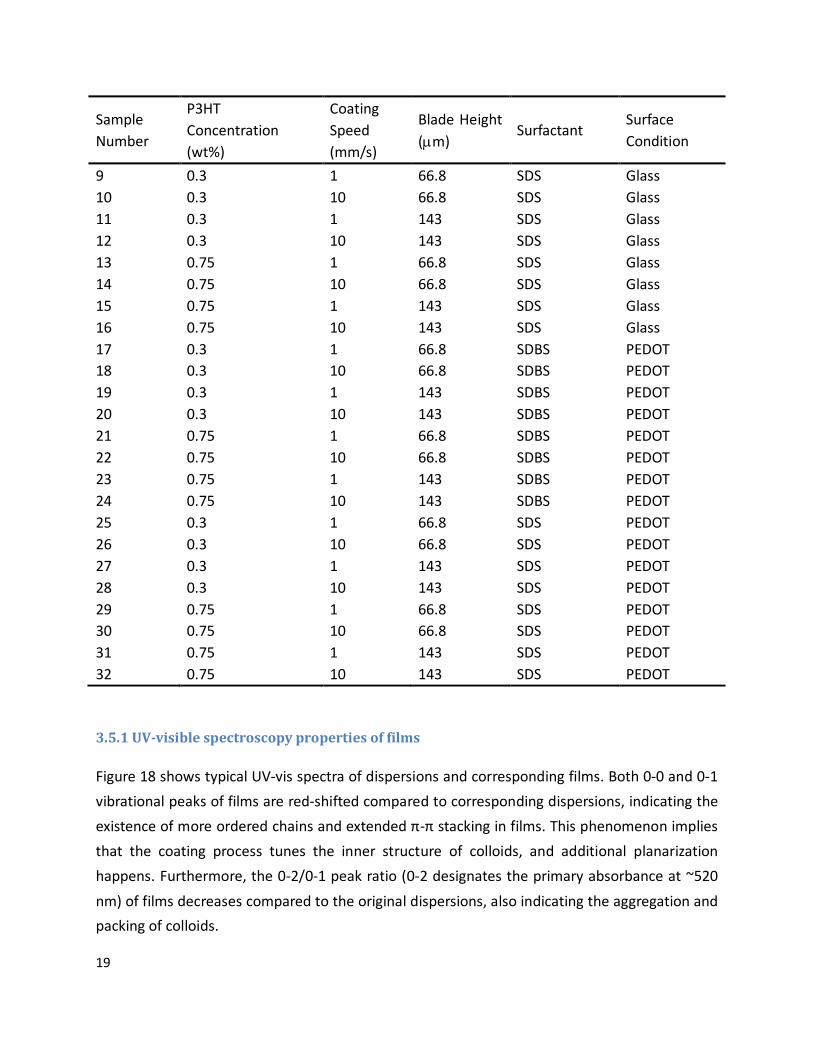
3.5.1 UV-visible spectroscopy properties of films
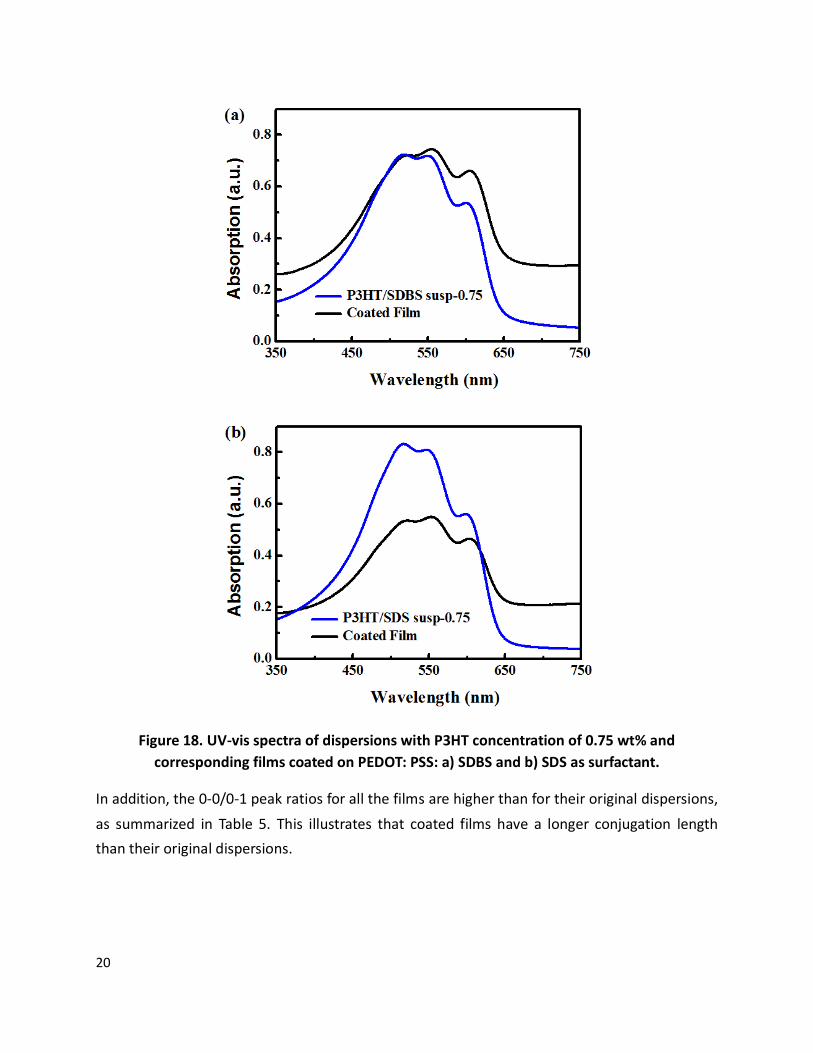
Figure 18 shows typical UV-vis spectra of dispersions and corresponding films. Both 0-0 and 0-1 vibrational peaks of films are red-shifted compared to corresponding dispersions, indicating the existence of more ordered chains and extended π-π stacking in films. This phenomenon implies that the coating process tunes the inner structure of colloids, and additional planarization happens. Furthermore, the 0-2/0-1 peak ratio (0-2 designates the primary absorbance at ~520 nm) of films decreases compared to the original dispersions, also indicating the aggregation and packing of colloids.
20
Figure 18. UV-vis spectra of dispersions with P3HT concentration of 0.75 wt% and corresponding films coated on PEDOT: PSS: a) SDBS and b) SDS as surfactant.
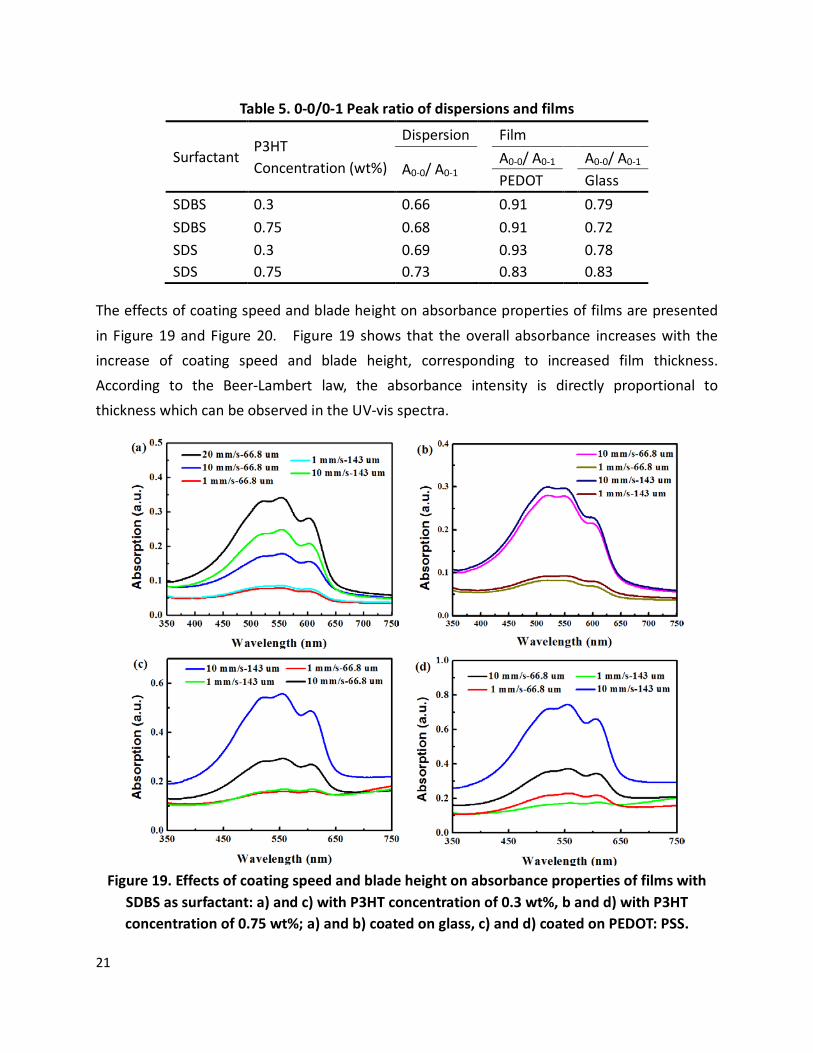
In addition, the 0-0/0-1 peak ratios for all the films are higher than for their original dispersions, as summarized in Table 5. This illustrates that coated films have a longer conjugation length than their original dispersions.
21
Table 5. 0-0/0-1 Peak ratio of dispersions and films
Surfactant P3HT Concentration (wt%)
Dispersion Film
A0-0/ A0-1 A0-0/ A0-1
A0-0/ A0-1
PEDOT Glass SDBS 0.3 0.66 0.91 0.79 SDBS 0.75 0.68 0.91 0.72 SDS 0.3 0.69 0.93 0.78 SDS 0.75 0.73 0.83 0.83
The effects of coating speed and blade height on absorbance properties of films are presented
in Figure 19 and Figure 20. Figure 19 shows that the overall absorbance increases with the increase of coating speed and blade height, corresponding to increased film thickness. According to the Beer-Lambert law, the absorbance intensity is directly proportional to thickness which can be observed in the UV-vis spectra.
Figure 19. Effects of coating speed and blade height on absorbance properties of films with
SDBS as surfactant: a) and c) with P3HT concentration of 0.3 wt%, b and d) with P3HT concentration of 0.75 wt%; a) and b) coated on glass, c) and d) coated on PEDOT: PSS.
22
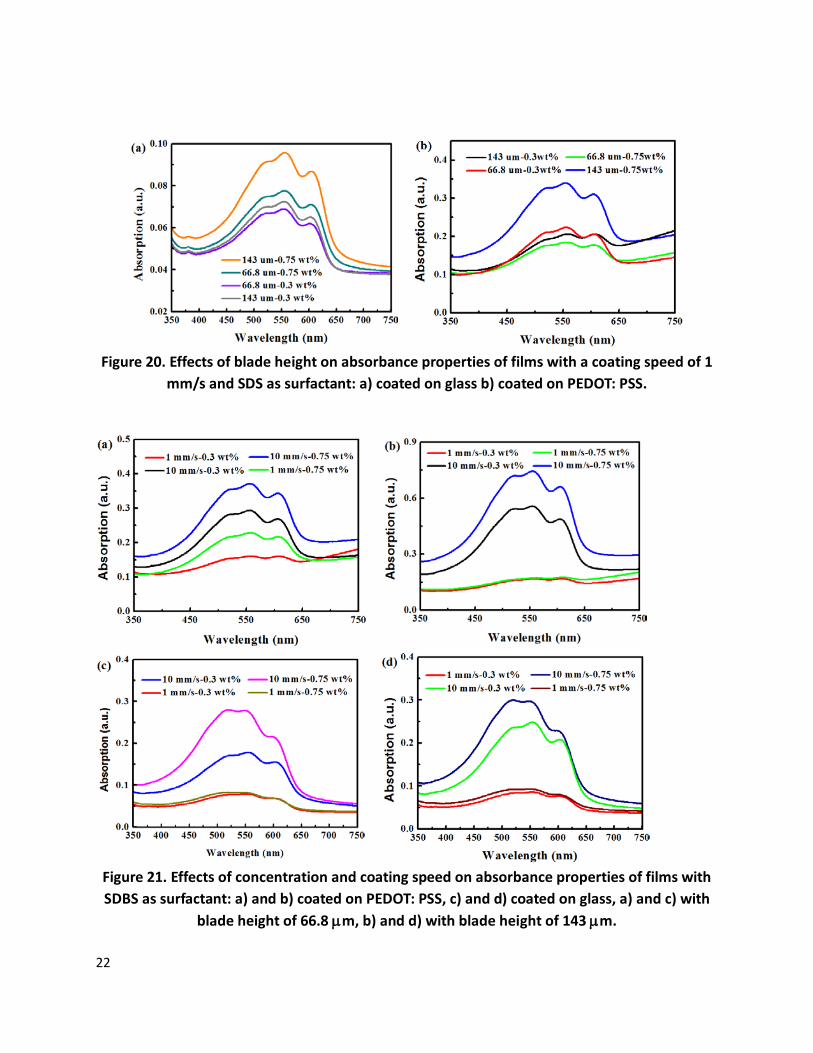
Figure 20. Effects of blade height on absorbance properties of films with a coating speed of 1
mm/s and SDS as surfactant: a) coated on glass b) coated on PEDOT: PSS.
Figure 21. Effects of concentration and coating speed on absorbance properties of films with SDBS as surfactant: a) and b) coated on PEDOT: PSS, c) and d) coated on glass, a) and c) with
blade height of 66.8 µm, b) and d) with blade height of 143 µm.
23
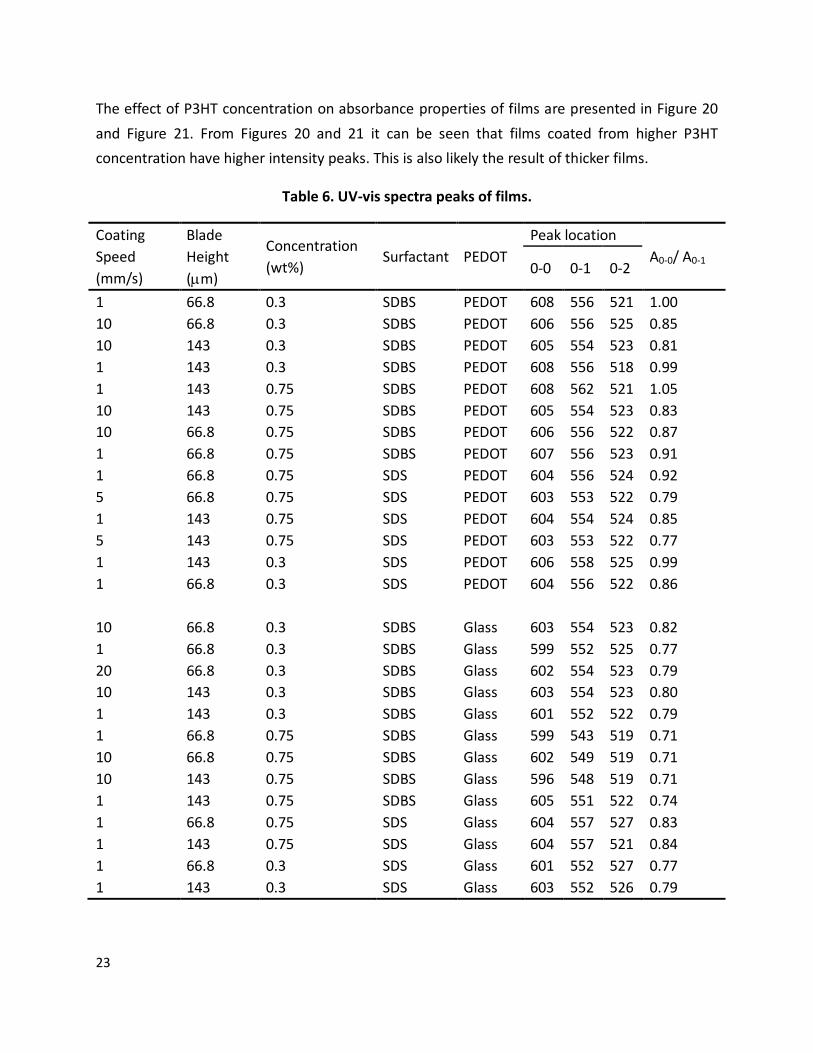
The effect of P3HT concentration on absorbance properties of films are presented in Figure 20 and Figure 21. From Figures 20 and 21 it can be seen that films coated from higher P3HT concentration have higher intensity peaks. This is also likely the result of thicker films.
Table 6. UV-vis spectra peaks of films.
Coating Speed (mm/s)
Blade Height (µm)
Concentration (wt%)
Surfactant PEDOT Peak location
A0-0/ A0-1 0-0 0-1 0-2
1 66.8 0.3 SDBS PEDOT 608 556 521 1.00 10 66.8 0.3 SDBS PEDOT 606 556 525 0.85 10 143 0.3 SDBS PEDOT 605 554 523 0.81 1 143 0.3 SDBS PEDOT 608 556 518 0.99 1 143 0.75 SDBS PEDOT 608 562 521 1.05 10 143 0.75 SDBS PEDOT 605 554 523 0.83 10 66.8 0.75 SDBS PEDOT 606 556 522 0.87 1 66.8 0.75 SDBS PEDOT 607 556 523 0.91 1 66.8 0.75 SDS PEDOT 604 556 524 0.92 5 66.8 0.75 SDS PEDOT 603 553 522 0.79 1 143 0.75 SDS PEDOT 604 554 524 0.85 5 143 0.75 SDS PEDOT 603 553 522 0.77 1 143 0.3 SDS PEDOT 606 558 525 0.99 1 66.8 0.3 SDS PEDOT 604 556 522 0.86
10 66.8 0.3 SDBS Glass 603 554 523 0.82 1 66.8 0.3 SDBS Glass 599 552 525 0.77 20 66.8 0.3 SDBS Glass 602 554 523 0.79 10 143 0.3 SDBS Glass 603 554 523 0.80 1 143 0.3 SDBS Glass 601 552 522 0.79 1 66.8 0.75 SDBS Glass 599 543 519 0.71 10 66.8 0.75 SDBS Glass 602 549 519 0.71 10 143 0.75 SDBS Glass 596 548 519 0.71 1 143 0.75 SDBS Glass 605 551 522 0.74 1 66.8 0.75 SDS Glass 604 557 527 0.83 1 143 0.75 SDS Glass 604 557 521 0.84 1 66.8 0.3 SDS Glass 601 552 527 0.77 1 143 0.3 SDS Glass 603 552 526 0.79
24
The UV-vis spectral peaks of all the films and the 0-0/0-1 peak ratio are summarized in Table 6. From Tables 3, 5 and 6, it can be seen that films coated on PEDOT:PSS always have a higher 0-0/0-1 peak ratio, indicating longer conjugation lengths. This phenomenon implies that the existence of PEDOT:PSS influences the stacking and aggregates of P3HT colloids. The 0-0, 0-1 and 0-2 peaks have a red-shift for films as compared to colloids. Additionally, the effect of
surfactant type on UV-vis spectra of films is not regular, but it appears that in general, the films with SDBS show larger 0-0/0-1 ratios, indicating greater conjugation.
3.5.2 WAXD curves of films
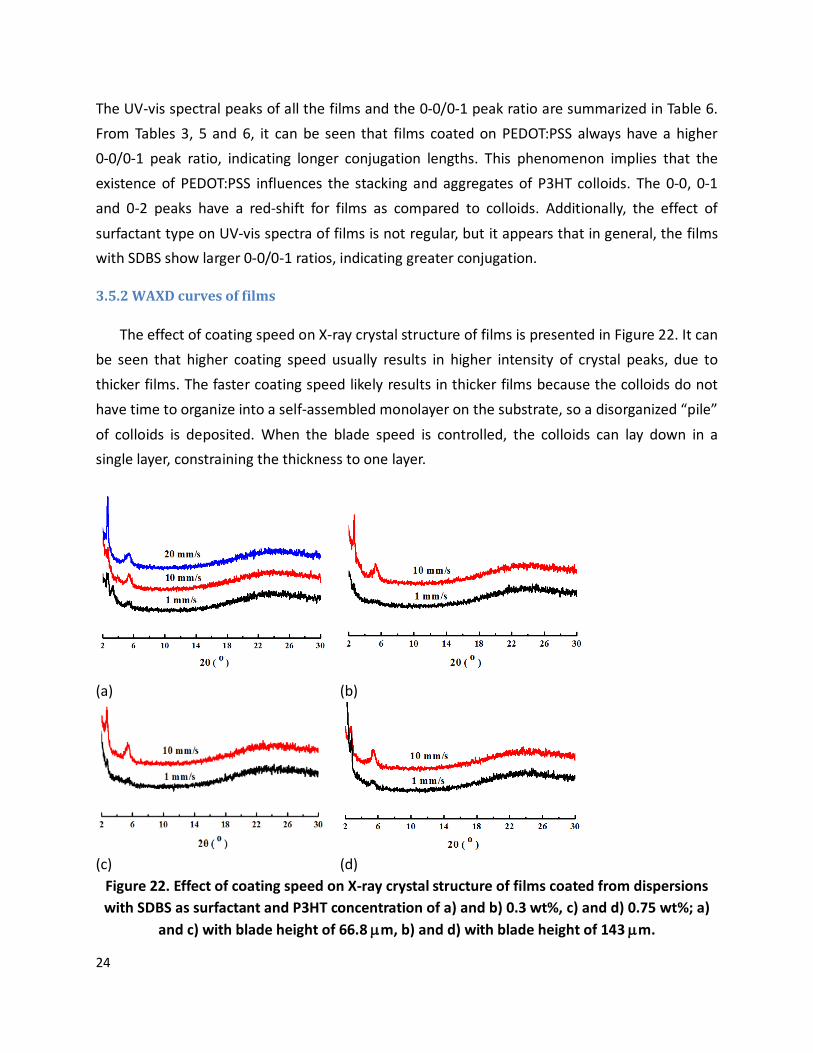
The effect of coating speed on X-ray crystal structure of films is presented in Figure 22. It can be seen that higher coating speed usually results in higher intensity of crystal peaks, due to thicker films. The faster coating speed likely results in thicker films because the colloids do not have time to organize into a self-assembled monolayer on the substrate, so a disorganized “pile” of colloids is deposited. When the blade speed is controlled, the colloids can lay down in a single layer, constraining the thickness to one layer.
(a) (b)
(c) (d)
Figure 22. Effect of coating speed on X-ray crystal structure of films coated from dispersions with SDBS as surfactant and P3HT concentration of a) and b) 0.3 wt%, c) and d) 0.75 wt%; a)
and c) with blade height of 66.8 µm, b) and d) with blade height of 143 µm.
25
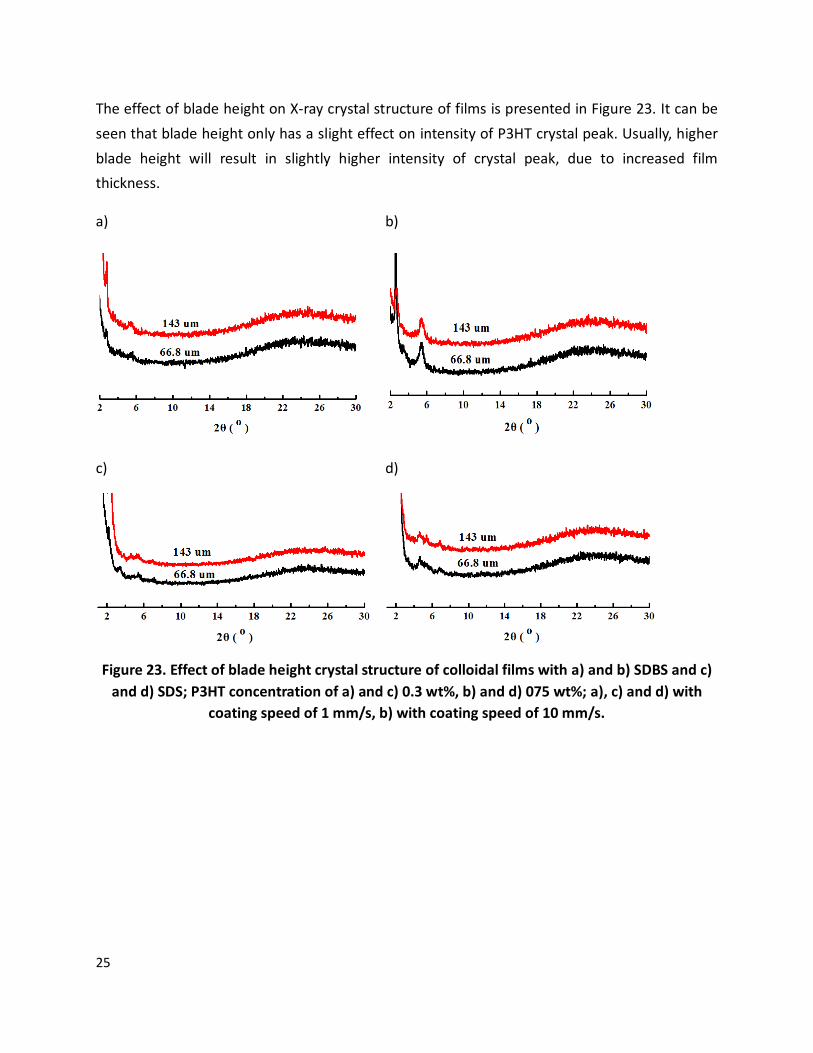
The effect of blade height on X-ray crystal structure of films is presented in Figure 23. It can be seen that blade height only has a slight effect on intensity of P3HT crystal peak. Usually, higher blade height will result in slightly higher intensity of crystal peak, due to increased film thickness.
a)
b)
c)
d)
Figure 23. Effect of blade height crystal structure of colloidal films with a) and b) SDBS and c) and d) SDS; P3HT concentration of a) and c) 0.3 wt%, b) and d) 075 wt%; a), c) and d) with
coating speed of 1 mm/s, b) with coating speed of 10 mm/s.
26
a)
b)
c)
d)
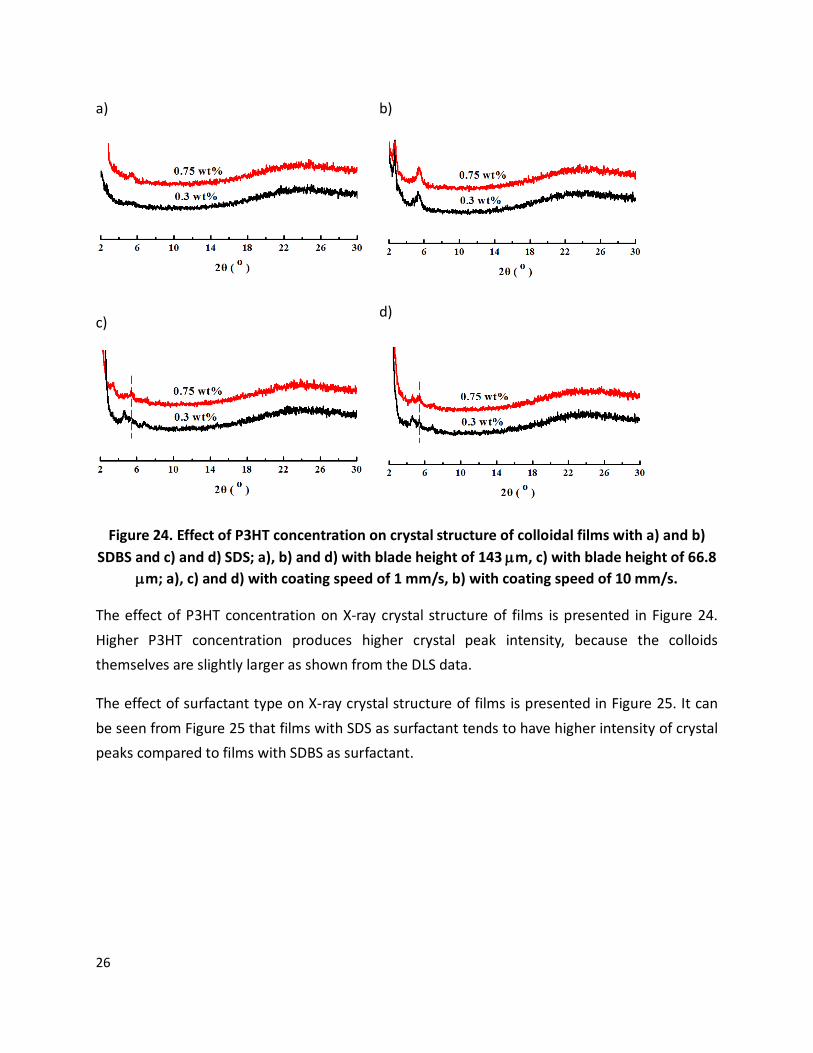
Figure 24. Effect of P3HT concentration on crystal structure of colloidal films with a) and b) SDBS and c) and d) SDS; a), b) and d) with blade height of 143 µm, c) with blade height of 66.8
µm; a), c) and d) with coating speed of 1 mm/s, b) with coating speed of 10 mm/s.
The effect of P3HT concentration on X-ray crystal structure of films is presented in Figure 24. Higher P3HT concentration produces higher crystal peak intensity, because the colloids themselves are slightly larger as shown from the DLS data.
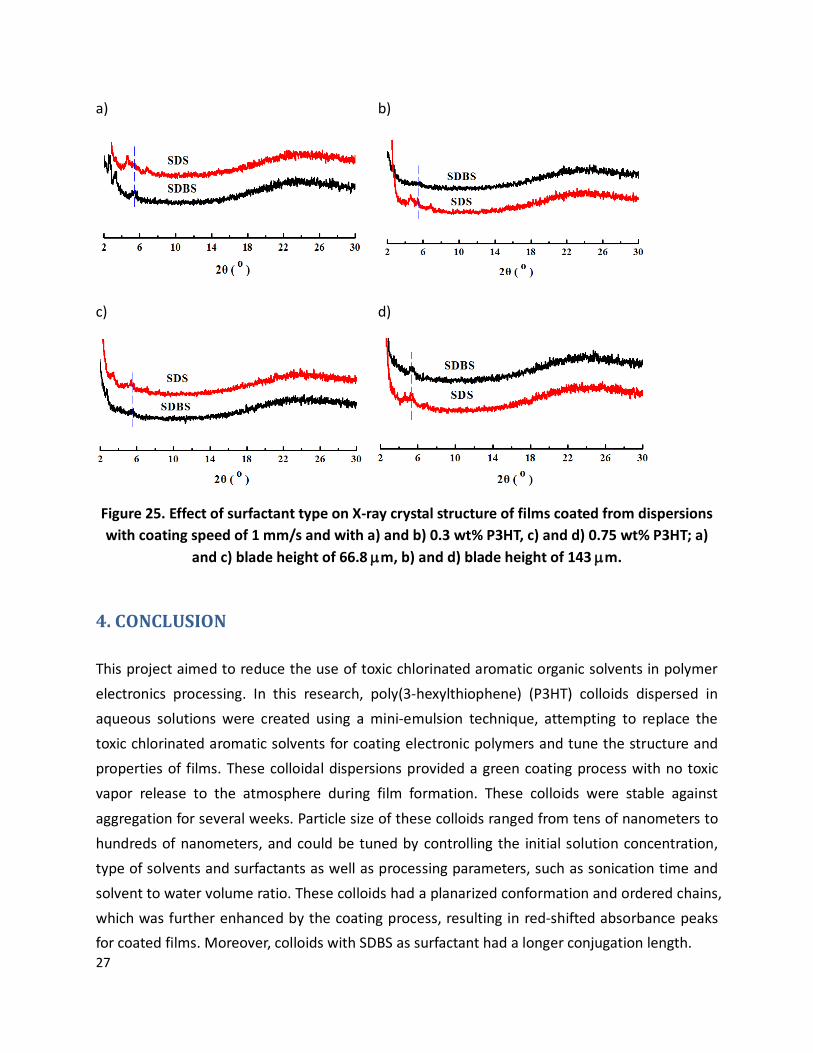
The effect of surfactant type on X-ray crystal structure of films is presented in Figure 25. It can be seen from Figure 25 that films with SDS as surfactant tends to have higher intensity of crystal peaks compared to films with SDBS as surfactant.
27
a)
b)
c)
d)
Figure 25. Effect of surfactant type on X-ray crystal structure of films coated from dispersions with coating speed of 1 mm/s and with a) and b) 0.3 wt% P3HT, c) and d) 0.75 wt% P3HT; a)
and c) blade height of 66.8 µm, b) and d) blade height of 143 µm.
4. CONCLUSION
This project aimed to reduce the use of toxic chlorinated aromatic organic solvents in polymer electronics processing. In this research, poly(3-hexylthiophene) (P3HT) colloids dispersed in aqueous solutions were created using a mini-emulsion technique, attempting to replace the toxic chlorinated aromatic solvents for coating electronic polymers and tune the structure and properties of films. These colloidal dispersions provided a green coating process with no toxic vapor release to the atmosphere during film formation. These colloids were stable against
aggregation for several weeks. Particle size of these colloids ranged from tens of nanometers to hundreds of nanometers, and could be tuned by controlling the initial solution concentration, type of solvents and surfactants as well as processing parameters, such as sonication time and solvent to water volume ratio. These colloids had a planarized conformation and ordered chains, which was further enhanced by the coating process, resulting in red-shifted absorbance peaks for coated films. Moreover, colloids with SDBS as surfactant had a longer conjugation length.
28
The effect of coating parameters on final crystal structure and optical absorbance of films was investigated. The results showed that coating speed had a significant influence on optical and crystal properties. Blade height, P3HT concentration, and surface preparation also significantly affected morphology. Generally, film thickness increased with higher coating speed, blade height and P3HT concentration. Additionally, films coated on PEDOT: PSS had a longer conjugation length.
Future work will focus on the electronic properties of the films and selection of surfactants that may have increased benefit to the structure and properties of the films. It is anticipated that these aqueous colloids will be suitable as a safer alternative to chlorinated aromatic solvents currently used to coat electronic polymers.
REFERENCE
1. Benanti, T.L. and D. Venkataraman, Organic Solar Cells: An Overview Focusing on Active Layer Morphology. Photosynthesis Research, 2006. 87(1): p. 73-81.
2. Brabec, C.J., Polymer–Fullerene Bulk-Heterojunction Solar Cells. advanced materials, 2010. 22: p. 3839-3856.
3. Machui, F., et al., Determination of the P3HT:PCBM solubility parameters via a binary solvent gradient method: Impact of solubility on the photovoltaic performance. Solar Energy Materials and Solar Cells, 2012. 100: p. 138-146.
4. Moulé, A.J. and K. Meerholz, Morphology Control in Solution-Processed Bulk-Heterojunction Solar Cell Mixtures. Advanced Functional Materials, 2009. 19(19): p. 3028-3036.
5. Huang, Y., H. Cheng, and C.C. Han, Temperature Induced Structure Evolution of Regioregular Poly(3-hexylthiophene) in Dilute Solution and its Influence on Thin Film Morphology. Macromolecules, 2010. 43(23): p. 10031-10037.
6. Moulé, A.J. and K. Meerholz, Controlling Morphology in Polymer–Fullerene Mixtures. advanced materials, 2008. 20(2): p. 240-245.
7. Chen, D., et al., P3HT/PCBM Bulk Heterojunction Organic Photovoltaics: Correlating Efficiency and Morphology. Nano Letters, 2011. 11(2): p. 561-567.
8. Krebs, F.C., Fabrication and processing of polymer solar cells: A review of printing and coating techniques. Solar Energy Materials and Solar Cells, 2009. 93(4): p. 394-412.
29
9. Richards, J.J., K.M. Weigandt, and D.C. Pozzo, Aqueous dispersions of colloidal poly(3-hexylthiophene) gel particles with high internal porosity. Journal of Colloid and Interface Science, 2011. 364(2): p. 341-350.
10. Jin, S.-H., Optimization of process parameters for high-efficiency polymer photovoltaic devices based on P3HT:PC BM system. Solar Energy Materials & Solar Cells, 2007. 91: p. 1187-1193.
11. Gunduz, B., Electrical and photoconductivity properties of p-Si-P3HT-Al and p-Si/P3HT:MEH-PPV/Al organic devices: Comparison study. Microelectronic Engineering, 2012. 98: p. 41-57.
12. Yang, H. and P. Jiang, Large-Scale Colloidal Self-Assembly by Doctor Blade Coating. Langmuir, 2010. 26(16): p. 13173-13182.
13. Darwis, D., et al., Surfactant Free P3HT ∕ PCBM Nanoparticles for Organic Photovoltaics (OPV). 2011: p. 120-123.
14. Darwis, D., et al., High-Performance Thin Film Transistor from Solution-Processed P3HT Polymer Semiconductor Nanoparticles. 2011: p. 124-127.
15. Hu, Z., et al., Correlation between spectroscopic and morphological properties of composite P3HT/PCBM nanoparticles studied by single particle spectroscopy. Journal of Luminescence, 2010. 130(5): p. 771-780.
16. Millstone, J.E., Structural and Electronic Properties of Surfactant-Free, Size-Controlled Poly(3-hexylthiophene) Nanoparticles.
17. Landfester, K., Semiconducting polymer nanospheres in aqueous dispersion prepared by a miniemulsion process. 2002.
18. Johannes, P., Nanoparticles of Conjugated Polymers. Chem. Rev., 2010. 110(10): p. 6260-6279.
19. Labastide, J.A., et al., Time- and Polarization-Resolved Photoluminescence of Individual Semicrystalline Polythiophene (P3HT) Nanoparticles. The Journal of Physical Chemistry Letters, 2011. 2(17): p. 2089-2093.
20. Venkatraman, B.H., Organic Nanoparticles for Photovoltaic and Sensing Applications. UMASS Amherst Ph.D Dissertation, 2011.
21. Dudenko, D., et al., A Strategy for Revealing the Packing in Semicrystalline π-Conjugated Polymers: Crystal Structure of Bulk Poly-3-hexyl-thiophene (P3HT). Angewandte Chemie International Edition, 2012. 51(44): p. 11068-11072.
22. Millstone, J.E., et al., Synthesis, Properties, and Electronic Applications of Size-Controlled Poly(3-hexylthiophene) Nanoparticles. Langmuir, 2010. 26(16): p. 13056-13061.
30
23. Clark, J., et al., Role of Intermolecular Coupling in the Photophysics of Disordered Organic Semiconductors: Aggregate Emission in Regioregular Polythiophene. Physical Review Letters, 2007. 98(20) 206406.
24. Brown, P., et al., Effect of interchain interactions on the absorption and emission of poly(3-hexylthiophene). Physical Review B, 2003. 67(6) 064203.
25. Scharsich, C., et al., Control of aggregate formation in poly(3-hexylthiophene) by solvent, molecular weight, and synthetic method. Journal of Polymer Science Part B: Polymer Physics, 2012. 50(6): p. 442-453.