preparation of topographic map using applications …
TRANSCRIPT

International Journal of Scientific Research and Engineering Development-– Volume 4 Issue 2, Mar- Apr 2021
Available at www.ijsred.com
ISSN : 2581-7175 ©IJSRED: All Rights are Reserved Page 681
PREPARATION OF TOPOGRAPHIC MAP USING APPLICATIONS OF GPS
AND GIS TECHNIQUES: THE CASE OF TEPI CAMPUS
HABTAMU GIRMA TEFERI
Lecturer, Department of Surveying Engineering, Assosa University/College of Engineering, Assosa,
Ethiopia
Email: [email protected]
Departmentof Surveying Engineering, Assosa University/College of Engineering,
Assosa, Ethiopia
Email: [email protected]
ABSTRACT
Topographic maps have proved to be effective, legitimate, and convincing media to demonstrate to
external agencies how the community value, understands interacts with its traditional lands and
immediate space. From cave/wall paintings, ancient maps of Babylon and Greek philosophers, through
the Age of Exploration, and on into the 21st century, people have created and used maps as the
essential tools to help them define, explain and navigate their way through the world. Topographic
maps represent features on the earth's surface through symbols and labels; separate colors distinguish
the main classes of map features. But at the Tepi campus the main problem; there is no clear
topographic map prepared to explain land features and slopes of up and down of land. So, this makes
that information gap on a topographic map scale, the purpose of the map. The main objective of this
study was to describe the preparation of a topographic map using the application of GIS and GPS
techniques.
This study specifically focuses on the preparation of a topographic map; identify the information of
contour and the triangulation irregular network of the enclosed area. The method used for this study
was to collect field data of each feature of Tepi campus using GPS instrument and downloading in the
office the collected data.Some of the surveying instruments and software used to prepare this
topographic map was GPS instrument (Trimble R8 receiver), GPS, GIS, and AutoCAD. After the field
RESEARCH ARTICLE OPEN ACCESS

International Journal of Scientific Research and Engineering Development-– Volume 4 Issue 2, Mar- Apr 2021
Available at www.ijsred.com
ISSN : 2581-7175 ©IJSRED: All Rights are Reserved Page 682
data was downloaded; the researcher was given a scientific name for each feature and digitizes the
futures using GIS software.
The result of this study where including a prepared topographic map of Tepi campus, the slope
analyzed by surfer 32 software, and triangulation irregular networkprepared by GIS software. The
prepared topographic map of Tepi campus was shows both the natural and manmade features. Such as;
forests, rivers, roads, fences, buildings, and vehicle parks.
Finally, prepared a topographic map of Tepi campus, triangulation irregular network, surface
analysis, and the slope that identify elevations all features of the study area.
Keywords: Topographic MapPreparation, GIS, GPS, Triangular Irregular Network
1. INTRODUCTION
1.1 Background
The map is described as documents showing a structure on the world or another celestial body, which is
made with abstract characteristics, with a particular scale on a flat surface in a graphical and
photogrammetric way. These strategic information sources have usually been preserved in palaces and
military bases because of the value of the information they contain. Maps are one of the oldest written
information resources. Maps are usually seen as being used in military operations and wars. For this
reason, when the map is named, firstly wars come to mind. However, maps are used in many fields
except this field and they can be prepared differently according to these fields. This shows that it is
necessary to control the maps, produce them according to particular rules and apply different rules in
access and organization of them. Cartography, which knows as mapping or surveying map, had not
seen as a science and application field at first. Considering the historical process, it is known that the
first maps were drawn in the shape of plans and included narrower lands. These map drawings have
been seen in Mesopotamia, where the civilization occurred, for the first time. However, the first
remnant resembling a map (in fact a city plan) was found in the excavations of Çatalhöyük and this is
dated 6200 B.C. This plan is in the Museum of Anatolian Civilizations in Ankara (Bagrow, 1964:2-3;
Brock, 2001). Another important map is the first world map drawn on a clay tablet by the Babylonians
(Bagrow, 1964:31; Bricker, 1968:11; Brown, 1949:33, 37).
Maps are now everywhere, from the Web to smartphones, and are no longer limited to paper maps for
hiking or routing. But most of the maps provided to the general public are not good maps, so they are
International Journal of Scientific Research and Engineering Development-– Volume 4 Issue 2, Mar- Apr 2021
Available at www.ijsred.com
ISSN : 2581-7175 ©IJSRED: All Rights are Reserved Page 683
not as effective as they could be. Whether they are static or dynamic (i.e. pan and zoom allowed), on
paper or screens of variable sizes, good maps are maps where every feature is legible, and where the
user can easily understand the geography behind the map and the message of the map (Production of
Topographic Maps with VGI: Quality Management and Automation Guillaume Touya*, Vyron
Antoniou**, Sidonie Christophe*, Andriani Skopeliti**).
Topographic mapping to describe any features found on the earth's surface by its symbol. For this
project, it is possible to identify (describe) the objects on a map or topographic mapping. The feature
that found in MizanTepi university Tepi campus such as building, different of road, pole, river,
different types of trees, a reservoir of water electric pole and describes the parking of the road on the
map. To prepare the topographic mapping of the Tepi campus by using different types of surveying
instruments such as global position system (GPS), total station and using surveying software
geographical information system (GIS), softdesk8, and other software.
1.2 Statement of the problem
National Mapping Agency (NMA) is a national organization of which main objective is to produce
topographic maps for the governmental and private sectors. The normal standard products are used by
several different organizations for different purposes. The users require information either in analog or
digital forms according to their applications. As digital technology is introduced, NMA is expanding its
products to some extent. But the whole system of NMA is remaining in a traditional way that is fit to
produce analog topographic maps (Redesign of Topographic Mapping System using Unified Modeling
Language (UML) by Kwon, Tae – Sub March 2020).
Topographic mapping data must collect for any project of engineering work. In Tepi campus to
construct any design work used the oldest topographic mapping. So for this construction design, we
must prepare the modern topographic map of the Tepicampus. Because the previous or old topographic
map ofTepi campus does not include the new building, newroad, waste disposal storage, or biogas
building. So, this problem is the main factor to know the information feature of a topographic map of
Tepi campus. But the new one is describing all features found on the topographic map of Tepi campus
with a clear symbol for a person who can get more information about the project area of the map. The
topographic map of the Tepi cannot prepare in modern form because the construction of the building
does not complete, road networks are complex, temporary construction of building, temporary types of
the electric pole and pipelines.

International Journal of Scientific Research and Engineering Development-– Volume 4 Issue 2, Mar- Apr 2021
Available at www.ijsred.com
ISSN : 2581-7175 ©IJSRED: All Rights are Reserved Page 684
The topographic map of Tepi campus has no practical purpose full for the current usage of the activity
of the university, as it is understood by the research members for current planning of the campus
infrastructure like electric line distributions, temporary construction like student and teacher lunch
temporary house store of material, temporary toilet, uncompleted building construction, current land
deformation analysis, the foundation of geo-spatial products, information concerning landscape
elements and selecting new pipeline routes demands a new updated topographic map of the campus.
Because of the listed reasons developing an updated and proper topographic map is necessary.
1.3 Objectives of thestudy
1.3.1 General objective
The main objective of this study was the preparation of topographic mapping of Tepi campus using the
application of GIS and GPS.
1.3.2 Specific objectives
To achieve the main objective, several sub-objectives have to be achieved. These are listedbelow.
� To identify the position of natural and manmade features of the study area usinga coordinate system
(X, Y, and Z).
� To identify land features of Tepi campus by using the contour and elevation.
� To generating triangulation irregular network and surface analysis of Tepi campus.
� To prepare topographic map by using GPS application and GIS software.
1.4 Research question study
To achieve the research objective, the following questions need to be addressed.
1. How to identify the position of the features?
2. How to describe the land feature of Tepi campus on a map?
3. How to generate a triangulation irregular network and analyze the surface of Tepi campus?
4. How to prepare a topographic map of Tepi campus?
1.5 Scope of the study
The scope of this study was the preparation of a Topographic Map of the Tepi Campus. The
Topographic Map was showed all-natural and man-made features of the Tepi Campus which should be
International Journal of Scientific Research and Engineering Development-– Volume 4 Issue 2, Mar- Apr 2021
Available at www.ijsred.com
ISSN : 2581-7175 ©IJSRED: All Rights are Reserved Page 685
enclosed under the study area. All the on-going improvements and construction in theCampus should
be shown as well as the future land expansion and development areas.
1.6 Significance of the study
The Topographic Map of the Tepi Campus was used for different activities and might prove beneficial
to the whole Campus Community specifically for the Civil Engineering, Planning and surveying
Engineering Department. It would help the University's Planners to prepare comprehensive land use
and land cover map of the Campus as well as for the preparation map of a Campus development plan
for the next 20 years.Generally, this study helped to established vertical accuracy, horizontal control,
boundary determination of the deformation, and selection of new planning pipelines.
1.7 Limitation of the study
The study area was limited to the Tepi Campus and its immediate surroundings. The data gathering tool
for the location of points is the Global Positioning System. The accuracy of the collection of point
coordinates was highly dependent on the availability of satellites. Insufficient satellite during data
collection period the result was the poor or erroneous location of points.
Lack of an old topographic map of the Tepi Campus and some data are missing and unreliable to use as
reference materials. The conduct of the study was only one semester but the preparation of a
topographic map by manual or conventional topographic mapping survey is for 6 months or more. The
final map might not be as accurate as to how I wanted it to be. The following are the different
limitations: Lack of time, Lack of reference materials (old maps, etc.) for the preparation of the
Topographic Map, and an insufficient number of satellites during the GPS topographic survey.
2. LITERATURE REVIEW
The map is described as documents showing a structure on the world or another celestial body, which is
made with abstract characteristics, with a particular scale on a flat surface in a graphical and
photogrammetric way. These map drawings have been seen in Mesopotamia, where the civilization
occurred, for the first time. However, the first remnant resembling a map (in fact a city plan) was found
in the excavations of Çatalhöyük and this is dated 6200 B.C. This plan is in the Museum of Anatolian
Civilizations in Ankara (Bagrow, 1964:2-3; Brock, 2001). Another important map is the first world

International Journal of Scientific Research and Engineering Development-– Volume 4 Issue 2, Mar- Apr 2021
Available at www.ijsred.com
ISSN : 2581-7175 ©IJSRED: All Rights are Reserved Page 686
map drawn on a clay tablet by the Babylonians (Bagrow, 1964:31; Bricker, 1968:11; Brown, 1949:33,
37).
Topographic maps produced and published by government agencies usually include both physical and
cultural features, making the maps useful in municipal planning, civil engineering, watershed, and other
environmental studies, design of communication systems, and outdoor recreation, among others. The
influence of topography is important because it controls the water subsurface contact time (Beven and
Kirkby, 1979; Wolock et al., 1990; Dillon and Molot, 1997; McGuire et al., 2005).and tan is the local
slope (Beven and Kirkby, 1979; Quinn et al., 1995). The TWI represents the wetness distribution in a
catchment, and it has frequently been used in modeling. This process can help identify key areas of
conflict and help narrow the tension to identifiable, and subsequently manageable,
units(http://www.ga.gov.au/topographic-mapping/basics/what-is-a-topographic-map.html).
A comprehensive physical survey of the planning area can be carried out using total station survey
equipment. Several details are surveyed ranging from all built features, roads, natural elements, levels,
etc(Application ofremotesensing, GIS, andGPSforefficient urban managementplan–Acasestudyofpartof
Hyderabad city AdeyinkaK.Akanbi,Santosh Kumar,UwayaFidelis).
GPS is the only system today able to show the exact position of features above or on the earth. 24GPS
satellites are continuously monitored by ground stations located worldwide. The satellites transmitthe
signals that can be detected by anyone with a GPS receiver. Using a GPS receiver, the surveyorcan
determine the designated location with great precision (Redesign of Topographic Mapping System
using Unified Modeling Language (UML) by Kwon, Tae – Sub, March 2020).
GISs have been developed since the mid1980s. These systems consist of a series of physical elements
(hardware), logical elements (software), and personnel, targeted at the acquisition, storage, processing,
and representation of geographic information for a given purpose (Improving the Use of GPS, GIS, and
Remote Sensing in Setting upMaster Sampling Frames, January 2015).
GPS relative positioning, on the other hand, employs two GPS receivers simultaneously tracking the
same satellites. If both receivers track at least four common satellites, a positioning accuracy level on
the order of a few meters to millimeters can be obtained. GPS relative positioning is used for high-
accuracy applications such as surveying and mapping, GIS, and precise navigation (Shaw, M., K.
Sandhu, and D. Turner, "Modernization of the Global Positioning System," GPS World, Vol. 11, No. 9,
September 2000, pp. 36–44.).
International Journal of Scientific Research and Engineering Development-– Volume 4 Issue 2, Mar- Apr 2021
Available at www.ijsred.com
ISSN : 2581-7175 ©IJSRED: All Rights are Reserved Page 687
3. DESCRIPTION STUDY OF THE AREA
3.1 Location of the area
The location of the project area is in the Southern Nation Nationalities and People's Region part of
Ethiopia in State, Sheka- Zone, YekiWereda at a Distance of 611 km from Addis Ababa. The
astronomical location of the Tepi town has a latitude and longitude of 7°12′N &35°27′E and
7.20°N35.45°E, respectively, with a mean elevation of 1,097 meters above sea
level(http://en.wikipedia.org/wiki/Tepi#Overview.en.wikipedia.org/.../Southern_Nations,_Natio
nalities,_and_Peoples'_Regi).
The Mizan Tepi University has two campuses Mizan Campus. At the Tepi Campus, some different
features or objects can be found such as buildings, different types of roads, streams, green areas, and
biogas building or storage. These buildingsare divided into different parts depending on their location
and service. The first one is the building found around the office and lab class with a different design.
The second one is the building around the female dormitories and male dormitories. The shape of these
buildingsis similar. The third building of the Engineering and Technology Library &Computer
Technology Library has the same shape.The figure below is the location of the Tepi Town on the map
of Ethiopia. The town is located in the southern part of the country with coordinates 7°12′N35°27′E and
the elevation is 1,097 m. The location of the project area, which is the Tepi Campus, is at coordinates
796870N Latitude and 766022E Longitude with an elevation of 1262m and comprising an area of
approximately 52 hectares(http://en.wikipedia.org/wiki/Mizan_-_Tepi_University,National
Geographic: Round Earth, Flat Maps). This location can be seen on the satellite images taken from the
world earth Google.

International Journal of Scientific Research and Engineering Development-– Volume 4 Issue 2, Mar- Apr 2021
Available at www.ijsred.com
ISSN : 2581-7175 ©IJSRED: All Rights are Reserved Page 688
Figure: 3.1 Location of the Tepi Campus (source: GIS and Google Earth map)
3.1 The weather condition of the study area
3.1.1 Rainfall
The rainfall was important for the different fruits such as mango, coffee, bananas, papaya, and different
kinds of fruits. The mean annual rainfall varies from 1000 to 1800 mm. But the estimated rainfall to be
well over 2200mm. the highest rainfall season between June and September. The monthly minimum
rainfall is 70 mm and the monthly maximum rainfall is 200mm. The mean annual precipitation is
around 2100mm.
Table: 3.1 Mean monthly rainfalls (mm)
Months Jan Feb Mar Apr May June July Aug
Rainfall(mm) 9 24 48 57 114 144 180 189

International Journal of Scientific Research and Engineering Development
ISSN : 2581-7175
3.1.2 Temperature
The temperature is very hot and changes in different weeks, months. This hot temperature is important
for plantations of coffee and other fruits. There are displays as the following according to the
metrological description. The maximum mean annual tempera
Celsius up to 35 degrees Celsius. The minimum
degrees Celsius up to 15 degrees Celsius. The average warmest month is 28degree Celsius and the
average coldest month is 12 degrees Celsius.
The temperatures are highest on average in May, at around 27.6 °C. At 26.2 °C on average, December
is the coldest month of the year.
924
48
0
50
100
150
200
Jan Feb Mar
International Journal of Scientific Research and Engineering Development-– Volume 4 Issue 2, Mar
Available at www.ijsred.com
©IJSRED: All Rights are Reserved
Figure: 3.2Rainfall graph
The temperature is very hot and changes in different weeks, months. This hot temperature is important
for plantations of coffee and other fruits. There are displays as the following according to the
metrological description. The maximum mean annual temperature of the location area is 25 degrees
Celsius up to 35 degrees Celsius. The minimum mean annual temperature of the location area is 10
degrees Celsius up to 15 degrees Celsius. The average warmest month is 28degree Celsius and the
s 12 degrees Celsius.
Figure: 3.3 Temperature graph
The temperatures are highest on average in May, at around 27.6 °C. At 26.2 °C on average, December
57
114
144
180 189
Apr May Jun Jul AugRainfall(mm)
Volume 4 Issue 2, Mar- Apr 2021
www.ijsred.com
Page 689
The temperature is very hot and changes in different weeks, months. This hot temperature is important
for plantations of coffee and other fruits. There are displays as the following according to the
ture of the location area is 25 degrees
annual temperature of the location area is 10
degrees Celsius up to 15 degrees Celsius. The average warmest month is 28degree Celsius and the
The temperatures are highest on average in May, at around 27.6 °C. At 26.2 °C on average, December
International Journal of Scientific Research and Engineering Development
ISSN : 2581-7175
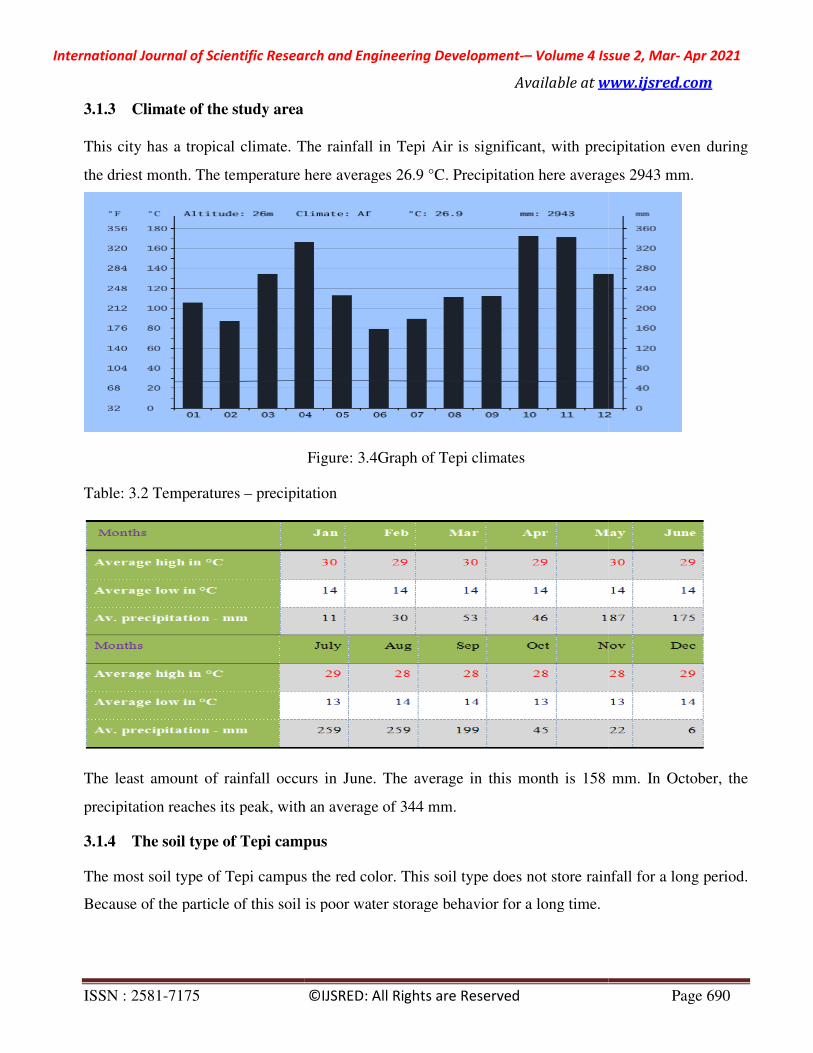
3.1.3 Climate of the study area
This city has a tropical climate. The
the driest month. The temperature here averages 26.9 °C. Precipitation here averages
Table: 3.2 Temperatures – precipitation
The least amount of rainfall occurs in June. The average in this month is 158 mm. In October, the
precipitation reaches its peak, with an average of 344 mm.
3.1.4 The soil type of Tepi campus
The most soil type of Tepi campus the red color. This soil type does not store rainf
Because of the particle of this soil is poor water storage behavior for a long time
International Journal of Scientific Research and Engineering Development-– Volume 4 Issue 2, Mar
Available at www.ijsred.com
©IJSRED: All Rights are Reserved
This city has a tropical climate. The rainfall in Tepi Air is significant, with precipitation even during
The temperature here averages 26.9 °C. Precipitation here averages
Figure: 3.4Graph of Tepi climates
precipitation
t of rainfall occurs in June. The average in this month is 158 mm. In October, the
precipitation reaches its peak, with an average of 344 mm.
The soil type of Tepi campus
The most soil type of Tepi campus the red color. This soil type does not store rainf
Because of the particle of this soil is poor water storage behavior for a long time.
Volume 4 Issue 2, Mar- Apr 2021
www.ijsred.com
Page 690
rainfall in Tepi Air is significant, with precipitation even during
The temperature here averages 26.9 °C. Precipitation here averages 2943 mm.
t of rainfall occurs in June. The average in this month is 158 mm. In October, the
The most soil type of Tepi campus the red color. This soil type does not store rainfall for a long period.

International Journal of Scientific Research and Engineering Development-– Volume 4 Issue 2, Mar- Apr 2021
Available at www.ijsred.com
ISSN : 2581-7175 ©IJSRED: All Rights are Reserved Page 691
4. METHODOLOGY
4.1 Fieldwork
The first method of study is reconnaissance the study area or visiting the area, to draw the freehand
sketch for doing the next steps. Reconnaissance has visited the area before collecting the data from the
site location area. In this part they can get further information gained through site investigation by
asking the local inhabitants, different passengers from the study area and also topographic views of the
area, soil types of the area, natural and manmade features of the area, and weather condition of the area
such as rainfall temperature of studying moments as the Site Engineer.Data collection is the gathering
of information from a particular source for various purposes. This data collection is used different
techniques:
� Interview, Observation, and From written documents
Interview:-is the primary data collection type includes: - asking the person to know about the location
of the study area deeply.
4.2 Material used in fieldwork
They are different surveying instrument used for the collection of data from the field location. Now a
day the accuracy of this instrument is very high to save time and also put the full information about the
study area in the modern form.
Global position system (GPS):-is the space-based global navigational satellite system that provides
reliable location and time information in all weather and at all times. It can measure the distance;
coordinate points to the required minimum of three trilateration range points.
Figure: 4.1 GPS controllerand Receiver
International Journal of Scientific Research and Engineering Development-– Volume 4 Issue 2, Mar- Apr 2021
Available at www.ijsred.com
ISSN : 2581-7175 ©IJSRED: All Rights are Reserved Page 692
4.2.1 Selection of Receiver Type
Receiver selection can be a complex process due to the large number of GPS receivers available and
their range of capabilities and intended applications are widely varied.
It is suggested that all GPS receivers used together for relative positioning be of the same make to
avoid problems that often result from mixing receiver types such as biases and complexities in data
processing and data rate incompatibilities.
The receiver used must be capable of collecting the measurements needed for the desired positioning
techniques, e.g., for both single point positioning and relative positioning. For Kinematic, Rapid Static,
and Conventional Static GPS surveys, code and carrier measurement receivers are required. For a short
baseline using a conventional technique, a single frequency receiver is sufficient.
For this research, a dual-frequency GPS receiver was used together with relative positioning to
accurately locate the different manmade and natural features of interest within the Tepi Campus.
4.2.2 Rover receiver
The rover receiver should have been turned on at the same time the base receiver was powered up; this
allowsthe rover receiver to collectsatellite data. After thereceiver collects satellites make sure that the
rover receiver chosen to connect with the GPS receiver uses the down arrow to toggle between
receivers.Make sure you have a radio icon on the screen then go to Survey, pick your Survey Style, and
pick start Survey from the menu.
4.3 Office work
There are different types of office work that were done during the preparation of the topographic map.
These are starting from downloading field data into the computer using different software. Then
connect the controller with the computer by the cable of the controller. After connects the controller
with the computer they select folder name from the controller and right-click on the folder name and
export it into the computer. Then the data downloaded is transferring into Trimble business center that
can put in excel forms. General different material or software is used in the preparation of the
topographic map. These areGPS (Controller, GPS receiver, pointer, and antenna).
� Arc GIS, AutoCAD, Google Map, Map Source, and Excel are also main software to process the
collected. For example, the excel data is the main objective to start the future work to prepare a
topographic map of MizanTepi University Tepi campus.

International Journal of Scientific Research and Engineering Development-– Volume 4 Issue 2, Mar- Apr 2021
Available at www.ijsred.com
ISSN : 2581-7175 ©IJSRED: All Rights are Reserved Page 693
The data that can be transferring into excel is describing as the following:
Table 4.1 Excel data
The above excel data was the basis for any work research activities like to draw (connect points) using
polylines by Auto CAD software and imported into GIS. The above data contained X, Y, and Z values
of natural and manmade features of the enclosed study area start to point 1 to 1470.

International Journal of Scientific Research and Engineering Development
ISSN : 2581-7175
4.4 Methodology design process
The general methodology supported by fieldwork like reconnaissance data collection and office work
of computer applications soft wares like AutoCAD, GIS, and Microsoft office excel, Microsoft office
word, Microsoft office Microsoft PowerPoint, etc, based
International Journal of Scientific Research and Engineering Development-– Volume 4 Issue 2, Mar
Available at www.ijsred.com
©IJSRED: All Rights are Reserved
ss
Figure: 4.2 Methodology process
The general methodology supported by fieldwork like reconnaissance data collection and office work
of computer applications soft wares like AutoCAD, GIS, and Microsoft office excel, Microsoft office
ce Microsoft PowerPoint, etc, based on mapping system preparation;
Volume 4 Issue 2, Mar- Apr 2021
www.ijsred.com
Page 694
The general methodology supported by fieldwork like reconnaissance data collection and office work
of computer applications soft wares like AutoCAD, GIS, and Microsoft office excel, Microsoft office
on mapping system preparation; data

International Journal of Scientific Research and Engineering Development-– Volume 4 Issue 2, Mar- Apr 2021
Available at www.ijsred.com
ISSN : 2581-7175 ©IJSRED: All Rights are Reserved Page 695
interpretation, and data generation has occurred. This thesis is highly dependent on the collection of
spatial data.
5. RESULTS AND DISCUSSIONS
5.1 Data analysis and features generating
Analysis of data was a process of inspecting, cleansing, transforming, and modeling data to discover
useful information, suggesting conclusions, and supporting decision making. Data analysis has multiple
facets and approaches, encompassing diverse techniques under a variety of names, in different business,
sciences, and social science domains. Data analysis was the process of systematically applying
statistical and or logical techniques to describe and illustrate and data analysis was the organization of
raw data to extract useful information.
The collected basic data, information of field data contained such as field survey, control point data,
coordinates of each building corner, fences, road curves, trees, poles, and stream data by using GPS
instrument, data conversion can follow before these data can be analyzed.
The raw GPS data was converted to its useable format using software which in turn is transferred to
AutoCAD software for the plotting of the points and digitization of the line features.
The process of data collection, processing, and analysis is done as follows: Downloading, Exporting,
Plotting, Importing, Connecting the point on the AutoCAD software, and Transferring into GIS
software
5.1.1 Downloading Data
Downloading means a process of transferring field data into the computer by using different software.
Such processing where explains as following:
I. Open Trimble GeomaticsOffice and open the project. There is a triangle in the middle of the
screen whichis a baseposition imported fromwork.
II. Then go to “Files” “Import” “SurveyDevice” study data and pick Survey Controller on
ActiveSync Connect the TSC2 to the computer and choose the correct data collectorfile
toimport. Make surethe “convert to datacollectorfile definition” is checked, hit OK
III. To import files doubleclick on the triangle and see the updated Latitude, Longitude, and
ellipsoid height along with the Northing easting andelevation

International Journal of Scientific Research and Engineering Development-– Volume 4 Issue 2, Mar- Apr 2021
Available at www.ijsred.com
ISSN : 2581-7175 ©IJSRED: All Rights are Reserved Page 696
The files from the data collector are in the Trimble Data file. Copy the *.csv (the file named above) and
*.job (the name of the project)and click the OK button on the Transfer Complete message. The *.csv
file can be TSC2 files and saved to the desired directory. Note that saving the *.job file to the computer
is a backup of the survey if the data were to be lost in the TSC2. If a message pops up on the computer
regarding an error in copying, go to the data collector and make sure that the file is in Excel. After data
is downloaded and the data is saved in CSV format, open in notepad and transfer into Auto CAD.
5.1.2 Exporting data
The exporting data was the data that can save on excel is transferring into AutoCAD. This step was as
following:
� To select only easting and northing the data from excel then drug the data to transfer into excel
and save the data on the desktop by using the common delimited method.
� The other one is to Right-click on the folder and transferring the data into AutoCAD software
by using a notepad.
Table: 5.1 Data in notepad form

International Journal of Scientific Research and Engineering Development
ISSN : 2581-7175
5.1.3 Plotting the exported data
Plotting means in this study they are
software. But Export data from the current field book to AutoCAD and connect similar features with
each other's by polyline and make object’s layer current.
Figure: 5.1
The above figures described that each feature was connected by AutoCAD. The amylases of this were
used polyline and points according to the standards of AutoCAD software.
5.1.4 Importing the data
The importing data was transferring the drawing data into GIS software by using different steps
techniques. The importing of this drawing data was used to prepare a map by
importing data passes through many procedures such as: (i) Open ArcGIS to use Arc Map
Toolbox conversion tool for creating geo
the file is found. After the drawingwas
coordinate system and otheruseful
International Journal of Scientific Research and Engineering Development-– Volume 4 Issue 2, Mar
Available at www.ijsred.com
©IJSRED: All Rights are Reserved
Plotting the exported data
Plotting means in this study they are connecting the exported data by using GIS and AutoCAD
software. But Export data from the current field book to AutoCAD and connect similar features with
nd make object’s layer current.
e: 5.1 Topographic maps drawn by AutoCAD
The above figures described that each feature was connected by AutoCAD. The amylases of this were
used polyline and points according to the standards of AutoCAD software.
transferring the drawing data into GIS software by using different steps
of this drawing data was used to prepare a map by
passes through many procedures such as: (i) Open ArcGIS to use Arc Map
ing geo-database and(ii) Import from CAD Under input s
After the drawingwas imported, (iii) create the shape file on the Arc catalog with
information.
Volume 4 Issue 2, Mar- Apr 2021
www.ijsred.com
Page 697
using GIS and AutoCAD
software. But Export data from the current field book to AutoCAD and connect similar features with
The above figures described that each feature was connected by AutoCAD. The amylases of this were
transferring the drawing data into GIS software by using different steps or
of this drawing data was used to prepare a map by GIS software. The
passes through many procedures such as: (i) Open ArcGIS to use Arc Map to get
Import from CAD Under input select where
on the Arc catalog with the

International Journal of Scientific Research and Engineering Development-– Volume 4 Issue 2, Mar- Apr 2021
Available at www.ijsred.com
ISSN : 2581-7175 ©IJSRED: All Rights are Reserved Page 698
Figure: 5.2 AutoCAD data imported into GIS
5.2 Data interpretation
5.2.1 The process of map design
The map was a graphical representation, at an established scale, of a part of the earth's surface, showing
important natural and manmade features in their correct positions relative to a coordinate reference
system and each other.
In this study, the map design was dependent on the raw data that can be collected from the field using
different GPS instruments, and the data transferred into a computer using AutoCAD and GIS software.
So, topographic map design was started from this raw data. However, data collection was only the first
step. The map design was very important because a map is a form of communication. The map reader
sees the geographic image on the map and to know the feature that is found on the map with full
description reader person is easily understand.Unlike verbal communication in which the speaker or
writer can control the sequence in which information is transmitted and received, the map maker has
little control over how the map user will view and interpret the map. So, the map user can understand
the information of the map that can be included in the map description.The map includes the following
points: Clarity,Order, and Balance.

International Journal of Scientific Research and Engineering Development-– Volume 4 Issue 2, Mar- Apr 2021
Available at www.ijsred.com
ISSN : 2581-7175 ©IJSRED: All Rights are Reserved Page 699
5.2.2 Features analyzing on topographic map
To make maps more readable, contours are classified and the classes are distinguished by different
weights and styles of lines. Index contours every fourth or fifth contour, depending on the basic
interval- -are accentuated by making the line wider than the other contours. Supplementary contours,
used on the flatter areas of some maps, are shown as dashed or dotted lines. Elevation figures are
shown on the contour line at frequent intervals to facilitate their identification, as well as to assist in
determining the value of adjacent contours. The two main reasons for showing relief information on
maps are to furnish coordinated data for engineering calculations or other scientific measurements and
to present a graphic picture of the ground surface. The two objectives are related but distinct, and
sometimes they may be conflicting.
Measurement:-For engineers or scientists who are interested in exact measurement, topographic maps
furnish dimensional information about elevations, areas, grades, and volumes. The approximate
elevation of any point can be read directly or interpolated from contours. A series of elevations on a
line determines the grade or profile of the line, and areas and volumes can be computed by combining
line profiles in various ways. The relief information shown by contours is sufficient for calculating the
storage capacity of a reservoir, the area of a watershed, or the volume of earth to be moved in a large
road cut or fills.
Interpretation:-On the other hand, many persons who use maps are not concerned with exact ground
elevations but are more interested in the general appearance and shape of the land. For them, contours
are the graphic means ofvisualizingthe terrain and aid in locating positions on the map.
5.2.3 Selection in mapping relief features
The amount of relief information that can be shown on a map depends largely upon the scale often map
and the contour interval used to portray the relief. If a great amount of relief detail is required, the scale
must be enlarged and the contour interval made smaller; but regardless of the scale and contour
interval, all information concerning the ground surface cannot be shown on maps. The mapmaker must
always make a judicious selection of the features that it is desirable to portray.
Choosing a contour interval: - A topographic map shows the varying shapes, heights, and slopes of a
landscape using contour lines. That's why they are so useful for bushwalking, property mapping, and
even town planning. Contour Lines are curves that connect points of equal elevation. Contours are lines

International Journal of Scientific Research and Engineering Development-– Volume 4 Issue 2, Mar- Apr 2021
Available at www.ijsred.com
ISSN : 2581-7175 ©IJSRED: All Rights are Reserved Page 700
that connect points at the same height above sea level and are plotted using vertical aerial photographs.
The closer these contours arethe steeper the gradient. However, the height difference between one line
and the next is always the same throughout the map. This is called the contour interval.
Contour generating by the surfer software
In this study Surfer software was generating the contour in different shapes that describe the interval of
contour with the different shapes. The field data that collected was transferring into the surfer then the
software puts the contour in different shapes like in three dimensions (3d) and other shapes.
Figure: 5.3 Contour of Tepi campus analyzed by Surfer 32
765400.00 765600.00 765800.00 766000.00
796000.00
796100.00
796200.00
796300.00
796400.00
796500.00
796600.00
796700.00
796800.00
796900.00

International Journal of Scientific Research and Engineering Development-– Volume 4 Issue 2, Mar- Apr 2021
Available at www.ijsred.com
ISSN : 2581-7175 ©IJSRED: All Rights are Reserved Page 701
Figure: 5.4 Three dimension of the contour of Tepi campusanalyzed by Surfer 32
5.3 Prepare Topographic map
In this study elements that are found generally on a map, specifically on topographic maps include the
distance or scale, direction, legend, sources of information and how the map was processed, orientation,
and location.
5.4 Spatial analysis of the study
The process of examining the data and analyzed the relationships of features in spatial data through
overlay and other analytical techniques to address a question or gain useful knowledge. Spatial analysis
extracts or creates new information from spatial data.
5.5 Triangulation Irregular network (TIN)
Triangulations are a form of vector-based digital geographic data and are constructed by triangulating a
set of vertices points. A vector data structure that partitions geographic space into contiguous, no
overlapping triangles. The vertices of each triangle are sample data points with x, y, and z values. These
sample points are connected by lines to form Delaunay triangles. TINs are used to store and display
surface models.
5.5.1 The storing of TIN
In this study, the coverage of TIN is stored as a directory of files. Note, however, that a TIN is not
covered and has no associated information files. A TIN directory contains seven files containing
1210.00
1215.00
1220.00
1225.00
1230.00
1235.00
1240.00
1245.00
1250.00
1255.00
1260.00
1265.00
1270.00
1275.00
1280.00

International Journal of Scientific Research and Engineering Development-– Volume 4 Issue 2, Mar- Apr 2021
Available at www.ijsred.com
ISSN : 2581-7175 ©IJSRED: All Rights are Reserved Page 702
information about the TIN surface. These files are encoded in binary format and are not readable by
standard text display or editing programs. So, the triangulation irregular network of this study was
stored as the following using GIS software.
Figure: 5.5 Triangulation of Tepi campuses analyzed by GIS
In the above figure, the elevation of each triangular irregular network shape was described in a different
color. So each elevation had minimum and maximum values.
5.6 Surface analysis by Slope
The slope is the incline, or steepness, of a surface. The slope can be measured in degrees from
horizontal (0–90), or percent slope (which is the rise divided by the run, multiplied by 100). A slope of

International Journal of Scientific Research and Engineering Development-– Volume 4 Issue 2, Mar- Apr 2021
Available at www.ijsred.com
ISSN : 2581-7175 ©IJSRED: All Rights are Reserved Page 703
45 degrees equals 100 percent slope. As slope angle approaches vertical (90 degrees), the percent slope
approaches infinity. The slope of a TIN face is the steepest downhill slope of a plane defined by the
face. In this study, theslope for a cell in a raster was the steepest slope of a plane defined by the cell and
its eight surrounding neighbors. The slope of the Tepi campus was described as following:
Figure: 5.6 The Slope of Tepi campus analyzed by GIS
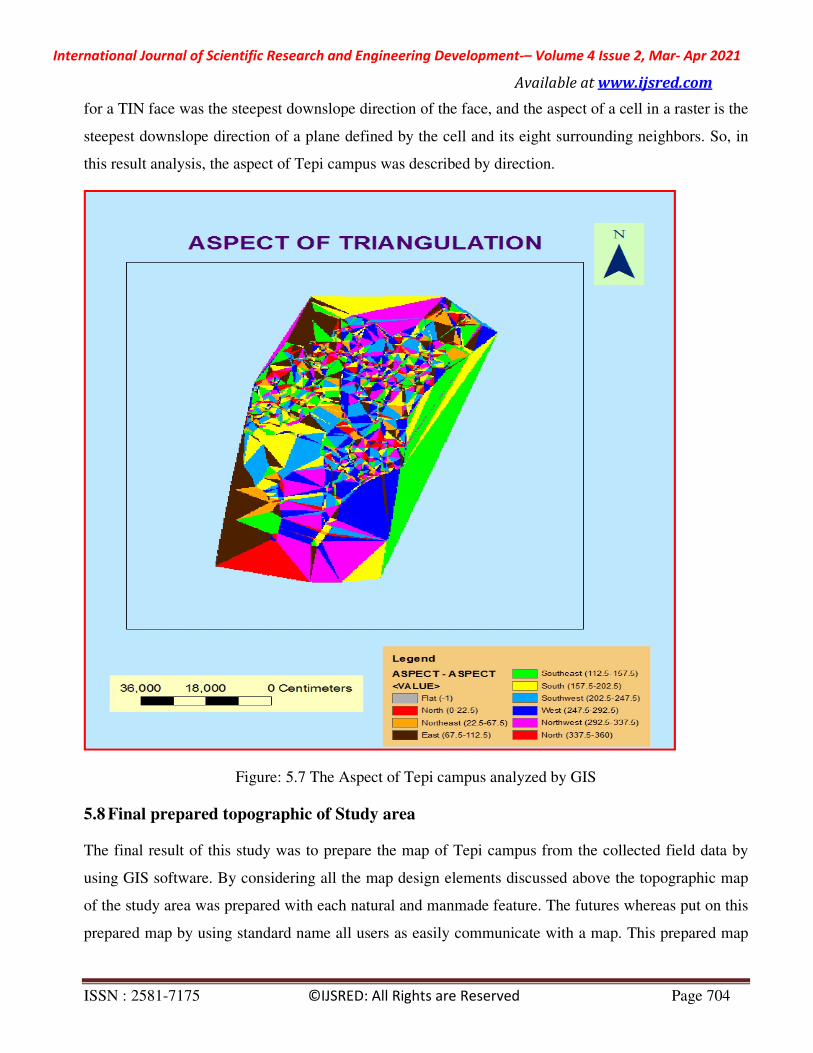
5.7 Analysis of Aspect triangulation
The compass direction that a topographic slope faces, usually measured in degrees from north. In this
study, aspects can be generated from continuous elevation surfaces. For example, the aspect recorded
International Journal of Scientific Research and Engineering Development-– Volume 4 Issue 2, Mar- Apr 2021
Available at www.ijsred.com
ISSN : 2581-7175 ©IJSRED: All Rights are Reserved Page 704
for a TIN face was the steepest downslope direction of the face, and the aspect of a cell in a raster is the
steepest downslope direction of a plane defined by the cell and its eight surrounding neighbors. So, in
this result analysis, the aspect of Tepi campus was described by direction.
Figure: 5.7 The Aspect of Tepi campus analyzed by GIS
5.8 Final prepared topographic of Study area
The final result of this study was to prepare the map of Tepi campus from the collected field data by
using GIS software. By considering all the map design elements discussed above the topographic map
of the study area was prepared with each natural and manmade feature. The futures whereas put on this
prepared map by using standard name all users as easily communicate with a map. This prepared map

International Journal of Scientific Research and Engineering Development-– Volume 4 Issue 2, Mar- Apr 2021
Available at www.ijsred.com
ISSN : 2581-7175 ©IJSRED: All Rights are Reserved Page 705
was containing each building type, road type, river, trees, pole, and other natural and manmade
features. Each feature was prepared by using different colors to easily understand. The prepared
topographic map of the Tepi campus based on existing features was detail explained as following
Figure.
Figure: 5.8. Prepared Topographic map of Tepi campusanalyzed by GIS

International Journal of Scientific Research and Engineering Development-– Volume 4 Issue 2, Mar- Apr 2021
Available at www.ijsred.com
ISSN : 2581-7175 ©IJSRED: All Rights are Reserved Page 706
6. CONCLUSION AND RECCOMANDATION
6.1 Conclusions
The preparation of a topographic map was very necessary for any work activities to run their job in any
country and different area of work that can be done for existences and the future. Now a day's the
topographic map are very essential in diverse fields of work, which are very common in the day-to-day
activity of human beings such as the design of the road, study of the contour interval, and knowledge
building construction area. As abroad use of the topographic map in a diverse field after expanding a lot
of skill and effort on this study, helps to increase the capacity of producing a well-organized
topographic map. While undergoing GPS (R8 Rover) selected for data collection in connection with
Controller, preferred using soft desk civil survey, GPS, and GIS software to process the field data into
the computer. The topographic map of the Tepi campus includes different features (objects) that can be
found in nature and artificial (manmade). This study was used for the following purposes. Such as to
exercise or explore skills in making a map, has a great role on behalves of upgrading potential to
produce a map (topographic map).
The preparing of topographic map is the detail work because the feature that can be found in that area is
representing in their symbol to describe full information about the feature. So, a topographic map is
used for the university to study the slopes, elevation, maximum contour interval, minimum contour
interval, the location of infrastructure, and different types of construction.
Generally, the prepared topographic map showed the all features of the ground surface on the paper by
using their symbol, color, size, and different shapes. After expending a lot of effort on the thesis and
producing well organized and qualified topographic map which serves as an internationally accepted
topographical map.
6.2 Recommendations
The preparation of a topographic map is highly used fully for a different purpose if the data was
collected carefully by a modern instrument like a GPS satellite receiver. So, the recommendation was
lists as following:
In this study, the data collection was done only by GPS instrument due to resource (budget)
limitations. So it is recommended that for the data collection using the different modern
instruments to minimize the error.

International Journal of Scientific Research and Engineering Development-– Volume 4 Issue 2, Mar- Apr 2021
Available at www.ijsred.com
ISSN : 2581-7175 ©IJSRED: All Rights are Reserved Page 707
Enough the chance of using different software during the preparation of the topographic map.
The map designer and all engineer was getting the chance of know all features that found in
the enclosed study area with the full information.
A student and department which they will do the different project related with the map were
used as a reference.
In this study, the map was prepared by GIS and AutoCAD software. If the map designer
wanted that in three dimensions I recommended that using sketch-up software.
REFERENCES
History of map and important map collections in Turkey Hakan Anameric, Bagrow, 1964:2-3; Brock,
2001
History of map and important map collections in Turkey Hakan Anameric, Bagrow, 1964:31; Bricker,
1968:11; Brown, 1949:33, 37.
Production of Topographic Maps with VGI: Quality Management and Automation Guillaume Touya*,
Vyron Antoniou**, Sidonie Christophe*, Andriani Skopeliti.
Redesign of Topographic Mapping System using Unified Modeling Language (UML) by Kwon, Tae –
Sub March 2020.
Beven and Kirkby, 1979; Wolock et al., 1990; Dillon and Molot, 1997; McGuire et al., 2005
https://www.sciencedirect.com/science/article/abs/pii/002216949390063F, Beven, 1986; Wolock et al.,
1989
Using official map data on topographic, wetlands, and vegetation cover for prediction of stream water
of chemistry in a boreal headwater catchment, Andersson and Nyberg, 2008)
Beven and Kirkby, 1979; Quinn et al., 1995
http://www.ga.gov.au/topographic-mapping/basics/what-is-a-topographic-map.html.
Application of remote sensing, GIS and GPS for efficient urban management plan–A case study of
part of Hyderabad city Adeyinka K.Akanbi, Santosh Kumar, Uwaya Fidelis
International Journal of Scientific Research and Engineering Development-– Volume 4 Issue 2, Mar- Apr 2021
Available at www.ijsred.com
ISSN : 2581-7175 ©IJSRED: All Rights are Reserved Page 708
Improving the Use of GPS, GISand Remote Sensing in Setting upMaster Sampling Frames, January
2015
Shaw, M., K. Sandhu, and D. Turner, "Modernization of the Global Positioning System," GPS World,
Vol. 11, No. 9, September 2000, pp. 36–44.
http://en.wikipedia.org/wiki/Tepi#Overview.en.wikipedia.org/.../Southern_Nations,_Nationalities,_and
_Peoples'_Regi
http://en.wikipedia.org/wiki/Mizan_-_Tepi_UniversityNational Geographic: Round Earth, Flat Maps
ACKNOWLEDGEMENT
First of all, I would like to thank you, my Advisor,Engr. Rex Alfonso who help us how I can prepare
the thesis starting from the field data collection up to the final output. Secondly, I would like to
thankMr.Hailu G/Yohanis for his information on how I can prepare the topographic map and write the
document. Thirdly, I would like to thank you for my Surveying Engineering Department Head, Mr.
Wolu Hagos (MSc) to arrange the schedule of the lab period and arrange the use of the computers.
Finally,I would like to thank you Engr. Maria Nicetas Caluya for the editing of the final document and
Mr. Edget Ayele for the preparation of the Topographic Map, and the lab assistants who assisted me
with the instruments when I collected the field data.