preparation of ultrafiltration / microfiltration ceramic...
TRANSCRIPT

Preparation of Ultrafiltration / Microfiltration
Ceramic Composite Membranes for
Biotechnology Applications
By
İlker Erdem
A Dissertation Submitted to the Graduate School in Partial Fulfillment of the
Requirements for the Degree of
Master of Science
Department: Biotechnology and Bioengineering Major: Biotechnology
İzmir Institute of Technology İzmir, Turkey
October 2002

ii
We approve the thesis of İlker ERDEM Date of Signature .................................... 07.10.2002 Prof. Dr. Muhsin ÇİFTÇİOĞLU
Supervisor
Department of Chemical Engineering
....................................... 07.10.2002
Prof. Dr. Şebnem HARSA
Co-Supervisor
Department of Food Engineering
........................................ 07.10.2002
Assoc. Prof. Dr.Mustafa GÜDEN
Department of Mechanical Engineering
......................................... 07.10.2002
Assist. Prof. Dr. Funda TIHMINLIOĞLU
Department of Chemical Engineering
....................................... 07.10.2002
Prof. Dr. Şebnem HARSA
Head of Interdisciplinary
Biotechnology Program

iii
ACKNOWLEDGEMENTS
I would like to express my special thanks to my major advisor Prof. Dr. Muhsin
Çiftçioğlu not only for his guidance and supervision and also for his encouragement and
support throughout this study. I also wish to offer my sincere thanks to Prof. Dr.
Şebnem Harsa for her guidance and support.
I am grateful to the Research Funding Accountancy for supporting the work and
Mehmet Keçeciler and Evrim Özveren for their hard working in the accountancy.
I would like to thank to my colleagues (in alphabetical order) R. Çiftçioğlu, G.
Erdoğan, N. Gaffaroğlu, H. Göksungur, N. Gültekin, D. Oğuz, F. Özmõhçõ, B. Öztürk,
Z. Polat, M. Sudağõdan, D. Şimşek, N. Tatlõdil, B. Topuz, B. Üzelyalçõn, G. Yelken, O.
Yõldõrõm for their priceless contribution during the study.
I want to express my thanks to Cihangir Dereobalõ from PINAR SÜT for
supplying whey, Tamer Çakõcõ from POLİTEK for guidance and technical support and
my uncle Ali Ballõ for his support by supplying opportunities for computer work.
Finally, I am grateful to my parents and relatives, for their endless support,
patience and encouragement. I am indebted to them for their trust and love.
İlker Erdem

iv
Abstract
Ceramic membranes possess desirable properties for industrial separation
and concentration processes where extreme conditions of heat, pH, ionic strength
are present. Ceramic composite membranes consisting of a support and a thin
membrane layer with finer pores were prepared in this work. Ceramic supports
were prepared from fine alumina and zirconia powders by dry-pressing and slip-
casting. These supports were sintered in the 1100-1200°C temperature range.
These supports were dip-coated with ceramic sols prepared from zirconium
propoxide and aluminium isopropoxide for the preparation of thin layers with
finer pores. Average particle sizes of these sols were measured as 3-7 nm for
zirconia sol and 30-40 nm for alumina sol by laser scattering technique. The dip-
coated membranes were calcined in the 500-600°C temperature range. The
thermal characterization of membrane layers was determined with DTA/TGA.
The microstructure of the ceramic composite membranes was investigated with
SEM.
The clean water permeability (CWP) of membranes was tested by using
deionised water in a filtration set-up. Separation experiments were performed with
bovine serum albumin (BSA, Stokes diameter: 7 nm) solution and whey to
determine protein separation capacity of the composite membranes. The CWP of
the dry pressed alumina supports heat treated at 1100°C was found to be higher
than the permeability of the slip-cast zirconia supports heat treated at 1200°C. The
protein retention of the slip-cast zirconia support was detected as 60% with UV-
VIS spectrophotmeter analysis (Abs. at 280nm). After the modification of the
support with dip-coating protein retention of 96% was achieved. Then the
composite membranes were used in whey protein concentration experiments.
Whey, which is a complex biological liquid, containing proteins, carbohydrate,
minerals, was fed to the membrane without any clarification process. The
retention of whey proteins with dry-pressed alumina support modified with 1/4
diluted zirconia sol (calcination temperature: 500°C) was found to be 96% with a
permeate flux of 40 Lm-2hour-1.
v
Öz
Seramik süzekler, õsõ, pH, iyonik kuvvet değerlerinin uç değerlerde
bulunduğu sõnai ayrõştõrma ve yoğunlaştõrma işlemleri için gerekli özelliklere
sahiptirler. Bu çalõşmada, bir destek ve daha ince gözeneklere sahip bir zar
tabakasõndan oluşan seramik karma süzekler hazõrlandõ. Seramik destekler, ince
alumina ve zirkonya tozlardan kuru baskõlama ve alçõ üzerine kalõba döküm
yöntemleri kullanõlarak hazõrlandõ. Bu destekler 1100�1200°C sõcaklõk aralõğõnda
pişirildi. Pişirilen destekler daha ince gözeneklere sahip ince bir tabaka
oluşumunu sağlamak için alüminyum izopropoksit ve zirkonyum propoksitten
hazõrlanan seramik sollerine daldõrõlarak kaplandõ. Bu sollerin ortalama parçacõk
boyutlarõ, lazer saçõlõmõ tekniği kullanõlarak, zirkonya solü için 3�7 nm ve
alumina sol için 30�40 nm olarak ölçüldü. Daldõrõlõp kaplanan zar süzekler 500-
600°C sõcaklõk aralõğõnda õsõl işleme tabi tutuldular. Zar süzek tabakanõn õsõl
nitelendirilmesi DTA (Diferansiyel Isõl Analiz)/TGA (Isõl Ağõrlõk Analizi) ile
gerçekleştirildi. Seramik karma süzeklerin mikro yapõlarõ SEM (Taramalõ
Elektron Mikroskobu) ile incelendi.
Süzeklerin saf su geçirgenliği (SSG) deiyonize su kullanõlarak bir süzme
düzeneğinde ölçüldü. Karma süzeklerin protein ayõrõm kapasitelerini belirlemek
için sõğõr serum albumin (BSA, Stoke çapõ = 7 nm) çözeltisi ve peynir altõ suyu
kullanõlarak ayrõştõrma denemeleri gerçekleştirildi. Kuru baskõlanmõş ve 1100°C�
de õsõl işleme tabi tutulmuş alumina desteğin saf su geçirgenliği, alçõ üzerine
kalõba dökülen ve 1200°C� de õsõl işleme tabi tutulan zirkonya desteğin
geçirgenliğinden daha yüksek olarak ölçülmüştür. Alçõ üzerinde kalõplanan
zirkonya desteğin protein tutma oranõ UV-VIS spektrofotometre kullanõlarak
(280 nm dalgaboyundaki absorbanõ) %60 olarak belirlendi. Desteğin daldõrõlõp
kaplanarak değiştirilmesinden sonra %96� lõk bir protein tutmaya ulaşõldõ.
Proteinler, karbonhidrat, mineraller içeren karmaşõk bir biyolojik sõvõ olan peynir
altõ suyu süzeğe hiçbir saflaştõrma işlemi uygulanmadan beslendi. Kuru
baskõlanmõş ve 1/4 seyreltilmiş zirkonya sol ile kaplanõlarak 500°C� de õsõl işleme
tabii tutulup değişime uğratõlmõş alumina desteğin peynir altõ suyundaki
proteinleri %96 oranõnda tuttuğu bulundu.

vi
TABLE OF CONTENTS
LIST OF FIGURES ����������������������. viii
LIST OF TABLES...����������������������. xi
Chapter 1 INTRODUCTION ������������������.. 1
Chapter 2 MEMBRANES ���������............................................ 3
2.1. History of Membranes ���������������� 3
2.2. Classification of Membranes �..������������ 5
2.2.1. Membranes According to Their Material ��������. 6
2.2.1.1. Polymeric Membranes �..�������������. 7
2.2.1.2. Inorganic Membranes ��������������� 8
Chapter 3 MEMBRANE PROCESSES ����..�...��������.. 13
3.1. Classification of Membrane Processes ���������... 13
3.2. Membrane Processes in Food Industry and Biotechnology �� 15
3.2.1. Membrane Processes for Downstream Applications ���... 15
3.2.2. Membrane Processes for Protein Separation
and Fractionation �������������������� 17
Chapter 4 EXPERIMENTAL ����������������.��. 22
4.1 Materials ���������������������... 22
4.2 Preparation and characterization of ceramic
composite membranes ��������������...���. 22
4.2.1 Preparation and characterization of ceramic supports ��..� 22
4.2.2 Preparation and characterization of ceramic sols ��...��... 24
4.2.3 Formation and characterization of Thin Selective
Layers on Supports ������������������.� 25

vii
4.3 Filtration Experiments ����������������.. 25
4.3.1 Filtration Set-up ������������������ 25
4.3.2 Analysis During Filtration �������������� 27
Chapter 5 RESULTS & DISCUSSION ��������������.. 29
5.1 Membrane Preparation and Characterization �������.. 29
5.2 Separation Experiments ���������������... 45
5.2.1. The Clean Water Permeability (CWP) ��������� 45
5.2.2. The Protein Retention (PR) �������������. 46
Chapter 6 CONCLUSIONS & RECOMMENDATIONS �������... 52
REFERENCES ������������������������. 54

viii
LIST OF FIGURES
Figure 1. The separation process by filtration ������������.. 3
Figure 2. Classification of filters ...�������������............... 5
Figure 3. Porous structure formed by consolidation of suspensions ���� 9
Figure 4. Organic shell formed by acacH (Black dots are Zr, grey
dots are oxo, hydroxo bridges, chains of white dots are
acacH group) (Zr10O8(OPr)18(acac)6) ������������
11
Figure 5. The comparison of productivities for the batch and bioreactor
fermentation........................................................................................
16
Figure 6. The classification of milkproteins ..................................................... 18
Figure 7. The filtration set-up �..�����������������. 26
Figure 8. The diagram of the filtration set-up������������� 27
Figure 9. Calibration curve for direct absorbance reading at 280 nm ............. 28
Figure 10. Calibration curve for whey proteins prepared with BSA for
using in the Lowry Method (absorbance at 660 nm) .........................
28
Figure 11. Particle size distribution of alumina powder �..�������... 29
Figure 12. SEM picture of cold pressed alumina support surface
heat treated at 1100°C .����������������...... 30
Figure 13. SEM picture of cold pressed alumina support surface
heat treated at 1100°C �����.�����������..� 31
Figure 14. SEM picture of zirconia support surface heat treated at 1200°C ..� 31
Figure 15. Particle size distribution of zirconia sol detected with Zetasizer �.. 32
Figure 16. Particle size distribution of alumina sol detected with Zetasizer ...... 33
Figure 17. TGA of zirconia unsupported membrane ���������...... 34
Figure 18. XRD analysis of zirconia unsupported membrane calcined
at 500°C ����������������������..... 35
Figure 19. TGA of alumina unsupported membrane ....���������.. 35

ix
Figure 20. XRD analysis of alumina unsupported membrane calcined
at 500°C ����������������������..... 36
Figure 21. XRD analysis of alumina unsupported membrane calcined
at 600°C ���������������������..�... 36
Figure 22. BJH pore size distribution of alumina unsupported membrane
calcined at 500°C �...���������������..��. 37
Figure 23. BJH pore size distribution of alumina unsupported membrane
calcined at 600°C �...�����������������... 37
Figure 24. SEM picture of dry pressed alumina support surface heat
treated at 1100°C and partially coated with alumina sol
calcined at 600°C at 15 kX ��������...������� 39
Figure 25. SEM picture of the alumina sol coated 600°C calcined
Membrane on dry pressed alumina support heat treated
at 1100°C at 150 kX �����������������.�. 39
Figure 26. SEM picture of slip-cast zirconia support heat treated at
1200°C at 150 kX ������������������.... 40
Figure 27. SEM picture of slip-cast 1200°C heattreated zirconia support
coated with 500°C calcined zirconia sol at 5 kX .��.�����. 40
Figure 28. SEM picture of slip-cast 1200°C heat treated zirconia support
coated with 500°C calcined zirconia sol at 25 kX ..�����..�. 41
Figure 29. SEM picture of slip-cast 1200°C heat treated zirconia support
coated with 500°C calcined zirconia sol at 100 kX �...����� 41
Figure 30. SEM picture of slip-cast 1200°C heat treated zirconia support
coated with 500°C calcined zirconia sol at 250 kX ...������ 42
Figure 31. SEM picture of slip-cast 1200°C heat treated zirconia support
coated with 500°C calcined zirconia sol at 25 kX .������� 42
Figure 32. SEM picture of slip-cast 1200°C heat treated zirconia support
coated with 500°C calcined zirconia sol at 50 kX �������. 43
Figure 33. SEM picture of slip-cast 1200°C heat treated zirconia support
coated with 500°C calcined zirconia sol at 100 kX ���...��� 43
Figure 34. SEM picture of slip-cast 1200°C heat treated zirconia support
coated with 500°C calcined zirconia sol at 120 kX �...����� 44

x
Figure 35. SEM picture of slip-cast 1200°C heat treated zirconia support
coated with 500°C calcined zirconia sol at 150 kX ........................... 44
Figure 36. The clean water permeability of slip-cast zirconia membrane
heat treated at 1200°C at different transmembrane pressures ......... 46
Figure 37. The clean water permeability of dry pressed alumina membrane
heat treated at 1100°C at different transmembrane pressures ��.. 46
Figure 38. Protein (BSA) retention of slip-cast zirconia support
(heat treated at 1200°C)�����������������. 47
Figure 39. Protein (BSA) retention of 500°C calcined alumina coated
slip-cast zirconia support ................................................................... 48
Figure 40. Protein (BSA) retention of 600°C calcined alumina coated
slip-cast zirconia support ................................................................... 48
Figure 41. Protein (BSA) retention of 500°C calcined zirconia coated
slip-cast zirconia support ................................................................... 49
Figure 42. Protein (BSA) retention of 500°C calcined diluted zirconia sol
coated slip-cast zirconia support ....................................................... 49
Figure 43. The change of flux with transmembrane pressure during BSA
filtration with 1:4 diluted zirconia sol coated 500°C calcined
selective layer/1200°C heat treated zirconia slip-cast support
composite membrane ��..���������������... 50
Figure 44. The change of protein retention with transmembrane pressure
during BSA filtration with 1:4 diluted zirconia sol coated 500°C
calcined selective layer/1200°C heat treated zirconia slip-cast
support composite membrane .��������������... 50
Figure 45. Whey protein retention vs. time with 500°C calcined 1:4 diluted
zirconia sol coated 1100°C heat treated dry-pressed alumina
support �����������������������... 51
Figure 46. Permeate flux vs. time with 500°C calcined 1:4 diluted zirconia
sol coated 1100°C heat treated dry-pressed alumina support ��� 51

xi
LIST OF TABLES
Table 1. Methods of manufacture of synthetic membranes ........................... 6
Table 2. Materials used in the manufacture of membranes �����.�... 12
Table 3. The membrane processes according to the driving force ................. 14
Table 4. The pressure driven membrane processes with working
pressure and target material size ��.�������..���... 15
Table 5. The composition of whey ................................................................. 17
Table 6. The materials used in experimental work and their specifications .. 23
Table 7. The molar sol content ����������.�������.. 24
Table 8. The mean particle sizes of zirconia sols with different acid
contents �����������������������. 33
Table 9. Results from nitrogen adsorption / desorption analysis of alumina
unsupported membrane ����������������... 37

Chapter 1
INTRODUCTION
In biotechnology, the downstream processes are important steps in production
which affect the product quality and economics directly. The separation and purification
of valuable organic materials (like enzymes, proteins, organic acids, amino acids,
antibiotics, etc.) from aqueous media, with a reliable method is always in concern. The
fragility of such organic products forces the producers to use non-destructive methods
for separation and concentration. This prevents usage of evaporation, in which heat
application takes place at high temperatures. The other alternative for obtaining product
from aqueous media is lyophilization which is non-destructive but very expensive. The
membrane processes are considered to be the best solution for separation and
concentration since they are non-destructive and relatively economic. There is neither
heat application which will deteriorate the product, nor any energy consumption for
changing the phase of water.
In membrane processes, the separation is performed due to the difference
between the sizes of the materials to be separated. For this purpose membranes which
are selective to the target material aimed to be separated are needed. The first
membranes were natural polymers. Nowadays membranes made of polymers or
inorganic materials (ceramic) are used. The inorganic ones may be thought as better
choices due to their higher thermal, chemical, physical, microbiological stability.
Although the initial investment for a filtration system with ceramic membranes is higher
than the ones with polymeric membranes, due to the long life and better operating
opportunities of ceramic membranes, it becomes more economical to use ceramic
membranes, in long term. The ceramic membranes are also good alternatives in
biotechnology and food industries. Since thermal or chemical sterilization is needed in
such industries, the membranes should be compatible to steam or chlorine sterilization.
Ceramic membranes are compatible to such conditions and have a rigid structure which
will not shrink under pressure application. They are also stable to microbiological
attacks. Cot et al (2000) stated that �A connected microporous structure in supported
ceramic films can be created from a non aggregated nanoparticulate sol with individual
2
nanoparticles of less than 10 nm. Such materials offer attractive properties when used as
ceramic nanofilters. Ceramic nanofilters are being recognized as being of growing
importance due to increasing demands for membrane systems able to separate ions and
small molecules in harsh working conditions (high temperature, extreme pH, organic
solvent media)�.
In this study, ceramic membranes for biotechnological processes were prepared
with dry-pressing or slip-casting of ceramic powders (alumina or zirconia) to get a
porous supports which are mechanically strong enough for high pressure filtration
processes, and modification of these supports with sol-gel methods, to have a thin
membrane layer over these supports which has finer pores and enables separation of
smaller molecules.

3
Chapter 2
MEMBRANES
A membrane is a thin barrier, which is selectively permeable. It allows passage
of some components, which form the permeate, and retains the others, which form the
retentate. The membrane may be solid, liquid or gas. Generally, solid membranes are
widely used and the others are used for some specific processes. Solid membranes may
be classified as inorganic and polymeric membranes. The latter ones have been used for
a longer time.
Figure 1. The separation process by filtration.
2.1. History of Membranes
Abbe Nolet, in 1748, observed that, when a bladder filled with brackish water is
put into water, expands, although there is the tension of the bladder making it difficult.
In 1854, Graham, with curiosity of observing the deflating of a toy balloon, made
experiments with different gases and realised some gases leave the balloon faster. That
was due to the osmotic pressure. (Howell et al, 1993)
Such experiments increased the curiosity and research on the topic. In 1855,
Fick developed the first polymeric synthetic membrane made of nitrocellulose. Then
Traube and Pfeffer also prepared artificial membranes. These were generally prepared
by dissolving the polymer (nitrocellulose) with a suitable solvent (alcohol, ether or
acetic acid) and by evaporating the solvent after pouring the solution on a flat plate. The
first quantitative measurements about diffusion and osmotic pressure were performed
with these membranes. Benchold developed methods to control the pore size of

4
membranes by controlling the evaporation rate in 1907. The research activities on
membranes increased rapidly between 1870 and 1920. Especially, van�t Hoff�s theory
about dilute solutions and Gibbs� work on the relationship between the osmotic pressure
and other thermodynamic properties were important. (Cheryan, 1998)
In the light of such studies, the first commercial membrane was produced in
1927. These commercial membranes were being used for the removal of
microorganisms and particles from fluid streams. In 1950s, Samuel Yuster, predicted
that, it should be possible to produce potable water from brine, using Gibbs adsorption
isotherm. Further experimental work showed that it was possible to get potable water
from brine, but the efficiency was very low. Between 1958 and 1960 Sourirajan, tried to
heat the membrane and predicted that, this would cause the enlargement of pores, and
this enlargement will be preserved after cooling. He thought that, this enlargement
would cause a higher flux. But in fact when the cellulose acetate ultrafiltration
membranes were heated the pores over the surface shrank and this caused in an
asymmetric structure throughout the membrane. But this new membrane, surprisingly,
allowed a higher flux and a higher rejection of salts. This was a milestone in membrane
technology. (Cheryan, 1998)
In 1970s ultrafiltration was performed widely in electropaint and dairy
industries. Several polymeric membranes were produced from different polymers. The
Journal of Membrane Science was started in 1973, indicating the increasing interest to
membrane research. (Howell et al, 1993)
Another progress was the introduction of ceramic membranes, which were under
investigation since 1940s in the industry. The energy crisis caused a great interest in
nuclear power plants, which were in need of high concentrations (3%) of 235U . 235U is
naturally present in Uranium with a quantity of 0.7%. The concentration was being
increased by mass spectroscopy and this was an expensive method. The gas diffusion
concentration process with ceramic membranes in the nuclear power plants has been
using the same ceramic membranes for over 20 years in the industrialised countries
(Bhave, 1991).
In 1980s gas separation and pervaporation units were taken into operation
(Cheryan, 1998, Howell et al, 1993). In 1990s, a great progress was achieved in the
membrane industry, with an increase in the number of entrepreneur firms and the
variety of membrane process equipment (Howell et al, 1993).

5
2.2. Classification of Membranes
The filters can be classified into two sub groups, as depth and screen, according
to their structure (Figure 1). The depth filters keep the retentate in its matrix of fibres or
beads, made of cotton, fibreglass, asbestos, sintered metals, diatomaceous earth, etc.
These filters are generally used as dead-end filters for retention of 0.01 µm particles.
(Cheryan, 1998)
The screen filters are retaining target material on their surface like a sieve.
Membrane filters are screen filters. The screen filters are more advantageous since there
is a relatively high recovery due to the absence of losses in the depth of filter, and since
they have a rigid structure, microbial growth is not a frequent problem. (Cheryan, 1998)
Screen filters may be classified as microporous and asymmetric. Microporous
filters may also be classified as isotropic, in which the pores are uniform in size
throughout the membrane, and anisotropic, in which the pore size change from one
surface to the other. Asymmetric membranes have a relatively thin skin layer, which has
Filters
Depth Screen Microporous Asymmetric (Skinned) Isotropic Anisotropic Integrally Non-integrally Skinned Skinned
Figure 2. Classification of filters (Cheryan, 1998).

6
smaller pore sizes than the other layers of membrane and they may be classified into
integrally and non-integrally skinned membranes according to the form of this skin
layer. (Cheryan, 1998)
Microporous filters are much more susceptible to plugging than the asymmetric
membranes, but they are both effected from fouling and concentration polarization
(plugging: the plugging of pores with particles approximately the same size as the
pores, fouling: deposition of solid particles over the membrane surface, concentration
polarization: accumulation of material forming retentate over the membrane with a
higher concentration than it is in the feed, resulting in a retentate concentration gradient
which acts as a drawback for filtration) (Cheryan, 1998).
2.2.1. Membranes According to Their Material
Membranes may be manufactured from both organic and inorganic materials
and/or combinations of these, which form composite membranes. The methods for
manufacture of membranes are given in Table 1.
Table 1. Methods of manufacture of synthetic membranes (Cheryan, 1998). Process Materials
Phase inversion by Polymers
Solvent evaporation Cellulose acetate, polyamide
Temperature change Polypropylene, polyamide
Precipitant addition Polysulfone, nitrocellulose
Stretching sheets of partially crystalline polymers
Polymers: PTFE
Irradiation and etching Polymers: Polycarbonate, polyesters
Molding and sintering of fine-grain powders Ceramics, metal oxides, PTFE, PE

7
2.2.1.1. Polymeric Membranes
Organic membranes may be produced from polymers like cellulose acetate
(CA), polyamide (PA), polysulfone (PS), polyethersulfone (PES), etc. (Cheryan, 1998).
Cellulose acetate is the most widely used membrane material due to a number of
reasons like its hydrophilic nature which minimizes fouling, the possibility of the
preparation of membranes with a wide pore size range (for MF, UF, RO), its low cost
and relative easiness to handle. It has very important disadvantages besides the above
advantages. Its operating pH range is only limited to 3-6. It is very susceptible to
chlorine which is used very commonly for cleaning and sanitizing in the industry.
Pressure causes compaction of the membrane. The upper operating temperature limit is
30°C, and it is very biodegradable. In spite of all these disadvantages CA is commonly
used, especially for RO of the seawater to get potable water. (Cheryan, 1998)
Polyamide membranes contain � CONH � amide bond. Their operating pH
range is between pH 3-11, but their chlorine resistance is lower and biofouling are
higher than CA membranes. (Cheryan, 1998)
Polysulfone and polyethersulfone membranes have some considerable
advantages. They may be used in the pH range of 1-13 and up to the temperature of
75°C. It has moderate chlorine resistance and it is easy to handle during membrane
preparation in several configurations for a pore size range of 0.2 µm to 10°A, with
which MF and UF may be performed. It has good chemical resistance against aliphatic
hydrocarbons, fully halogenated hydrocarbons, alcohols and acids, but is affected by
aromatic hydrocarbons, ketones, ethers and esters. The hydrophobicity of these
materials is prone to fouling. Another disadvantage is the low operating pressure limits
(Cheryan, 1998). The main polymers used for membrane preparation and their
application processes are given in Table 2.
It is possible to enhance the properties of organic membranes by manufacturing
them with combinations of materials to combine their desired properties while
depressing undesired ones. The general methods for these purposes are:
- Casting the ultra thin barrier layer separately, followed by lamination to the
support film,
- Dip-coating of a solution of the polymer onto a microporous support and
drying, or dip-coating a reactive monomer or prepolymer solution followed by curing
with heat or irradiation,
- Gas-phase deposition of the barrier layer from a glow-discharge plasma,

8
- Interfacial polymerisation of reactive monomers on the surface of the support
film. (Cheryan, 1998)
Cellulose acetate and polyamide composite membranes were produced with
higher range of operating pH, temperature and pressure, with higher fluxes by using
such techniques. (Cheryan, 1998)
2.2.1.2. Inorganic Membranes
Inorganic membranes have presented great opportunities for the solution of
separation problems, by enabling filtration in severe conditions and allowed
development of several membrane processes. They are inert to common chemicals
(especially chlorine), can be used at elevated temperatures (e.g. 350°C, but it must be
considered that, to prevent from thermal shocks the membrane should be cooled
carefully after usage at elevated temperatures) and in a wide pH range (pH 1-14). They
are superior to organic polymeric membranes, and beside these superior properties,
inorganic ceramic membranes enable back flushing; feeding fluid from the permeate
side to clean up the accumulated solids over the membrane. This is done by the
application of a greater pressure than the normal feed pressure but in the opposite
direction. Their rigid structure prevents deformation under pressure. Beyond these
advantages inorganic membranes have relatively longer operating lifetimes (The
ceramic membranes produced for nuclear power plants are being used for over 20
years). They also have some disadvantages too. First of all, they (except stainless steel
ones) are brittle and they should be handled carefully. While using them a large
pumping capacity is needed to get the desired fluid velocity over the membrane.
Currently there are inorganic membranes for micro, ultra and nanofiltration, but not for
reverse osmosis. Another major disadvantage is their cost. A filtration system for
MF/UF with organic membranes cost approximately 10-18 times less expensive than
the one with ceramic membranes. However it should be kept in mind that, these are only
the initial costs. Since the inorganic membranes have longer operating lifetimes, they
are not needed to be changed often, that causes a decrease in labour cost, and since they
have a wider range of operating parameters with generally higher fluxes, they may be a
better choice in spite of their high initial cost. (Cheryan, 1998)
The inorganic membranes are classified into two main groups as dense (made of
metals or conductive oxides) and porous membranes (Cheryan, 1998, Bhave, 1991, Cot
et al, 2000). Pores can be due to the crystal structure (as in zeolites, clays minerals) or

9
due to void spaces formed by packing and consolidation of small particles (Cot et al,
2000). The IUPAC definition states that the pores with diameters above 50 nm are
macropores, with diameters between 2-50 nm are mesopores and with diameters smaller
than 2 nm are micropores (Howell et al, 1993, Cot et al, 2000).
Inorganic membranes may be manufactured from such materials like ceramics,
metals, carbon and glasses, by using different methods;
- Particle dispersion and slip casting,
- Phase separation and leaching,
- Anodic oxidation,
- Thin-film deposition,
- Track-etching. (Cheryan, 1998)
The most common inorganic membranes are ceramic membranes in asymmetric
structure (Lee and Pope, 1994). They are produced by forming thin selective layers,
with smaller pore sizes over supportive structures, with larger pores as seen in Figure 3
(Bhave, 1991, Cot et al, 2000, Lee and Pope, 1994). The supports may be carbon,
extruded ceramic or etched stainless steel.
The ceramic membranes suitable for microfiltration, with pore diameters of 0.1-
1 µm may be prepared by coextrusion of small and big ceramic particles,
simultaneously
Figure 3. Porous structure formed by consolidation of suspensions (Bhave,
1991).
to form the support and permselective layer, or it may also be prepared by casting a well
dispersed suspension of submicron ceramic powders on a support (Lee and Pope, 1994).
The ceramic powder suspension may be prepared with ceramic powders, water and a
binder like polyvinyl alcohol or ethylene glycol, which also acts a plasticizer, improving

10
the rheological properties of the slurry (Lee and Pope, 1994). After forming the desired
green body, heat treatment is applied to get a stabilized membrane structure. The heat
treatment conditions depend on the type of ceramic material.
For ultrafiltration, smaller pores are needed, so the voids between the particles
must be smaller. In other words the particles forming the membrane should have a
narrower size distribution than the ones in microfiltration membrane. Such small
particles may not be formed by using powders, but may be formed by sol-gel processes.
Sol-gel process enables production of well-dispersed colloidal structures, which may
form porous structures after consolidation. There are two main routes in sol-gel
processes, polymeric or colloidal (Bhave, 1991, Lee and Pope, 1994, Ward and Ko,
1995). These routes include dispersion of metal salt or metal-organic precursors,
formation of gel layer by the formation of contacts between polymeric or colloidal
particles, drying of the gel layer, and firing (Bhave, 1991, Lee and Pope, 1994, Ward
and Ko, 1995). The routes may be either acid catalysed or base catalysed (Bhave, 1991,
Lee and Pope, 1994, Ward and Ko, 1995). Smaller particles are formed by the acid
catalysed route and which will allow formation of smaller pore sizes (Bhave, 1991,
Ward and Ko, 1995). During sol-gel process the reactions of hydrolysis and
condensation occur:
Hydrolysis: - MOR + H2O - MOH + ROH
Condensation: - MOH + ROM - - MOM - + ROH or
- MOH + HOM - - MOM - + H2O
Here M(OR)n represents the precursor alkoxide (M = Zr, Al, Ti, Si, etc.).(Ward
and Ko, 1995, Loehman, 1993)
The size distribution of the particles in the sol depends on the lengths of the -
MOM- chains, formed in hydrolysis and condensation reactions. The variation of
experimental parameters for these reactions would make it possible to control particle
size distribution, which maybe used to form a layer with desired pore size distribution.
For this purpose, some additives (like acetyl acetone; acacH) are used,
M (OR)n + acacH M (OR)n-1(acac) + ROH

11
Here acacH reacts with the alkoxide to form complexes with different
physicochemical properties, with decreased hydrolysis tendencies. This prevents
formation of long chains, thus precipitation does not occur. An acacH / M ratio higher
than 1, allows preparation of a stable sol of nanoparticles. This may be achieved due to
the organic shell formed by acacH as schematically shown for Zr in Figure 2. For a Zr /
acacH ratio of 2, after heat treatment at 500°C, a mean grain size of 6 nm was
determined. In this membrane, packing of nanoparticles resulted in 1.4 nm pore
diameters and 18% porosity. (Cot et al, 2000)
Figure 4. Organic shell formed by acacH (Black dots are Zr, grey dots are
oxo, hydroxo bridges, chains of white dots are acacH group)
(Zr10O8(OPr)18(acac)6) (Cot et al, 2000).

12
Table 2. Materials used in the manufacture of membranes (Cheryan, 1998).
Material MF UF RO Alumina X Carbon � carbon composites X Cellulose esters (mixed) X Cellulose nitrate X Polyamide, aliphatic (e.g. nylon) X Polycarbonate (track-etch) X Polyester (track-etch) X Polypropylene X Polytetrafluoroethylene (PTFE) X Poly vinyl chloride (PVC) X Polyvinylidene fluoride (PVDF) X Sintered stainless steel X Cellulose (regenerated) X X Ceramic composites (zirconia on alumina) X X
Polyacrylonitrile (PAN) X X Polyvinyl alcohol (PVA) X X Polysulfone (PS) X X Polyethersulfone (PES) X X Cellulose acetate (CA) X X X Cellulose triacetate (CTA) X X X Polyamide, aromatic (PA) X X X Polyimide X X CA/CTA blends X Composites (e.g. polyacrylic acid on zirconia) X
Composites, polymeric thin film (e.g. PA on PS) X
Polybenzimidazole (PBI) X Polyetherimide (PEI) X

13
Chapter 3
MEMBRANE PROCESSES
The separation and purification of valuable organic materials from aqueous
media has been an important challenge in engineering. Several methods like filtration
(membrane processes), evaporation, freeze-drying, centrifugation, etc. are used for this
purpose. Among these, filtration processes are found to be preferable, since there is no
need for phase transformation during filtration, different than evaporation and freeze-
drying, which is economically advantageous. The heat applied during evaporation, for
phase transformation of liquid to gas may have severe effects on the heat sensitive
materials like enzymes, vaccines, antibiotics, etc. Freeze-drying, which also contains a
phase transformation, of solid to gas, may be used for heat sensitive materials, but it
also has some economical drawbacks. The only competitive alternative of filtration
seems to be centrifugation, with regards to versatility. But, a density difference between
the materials to be separated is needed for centrifugation, and the materials must be
immiscible. On contrary, the membrane processes allow even separation of dissolved
molecules, when suitable membranes are used. But it should be kept in mind that
absolute dryness can not be reached with membrane processes.
3.1. Classification of Membrane Processes
The classification of various membrane processes according to the driving force
used is given in Table 3. The pressure driven membrane processes have the advantage
of speeding up the transport process with increasing the hydraulic pressure. They cover
a wide range of applications with which several target materials may be separated which
is summarized in Table 4. Microfiltration (MF) is used generally for clarifying by the
separation of suspended particles in the size range of 0.1-10µm. Ultrafiltration (UF) is
used for separation of macromolecules like proteins from liquid media. Nanofiltration
(NF) is a relatively new technique, which may be used for separation of smaller species
than those separated by ultrafiltration and which utilizes lower operating pressures than
those applied in reverse osmosis. It may be used for desalination of liquid media and
separation of dissociated and undissociated salts. Reverse osmosis (RO), ideally, allow

14
total removal of dissolved/undissolved solids in the liquid media, with the application of
very high pressures, over the osmotic pressure of the target material. (Cheryan, 1998)
Table 3. The membrane processes according to the driving force (Cheryan,
1998).
Process Driving
Force Retentate
Permeate
Osmosis Chemical
potential
Solutes, water Water
Dialysis Concentration
difference
Large molecules,
water
Small molecules,
water
MF (micro-filtration) Pressure Suspended
particles, water
Dissolved solids,
water
UF (ultra-filtration) Pressure Large molecules,
water
Small molecules,
water
NF (nano-filtration) Pressure Small molecules,
divalent salts,
dissociated acids,
water
Monovalent ions,
undissociated
acids, water
RO (reverse osmosis) Pressure All solutes, water Water
Electrodialysis Voltage /
current
Charged species Oppositely
charged species
Pressure driven membrane processes may be used with great versatility as
mentioned above. The worldwide market of membrane processes, in 1998, was over 4
billion US $, with an annual growth rate of 8-10%. The share of pressure driven
membrane processes was 1.8 billion US $ (Strathmann, 2001). These processes are used
in several industries. There is extensive research on the exchange of other unit
operations with the pressure driven membrane processes, and economical advantages of
these exchanges (Mohr et al, 1989, Howell, 1990).

15
Table 4. The pressure driven membrane processes with working pressure and
target material size (Krijgsman, 1992, Cheryan, 1998).
Process
Target product size
(nm ; 10-9 m)
Pressure
(bar)
Micro-filtration (MF) 10,000 � 100 0.5 - 2
Ultra-filtration (UF) 400 � 2 2 - 10
Nano-filtration (NF) 5 � 0.5 10 � 30
Reverse Osmosis (RO) 1 � 0.1 35 - 100
3.2. Membrane Processes in Food Industry and Biotechnology
The general applications of membrane processes are well described in literature
(Cheryan, 1998, Strathmann, 2001, Mohr et al, 1989, Howell, 1990, Bhave, 1991).
In food industry;
- MF is used for removal of bacteria from milk (cold pasteurisation),
clarification of fruit juices and clarification of fermented alcoholic beverages (wine
&beer).
- UF is used for concentration of proteins (milk, soybean, egg, whey), cheese
production, removal of pigments from fruit juices
- NF is used for simultaneous partial demineralisation and concentration of
whey
- RO is used for concentration of whey and milk before evaporation.
Another application of membrane processes is separation of pyrogens, from
water, by UF. Pyrogens are known as endotoxins with molecular weights of 10,000-
200,000, which cannot be removed by MF or autoclaving (heat treatment) (Bhave,
1991).
3.2.1. Membrane Processes for Downstream Applications
Production of valuable organic materials like, antibiotics, alcohols, vaccines,
organic acids, by fermentation is an important application in biotechnology. The
fermentation process, which allows production of desired products with the aid of
cultivation of microorganisms, has several parameters for optimum product efficiency.

16
The fermentation broth contains product, microorganisms, other materials produced by
microorganisms, residual of nutrients which were fed into fermentor before and/or
during the fermentation, etc. The desired product produced by microorganisms during
fermentation must be separated from all the other components of fermentation broth
successively by using downstream processes. The pressure driven membrane processes
offer preferable choices due to the sensitivity of products to heat applications like
evaporation for this purpose.
The membrane processes allow new configurations for fermentation. The
increase in of product concentration in the fermentor generally causes an inhibition of
microorganism growth, which adversely affects production efficiency. This problem
may be solved by using a membrane process, by which the fermentation broth is fed to
the membrane, which is permeable for the product, but not for microorganisms or
nutrients. This configuration, called bioreactor, allowed an increase in the amount of
microorganisms (biomass) by a factor of 12 and increase in alcohol production by a
factor of 10, in Zymomonas mobilis fermentation, compared to batch configuration
(Moo-Young, 1985). The positive effect of bioreactor configuration on ethanol and
lactic acid fermentations can be seen on Figure 5 (Cheryan, 1998). The target material
in downstream processes may be the biomass (e.g. for vaccine production), which may
be achieved by using MF, too.
Figure 5. The comparison of productivities for the batch and bioreactor
fermentation (Cheryan, 1998).
17
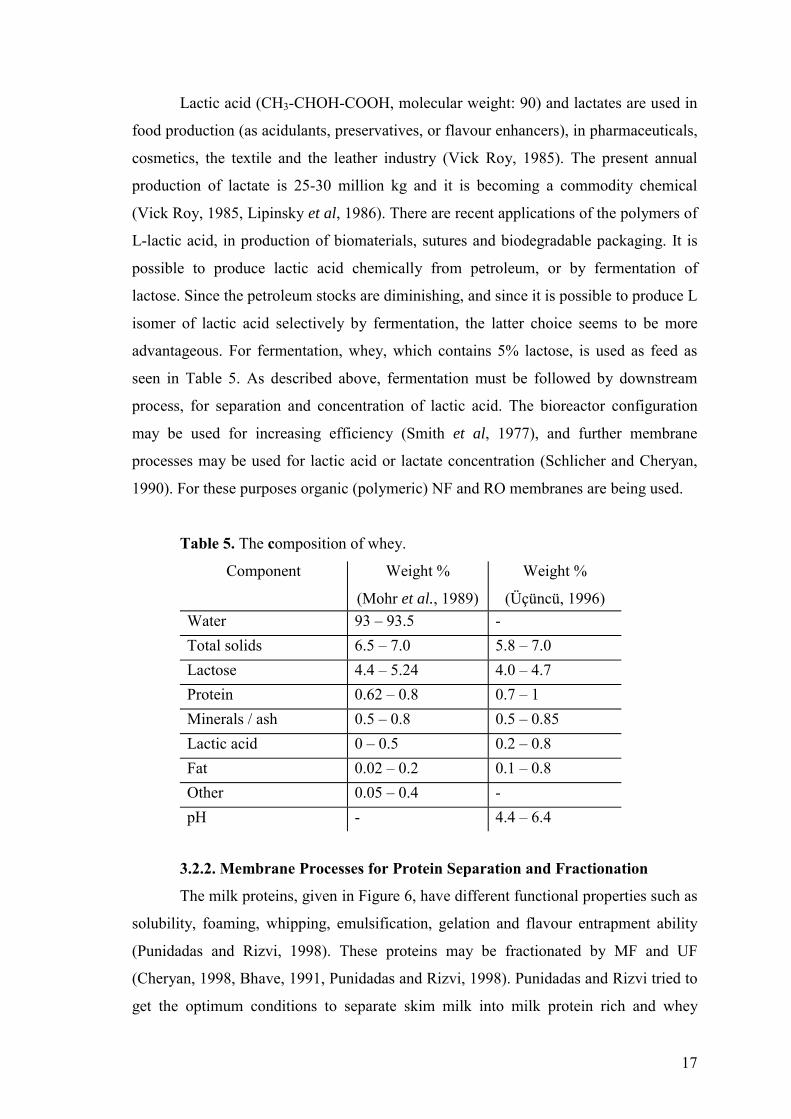
Lactic acid (CH3-CHOH-COOH, molecular weight: 90) and lactates are used in
food production (as acidulants, preservatives, or flavour enhancers), in pharmaceuticals,
cosmetics, the textile and the leather industry (Vick Roy, 1985). The present annual
production of lactate is 25-30 million kg and it is becoming a commodity chemical
(Vick Roy, 1985, Lipinsky et al, 1986). There are recent applications of the polymers of
L-lactic acid, in production of biomaterials, sutures and biodegradable packaging. It is
possible to produce lactic acid chemically from petroleum, or by fermentation of
lactose. Since the petroleum stocks are diminishing, and since it is possible to produce L
isomer of lactic acid selectively by fermentation, the latter choice seems to be more
advantageous. For fermentation, whey, which contains 5% lactose, is used as feed as
seen in Table 5. As described above, fermentation must be followed by downstream
process, for separation and concentration of lactic acid. The bioreactor configuration
may be used for increasing efficiency (Smith et al, 1977), and further membrane
processes may be used for lactic acid or lactate concentration (Schlicher and Cheryan,
1990). For these purposes organic (polymeric) NF and RO membranes are being used.
Table 5. The composition of whey.
Component Weight %
(Mohr et al., 1989)
Weight %
(Üçüncü, 1996) Water 93 � 93.5 - Total solids 6.5 � 7.0 5.8 � 7.0 Lactose 4.4 � 5.24 4.0 � 4.7 Protein 0.62 � 0.8 0.7 � 1 Minerals / ash 0.5 � 0.8 0.5 � 0.85 Lactic acid 0 � 0.5 0.2 � 0.8 Fat 0.02 � 0.2 0.1 � 0.8 Other 0.05 � 0.4 - pH - 4.4 � 6.4
3.2.2. Membrane Processes for Protein Separation and Fractionation
The milk proteins, given in Figure 6, have different functional properties such as
solubility, foaming, whipping, emulsification, gelation and flavour entrapment ability
(Punidadas and Rizvi, 1998). These proteins may be fractionated by MF and UF
(Cheryan, 1998, Bhave, 1991, Punidadas and Rizvi, 1998). Punidadas and Rizvi tried to
get the optimum conditions to separate skim milk into milk protein rich and whey

18
protein rich fractions, with ceramic membranes. They collected milk protein (casein)
rich fraction as retentate, and whey protein (α-lactalbumin, β-lactoglobulin) rich
fraction as permeate, with a 0.05 µm pore sized multichannel ceramic membrane, and
reported the optimum conditions as 5.4 ms-1 feed velocity over the membrane, 138 kPa
operating pressure and 50°C operating temperature (Punidadas and Rizvi, 1998).
Milk Proteins
Caseins (80%) Serum (Whey) Proteins (20%)
Β - Casein (27%) Albumins (15%)
α s � Casein (43%) Globulins (2%)
κ � Casein (10%) Proteos-peptones (3%)
Figure 6. The classification of milk proteins (Metin, 1998).
The whey proteins are also, tried to be further fractionated with several methods
including membrane processes. Konrad et al. worked on for isolation of native β-
lactoglobulin by using several methods including membrane processes (Konrad et al,
2000). They reported that, according to the literature this fractionation can be performed
by using salting-out procedure (selective solubility of β-lactoglobulin in the presence of
3% w/w trichloroacetic acid (TCA)), separation by ion-exchange chromatography or
utilising the differences in thermal stability in acidic conditions. They used Kjeldahl
method, SDS-Page (sodium dodecylsulfate - polyacrylamide gel electrophoresis), FPLC
(Fast Protein Liquid Chromatography) for determination of the protein. They applied a
novel method for the isolation of β-lactoglobulin, too. They exploited the resistance of
β-lactoglobulin to pepsin and they applied a peptic treatment to whey, which is followed
by a membrane process by using polymeric membranes with 0.1 µm pore size. This
novel method had a better yield than the others where 67% of the protein was purified
after drying (Konrad et al, 2000).
The isolation of the other whey protein α-lactalbumin, which is important in the
production of infant food and in pharmaceuticals due to probable morphinomimetic and
antitumour activities of some of its peptides, was also investigated by using membrane

19
processes. Muller et al. investigated the separation of α-lactalbumin and β-lactoglobulin
from other whey proteins by using ceramic membranes with MWCO (molecular weight
cut-off) range at 300 kg mol-1. It was reported that zirconia membrane was chosen due
to its less transmission to IgG (Immunoglobulin) and BSA (Bovine Serum Albumin),
but acceptable transmission to α-lactalbumin and β-lactoglobulin (Muller et al, 1999).
The use of different types of membranes including unmodified inorganic
membranes and inorganic membranes which were modified by PEI (polyethyleneimine)
was investigated for the extraction of α-lactalbumin with the membrane processes
(Lucas et al, 1998). This modification was performed for the investigation of the effect
of the surface charge of the membrane on the retention of proteins. They reported some
previous work and stated that the retention of whey proteins were not only dependent on
the protein size but also on the charge of the protein and the membrane, pH and ionic
strength of whey or the solution containing the proteins. The following observations
were reported by various research groups on the effect of these parameters on the
membrane protein separations;
- Clarified or dialyzed whey can be fractionated into the high molecular
weight proteins (immunoglobulin Ig, lactoferrin, bovine serum albumin BSA) as
retentate, and the low molecular weight proteins (β-lactoglobulin, α-lactalbumin) as
permeate, with cellulose membranes (Mehra and Donelly, 1993),
- The retention of IgG (70-80%) was lower than the retention of another high
molecular weight protein BSA (negatively charged) (100%), when filtration was
performed at a pH close to the isoelectric point of IgG and a low ionic strength, with
formed in place membrane of TiO2 on stainless steel (Zhang and Spencer, 1993),
- The experiments with polyethersulfone membrane (with 300kg mol-1 cut-
off) at low ionic strength have shown that there was a high transmission (low retention)
of the protein with an isoelectric point close to the operating pH. (The other protein(s)
had a charge at that pH.) This was predicted to be due to some electrostatic interactions
(Saksena and Zydney, 1998),
- Higher retentions were observed for the proteins, having the same charge
with the membrane; modified polycarbonate (MF) membrane by hydrophilic
polyvinylpyrrolidone caused a higher retention of β-lactoglobulin compared to BSA,
predicted to be due to the stronger interactions between β-lactoglobulin dimmers and
polyvinylpyrrolidone tails at the membrane surface (Ko et al, 1993),

20
- α-Lactalbumin and β-lactoglobulin were separated from each other with a
modified inorganic membrane (with positively charged polyvinylimidazole derivatives).
The retention of β-lactoglobulin was 100% when the pH was 7 and the ionic strength
was intermediate (0.2 mol L-1) (Chaufer et al, 1993).
In another research paper on fractionation of whey protein hydrolysates by using
charged UF/NF membranes, Pouliot et al. discussed the concept of Donnan potential;
the potential formed by the concentration difference of co and counter ions in the
charged membrane and in the solution. The concentration of co-ions (ions having same
charge with membrane), is lower in the membrane, than the concentration of counter-
ions (ions having opposite sign with the membrane), and their concentration in the
solution is just the opposite. This concentration difference of charged ions causes a
potential, called Donnan potential. Due to this potential, co-ions are repelled, while
counter-ions are attracted, by the membrane. This potential is also effective on charged
organic materials, like peptides (Pouliot et al, 1999).
The membranes show resistance (R) to fluid flow, like the resistance of a wire
for electrical current; R=TMP / µ.J (TMP= Transmembrane Pressure, µ= viscosity of
permeate, J= permeate flux) (Labbe et al., 1990). This resistance (R) must be overcome
to get a permeate flow. The membrane has its own resistance and the fouling of it adds
up more resistance. That means much higher driving force (TMP) is needed to get the
desired J (permeate flux), which increases energy consumption. Due to this reason
extensive research on the prevention of fouling of membranes for increasing the
efficiency of separation process was conducted (Su, et al., 1999 and 2000, Labbe et al.,
1990, Taddei et al., 1988 and 1989, Aimar et al., 1988, Daufin et al., 1993, 1991, Caric
et al., 2000). In some of these studies the research was performed with commercial
ceramic membranes, named as Carbosep M4 (MWCO = 20,000 Da), M5 (MWCO =
10000) and M14 (average pore diameter = 0.14µm). These membranes are tubular
ceramic membranes with a zirconia layer on carbon support. The fouling of the ceramic
membranes (Carbosep M4) was found to be related with ZrO2 � phospharte (Na-Ca) �
proteins complex according to the analysis performed by using XPS (X-Ray
Photoelectron Spectroscopy) (which gives information about fouling on the surface and
IR (Infra Red Spectroscopy) (which gives information about fouling for whole
membrane body) (Labbe et al., 1990).
The fouling maybe classified as reversible fouling (which may be removed by
rinsing with water) and irreversible fouling (which can be removed with special

21
cleaning solutions). Centrifugation (Taddei et al., 1988b), calcium phosphate
precipitation and MF (Daufin et al., 1993) were the preliminary methods investigated
for the prevention of fouling of membranes during UF of whey. Since there was a loss
of proteins during these preliminary steps the progressive effect of them on the total
process efficiency is questionable. Daufin et al. (1991) reported 100% BSA and
immunoglobulin, 50% of lactoferrin and lactoperoxidase and around 30% of β-
lactoglobulin and α-lactalbumin retention during clarification of whey by using MF
after precipitation.
Another important criterion about fouling is the direction of fluid flow with
respect to the position of the membrane. The fouling is much more severe if the fluid is
fed to the membrane surface vertically (dead-end filtration) than when it is fed parallel
to the membrane surface (cross-flow filtration). When the flow of feed is parallel to the
membrane surface then the clogging of the pores of the membrane is less and this
enables higher permeate fluxes.
Research on the UF of proteins showed that the protein retention (PR%) values
were low at the beginning of filtration possibly due to the absence of protein layer
formation which acts as a second membrane. Therefore it was suggested that filtration
would start with low TMP and followed by higher TMP and also the fluid velocity to
lower the extent of fouling (Taddei et al., 1988a).
The adsorption of protein on the ceramic membrane is also effective on the
efficiency of the separation process and fouling. It was reported that protein adsorption
on alumina membranes was higher than it was on zirconia membrane and the adsorption
to the inner parts of the porous structure is more effective on membranes with larger
pores (200nm instead of 50nm) (pH=6.6, T=25°C) (Caric et al., 2000).
22
Chapter 4
EXPERIMENTAL
4.1 Materials
The list of materials, chemicals and their specifications are given in Table 6. The
whey used was supplied by Põnar Süt A.Ş., Kemalpaşa, İzmir, Türkiye.
4.2 Preparation and Characterization of Ceramic Composite Membranes
The membranes were prepared by two main steps; i) preparation of supports
which will supply the mechanical strength to protect the unity of the membrane under
pressure and ii) modification of supports to get a selective membrane layer over the
support surface with finer pores.
4.2.1 Preparation and Characterization of Ceramic Supports
The ceramic supports were prepared by either cold-pressing or slip-casting of
ceramic powders with uniform particle size distributions. The particle size distributions
of ceramic powders were determined by using Micromeritics Sedigraph 5100. Partially
hydrolysed (80%) polyvinyl alcohol (PVA) which is commonly used as a binder in
ceramic processing, was added to these powders (~4 wt %) before cold pressing (Reed,
1995). After pressing the supports were placed into the high temperature furnace and
heat-treated at 1100-1250°C. Suspensions of fine ceramic powders (Zirconia, TZ-3Y)
were prepared for slip-casting of supports. For stabilizing the suspension at a
considerable solids content (15% v/v), polyacrylic acid (PAA) was added and with the
aid of ammonium hydroxide pH was increased and suspension was kept in an ultrasonic
bath for 3 hours. Then the suspension was poured to the cylindrical dies on plaster to get
slip-cast disc shaped supports. After the removal of water by the plaster mould the disc
shaped supports were placed in the high temperature furnace for heat treatment which
would allow the formation of a porous structure with considerable mechanical strength.
The porosities of the supports were determined by using density tool-kit.

23
Table 6. The materials used in experimental work and their specifications.
Material Specification
1-Propanol High purity, FW: 60.10, d: 0.8, Riedel
Alumina Powder Al2O3 High purity, AKP-50, Sumitomo Chemical Co.
Aluminium isopropoxide 98%, FW: 204, Aldrich
Ammonium hydroxide NH4OH 29 %, FW: 35, Aldrich
Bovine Serum Albumin (BSA) Fraction V, Min. 96%, Sigma
Copper 2 sulphate pentahydrate CuSO4.5H2O FW: 232.59, Aldrich
Ethanol High purity, FW: 46.7, d: 0.81, Merck
Folin & Ciocalteu� s Phenol Agent Sigma
Nitric Acid, HNO3 65% FW: 63.01, d: 1.4, Aldrich
Polyacrylic acid (PAA) M: 2000, Aldrich
Polyvinyl alcohol, PVA 80% hydrolysed, MW: 9000-10000, Aldrich
Potassium sodium tartarate Merck
Sodium azide Merck
Sodium carbonate Na2CO3 M: 105.99, Merck
Zirconia Powder ZrO2 High purity, TZ-3Y, Tosoh Corp.
Zirconium Propoxide, Zr(C3H7O4) 70% in alcohol, FW: 327.58, d: 1.044, Aldrich
Whey Põnar Süt A.Ş.

24
4.2.2. Preparation and Characterization of Ceramic Sols
The supports were dip-coated with alumina and zirconia sols to obtain a thin top
layer with nanometer sized pores with an asymmetric structure. Acid catalysis technique
which is capable of forming smaller clusters/particles was used for the preparation of
the sols.
Zirrconia sol was prepared from zirconium propoxide/propanol/nitric
acid/deionised water with molar ratios of 1/13.31/0.826/2, respectively (Brodsky and
Ko, 1995). The zirconium propoxide and approximately half of the propanol (~10 mL)
were mixed in a glass bottle on a magnetic stirrer. In another glass bottle nitric acid and
the rest of the predetermined amount of the alcohol and the water were mixed. The
latter solution was added drop wise to the former solution very slowly (using a pipette
in the form of drops) on the magnetic stirrer. Different amounts of acetylacetone (acac)
were added to the propoxide solution to decrease the hydrolysis rate and to investigate
its effect on sizes of sol particles. The effect of acid content on particle size distribution
was investigated by using different amounts of acid.
Alumina sol was prepared by using aluminium isopropoxide/nitric
acid/deionised water with molar ratios of 1/0.25/100, respectively. Hot water (80°C)
was added to the aluminium isopropoxide powder and mixed for couple of hours. The
acidic solution was further added and mixed for another couple of hours. The size
distribution of the sol particles were analysed by light-scattering (Zetasizer 3000HSA,
Malvern Co., UK). The volumetric contents of the alumina sol and zirconia sol are
given in Table 7.
Table 7. The volumetric contents of the sols.
Zirconia sol
For 30 mL
Alumina sol For 30 mL
Zirconium propoxide 7.89 mL Aluminium isopropoxide 3.05 g
Nitric acid (65%) 1.44 mL Nitric acid (65%) 0.259 mL
Deionized water 0.18 mL Deionized water 26.79 mL
Propanol 20.49 mL

25
4.2.3 Formation and Characterization of Thin Selective Layers on Supports
One of the surfaces of the supports were dipped in to the diluted sols (1:3
Alumina forming and 1:4 Zirconia forming sol) for 10 seconds and dried at 50ºC before
calcination.
The as prepared supports were potential membranes for MF. Dip-coating with
ceramic sols would allow the preparation of different membranes with asymmetric
structure which may be used for UF and NF. Unsupported membranes were prepared by
drying sol samples at room temperature (RT) or 50ºC overnight. These unsupported
membranes were characterised by X-Ray Diffraction (XRD, Philips X�PERT PRO), for
phase structure, Differential Thermal Analysis (DTA-50, Shimadzu Co.) and Thermal
Gravimetric Analysis (TGA-51, Shimadzu Co.) for the thermal behaviour of sol with
increasing temperature, and Nitrogen Adsorption/Desorption Analysis for the
porosity/pore structure of heat-treated membrane structure. The sample weights were
approximately 0.09 g. The samples were degassed at 90ºCfor 1h and 350ºC for 24h. The
analyses took approximately between 13-19h. The (P/Po) min was approximately
0.00064±1 and (P/Po) max was approximately 1±0.002. The microstructure
(morphology/particle size/film thickness) of the unsupported/supported membranes and
supports were examined by Scanning Electron Microscope (SEM, Philips XL30 SFEG).
4.3 Filtration Experiments
These membranes were tested in filtration experiments with deionised water to
monitor the clean water permeability (CWP) with bovine serum albumin (BSA) model
solutions and with whey which was supplied by Põnar Süt A.Ş..
4.3.1 Filtration Set-up
During this study a filtration set-up was designed and assembled. The picture of
the filtration set-up is given in Figure 7 and it is shown schematically in Figure 8. The
system consists of a feed tank, a positive pressure pump, pressure gauges, needle valves,
a flow-meter, a membrane holder and piping system for the flow of feed, permeate and
retentate streams. The temperature of the liquid in the feed tank can be kept constant by
using a heater-stirrer and an immersed cooler. It was kept at 40ºC during the
experiments. The flow rate can be regulated with the frequency converter of the pump
and was set at 5 LPM (litres per minute) for this work. The pressure was controlled by
the needle valve on the exit of the retentate from piping system to feed tank to get a

26
transmembrane pressure (TMP) up to 100 bars. TMP values lower than 20 bars were
mostly used in this work. The transmembrane pressure was defined as the difference
between both sides of the membrane, as shown in the formula in Figure 8.
Figure 7. The filtration set-up.

27
Figure 8. The diagram of filtration set-up.
4.3.2 Analysis during Filtration
The permeate flux (L permeate / m2 hour) which is the amount of liquid passing
through a certain area of membrane at a certain time was determined by measuring the
time at which permeate fills a container of 5 mL. The permeate flux of deionised water
shows the clean water permeability.
The separation efficiencies of membranes were determined with model bovine
serum albumin (BSA) solutions and whey. The protein concentrations of the BSA
solutions were determined by using UV-VIS spectrophotometer (UV-1601, Shimadzu
Co.) with direct absorbance readings at 280 nm wavelength. The Lowry method (Lowry
et al., 1951) was used for the protein concentration determination of the
Pump
Feed Tank membrane
Flowmeter
Feed
P1
Feed
P2
Feed Feed
Feed
Retentate
Retentate Retentate
Retentate
Permeate
Needle Valve
P ≈ 1 bar
P = P2 P = P1
TMP = [ (P1+P2) / 2 ] - 1
Gauge 1
Gauge 2

28
permeate/retentate/feed streams of the whey separation experiments (Lowry et al.,
1951). Alkaline copper reactive (2.5 mL) was added on to the samples taken from these
streams (0.5 mL), well-mixed and kept at room temperature for 10 minutes. The
alkaline copper reactive consists of 1mL of R1 + 1 mL of R2 was brought to a volume
of 100 mL with R3 (R1: 2% (w/v) copper sulphate, R2: 2% (w/v) potassium sodium
tartarate, R3: 2% (w/v) sodium carbonate in 0.1 N NaOH). Folin reactive (0.25 mL of
1:1 diluted) was further added to this solution which was kept for half an hour at RT.
Absorbance value was measured at 660 nm wavelength. The protein concentration was
determined from the calibration curves prepared by using BSA solutions with known
concentrations. Samples were diluted in order to obtain concentrations in the range of
calibration. The calibration curves for direct absorbance reading and for the Lowry
method are given in Figure 9 (absorbance at 280 nm) and Figure10 (absorbance at 660
nm), respectively.
y = 6,3985xR2 = 0,9999
0
0,5
1
1,5
2
0 0,05 0,1 0,15 0,2 0,25 0,3
%BSA (mg/100mL)
Abs
orba
nce
at 2
80 n
m
Figure 9. Calibration curve for direct absorbance reading at 280 nm.
y = 0,0039x + 0,0559R2 = 0,9856
0
0,2
0,4
0,6
0,8
1
0 50 100 150 200 250
Protein concentration (microgram /mL)
Abs
orba
nce
at 6
60 n
m
Figure 10. Calibration curve for whey proteins prepared with BSA for
using in the Lowry Method (absorbance at 660 nm).

29
Chapter 5
RESULTS AND DISCUSSION
5.1 Membrane Preparation and Characterization
A number of supports (45 mm before heat treatment and 42 mm after heat
treatment in the diameter) were prepared either by cold pressing or slip-casting, from
alumina (AKP-50) and zirconia (TZ-3Y) powders which have fine submicron particle
size distributions. The size distribution for the alumina powder given in Figure 11
shows that almost over 95% of the particles are smaller than 1 µm with a mean particle
size of about 0.25 µm. The supports prepared with slip-casting were found to be
mechanically stronger than the supports prepared with cold pressing due to the possible
finer particle/agglomerate size distribution (since suspension was kept in an ultrasonic
bath for couple of hours) and finer packing of powders while drying on plaster. The heat
treatment temperature was also effective on mechanical strength. Increasing the
temperature increases the mechanical strength while decreasing the porosity. The
porosity values of the supports were between 40-60%. The maximum working
transmembrane pressure of cold pressed supports (alumina heat treated at 1100ºC) was
5 bars, while slip-cast supports (zirconia heat treated at 1200ºC) could be used at 10
bars.
0
20
40
60
80
100
0.1 1 10 100
Particle Diameter (micrometer)
Mas
s Per
cent
Figure 11. Particle size distribution of alumina powder (Micromeritics
SediGraph 5100).

30
The supports have been investigated with SEM. The SEM picture of the alumina
support heat treated at 1100ºC is given in Figures 12 and 13. As it is seen in Figure 12
the alumina support heat treated at 1100°C has a uniform pore structure. The porosity
was found to be approximately 45% by using the dry and soaked weight of the support.
The SEM picture indicates that the pores are open. The SEM picture of slip-cast
zirconia support heat treated at 1200°C is given in Figure 14. The picture shows that the
support has a lower porosity which may be due to excessive heat treatment.
Figure 12. SEM picture of cold pressed alumina support surface heat treated at
1100ºC.
Ceramic sols were prepared from zirconium propoxide and aluminium
isopropoxide. Clear and stable zirconia sols were prepared with zirconium
propoxide/propanol/nitric acid/deionised water with molar ratios of 1/13.31/0.826/2,
respectively as described by Brodsky and Ko (1995). The particle size distributions of
these sols which were determined by using light scattering (Zetasizer 3000HSA), were
very narrow and the mean particle size was around 5 nm as seen in Figure 15. A series

31
Figure 13. SEM picture of cold pressed alumina support surface heat treated at
1100ºC.
Figure 14. SEM picture of zirconia support surface heat treated at 1200ºC.

32
of zirconium sols were prepared with various zirconium/acid molar ratio. A decrease in
the mean particle size was observed with increasing acid ratio as shown in Table 8.
Zirconia sols with 4.4 nm and 7.4 nm were prepared with Zirconium propoxide/acac
molar ratio of 1 and 2, respectively, using acetyl acetone (acac) as a sol additive. This
was probably due to the inhibitory effect of acac layer around the zirconia nanoparticles
on their interactions which may cause the formation of larger clusters. Sols with smaller
mean particle size, prepared either by increasing the acid ratio or addition of acac were
observed to form gels relatively faster than the regular zirconia sol. These sols may be
used for the preparation of membrane layers with much finer pores if process conditions
are controlled closely during drying and heat treatment.
Figure 15. Particle size distribution of zirconia sol detected with Zetasizer
(volume based distribution).
Alumina sol was prepared with water/alkoxide molar ratio of 100 and nitric
acid/alkoxide molar ratio of 0.25 which had a mean particle size of 30 nm and the
particle size distribution is given in Figure 16.
The TGA curve of dried zirconia gel consists of three main stages as given in
Figure 17. It has shown that heat treatment at 500ºC was enough to get a stable zirconia
layer, since the weight loss approaches to a negligible level after that temperature. The
first stage is from room temperature to approximately 270°C where 18% weight loss
occurred which was probably due to water/alcohol removal.
Size distribution
5 10 (nm)
20
40
%

33
Table 8. The mean particle sizes of zirconia sols with different acid contents.
Nitric Acid (mmol / mL propanol) Mean Particle Size (nm)
0.826 5.7
0.926 4.7
1.026 3.1
The second stage is between 270° and 430°C during which 13% weight loss occurred.
The bonded water and NOx compounds might be removed during this stage. The third
stage is between 430° and 480°C. There might be crystallization during this stage where
a weight loss of 4.5% occurred. The DTA indicates an exothermic change during this
stage.
Figure 16. Particle size distribution of alumina sol detected with Zetasizer
(volume based distribution).
The XRD analysis (2Θ = 5-70°, step size = 0.05 (2Θ), counting time = 0.5 (s)) of
zirconia unsupported membrane calcined at 500ºC showed that, tetragonal zirconia
crystals were formed during heat treatment as determined from the pattern in Figure 18.
Size distribution
5 10 50 100 500 (nm)
10
20
%

34
The distinct sharp characteristic peaks of zirconia indicate the sample consists of pure
zirconia crystals.
0102030405060708090100
0 100 200 300 400 500 600 700 800 900
Temperature (º C)
TGA
%
Figure 17. TGA of zirconia unsupported membrane (sample weight: 10.07 mg,
atmosphere: nitrogen flow 40mL/min, heating regime: 2°C/min up to 800°C).
The TGA curve of dried alumina sol is given in Figure 19. The figure shows that
the sample has reached a gravimetric stability approximately at 500°C after which the
weight loss was negligible. This indicates a calcination temperature at or slightly above
500°C can be applied to get a stable structure. The TGA curve for dried alumina gel
consists of three main stages which are between room temperature to 180°C, 180°C to
270°C, 270°C to 500°C. The third stage may be subdivided into two as 270°C to 330°C
and 330°C to 500°C. There was approximately a 10% weight loss during the second
sub-stage, which might be due to the transformation of boehmite into γ-alumina.
Previous stages are probably due to the removal of free, bonded water and NOx
compounds.
The XRD results (2Θ = 10-80°, step size = 0.05 (2Θ), counting time = 0.5 (s)) of
calcined alumina unsupported membranes are given in Figures 20 and 21 for 500°C and
600°C, respectively. The XRD peaks are not as sharp as in the case of zirconia. The
phase transformation from boehmite to γ (Gama) phase in these alumina membranes
should be complete and γ-peaks start to appear in the 600°C membrane pattern.

35
The pore sizes distributions of calcined alumina measured with nitrogen
adsorption and desorption analysis are given in Figures 22 and 23. The calculations of
these pore sizes were done according to the BJH (Barret-Johner-Halenda) model, which
is commonly used for mesoporous structures. The results are tabulated in Table 9.
0
100
200
300
400
500
600
10 20 30 40 50 60 70
º 2 Theta
coun
ts /
s
Zirconia 500ºC Ref. 79-1771 tetragonal ziconia (T)
T
T
TT
T
TT
T
Figure 18. XRD analysis of zirconia unsupported membrane calcined at
500ºC.
0
10
20
30
40
50
60
70
80
90
100
0 100 200 300 400 500 600 700 800 900 1000
Temperature (ºC)
TGA
%
Figure 19. TGA of alumina unsupported membrane (sample weight: 10.38
mg, atmosphere: nitrogen flow 40 mL/min, heating regime: 10°C/min up to
1000°C).

Figure 20. XRD analysis of alumina
Figure 21. XRD analysis of alumin
0
20
40
60
80
100
120
10 20 30
coun
ts /
s
Alumina 600
•
••
•
0
20
40
60
80
100
120
10 20 30 4
coun
ts /
s
Alumina 500 Ref. Gama alumina (
ã
ã ãã
(Y
? Cº Cunsupported membrane ca
a unsupported membrane c
40 50 60
º 2 Theta
ºC Ref. Gama Alumina
•
•
•
0 50 60
º 2 Theta
ã
ã
ã
γ))
lcined at 500ºC.
)
70 80
ã
)
(γ(Y36
alcined at 600ºC.
70 80
•

37
0
0.005
0.01
0.015
0.02
0.025
15 20 25 30 35 40
Pore Diameter (Aû )
Pore
Vol
ume
(cm
³/g)
Figure 22. BJH pore size distribution of alumina unsupported membrane
calcined at 500ºC (from desorption data).
00,005
0,010,015
0,020,025
0 25 50 75
Pore Diameter (Aû)
Pore
Vol
ume
(cm
³/g)
Figure 23. BJH pore size distribution of alumina unsupported membrane
calcined at 600ºC (from desorption data).
Table 9. Results from nitrogen adsorption/desorption analysis of alumina
unsupported membranes.
Alumina 500°C Alumina 600°C
Single Point Surface Area
(m2/g) 296.7 246.5
BJH Desorption Cumulative
Surface Area (m2/g) 284.9 292.6
Average Pore Diameter
(by single point) (A°) 27.5 31.6
BJH Desorption Average Pore
Diameter (A°) 28.2 29.9

38
The supports which were dip-coated with diluted sols (1:4; for zirconia, and 1:3;
for alumina) for 10 seconds, dried and calcined at 500ºC or 600ºC were investigated
with SEM. The SEM pictures may be seen in Figures 24 to 35.
The SEM picture of the porous support and the layer formed on it by dip-coating
is shown in Figure 24. When the magnification was increased while investigating the
microstructure of the coated layer it was observed that it consists of small particles
forming a porous structure with finer pores as presented in Figure 25. These small
particles forming this structure with finer pores are approximately 10-15 nm in
diameter.
The SEM picture of slip-cast zirconia support without sol coating is shown in
Figure 26. The grains in the microstructure are 70-150 nm in diameter. The
microstructure of a zirconia support coated with diluted (1:4) zirconia sol can be seen in
Figures 27 and 28. First the dark and smooth surface was investigated for a closer look
to the membrane formed by zirconia sol (Figures 29 and 30) with the idea that the other
side was not coated with the sol and a slightly translucent layer formed by small
particles (approximately 10 nm in diameter) were observed over the bigger grains of the
support. When the other side which seems to mimic the support microstructure with
submicron grains was investigated with increasing the magnification as given in Figures
31-35, it was observed that the surface of the support was coated with a thin zirconia
layer which was formed from approximately again 10 nm zirconia particles. These
observations confirm that the applied coating method is satisfactory to prepare a
uniform membrane layer all over the surface of the ceramic support with a fine
thickness.

39
Figure 24. SEM picture of dry pressed alumina support surface heat treated at
1100ºC and partially coated with alumina sol calcined at 600ºC at 15 kX.
Figure 25. SEM picture of the alumina sol coated 600ºC calcined membrane
on dry pressed alumina support heat treated at 1100ºC at 150 kX.

40
Figure 26. SEM picture of slip-cast zirconia support heat treated at 1200ºC
at 150 kX.
Figure 27. SEM picture of slip-cast 1200ºC heat treated zirconia support coated
with 500ºC calcined zirconia sol at 5 kX.
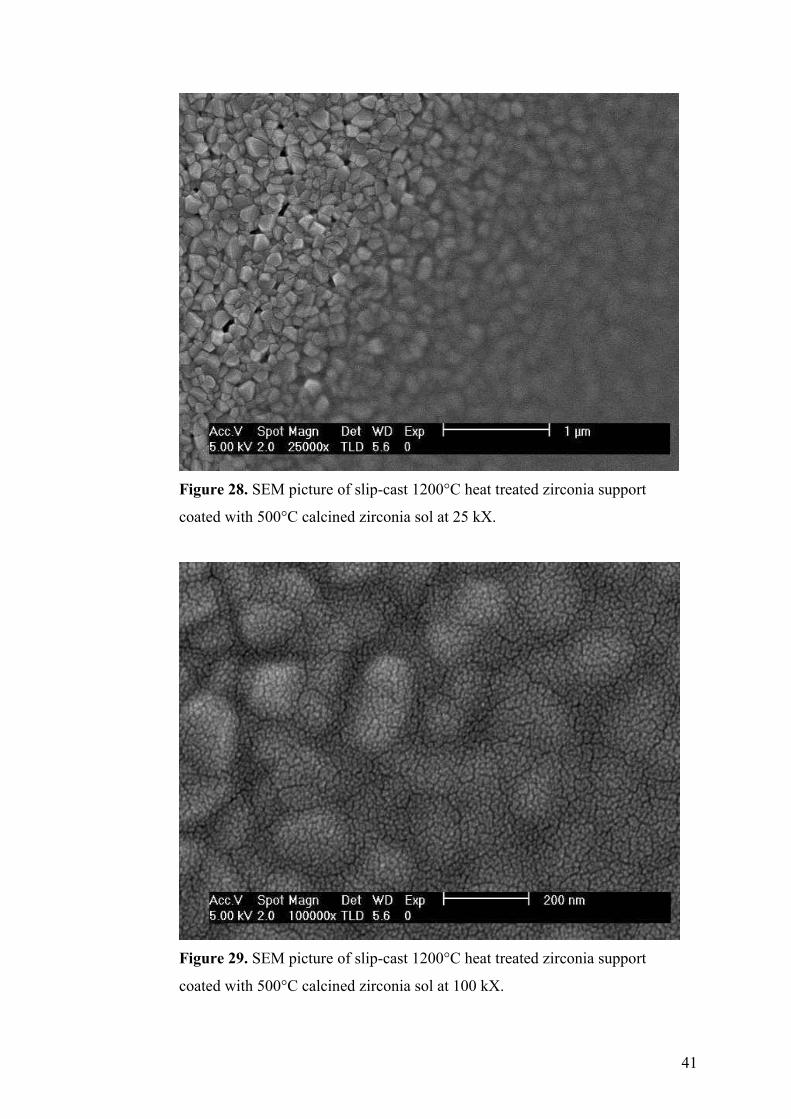
41
Figure 28. SEM picture of slip-cast 1200°C heat treated zirconia support
coated with 500°C calcined zirconia sol at 25 kX.
Figure 29. SEM picture of slip-cast 1200°C heat treated zirconia support
coated with 500°C calcined zirconia sol at 100 kX.

42
Figure 30. SEM picture of slip-cast 1200°C heat treated zirconia support
coated with 500°C calcined zirconia sol at 250 kX.
Figure 31. SEM picture of slip-cast 1200°C heat treated zirconia support
coated with 500°C calcined zirconia sol at 25 kX.
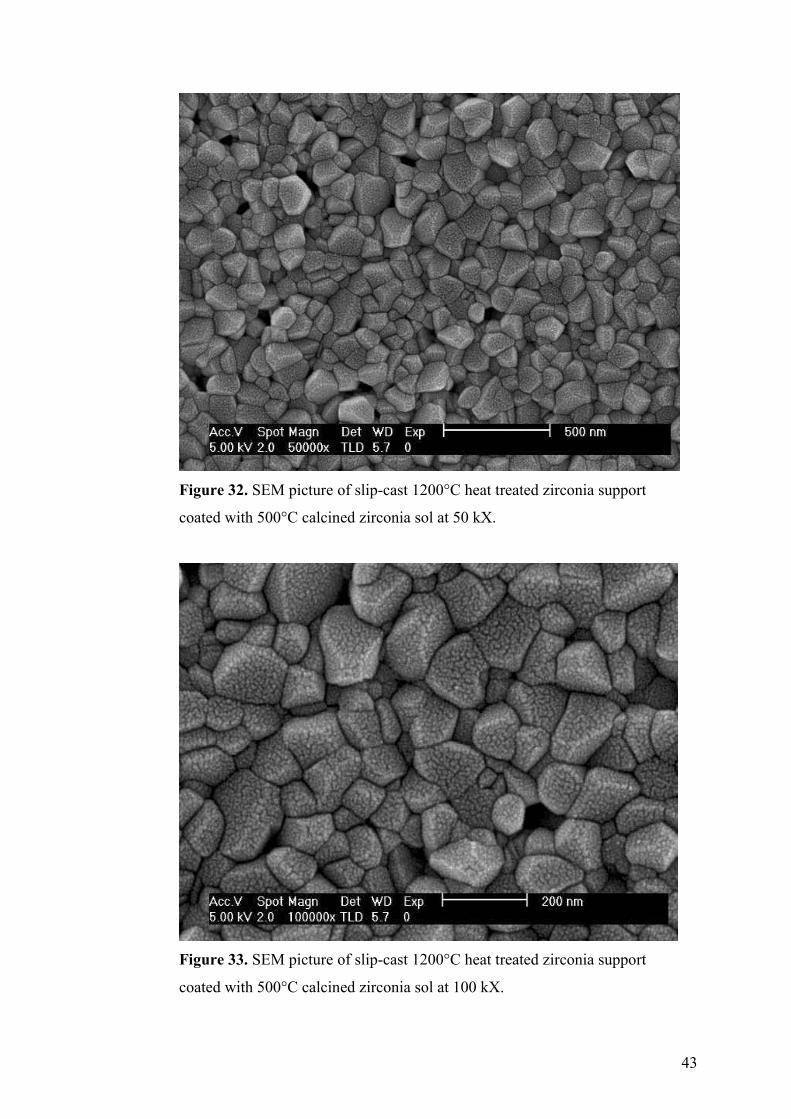
43
Figure 32. SEM picture of slip-cast 1200°C heat treated zirconia support
coated with 500°C calcined zirconia sol at 50 kX.
Figure 33. SEM picture of slip-cast 1200°C heat treated zirconia support
coated with 500°C calcined zirconia sol at 100 kX.

44
Figure 34. SEM picture of slip-cast 1200°C heat treated zirconia support
coated with 500°C calcined zirconia sol at 120 kX.
Figure 35. SEM picture of slip-cast 1200°C heat treated zirconia support
coated with 500°C calcined zirconia sol at 150 kX.

45
5.2 Separation Experiments
These well characterized ceramic membranes were subjected to a series of
filtration experiments in order to evaluate their separation efficiency and concentration
of proteins as representative biotechnological products. Clean water (deionised), bovine
serum albumin (BSA) model solution (2.5 g/L), and whey without any pre-treatment
were used for this purpose.
5.2.1. The Clean Water Permeability (CWP)
The results about clean water permeability (CWP) of 1200°C heat treated slip-
cast zirconia and 1100°C heat treated dry pressed alumina supports are given in Figures
36 and 37. The water permeability of dry-pressed alumina support was determined to be
higher than the water permeability of slip-cast zirconia support (water flux: 5 L/min,
water temperature: 40ºC). The water permeability of both supports increased with
increasing transmembrane pressure, but the dry-pressed alumina (heat treated at
1100ºC) and zirconia (heat treated at 1175ºC) supports were broken at 5 bars while it
was possible to work up to 10 bars with slip-cast 1200º C heat treated zirconia support.
Vacassy et al.(1998) reported a CWP of 32 L/m2 h bar for a 15 kDa MWCO membrane
(Kerasep support) and a CWP of 7.5 L/m2 h bar for a zirconia nanofilter (2 µm thick,
consist of 5nm zirconia particles) they formed on this support. Caric et al. (2000)
reported CWP values for low TMP values for zirconia coated (50 nm average pore size)
and alumina coated (200 nm average pore diameter) on alumina support. If
extrapolation is done with the values from the plot of TMP (bar) vs. flux (L/m2 h) the
flux values will be calculated as 560 L/m2 h and 900 L/m2 h for TMP = 2 bar, for
zirconia coated and alumina coated membrane, respectively. Yang et al. (1998) reported
CWP values for inorganic MF membranes with average pore diameters 4 � 200 nm as
45 � 1500 L/m2 h bar. Tsuru et al. (1998) reported CWP values between 0.54 � 5.4 L/m2
h bar for the silica-zirconia nanofiltration (NF) membranes of which MWCO values are
between 200 � 1000 Da. Larbot et al. (1994) reported CWP values of three NF
membranes between 6 - 9 L/m2 h for TMP = 5 bar. These membranes were able to
separate a molecule with molecular weight of 375 g with 95% retention. The CWP
value of the slip-cast zirconia (heat treated at 1200ºC) and the dry pressed alumina (heat
treated at 1100ºC) supports, prepared in this work were 23 L/m2 h and 72 L/m2 h for
TMP = 5 bars, respectively. These values can be considered to be relatively low for a
ceramic support when compared with the results given in the literature, but these

46
supports also can be considered as thick MF/UF membranes with relatively finer pores
with diameters lower than 40-50 nm.
0
10
20
30
40
50
60
0 1 2 3 4 5 6 7 8 9 10 11
TMP (bar)
L / m
² h
Figure 36. The clean water permeability of slip-cast zirconia membrane heat
treated at 1200ºC at different transmembrane pressures (TMP).
0
10
20
30
40
50
60
70
80
0 1 2 3 4 5 6 7 8 9 10 11
TMP (bar)
L / m
² h
Figure 37. The clean water permeability of dry pressed alumina membrane heat
treated at 1100ºC at different transmembrane pressures (TMP).
5.2.2. The Protein Retention (PR)
The protein retention (PR) values of membranes were calculated using the
following equation:
PR (%) = 100* (1- (Cp / Cr))

47
where Cp and Cr are protein concentrations in the permeate and retentate streams,
respectively (Daufin et al., 1991).
The slip-cast zirconia support heat treated at 1200ºC had a protein retention
value of 60%, while working with 2.5 g/L BSA solution at a feed flux of 5 L/min and
40ºC as given in Figure 38. This moderate protein concentration (2.5 g/L) which is
higher than concentrations of total proteins in whey was chosen for preventing the
instantaneous fouling of the membranes to be tested at high protein concentrations and
for examining the effect of fouling after concentration of whey with lower protein
content.
0102030405060708090100
0 30 60 90 120 150 180 210 240 270 300 330
Time (minute)
PR (%
)
Figure 38. Protein (BSA) retention of slip-cast zirconia support
(heat treated at 1200ºC).
Protein retention of alumina sol coated membranes is given in Figures 39 and
40. Surprisingly the protein retention of alumina coated membrane calcined at 500ºC
was lower than the protein retention of 600ºC heat treated membrane, although it had a
finer microstructure. This may be explained by the presence of defects/microcracks in
its finer microstructure.

48
0102030405060708090100
0 30 60 90 120 150 180 210 240 270 300 330
Time (minute)
PR (%
)
Figure 39. Protein (BSA) retention of 500ºC calcined alumina coated slip-cast
zirconia support (feed flux: 5 L/min, feed temperature: 40ºC).
010
203040
50
607080
90100
0 60 120 180 240 300 360 420 480
Time (minute)
PR (%
)
Figure 40. Protein (BSA) retention of 600ºC calcined alumina coated slip-cast
zirconia support (feed flux: 5 L/min, feed temperature: 40ºC).
Zirconia sol was coated and calcined at 500ºC on slip-cast zirconia support heat
treated at 1200ºC. The protein retention behaviour of this membrane was found to be
close to the uncoated support as shown in Figure 41. This sol was further diluted with
propanol at a ratio of 1:4 and the membrane formed with this diluted sol had a
considerably higher protein retention capacity as shown in Figure 42. This observation
showed the importance of selective layer thickness on the support. Relatively thick
layers may contain significant levels of cracks/defects after heat treatment.

49
0102030405060708090100
0 30 60 90 120 150 180 210 240 270
Time (minute)
PR (%
)
Figure 41. Protein (BSA) retention of 500ºC calcined zirconia coated slip-cast
zirconia support (feed flux: 5 L/min, feed temperature: 40ºC).
0102030405060708090100
0 30 60 90 120 150 180 210 240 270 300 330 360
Time (minute)
PR (%
)
Figure 42. Protein (BSA) retention of 500ºC calcined diluted zirconia sol coated
slip-cast zirconia support (feed flux: 5 L/min, feed temperature: 40ºC).
Both the flux and PR% values increased with increasing transmembrane
pressure as shown in Figures 43 and 44, respectively.

50
0102030405060708090
0 2 4 6 8 10 12
TMP (bar)
L /
m² h
Figure 43. The change of flux with transmembrane pressure during BSA
filtration with 1:4 diluted zirconia sol coated 500ºC calcined selective
layer/1200°C heat treated zirconia slip-cast support composite membrane.
50
60
70
80
90
0 1 2 3 4 5 6 7 8 9 10 11
TMP (bar)
PR (%
)
Figure 44. The change of protein retention with transmembrane pressure during
BSA filtration with 1:4 diluted zirconia sol coated 500ºC calcined selective
layer/1200°C heat treated zirconia slip-cast support composite membrane.
The membrane formed with 1:4 diluted zirconia sol after calcination at 500ºC on
dry pressed alumina support was used for the concentration of proteins in whey. The
retention of proteins in this complex biological liquid was at a rate of 96% with a flux
value of around 40 L/m2 h as given in Figures 45 and 46, respectively.

51
0102030405060708090100
0 30 60 90 120 150 180 210 240
Time (minute)
PR (%
)
Figure 45. Whey protein retention vs. time with 500ºC calcined 1:4 diluted
zirconia sol coated 1100°C heat treated dry-pressed alumina support.
0102030405060708090100
0 30 60 90 120 150 180 210 240
Time (minute)
L / m
² h
Figure 46. Permeate flux vs. time with 500ºC calcined 1:4 diluted zirconia sol
coated 1100°C heat treated dry-pressed alumina support.
As shown in Figure 46 the permeate flux was initially approximately 94 L/m2 h
then decreased to 40 L/m2 h with fluctuations. This value is in the range of values
reported in the literature for different inorganic membranes and working parameters as
25-70 L/m2 h. The protein retention value given in Figure 45 is also in agreement with
the values between 84-100% reported in the literature. Flux/retention levels should be
optimized together for an efficient membrane separation process.

52
Chapter 6
CONCLUSIONS AND RECOMMENDATIONS
Ceramic composite membranes for biotechnological applications were prepared
in this work. Ceramic supports from two different powders (alumina, zirconia) were
prepared for this purpose. These supports were dip-coated to get a thin selective layer
with finer pores by using alumina and zirconia sols. Filtration tests with water, model
protein solution (BSA) and untreated whey were performed by using these membranes
in order to determine their protein separation efficiencies and fluxes.
The particle size distribution of ceramic powders, the particle size distributions
and concentrations of ceramic sols and the heat treatment applied to the ceramics were
found to be important and effective parameters during preparation of these ceramic
composite membranes.
Zirconia sols with average particle size of a few nanometers (3.1 - 7.4 nm), and
alumina sol with average particle size of 30 nm were prepared by using sol-gel method.
These sols were used for dip-coating of supports with dilutions to get a crack free thin
membrane layer with finer pores (1:3 diluted alumina sol and 1:4 zirconia sol). The
calcination temperatures were 500°C for zirconia and 600°C for alumina layer in line
with the TGA results.
The ceramic supports were able to separate proteins with a protein retention
ratio of 60% without dip-coating. After coating with ceramic sols and calcination this
value increased up to 96%. Same efficiency could be achieved also with such a complex
biological mixture; whey, with a permeate flux of 40 Lm-2hour-1.
Increasing the transmembrane pressure also increased the permeate flux and
protein retention. For membrane formed by the calcination of 1:4 diluted zirconia sol
coated, dry-pressed alumina support (heat treated at 1100°C) the increases of these
values were determined as 7.5 Lm-2hour-1 and 1.6% per bar, respectively.
Ceramic supports may be prepared with coarser ceramic powders for increasing
the permeate flux. This may yield a support with larger pores (submicron rather than
nanosized pores) and a much higher flux.

53
Ceramic sols with different solids contents may be further prepared and
characterized to synthesize membranes with various pore sizes to use in different
biotechnological applications.
The heat treatment and its effects on the microstructure of both ceramic supports
and selective membrane layers can be further investigated.
Since the ceramic materials are amphoteric, their behaviour as a membrane, at
different pH values can be investigated. The efficiency of the separation process may be
severely affected with the interaction of solutes in the feed with the membrane surface
due to the adsorption and also electrical attraction/repulsion forces.

54
REFERENCES
Aimar, P., Taddei, C., Lafaille, J.-P., Sanchez, V., �Mass Transfer Limitations
During Ultrafiltration of Cheese Whey with Inorganic Membranes�, Journal of
Membrane Science, vol. 38, p. 203-221, 1988.
Bhave, R. R., Inorganic Memranes: Synthesis, Characterization, and Applications,
Van Nostrand Reinhold, 1991.
Brodsky, C. J., Ko, E. I., �Effect of Supercritical Drying Temperature on the
Properties of Zirconia, Niobia, and Titania-Silica Aerogels�, Journal of Non-
Crystalline Solids, vol. 186, p. 88-95, 1995.
Caric, M. D., Milanovic, S. D., Krstic, D. M., Tekic, M. N., �Fouling of Inorganic
Membranes by Adsorption of Whey Proteins�, Journal of Membrane Science, vol.
165, p. 83-88, 2000.
Chaufer, B., Rollin, M., Sebille, B., �High-Performance Liquid Chromatography
and Ultrafiltration of Whey Proteins with Inorganic Porous Materials Coated with
Polyvinylimidazole Derivatives�, J. Chromatogr., Vol. 548, p. 215, 1991.
Cheryan, M., Ultrafiltration and Microfiltration Handbook, Technomic Publishing
Company, Inc., 1998.
Cot, L., Ayral, A., Durand, J., Guizard, C., Hovnanian, N., Julbe, A., Larbot, A.,
�Inorganic Membranes and Solid State Sciences�, Solid State Sciences, Vol. 2, p.
315-334, 2000.
Daufin, G., Labbe, J.-P., Quemerais, A., Michel, F., �Fouling of an Inorganic
Membrane During Ultrafiltration of Defatted Whey Protein Concentrates�, Neth.
Milk Dairy Journal, vol. 45, p. 259-272, 1991.

55
Daufin, G., Michel, F., Labbe, J.-P., Quemerais, A., Grangeon, A., �Ultrafiltration
of Defatted Whey: Improving Performance by Limiting Membrane Fouling�,
Journal of Dairy Research, vol. 60, p. 79-88, 1993.
Howell, J. A., Sanchez, V., Field, R. W, Blackie, Membranes in Bioprocessing:
Theory and Applications, Academica Professional, Chapman & Hall, 1993.
Howell, J. A., The Membrane Alternative: Energy Implications for Industry, The
Watt Committee on Energy, 1990.
Ko, M. K., Pellegrino, J. J., Nassibene, R., Marko, P., �Characterization of the
Adsorption-Fouling Layer Using Globular Proteins on Ultrafiltration Membranes�,
Journal of Membrane Science, Vol. 76, p. 101, 1993.
Konrad, G., Lieske, B., Faber, W., �A Large-scale Isolation of Native β-
Lactoglobulin: Characterization of Physicochemical Properties and Comparison
with Other Methods�, International Dairy Journal, Vol. 10, p. 713-721, 2000.
Krijgsman, J., Concentration of Products-1 in " Product Recovery in Bioprocess
Technology �, Butterworth-Heinemann, 1992.
Labbe, J.-P., Quemerias, A., Michel, F., Daufin, G., �Fouling of Inorganic
Membranes During Whey Ultrafiltration : Analytical Methodology�, Journal of
Membrane Science, vol 51, p. 293-307, 1990.
Larbot, A., Alami-Younssi, S., Persin, M., Sarrazin, J., �Preparation of a γ-Alumina
Nanofiltration Membrane�, Journal of Membrane Science, Vol. 97, p. 167-173,
1994.
Lee, B., I., Pope, E. J. A., Chemical Processing of Ceramics, edited by, Marcel
Dekker, Inc., 1994.
Lipinsky, E. S., Sinclair, R.G., �Is Lactic Acid a Commodity Chemical�, Chem.
Eng. Progr., Vol. 82, No. 8, p. 26, 1986.

56
Loehman, R. E., Characterization of Ceramics, Butterworth-Heinemann, 1993.
Lowry, O. H., Rosebrough, N. J., Farr, A. L., Randall, R. J., �Protein Measurement
with the Folin Phenol Reagent�, Journal of Biological Chemistry, vol. 193, p. 265,
1951.
Lucas, D., Rabiller-Baudry, M., Millesime, L., Chaufer, B., Daufin, G., �Extraction
of α-Lactalbumin from Whey Protein Concentrate with Modified Inorganic
Membranes�, Journal of Membrane Science, Vol. 148, p. 1-12, 1998.
Mehra, R. K., Donelly, J. W., �Fractionation of Whey Protein Components through
a Large Pore Size, Hydrophilic, Cellulosic Membrane�, J. Dairy Res., Vol. 60, p.
89, 1993.
Metin, M., Süt Teknolojisi (Sütün Bileşimi ve İşlenmesi), Ege Üniversitesi
Mühendislik Fakültesi Yayõnlarõ (No: 33), 2. Baskõ, 1998.
Mohr, C. M., Engelgau, D. E., Leeper, S. A., Charboneaue, B. L., Membrane
Applications and Research in Food Processing, Noyes Data Corporation, 1989.
Moo-Young, M., Comprehensive Biotechnology, Vol. 2, Pergamon Press Ltd.,
1985.
Muller, A., Daufin, G., Chaufer, B., �Ultrafiltration Modes of Operation for the
Separation of α-Lactalbumin from Acid Casein Whey�, Journal of Membrane
Science, Vol. 153, p. 9-21, 1999.
Pouliot, Y., Wijers, M. C., Gauthier, S. F., Nadeau, L., �Fractionation of Whey
Protein Hydrolysates Using Charged UF/NF Membranes�, Journal of Science, vol.
158, p. 105-114, 1999.

57
Punidadas, P., Rizvi, S. S. H., �Separation of Milk Proteins into Fractions Rich in
Casein or Whey Proteins by Cross Flow Filtration�, Food Research International,
Vol. 31, No. 4, p. 265-272, 1998.
Reed, J. S., Principles of Ceramic Processing, John Wiley & Sons, Inc., 1995.
Saksena, S., Zydney, A. L., �Effect of Solution pH and Ionic Strength on The
Separation of Proteins by Charged Ultrafiltration Membranes�, Desalination, Vol.
70, p. 191, 1998.
Schlicher, L. R., Cheryan, M., �Reverse Osmosis of Lactic Acid Fermentation
Broths�, J. Chem. Technol. Biotechnol., vol. 49, p. 129, 1990.
Smith, B. R., MacBean, R. D., Cox, G. C., �Separation of Lactic Acid from Lactose
Fermentation Liquors by Reverse Osmosis�, Austr. J. Dairy Technol., Vol. 32, p.
23, 1977.
Strathmann, H., �Membrane Separation Processes: Current Relevance and Future
Opportunities�, AIChE Journal, Vol. 47, No. 5, p. 1077-1087, 2001.
Su, T. J., Lu, J. R., Cui, Bellhouse, B. J., Thomas, R. K., Heenan, R. K.,
�Identification of the Location of Protein Fouling on Ceramic Membranes under
Dynamic Conditions�, Journal of Membrane Science, vol. 163, p. 265-275, 1999.
Su, T. J., Lu, J. R., Cui, Z. F., Thomas, R. K., �Fouling of Ceramic Membranes by
Albumins under Dynamic Filtration Conditions�, Journal of Membrane Science,
vol. 173, p.167-178, 2000.
Taddei, C., Aimar, P., Daufin, G., Sanchez, V., �Factors Affecting Fouling of
Inorganic Membrane During Sweet Whey Ultrafiltration�, Le Lait, vol. 68 (2), p.
157-176, 1988.
Taddei, C., Daufin, G., Aimar, P., Sanchez, V., �Role of Some Whey Components
on Mass Transfer in Ultrafiltration�, Biotechnology and Bioengineering, vol.34, p.
171-179, 1989.

58
Tsuru, T., Wada, S., Izumi, S., Asaeda, M., �Silica � Zirconia Membranes for
Nanofiltration�, Journal of Membrane Science, Vol. 149, p. 127-135, 1998.
Üçüncü, M., Süt Teknolojisi (2. Bölüm), Ege Üniversitesi Mühendislik Fakültesi
Yayõnlarõ (No:32), 3. Baskõ, 1996.
Vacassy, R., Guizard, C., Palmeri, J., Cot, L., �Influence of the Interface on the
Filtration Performance of Nanostructured Zirconia Ceramic�, Nano Structured
Materials, Vol. 10, No. 1, p. 77-88, 1998.
Vick Roy, T. B., in: Moo-Young (Ed.), Comprehensive Biotechnology, Vol. 3,
p.761-776, Pergamon Press Ltd, 1985.
Ward, D. A., Ko, E., L., �Preparing Catalytic Materials by the Sol-Gel Method�,
Ind. Eng. Chem. Res., Vol. 34, p. 421-433, 1995.
Yang, C., Zhang, G., Xu, N., Shi, J., �Preparation and Application in Oil-Water
Separation of ZrO2 / Al2O3 MF Membrane�, Journal of Membrane Science, Vol.
142, p. 235-243, 1998.
Zhang. L., Spencer, H. G., �Selective Separation of Proteins by Microfiltration with
Formed-in-Place Membranes�, Desalination, vol. 90, p. 137, 1993.