prepared by aleš bulíř and a. javier hamann - imf.org · - 1 - draft volatility of development...
TRANSCRIPT

- 1 -
DRAFT
Volatility of Development Aid: From the Frying Pan into the Fire?
Prepared by Aleš Bulíř and A. Javier Hamann 1
International Monetary Fund
February 2005
Abstract
For a long time, the positive impact foreign aid has been hampered by the erratic behavior of aid flows. Unfortunately, the various initiatives enacted since the late 1990s aimed at (i) strengthening coordination among donors; (ii) improving the design of financial support programs; and (iii) improving domestic records of policy implementation, do not seem to have yielded the intended objectives: available data on aid flows do not reveal any fundamental changes in the way in which aid has been delivered in the past five years. It appears that the main factors underlying the volatility and unpredictability of aid have not been addressed, a situation that does not bode well for the success of the new initiatives and lending facilities that are being proposed. JEL Classification Numbers: F35, O19 Keywords: External aid, ODA, volatility, predictability Author’s E-Mail Address: [email protected], [email protected]
1 A. Bulíř is with the Policy Development and Review Department and A. Hamann is with the Independent Evaluation Office. We are grateful to Tina Daseking, Mark Plant, and Boriana Yontcheva for comments. This paper should not be reported as representing the views of the IMF. The views expressed are those of the authors and do not necessarily reflect the views of the IMF or IMF policy. Prepared for the Seminar on Foreign Aid and Macroeconomic Management, organized by the IMF Institute and African Department, March 14-15, Maputo.

- 2 -
Table of Contents
I. Introduction ............................................................................................................................3
II. Volatility and Predictability of Aid: What Exactly Is the Issue? ..........................................4
III. Data Issues ...........................................................................................................................5 A. The Dataset ...............................................................................................................5 B. Common Denominator for Aid and Fiscal Revenue.................................................6
IV. Measuring the Relative Variability of Aid and Revenue.....................................................6 A. Methodology .............................................................................................................6 B. Results .......................................................................................................................7
V. Conclusions and Policy Implications..................................................................................16
References................................................................................................................................18 Annex Selected Methodological Issues Tables 1. Aid Is More Volatile Than Revenue and Procyclical 2. During 2000-2003 Aid Has Been More Volatile Than Ever Before 3. A Matrix of Aid Responses to Income Shocks 4. Aid Is Poor Insurance Against Negative GDP Shocks, 1975-2003 5. Negative Income Shocks Coincide with Negative Aid Shocks, 1975-2003 Figures 1. Selected Countries: Relative Volatility of Aid and Revenue, Φ, 1975-2003 2. Aid Commitments Are Poor Predictors of Disbursements, 1975-2001 Appendix Table A1. List of Countries and Sample Periods

- 3 -
I. INTRODUCTION
The positive impact of foreign aid has been frustrated by the lack of reliability in aid flows, amplifying further the already volatile macroeconomic environment of low income countries. Donors and international financial institutions (IFIs) have started to pay attention to this issue, however the recent changes in donor behavior and program design do not seem to have much visible impact on the way aid has been disbursed—it remains volatile, procyclical, and unpredictable. It appears that the main factors underlying the volatility and unpredictability of aid have not been addressed, a situation that does not bode well for the success of the new initiatives and lending facilities that are being proposed by the G-7 countries. In contrast, disbursing aid in a predictable manner, facilitated by recipients’ compliance with program conditions, would yield tangible economic gains. Although the volatility and unpredictability of aid are not new phenomena—they have been recognized as a long-lasting problem of macroeconomic management in low-income countries—the issue is receiving increasing attention in academia, as well as among bilateral donors and IFIs. Nancy Birdsall (2004) highlighted the problem in her typology s donor sins number 6: “stingy and unreliable transfers.” A study by the OECD (2003) identified “uncoordinated donor practices” and “delays in disbursements” as two of the five most burdensome donor practices. In October 2004 the Development Committee of the IMF and the World Bank called for the provision of “predictable and timely financial assistance to countries committed to sound policies,” (IMF, 2004). The U.K. proposed the International Finance Facility (IFF), a plan to increase aid flows with a goal of achieving the Millennium Development Goals, stating that the IFF would provide “for the first time, a predictable and stable flow of a critical mass of aid” (DFID, 2003). More generally, the international financial community has acknowledged the problem of macroeconomic volatility in low-income countries, and called for the creation of new mechanisms aimed at reducing low-income countries’ vulnerability to shocks. Yet, one is left with the impression that problems of low-income countries are not treated in a systematic manner (Lockhart, 2005). Specifically, the implicit goal of consumption smoothing, whose achievement could lead to sizeable welfare gains in low-income countries, needs to be better integrated into the analysis. This will require greater recognition by donors and IFIs of the magnitude of the problem and also their commitment to make a reduction in volatility an explicit goal of development assistance. For the IFIs the challenge is one of improving program design, particularly in the area of contingency planning. For bilateral donors, it implies preventing aid from becoming a source of macroeconomic volatility and allowing a part of aid to be used with the explicit purpose of neutralizing other sources of volatility. For their part, aid-recipient countries need to commit to less erratic policy implementation. The rest of the paper is organized as follows. First, we outline the problem. Second, we describe the data. Third, we analyze in turn three alternative interpretations of aid volatility: relative volatility vis-à-vis fiscal revenue, unpredictability of aid disbursement as compared to commitments, and failure of aid to smooth fluctuations in aggregate income. Finally, we draw some policy implications.

- 4 -
II. VOLATILITY AND PREDICTABILITY OF AID: WHAT EXACTLY IS THE ISSUE?
Volatility of aid was not an issue in much of the earlier literature and until the late 1990s, economists typically looked at aid committed and disbursed over long periods of time.2 Subsequent research then showed that volatility of aid significantly exceeds that of other macroeconomic variables, such as GDP or fiscal revenue (Pallage and Robe, 2001 or Bulíř and Hamann, 2003). Aid was also found weakly procyclical, that is, it tends to be disbursed in periods when output or domestic revenue is high. The consequences of aid volatility for aggregate growth and consumption were found to be very high, approximately equivalent to the impact of the Great Depression (Lensink and Morrisey, 2000; Pallage and Robe, 2003; or Arellano et al., forthcoming). The potential gains related to the stability of aggregate consumption associated with disbursing aid in a stable and predictable manner are massive. In other words, poorly delivered aid—either in an unreliable or procyclical manner, or both—can diminish the potential benefits of aid. The experience shows that these shortcomings of aid are not easy to fix as procedures for aid disbursement seem to be firmly based on donors’ own budgetary procedures. First, aid volatility reflects deeper problems with the way donor budgets are approved and administered.3 Typically, donor development agencies are different from those that approve aid (parliaments) and budget and disburse it (ministries of finance). While the magnitude of this disconnect differs from country to country, it seems to be widespread. A second source of aid volatility is conditionality—not only the conditions attached by bilateral donors, but frequently the requirement that aid recipients have the seal of approval of an on-track IMF-supported program. There are two sides to this issue. From the country’s point of view, it means that complying with conditionality is important not only because of the merits of the policies to which conditions are attached but because it reduces volatility in aid inflows (Bulíř and Lane, 2004). But from the donor perspective, there is an obvious tension between the need to ensure that “good policies” are being implemented versus the negative impact of disruptions in aid disbursements. Unreliability of aid means different things to different people. First, one approach is to compare the statistical properties of aid with other relevant macroeconomic variables. These results have implications for the design of intertemporal fiscal policies. Second, it has been argued that year-on-year volatility of aid does not matter as long as committed aid matches disbursed aid. The issue from the donors’ standpoint is how to reduce the gap between commitments and disbursements and, from the recipients’ standpoint, how to take this gap into account in designing fiscal policy. Third, to the extent that aid receipts are an important source of income in many countries, often accounting for 20 percent or more of gross 2 The neglect of volatility was not unique to development economics as the link between volatility and growth was demonstrated only by Ramey and Ramey (1995).
3 The U.S. exemplifies the vagaries of donors’ aid budgets: the administration announced that it would ask Congress for U.S.$1.7 billion in 2004 but it asked for U.S.$1.3 billion. In the end, only U.S.$1 billion was approved by Congress, see New York Times (2005).

- 5 -
national income, it matters whether aid increases coincide with positive income shocks (procyclical aid) or whether aid increases smooth out negative income shocks (countercyclical aid). In this paper, which broadly follows the methodology of Bulíř and Hamann (2003), however with series extended until 2003 and some modifications, we find that volatility of aid was a multiple of that of domestic fiscal revenue. Furthermore, we find little evidence that aid volatility decreased recently, for example in the context of the Poverty Reduction and Growth Facility (PRGF) or Highly Indebted Poor Country (HIPC) initiatives launched by donors in the late 1990s. Aid commitments remained poor predictors of disbursements and that was particularly true in poorest countries in our sample. As far as macroeconomic shocks are concerned, aid failed to compensate for negative GDP shocks. For example, in 1975-2003 countries hit by negative GDP shocks equivalent to 5 percent or more could expect increased aid in only about one-fifth of all cases. While the paper does not provide a direct test of how the various recent initiatives aimed at improving donor practices, poverty assessments, program design, and so on have fared, it does call into question whether they have had any meaningful impact on the way aid has been delivered. We take this to mean that it is very likely that the main factors underlying the problem of aid volatility and unpredictability have not been confronted or addressed, or both, a situation that does not bode well for the success of the new initiatives and lending facilities that are being proposed to tackle low-income countries’ vulnerability to external shocks.
III. DATA ISSUES
In this section we review our data and summarize the associated measurement problems. Compared to Bulíř and Hamann (2003), the sample was extended, some countries were added and gaps in the coverage of domestic fiscal revenue were filled.
A. The Dataset
Our database covers 76 countries from 1975 to 2003. The data on aid (disbursements and commitments) were taken from the World Bank’s World Development Indicators (WDI), which, in turn, are based on OECD data of Official Development Assistance (ODA). Fiscal data used in the paper—total domestic revenue in local currency—were drawn from the IMF’s International Financial Statistics (IFS) and the IMF’s regional databases, such as the WETA database for Sub-Saharan Africa. All other series—nominal GDP in local currency and in purchasing power parity terms (PPP), market and PPP-based exchange rates vis-à-vis the U.S. dollar, and population—were drawn from the IMF’s World Economic Outlook (WEO). We have 29 annual observations for 50 countries and 24 annual observations for 18 countries in Sub-Saharan Africa, where the revenue series do not start until 1980 (Table A1). The remaining 8 countries are former communist states that started receiving aid only in the early 1990s and whose series are available for the last 9 to 12 years.

- 6 -
B. Common Denominator for Aid and Fiscal Revenue
The choice of a common denominator matters for the statistical measures of relative volatility. Typically, aid is denominated in U.S. dollars whereas domestic revenue is denominated in local currency units. Comparisons require first expressing both variables in the same currency and, as a result, statistical measures of relative volatility are affected by the exchange rate. The impact of exchange rate volatility can be very large: on average, the coefficient of variation of the exchange rate is 30-40 forty times higher than that of revenue. To control for the impact of exchange rate volatility we use three common denominators: percentages of nominal GDP, constant U.S. dollars in per capita terms, and percentages of purchasing power parity (PPP) GDP. Arguably, denominating aid and revenue in per capita U.S. dollars is preferable if they both were to be spent on tradable goods, whose prices tend to be fixed in U.S. dollars (Bulíř and Lane, 2004). In reality, a significant portion of aid proceeds is spent on nontradable goods. More generally, if the objective is to assess the macroeconomic impact of aid, the relevant denominator is the aid-to-GDP ratio. Using PPP-based GDP and PPP-based exchange rates as opposed to nominal GDP and market exchange rates should, in principle, reduce the exchange rate volatility presented in the previous two calculations.
IV. MEASURING THE RELATIVE VARIABILITY OF AID AND REVENUE
As stated earlier, the aim of this paper is to re-examine the evidence on volatility and predictability of aid since our previous study. Years 1999-2000 provide a natural breaking point for the analysis as the introduction of the Poverty Reduction Strategy Papers (PRSP) was expected to address some the inefficiencies in aid allocation, such as insufficient donor coordination or a lack of ownership by recipient countries. Specifically, we try to answer three questions. First, does aid continue to be for the most part more volatile than domestic revenue? Second, has aid become more predictable? That is, are aid disbursements better related to donor commitments? Third, are aid inflows related to macroeconomic shocks in the recipient countries?
A. Methodology
We follow closely the methods used in Bulíř and Hamann (2003). After downloading the raw data (aid in U.S. dollars and revenue in domestic currency) and expressing both series in common denominators (percentages of nominal GDP, percentages of PPP GDP, and constant per capita U.S. dollars), we take the natural logarithm in order to have both aid and revenue on the same scale. Next, we detrended aid and revenue series and calculated the sample variances of these series, Aθ and Rθ , respectively. A measure of relative volatility is then defined as the average of the ratio of these variances, RA θθ /=Φ . In particular, we: (i) calculate Φ for each country; (ii) test the significance of sample averages and medians across countries by an F-test; (iii) calculate the correlation coefficient of detrended aid and revenue, which amounts to a test of aid procyclicality as revenues are a strongly procyclical variable; and (iv) in order to check the robustness of our results, we arrange countries into three sub-groups according to their degree of aid dependency, and compare the results for the full sample with those obtained for the smaller samples.

- 7 -
B. Results
Building on a larger sample of aid and revenue data and a statistical methodology that focuses on pure volatility of aid and revenue, our findings are comparable to Bulíř and Hamann (2003). On this basis, we find no positive impact of recent aid initiatives on the relative volatility of aid.4 More specifically, we find that aid (i) has been much more volatile than domestic revenue and that its volatility has increased recently, (ii) remained unpredictable and (iii) did not act as a buffer against GDP shocks. Aid volatility We find that, first, the volatility of aid is much higher than that of revenue and, second, the relative volatility of aid increased in the late 1990s and remained high in the early 2000s (Table 1). These results are statistically significant. The average volatility of aid (Φ) is about 40 times and 20 times higher than that of revenue when expressed in percent of GDP and constant U.S. dollars per capita, respectively. Using medians, which are arguably better statistics in the presence of large outliers, the respective estimates of the relative volatility of aid are 23 and 6. Furthermore, the relative volatility of aid is the highest in the subsamples of the least and most aid-dependent countries, defined as having aid-to-revenue ratios of less than 25 percent and more than 50 percent, respectively. Using medians, the picture is somewhat different—Φ appears to decline with the increase of the aid-to-revenue ratio. Cases of aid being less volatile that revenue are rare: one in the GDP-based series and three in U.S. dollar per capita series. On average, aid is delivered in a procyclical fashion—the average of individual-country correlation coefficient between aid and revenue is positive and statistically significant. Procyclicality is in part owing to conditionality—when a country's policies go off-track, aid flows slow down. The introduction of the PRSP in 1999 and related efforts at strengthening ownership, improving program design, and promoting donor coordination do not seem to have affected the relative volatility of aid—aid has become more volatile in the late 1990s and 2000s as compared to 1970s and 1980s and there are a few ways of documenting it (Table 2). First, the average volatility of aid (Φ) was higher in the full sample (1975-2003) than in a subsample that excludes the last five years (1975-1999). This result is robust across the three different common denominators used in this paper as well as across averages and medians. Second, during 2000-2003 (the post-PRSP period) compared with 1995-1998 (the pre-PRSP period), 5 the relative volatility of aid increased when measured by averages and roughly doubled 4 We hasten to say that this study does not present a counterfactual model of donor behavior in the absence of PRSP/PRGF—it could be argued that without these initiatives aid would be more volatile than with them. Having said that, the available evidence makes us doubt this line of argumentation.
5 We take 1999 as an interim period.

- 8 -
Table 1. Aid Is More Volatile Than Revenue and Procyclical 1/ (Relative volatility of aid and revenue (Φ), correlation coefficient, and aid-to-revenue ratio)
Full Sample Subsample 1 (A/R<25%)
Subsample 2 (25%<A/R<50%)
Subsample 3 (A/R>50%)
Average 43.2 *** 65.8 *** 22.8 *** 87.8 ***Median 12.5 ** 22.6 *** 11.1 ** 9.6 **
Frequency indicatorsSample size 76 15 47 14Number of countries where Φ > 1 75 15 46 14Number of countries where Φ < 1 1 0 1 0
Procyclicality of aid 2/ 0.15 *** 0.07 0.20 *** 0.04Number of countries where corr > 0 51 9 35 7
Aid-to-revenue ratio (in percent) 36.8 17.6 36.1 59.7
Average 17.9 *** 33.5 *** 10.7 *** 24.6 ***Median 6.0 * 6.3 *** 6.3 ** 4.4
Frequency indicatorsSample size 76 15 46 15Number of countries where Φ > 1 73 15 45 13Number of countries where Φ < 1 3 0 1 2
Procyclicality of aid 2/ 0.39 *** 0.30 *** 0.45 *** 0.28 ***Number of countries where corr > 0 64 14 38 12
Aid-to-revenue ratio (in percent) 37.3 17.8 36.2 59.9
Average 38.7 *** 26.3 *** 22.2 *** –Median 12.2 ** 11.7 ** 15.6 *** –
Frequency indicatorsSample size 76 67 8 1Number of countries where Φ > 1 75 66 8 1Number of countries where Φ < 1 1 1 0 0
Procyclicality of aid 2/ 0.07 0.06 0.23 –Number of countries where corr > 0 43 38 5 –
Aid-to-revenue ratio (in percent) 16.1 13.7 27.1 –
Source: Authors' calculations.1/ All variables are in natural logs and filtered by the Hodrick-Precott procedure. Φ is a ratio of variances. '***, **, and *'denote significance at the 1, 5, and 10 percent level, respectively. The null hypothesis is Φ>1.2/ Procyclicality is measured by a Pearson correlation coefficient between detrended aid and revenue; average of country-specific correlation coefficients. The null hypothesis is corr(A; R)>0.
Variables expressed in percent of GDP
Variables expressed in constant U.S. dollars per capita
Variables expressed in percent of PPP GDP

- 9 -
Table 2. During 2000-2003 Aid Has Been More Volatile Than Ever Before (Relative volatility of aid and revenue (Φ))
Full Period 1975-1998 1/ 1995-1998 2000-2003
Average 43.2 *** 35.2 *** 244.0 *** 264.9 ***Median 12.5 ** 11.0 * 22.6 ** 46.8 **
Frequency indicatorsSample size 76 76 76 76Number of countries where Φ > 1 75 73 72 76Number of countries where Φ < 1 1 3 4 0
Average 17.9 *** 15.7 *** 81.1 *** 152.8 ***Median 6.0 * 5.2 9.9 16.3 *
Frequency indicatorsSample size 76 76 76 76Number of countries where Φ > 1 73 73 66 70Number of countries where Φ < 1 3 3 10 6
Average 38.7 *** 31.1 *** 221.1 *** 243.3 ***Median 12.2 ** 10.7 * 23.4 40.7 ***
Frequency indicatorsSample size 76 76 76 76Number of countries where Φ > 1 75 73 69 76Number of countries where Φ < 1 1 3 7 0
Source: Authors' calculations.
1/ '***, **, and *'denote significance at the 1, 5, and 10 percent level, respectively. The null hypothesis is Φ>1.2/ For the exact starting year for each individual country see Table A1.
Variables expressed in percent of GDP
Variables expressed in constant U.S. dollars per capita
Variables expressed in percent of PPP GDP

- 10 -
when measured by medians.6 Furthermore, the 1995-1998 and 2000-2003 Φ averages are much larger than the full sample average. This raises an interesting question: since when has aid volatility increased? We find that aid volatility increased sharply in the mid-1990s and remained relatively stable afterward (Figure 1). From 1975 to 1994, the Φs have been relatively stable around a mean of 50 and 20 for the series in percentages of GDP and U.S. dollars per capita, respectively. Starting in the mid-1990s, the average Φ quintupled for all denominators. With the exception of the series in percentages of PPP-based GDP that recorded a small decline in 2000-2003, all other results point to a further increase in relative volatility of aid. Aid predictability It could be argued that aid volatility—variation vis-à-vis a trend—would be less of a problem as long as aid could be delivered in a predictable manner.7 An admittedly rudimentary assessment of predictability based on contrasting aid commitments and disbursements yields little evidence that aid predictability has improved recently. On average, actual aid delivery falls short of promises by more than 40 percent, in particular in the poorest countries. Furthermore, there is little evidence that aid predictability improved recently. While promises of future aid became more predictable in the 1980s as compared to the 1970s, the trend stopped in the 1990s and indeed in 1999-2001 disbursements fell short of commitments by more than 50 percent (Figure 2, upper panel). In other words, donors promised one-half more than they disbursed. Indeed, in 1999-2001, the last period for which aid commitments are available, the commitment-to-disbursement ratio was at its highest level for 20 years. Moreover, we find evidence that the increase in the commitment-to-disbursement ratio was driven by larger commitments During 1999-2001 commitments increased by about 4 percent, while disbursements declined by some 5 percent as compared to 1995-98. Even more disturbing is the finding that unpredictability of aid is negatively correlated with the level of development as measured by GDP per capita. The poorest countries have received a smaller share of promised aid than countries with higher incomes (Figure 2, bottom panel). While countries at the upper end of the income scale have on average received as much aid as promised, countries at the lower end of the income scale have received only about 50 percent of promised aid. Thus, we find it hard to substantiate the argument that aid has been delivered predictably, thus offseting the negative impact of aid volatility.
6 The increases in relative volatility were large in several Sub-Saharan African countries, such as Uganda, Tanzania, Rwanda, and others.
7 It is a weak argument, however, as all aid-dependent countries are liquidity constrained—they cannot borrow in capital markets even if they know the pattern of aid disbursements.

- 11 -
Figure 1. Selected Countries: Relative Volatility of Aid and Revenue, Φ, 1975-2003 1/(Sample median, N=50)
Source: World Development Indicators, IMF (various sources); authors' calculations.
1/ Only countries with complete series (1975-2003) are used in the calculation of the median.
The ratio of aid and revenue volatility(In percent of GDP)
0
50
100
150
200
250
300
75-78 79-82 83-86 87-90 91-94 95-98 00-03
The ratio of aid and revenue volatility(In constant US$ per capita)
0
50
100
150
200
250
300
75-78 79-82 83-86 87-90 91-94 95-98 00-03
The ratio of aid and revenue volatility(In percent of PPP GDP)
0
50
100
150
200
250
300
75-78 79-82 83-86 87-90 91-94 95-98 00-03

- 12 -
Figure 2. Aid Commitments Are Poor Predictors of Disbursements, 1975-2001 1/(Commitment-to-disbursement ratio)
Source: World Development Indicators; authors' calculations.
1/ Period sample averages, N=76.
Over time...
1.00
1.25
1.50
1.75
2.00
75-78 79-82 83-86 87-90 91-94 95-98 99-01
C-to
-D R
atio
... and in low-income countries 1/
0.50
0.75
1.00
1.25
1.50
1.75
2.00
2.25
2.50
1 10 100 1000
PPP GDP per capita (log)
C-to
-D R
atio
`
IndonesiaPapua New Guinea
Lesotho
Gambia Nepal
Tajikistan
Swaziland
Turkey
Thailand
- 13 -
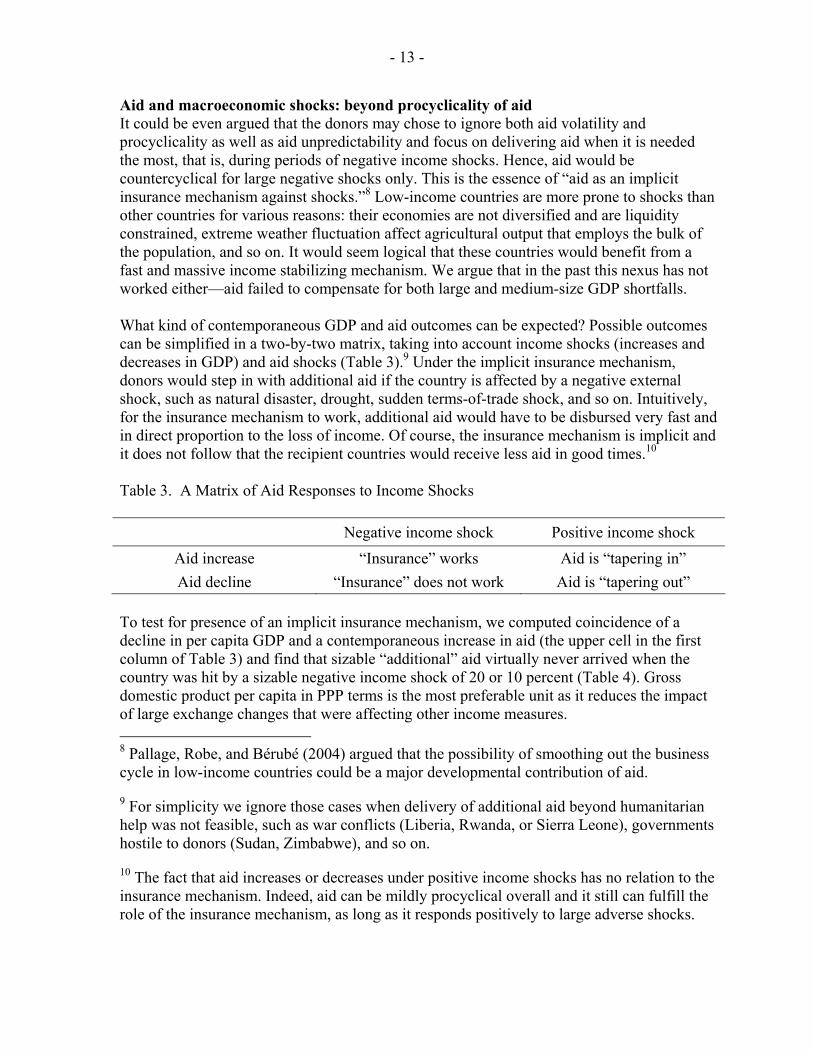
Aid and macroeconomic shocks: beyond procyclicality of aid It could be even argued that the donors may chose to ignore both aid volatility and procyclicality as well as aid unpredictability and focus on delivering aid when it is needed the most, that is, during periods of negative income shocks. Hence, aid would be countercyclical for large negative shocks only. This is the essence of “aid as an implicit insurance mechanism against shocks.”8 Low-income countries are more prone to shocks than other countries for various reasons: their economies are not diversified and are liquidity constrained, extreme weather fluctuation affect agricultural output that employs the bulk of the population, and so on. It would seem logical that these countries would benefit from a fast and massive income stabilizing mechanism. We argue that in the past this nexus has not worked either—aid failed to compensate for both large and medium-size GDP shortfalls. What kind of contemporaneous GDP and aid outcomes can be expected? Possible outcomes can be simplified in a two-by-two matrix, taking into account income shocks (increases and decreases in GDP) and aid shocks (Table 3).9 Under the implicit insurance mechanism, donors would step in with additional aid if the country is affected by a negative external shock, such as natural disaster, drought, sudden terms-of-trade shock, and so on. Intuitively, for the insurance mechanism to work, additional aid would have to be disbursed very fast and in direct proportion to the loss of income. Of course, the insurance mechanism is implicit and it does not follow that the recipient countries would receive less aid in good times.10 Table 3. A Matrix of Aid Responses to Income Shocks
Negative income shock Positive income shock Aid increase “Insurance” works Aid is “tapering in” Aid decline “Insurance” does not work Aid is “tapering out”
To test for presence of an implicit insurance mechanism, we computed coincidence of a decline in per capita GDP and a contemporaneous increase in aid (the upper cell in the first column of Table 3) and find that sizable “additional” aid virtually never arrived when the country was hit by a sizable negative income shock of 20 or 10 percent (Table 4). Gross domestic product per capita in PPP terms is the most preferable unit as it reduces the impact of large exchange changes that were affecting other income measures. 8 Pallage, Robe, and Bérubé (2004) argued that the possibility of smoothing out the business cycle in low-income countries could be a major developmental contribution of aid.
9 For simplicity we ignore those cases when delivery of additional aid beyond humanitarian help was not feasible, such as war conflicts (Liberia, Rwanda, or Sierra Leone), governments hostile to donors (Sudan, Zimbabwe), and so on.
10 The fact that aid increases or decreases under positive income shocks has no relation to the insurance mechanism. Indeed, aid can be mildly procyclical overall and it still can fulfill the role of the insurance mechanism, as long as it responds positively to large adverse shocks.

- 14 -
Table 4. Aid Is Poor Insurance Against Negative GDP Shocks, 1975-2003 1/ (Coincidence of GDP declines and contemporaneous aid increases, in percent)
20 10 5 2 ½(11) (27) (57) (95)
Aid increase 2/(Number of events)
10(31)
5(117)
2 ½(275)
1(532)
3/ Instances in which a given GDP shock (column) coincides with a given increase in aid(row). Expressed as a percent of GDP decline events. N=2,010.Notes: The interpretation of the first cell in the first row is that out of 11 cases of annualGDP declines of 20 percent or more zero percent of them coincided with an aid increase of 10 percent or more, of which there were 31 in the sample.
17.5 13.7
0.0 0.0 1.8 2.1Coincidence 3/
Coincidence 3/
1/ GDP per capita in constant PPP US dollars.
20.021.114.89.1
0.0 11.1
2/ Change in aid disbursements, in percentage points of GDP.
29.8 28.436.4 33.3
Source: Authors' calculations.
Coincidence 3/
Coincidence 3/
GDP decline in percent 1/(Number of events)
In those cases where additional aid was disbursed, it was typically far less than the initial GDP decline.11 For example, in our sample of 2,010 annual observations we have 27 occurrences of PPP GDP per capita falling by 10 percent or more. Although we have 31 occurrences of aid increasing by 10 percentage points of GDP, these increases did not coincide with the GDP shock. Of the 117 occurrences of aid increasing by 5 percentage points, these increases coincided with a large negative GDP shock in only three cases or 11 percent of total (Jordan 1989, Mozambique 1983, and Tajikistan 1994). These results are fairly similar for smaller GDP shocks (5 and 2½ percent): the chance of receiving additional aid in the wake of a GDP shock is between 10 and 20 percent for sizable aid increases (5 and 2½ percent of GDP) and 30 percent for small aid (1 percent of GDP or less). Furthermore, very few of those coincidences occurred in the 2000s. 11 We note that disbursements under IMF-supported programs are not counted as a part of aid. While some of the recent design changes of those programs, such as speedy augmentation of disbursements, could make an IMF-inclusive definition of aid more countercyclical, the amount of money involved is typically too small to reverse our findings.

- 15 -
It is not just that additional aid does not arrive on time, it often does not arrive at all. We tested also the possibility of aid arriving late, that is, coincidence of a negative income shock at time t and a positive aid shock in time t+1 and found that on average they were substantially smaller than for contemporaneous aid. Even when we considered jointly contemporaneous and lagged aid, the joint coincidence remained below one-third for additional aid equivalent to at least 2½ percentage points of GDP (the detailed results are available from the authors upon demand). Table 5. Negative Income Shocks Coincide with Negative Aid Shocks, 1975-2003 1/
(Coincidence of GDP declines and contemporaneous aid declines, in percent)
20 10 5 2 ½(11) (27) (57) (95)
Aid decrease 2/(Number of events)
10(33)
5(117)
2 ½309)
1(627)
3/ Instances in which a given GDP shock (column) coincides with a given decrease in aid(row). Expressed as a percent of GDP decline events. N=2,010.Notes: The interpretation of the first cell in the third row is that out of 11 cases of annualGDP declines of 20 percent or more 18.2 percent of them coincided with an aid decline of 2.5percent or more, of which there were 309 in the sample.
2/ Change in aid disbursements, in percentage points of GDP.
33.3 31.6
Source: Authors' calculations.
1/ GDP per capita in constant PPP US dollars.
Coincidence 3/ 27.3 29.6
3.5 3.2
Coincidence 3/ 18.2 18.5 17.5 15.8
Coincidence 3/ 0.0 3.7
Coincidence 3/ 0.0 3.7 1.8 1.1
GDP decline in percent 1/(Number of events)
We can also test the opposite relationship, that is, of rejecting the existence of an insurance mechanism (Table 5). To this end, we estimated the coincidence of negative income shocks and aid decreases—the bottom cell in the first column of Table 3—and found that aid was just as likely to decrease as it was to increase in the wake of a negative GDP shock.12 For
12 The coincidence of aid increases and decreases in the wake of negative income shocks can be assessed by comparing the individual cells in Tables 4 and 5, respectively.

- 16 -
example, following a GDP decline of 10 percent, the coincidence of aid decreasing by 2 ½ and 1 percentage points were 19 percent and 30 percent, respectively. (For comparison, the coincidence of aid increasing by 2 ½ and 1 percentage points were 15 percent and 33 percent, respectively.) In sum, we find little evidence that in 1975-2003 aid has served as an insurance scheme against large macroeconomic shocks.
V. CONCLUSIONS AND POLICY IMPLICATIONS
The discussion of aid effectiveness has been gradually moving away from narrowly defined measures of success, such as economic growth, poverty headcount, and so on, to broader ones that encompass other aspects of the well being of aid recipients. The issue of the large economic costs associated with macroeconomic volatility in low income countries and, in particular, the role played by an erratic stream of aid disbursements, is only now starting to be addressed in a systematic manner. Significant work remains to be done in order to understand the real extent of the problem and its key underlying drivers. In this paper, we re-examine some of the issues taken up in Bulíř and Hamann (2003) on the volatility, predictability and cyclicality of aid. The availability of 6 new years of data allows us to look closely at whether the way in which aid is disbursed has improved since the late 1990s following the introduction of various initiatives aimed at strengthening existing frameworks for granting debt relief (HIPC); sharpening diagnoses of poverty and encouraging participatory processes (PRSP); improving the design of macroeconomic programs (PRGF); and enhancing cooperation among donors. All this was expected to lead to better compliance with conditionality and a more predictable and less erratic stream of aid flows into low-income countries. Better compliance with conditionality along with improved donor practices should have also led to aid being less procyclical. The results of our paper are not encouraging. A retrospective analysis shows that aid has been more volatile than domestic fiscal revenues by a large margin. Looking more closely at recent developments, we find little evidence that aid volatility has decreased. Aid commitments continue to be poor predictors of disbursements, a problem that is particularly serious among the countries with the lowest per capita incomes. The results are equally disappointing for the cyclical behavior of aid—disbursements were found to be procyclical on average and, worse, we find strong evidence that aid has failed to play any meaningful role in assisting countries to cope with large negative income shocks. For example, of all countries hit by negative GDP shocks of at least 5 percent, only one-fifth benefited from a concomitant increase in aid and the ratio declined to one-seventh during 2000-2003. Although the paper does not test the impact of the above-mentioned recent initiatives, the results lead us to the conclusion that the main factors underlying the problem of aid volatility and unpredictability have not been addressed. This leaves us with the following question: What next? In our view, ongoing work on strengthening the role of donors in assisting low-income countries should (i) give macroeconomic stability the prominence it deserves and make it an explicit goal of development assistance; and (ii) discuss the various mechanisms through which aid can help in achieving this goal. The most obvious way in which donors can foster a more stable environment relates to aid flows: aid needs to be disbursed in a more stable and predictable manner. Donors also need to recognize the
- 17 -
benefits of disbursing aid in a countercyclical manner: they should strive to find ways to respond more quickly and more efficiently to large adverse shocks. But the potential for aid to reduce volatility in low-income countries is not confined to changing the time series properties of aid flows from the donor side. Aid can be used in other ways to this end. Targets for reserve accumulation in IMF-supported programs could be formulated taking into account the various sources of external volatility of a country, and aid could be used to fund this accumulation. Designing rules determining the circumstances under which these funds could be used and when they need to be replenished could be part of IMF-supported programs. Key for this to work is, of course, an acknowledgment by donors that there are tangible, meaningful economic gains associated with the use of aid as an instrument to build reserves. Given the existing uncertainty of aid receipts, how should aid-dependent countries design their fiscal policies? First, a commitment by aid-recipient countries to less erratic policy implementation and improved compliance with program conditions would go a long way toward more predictable aid. Second, given the complexities of donor budgets, the most sensible advice seems to be plan the use of aid conservatively and keep a cushion of international reserves that could be drawn down to compensate for shortfalls in aid.

- 18 -
REFERENCES
Arellano, Cristina, Aleš Bulíř, Timothy Lane, and Leslie Lipschitz, forthcoming, The Dynamic Implications of Foreign Aid and Its Variability, IMF Working Paper (Washington: International Monetary Fund).
Department for International Development and Her Majesty’s Treasury, 2004, “The
International Finance Facility,” (London: HMT and DFID). Available via the internet: http://www.hm-treasury.gov.uk/media/D64/78/IFF_proposal_doc_080404.pdf.
Birdsall, Nancy, 2004, “Seven Deadly Sins: Reflections on Donor Failings,” CGD Working
Paper No. 50 (Washington: Center for Global Development). Available via the internet: http://www.cgdev.org/docs/Working%20Paper%2050.pdf
Bulíř, Aleš, and A. Javier Hamann, 2003, “Aid Volatility: An Empirical Assessment,” IMF
Staff Papers, Vol. 50, No. 1, pp. 64–89. Available via the internet: http://www.imf.org/External/Pubs/FT/staffp/2003/01/bulir.htm
Bulíř, Aleš, and Timothy Lane, 2004, “Aid and Fiscal Management,” in Helping Countries
Develop: The Role of Fiscal Policy, ed. by Gupta, S., Clements, B. and Inchauste, G. (Washington: International Monetary Fund).
OECD, 2003, “Harmonising Donor Practices for Effective Aid Delivery,” DAC Guidelines
and Reference Series, (Paris: OECD, Development Assistance Committee). Available via the internet: http://www.oecd.org/dataoecd/0/48/20896122.pdf.
International Monetary Fund, 2004, Development Committee Communiqué, (Washington:
International Monetary Fund). Available via the internet: http://www.imf.org/external/np/cm/2004/100204a.htm.
Lensink, Robert and Oliver Morrisey, 2000, “Aid Instability as a Measure of Uncertainty and
the Positive Impact of Aid on Growth,” Journal of Development Studies, Vol. 36, (February), pp. 31–49.
Lockhart, Clare, 2005, “From Aid Effectiveness to Development Effectiveness: Strategy and
Policy Coherence in Fragile States,” background paper prepared for the Senior Level Forum on Development Effectiveness in Fragile States (January 13-14, 2005, London).Available via the internet: http://www.oecd.org/dataoecd/33/11/34258843.pdf.
New York Times, 2005, “America’s Promises,” The New York Times, 28 January 2005. Pallage, Stéphane and Michel A. Robe, 2001, “Foreign Aid and the Business Cycle,” Review
of International Economics, Vol. 9, (November), pp. 636–67. ______, 2003, “On the Welfare Cost of Economic Fluctuations in Developing Countries,”
International Economic Review, Vol. 44, (May), pp. 677–98.

- 19 -
Pallage, Stephane, Michel Robe, and Catherine Bérubé, 2004, “On the Potential of Foreign
Aid as Insurance,” CIRPEE Working Paper 04-04 (Montreal, QC: Cahier de recherché). Available via the internet: http://132.203.59.36/CIRPEE/cahierscirpee/2004/files/CIRPEE04-04.pdf.
Ramey, Garey, and Valeri A. Ramey, 1995, “Cross-Country Evidence on the Link Between
Volatility and Growth,” The American Economic Review, Vol. 85, (December), pp. 1138–1151.
World Bank, 2000, Small States: Meeting Challenges in the Global Economy, Report of the
Commonwealth Secretariat/World Bank Joint Task Force on Small States (Washington: The World Bank). Available via the internet: http://wbln0018.worldbank.org/html/smallstates.nsf/(attachmentweb)/final/$FILE/final.pdf.

- 20 -
ANNEX Selected Methodological Issues
The following filters were applied to the universe of aid recipients. First, all countries had to receive aid during the period under consideration (the minimum number of annual observation is 9 for Tajikistan). Second, to address the small-country bias, only countries with average population of more than 500,000 were included, eliminating most small island countries.13 Third, to focus our analysis on countries where aid has some minimal macroeconomic impact, we included only countries where the sample aid-to-GDP ratio is more than 1 percent. Thus, we excluded countries that receive either little aid or receive it only sporadically, such as the so-called capital account crisis countries. Finally, to concentrate on development aid, we limited our sample to countries with average US$ GDP per capita below 3,000, eliminating countries like Argentina or Brazil. We found that both aid and revenue series are nonstationary, or, in a few cases, stationary around a deterministic trend, a result similar to that in Bulíř and Hamann (2003). Thus, we detrended our aid and revenue series using the Hodrick-Prescott filter (HP) and only then computed conventional measures of volatility. Following Pesaran and Pesaran (1997), we set the Hodrick-Prescott smoothing coefficient λ at 7. Changing the value of λ does not seem to affect the estimated average relative volatility of aid and revenue, although it affects sample variance of individual series.
13 For the small country bias see, for example, World Bank (2000).

- 21 -
Table A1. List of Countries and Sample Periods
Country Years Country Years
Albania 1992-2003 Kyrgyz Republic 1993-2003Algeria 1975-2003 Lao People's Dem.Rep 1975-2003Angola 1981-2003 Lebanon 1975-2003Armenia 1994-2003 Lesotho 1975-2003Bangladesh 1975-2003 Madagascar 1978-2003Benin 1975-2003 Malawi 1975-2003Bhutan 1981-2003 Mali 1975-2003Bolivia 1975-2003 Mauritania 1975-2003Burkina Faso 1975-2003 Mongolia 1975-2003Burundi 1980-2003 Morocco 1992-2003Cambodia 1987-2003 Mozambique 1975-2003Cameroon 1980-2003 Nepal 1980-2003Central African Rep. 1980-2003 Nicaragua 1975-2003Chad 1980-2003 Niger 1975-2003Colombia 1975-2003 Nigeria 1980-2003Comoros 1980-2003 Pakistan 1975-2003Congo, Dem. Rep. of 1980-2003 Papua New Guinea 1975-2003Congo, Republic of 1980-2003 Paraguay 1975-2003Côte d'Ivoire 1980-2003 Peru 1975-2003Djibouti 1980-2003 Philippines 1975-2003Dominican Republic 1975-2003 Rwanda 1975-2003Ecuador 1975-2003 Senegal 1975-2003Egypt 1975-2003 Sierra Leone 1975-2003El Salvador 1975-2003 Sri Lanka 1975-2003Ethiopia 1980-2003 Sudan 1975-2003Fiji 1975-2003 Swaziland 1975-2003Gambia, The 1975-2003 Syrian Arab Republic 1975-2003Ghana 1975-2003 Tajikistan 1992-2003Guatemala 1975-2003 Tanzania 1975-2003Guinea 1980-2003 Thailand 1975-2003Guinea-Bissau 1980-2003 Togo 1975-2003Guyana 1975-2003 Tunisia 1975-2003Haiti 1975-2003 Turkey 1975-2003Honduras 1975-2003 Uganda 1975-2003Indonesia 1975-2003 Vietnam 1981-2003Jamaica 1975-2003 Yemen, Republic of 1975-2003Jordan 1975-2003 Zambia 1975-2003Kenya 1975-2003 Zimbabwe 1978-2003