prepared by gl noble denton for the health and safety
TRANSCRIPT
Health and Safety Executive
Identifying the incidence of electricity-related accidents in Great Britain An update (1996/97 to 2008/09p)
Prepared by GL Noble Denton for the Health and Safety Executive 2011
RR842 Research Report
Health and Safety Executive
Identifying the incidence of electricity-related accidents in Great Britain An update (1996/97 to 2008/09p)
GL Noble Denton Noble House 39 Tabernacle Street London EC2A 4AA
This report analyses RIDDOR based electricity-related accidents covering all industries and is intended to be an update (and standalone report) to the previous HSE research report ‘Identifying the incidence of electricity-related accidents in Great Britain’.
Using certain selection criteria, the full RIDDOR database from 1996/97 to 2008/09p was searched to identify three categories of electricity accident:
a) ‘direct contact’ with electricity; b) ‘electrical based’ accidents; and c) ‘all related’ accidents.
Analysis was carried out using RIDDOR fields such as ‘HSE year’, ‘work process’ and ‘agent’. A number of findings were revealed, including electrical fitters (including electricians) reporting the greatest number of fatalities and non-fatal injuries, with many of the accidents related to contact with electricity (or electrical discharge). However, a number of other accidents were not related to direct contact with electricity, such as handling strains/sprains and high falls. It is proposed that the results of this report constitute an updated evidence base indicating possible priority areas for intervention by the HSE.
This report and the work it describes were funded by the Health and Safety Executive (HSE). Its contents, including any opinions and/or conclusions expressed, are those of the authors alone and do not necessarily reflect HSE policy.
HSE Books

© Crown copyright 2011
First published 2011
You may reuse this information (not including logos) free of charge in any format or medium, under the terms of the Open Government Licence. To view the licence visit www.nationalarchives.gov.uk/doc/open-government-licence/, write to the Information Policy Team, The National Archives, Kew, London TW9 4DU, or email [email protected].
Some images and illustrations may not be owned by the Crown so cannot be reproduced without permission of the copyright owner. Enquiries should be sent to [email protected].
ii

CONTENTS
Page No.
EXECUTIVE SUMMARY
1. INTRODUCTION 1
1.1 INTRODUCTION 1
1.2 CONTEXT OF THE STUDY 1
1.3 OBJECTIVES AND SCOPE OF WORK 1
1.4 SCOPE OF THIS REPORT 2
1.5 HOW TO USE THIS REPORT 2
2. CREATION OF THE ELECTRICITY ACCIDENT DATA SET 4
2.1 INTRODUCTION 4
2.2 CREATION OF THE DATA SET 4
2.3 DATA SET COMPONENTS 4
2.4 DATA SET LIMITATIONS 6
2.5 RIDDOR DATA LIMITATIONS 6
3. MAIN ANALYSIS OF ACCIDENTS INVOLVING ‘DIRECT CONTACT’ WITH ELECTRICITY 8
3.1 INTRODUCTION 8
4. MAIN ANALYSIS OF ‘ELECTRICAL BASED’ ACCIDENTS 11
4.1 INTRODUCTION 11
5. MAIN ANALYSIS OF THE ‘ELECTRICITY-RELATED’ ACCIDENT DATA 50
5.1 INTRODUCTION 50
6. CONCLUSIONS 110
7. RECOMMENDATIONS 119
7.1 GENERAL RECOMMENDATIONS 119
8. REFERENCES 120
iii

121 APPENDIX 1 CREATION OF THE ELECTRICITY DATA SET
iv
EXECUTIVE SUMMARY
INTRODUCTION AND OBJECTIVES
This report has been prepared by GL Noble Denton for the Health and Safety Executive (HSE)
as research contract OH1986, and describes a study on ‘Identifying the incidence of electricity-
related accidents in Great Britain – An update (1996/97 to 2008/09p)’.
In 2003, BOMEL Limited (now incorporated into and known as GL Noble Denton) was
commissioned by the HSE to produce a report looking at a dedicated data set relating to
electrical incidents extracted from the Reporting of Injuries, Diseases and Dangerous
Occurrences Regulations (RIDDOR) database covering 1996/97 to 2002/03. A pan-industry
electrical data set was created, analysed for trends, and the report provided as an evidence base
to inform HSE planning and risk reduction programmes. In 2010, the HSE re-approached GL
Noble Denton to request an update to the research to include data up to and including 2008/09p.
This report details the updated analyses and findings.
The overall aims of this project are to:
1. Develop an electricity-related accident data set from ‘supply to switch’ to provide a
baseline for measuring improvements across a range of industry sectors.
2. Analyse the electricity-related accident data to gain an insight into what type of
accidents occur, who was involved in them and what they were doing at the time.
3. Produce a report that contains analyses of the electricity-related accident data; identify
the key issues; and identify key priority areas for intervention.
DEVELOPMENT OF THE ELECTRICITY-RELATED ACCIDENT DATA SET
A data set containing electricity-related accidents was distilled from the Reporting of Injuries,
Diseases and Dangerous Occurrences Regulations 1995 (RIDDOR) accident database (covering
1996/97 to 2008/09p and consisting of over 1.9 million accidents).
The categorisation of RIDDOR reportable injuries is such that if an electrician fell from a ladder,
the accident may well be coded as a ‘fall’ even if it was contact with electricity that caused the fall.
Therefore, to gain better insight into all those accidents involving working with or around electricity
it is necessary to analyse a larger data set beyond those accidents that have been directly attributed to
electricity. Consequently, a data set was extracted from the main RIDDOR accident database.
The data set had three constituent parts:
Data set 1: ‘Direct contact’ with electricity – this data set is defined purely by the
RIDDOR accident kind categories ‘Electricity’ and ‘Volt’ (i.e. it only includes
accidents reported as being either an ‘Electricity’ or ‘Volt’ accident type).
v
Data set 2: ‘Electrical based’ (including ‘direct contact’) – this larger data set
contains the ‘direct contact’ accidents described above, as well as accidents reported
under other electricity-related RIDDOR categories (e.g. industries such as electricity
production, installation of wiring/fitting, manufacturing of electrical appliances;
occupations such as electrical engineers, electroplaters, etc.).
Data set 3: ‘All related’ accidents (including ‘electrical based’) – this is the full
data set containing the ‘electrical based’ accidents described above (i.e. all accidents
assigned an electricity-related RIDDOR code) and accidents brought in because their
associated accident narrative (i.e. the notifier comment or investigation report)
contains an electricity related keyword (e.g. ‘spark’, ‘plug’, ‘socket’, etc.).
The electricity-related accident data has been incorporated into the Electricity RIDDOR Report
Tool, which has been used for the analyses presented in Chapters 3, 4 and 5.
RESULTS AND CONCLUSIONS
The key results from each main data set reveal:
‘DIRECT CONTACT’ WITH ELECTRICITY ACCIDENTS
6% of all fatalities (168 deaths) over the 13 year period 1996/97 to 2008/09p, across
all industries may be due to direct contact with electricity or electrical shock.
A fluctuating picture in the fatal accidents from 1996/97 to 2008/09p, with a peak of
18 fatalities in 1999/2000. Encouragingly, non-fatal injuries have steadily decreased
over the years.
Overall, this means an average of 13 fatalities per year from 1996/97 to 2008/09p have
been caused by direct contact with electricity. Provisional data suggests that in
2008/09p there were 6 fatalities, which is the lowest number over the 13 years.
‘ELECTRICAL BASED’ ACCIDENTS
10% of all fatalities (287 deaths) over the 13 year period 1996/97 to 2008/09p, across
all industries may be linked to ‘electrical based’ accidents.
Overall, this means in all electrical based work activity from 1996/97 to 2008/09p,
there has been an average of 22 fatalities per year (i.e. accidents appearing under an
electrical RIDDOR category). Provisional data suggests that in 2008/09p there were
11 fatalities, which is the lowest number over the 13 years. As noted earlier, around
13 fatalities per year are due to direct contact with electricity, and additionally an
average of around 4 fatalities per year are due to falls (both high and other types of
falls).
vi
Yearly trends (HSE year):
A fluctuating picture in fatal accidents over the 13 year period 1996/97 to 2008/09p
with a peak of 34 fatalities in 1996/97 which reaches a low of 11 by 2008/09p.
Encouragingly, non-fatal accidents have steadily decreased year-on-year from 1996/97
to 2008/09p.
HSE sectors (Field operations directorate, FOD):
From 1996/97 to 2008/09p, the Construction HSE sector has the highest number of
fatal accidents (127). The Engineering and Utilities HSE sector reports the highest
number of non-fatal accidents (40,235).
Types of accident (Accident kind):
Over the 13 year period 1996/97 to 2008/09p, contact with electricity (or electrical
discharge) is main cause of fatalities (168), and is also relatively significant in non-
fatal injuries (although handling/sprains and trips are more common).
Focusing on the more recent years from 2001/02 to 2008/09p, contact with electricity
(or electrical discharge) is the main cause of fatalities (88), and has a role to play in
non-fatal accidents (3,887). Tripping over obstructions (5,507) and lifting/putting
down loads (3,902) play a more important role in non-fatal accident numbers.
Job role (Occupation):
From 1996/97 to 2001/02 and 2002/03 to 2008/09p, electric fitters (including
electricians) report the highest number of fatalities and non-fatal injuries.
Activity occurring at the time of the accident (Work process):
From 1996/97 to 2000/01, electrical activities have reported the second highest
number of fatal accidents (13), with general maintenance activities involved in the
highest number of fatalities (17). Non-fatal accidents are most commonly associated
with on-site transfer such as movement of persons and materials (7,898) and general
handling (7,345).
From 2001/02 to 2008/09p, electrical activities report the highest number of fatalities
(56), as well as highest number of non-fatal accidents (8,965).
Main object/movement involved in accidents (Agents):
From 1996/97 to 2000/01, unintentional contact with overhead lines and contact with
electricity/electrical discharge involved the highest number of fatalities (20 and 19
respectively). Moving heavy weights or strains/sprains contribute to the highest
numbers of non-fatal injury.
vii
From 2001/02 to 2008/09p, overhead lines are one of the main contributors to
fatalities (20), including other electricity cables which includes those trailing and
buried in walls (20). The greatest number of non-fatal injuries is also associated with
other electricity cables (5,936).
Age:
From 1996/97 to 2008/09p, fatalities are highest for those 25 to 34 and 40 to 54
(around 32 to 34 accidents in each age category). Non-fatal injuries increase from the
16 to 19 age group (3,800) to a peak by 35 to 39 (10,886), steadily decreasing
thereafter. Major injuries levels remain stable from 20 to 54 (around 2,000 accidents
in each age category).
‘ALL RELATED’ ACCIDENTS
40% of all fatalities (1,201 deaths) over the 13 year period 1996/97 to 2008/09p,
across all industries may be potentially linked to ‘all related’ accidents. However, due
to the possible tenuous link, caution should be exercised when using these figures.
Overall, this means in ‘all related’ accidents from 1996/97 to 2008/09p arising from
electrical based work and accidents indirectly related to electricity (where electricity
or electrical components feature in some way, although not necessarily causal in the
fatality), there has been an average of 92 fatalities per year. Provisional data suggest
that in 2008/09p there were 28 fatalities, which is the lowest number over the 13
years. As noted earlier, there is an average of 13 fatalities per year due to direct
contact with electricity, the same annual average number of accidents due to being
struck by moving, flying or falling objects, but less than the average of 18 fatalities
per year due to high falls (above 2 meters).
Yearly trends (HSE year)
A fluctuating picture in the number of fatalities over the 13 year period 1996/97 to
2008/09p, with a peak in 2007/08 (136), although fatalities fall dramatically in the
following year (28). From 2001/02 to 2008/09p, non-fatal accidents gradually
decrease from 19,504 to 14,257 by 2008/09p.
These findings indicate the success of efforts by HSE and industry to reduce electricity
related accidents.
HSE sectors (Field operations directorate, FOD):
From 1996/97 to 2008/09p, the Construction HSE sector reports the greatest number
of fatal accidents (427), followed by the Agriculture and Wood HSE sector (205). The
Construction HSE sector also reports the highest number of major injuries (12,448),
viii
and the Engineering and Utilities HSE sector reports the greatest total number of non-
fatal accidents (57,653).
Industry (SIC industry code):
From 1996/97 to 2008/09p, installation and fitting of electrical wiring reports 52
fatalities (and reports the greatest number of non-fatal accidents). The highest number
of fatalities is reported by the industry related to the construction of buildings and civil
engineering works (142).
Types of accident (Accident kind):
For the 13 year time period 1996/97 to 2008/09p, contact with electricity (or electrical
discharge) reports 168 fatalities, with the highest number of fatalities due to high falls
(233) and being struck by objects (174). The highest number of non-fatal injuries is
due to handling/sprains (51,456).
From 2001/02 to 2008/09p, contact with electricity (or electrical discharge) reports 88
fatalities, with high falls (125) being involved in the largest number of fatalities. Non-
fatal injuries are most commonly related to machinery, being hit by objects and trips
and slips (all above 10,000 accidents each).
Job role (Occupation):
From 1996/97 to 2001/02, electric fitters (including electricians) report the highest
number of fatalities (38) and highest number of non-fatal accidents (14,938).
Electrical engineers also report a high number of non-fatal injuries (8,074).
From 2002/03 to 2008/09p, electric fitters (including electricians) report the highest
number of fatalities (44) and non-fatal injuries (10,933).
Analysis shows that fatalities in electric fitters (including electricians) across the 13
year period 1996/97 to 2008/09p are predominantly related to contact with
electricity/electrical discharge (31) or high falls (20). Non-fatal injuries in this
population are often handling and sprains (7,454) and trips (5,908).
These results suggest a need to target electric fitters (including electricians), focusing
on best practice when working in direct contact with electricity, working at height, and
handling loads.
Activity occurring at the time of accident (Work process):
From 1996/97 to 2000/01, the highest number of fatalities involves general
maintenance activities (49) compared to less involvement from electrical activities
(13). The non-fatal injury trends show a similar pattern.
ix

From 2001/02 to 2008/09p, the involvement of electrical activities in fatalities is more
significant (56) although still less than manufacturing production (79) and machine
maintenance (74) activities. The non-fatal injury trends are similar.
Main object/movement involved in accidents (Agent):
From 1996/97 to 2000/01, unintentional contact with overhead lines (20) and direct
contact with electricity/electrical discharge (19) report some of the highest fatality
numbers, as do falls off moveable ladders (21). Electrical objects/movements do not
significantly feature in non-fatal injuries.
From 2001/02 to 2008/09p, the highest number of fatalities involves fork lift trucks
(33) and moveable ladders (28) rather than objects such as overhead power lines (20)
and other electricity cables (20). For non-fatal injuries, other electricity cables do play
a role (5,936), but it is less significant than other materials and machinery (11,519).
These results potentially indicate further consideration should be given to
interventions that do not merely focus on contact with electricity, but also working at
height (ladder use), and working around fork lift trucks and machinery.
Age:
From 1996/97 to 2008/09p, fatalities are highest for the 40 to 44 age group and 50 to
59 age group (above 137 fatalities in each age category). For non-fatal injuries,
accidents increase from 16 years of age (7,443) to a peak by the 35 to 39 age group
(22,930), decreasing thereafter. Major injuries remain relatively consistent (over
4,000) for the 20 to 24 age category through to the 55 to 59 age category.
It should be noted that this does not necessarily indicate that certain age groups are
more vulnerable to accident (since figures presented are frequencies rather than
calculated rates).
Employment status:
From 1996/97 to 2008/09p, three quarters of all fatalities have been reported for
‘employees’ (924), with fatalities in the ‘self-employed’ (250) constituting around
21% of all fatalities. Nearly all reported non-fatal injuries have been reported for
‘employees’ (180,899) compared to the ‘self-employed’ (4,195).
It should be noted that this does not necessarily indicate that certain types of
employment are more vulnerable to accident (since figures presented are frequencies
rather than calculated rates and the ‘self-employed non-fatal figures could also be
affected by under-reporting).
x
Monthly pattern:
From 1996/97 to 2008/09p, accumulatively the highest number of fatalities have been
reported for August (130), with significant numbers for January, and June through to
November. Significant numbers of non-fatal injuries (around 16,000 in each month)
have been reported for January, June, July and September through to November.
December reports the lowest number of non-fatal accidents (11,419).
These findings may provide some indication regarding the best time to launch media
campaigns or timely reminders throughout the year in order to reduce accident levels
further.
Types of injury:
From 1996/97 to 2008/09p, contact with electrical sources report the fourth highest
fatality numbers (145). Strains (53,554) and fractures (37,169) contribute more to
non-fatal injuries than injuries caused by electricity (4,183).
Region:
From 1996/97 to 2008/09p, the highest fatality numbers are reported for the ‘East and
South East’ (243) and the ‘Midlands’ (222). The non-fatal injury profile is similar.
At the local authority level from 1996/97 to 2008/09p, Manchester has the highest
fatality numbers (21) followed by Sandwell (16) and Birmingham (16). Birmingham
also reports the highest number of non-fatal injury (3,736) followed by Leeds (3,005),
with Manchester recording the fourth highest number of non-fatal injury (2,275).
With HSE insight into the resources available in different regions and cities, it may be
useful to compare any areas that report high accident levels with comparable regions
and cities that report lower levels. This exercise could yield further information into
best practice in certain areas that could be applied to other areas, particularly those
with high accident levels.
RECOMMENDATIONS
Some high level recommendations have been suggested based on the results of this research,
which include: considering existing knowledge and guidance around the identified risk areas;
HSE policy development work should be primarily based upon the ‘direct contact’ and
‘electrical related’ data sets; further analysis of notifier comments/investigation reports to gain
more understanding behind the key statistics reported; and further work undertaken to
understand areas of best practice that could be distilled from those regions of the country where
injury levels remain lower.
xi

xii
1. INTRODUCTION
1.1 INTRODUCTION
This report has been prepared by GL Noble Denton for the Health and Safety Executive (HSE)
as research contract OH1986, and describes a study on ‘Identifying the incidence of electricity-
related accidents in Great Britain – An update (1996/97 to 2008/09p)’.
1.2 CONTEXT OF THE STUDY
With the introduction of the ‘Revitalising Health and Safety’ (RHS) strategy statement in June
2000 by the Government and the then Health and Safety Commission (HSC), efforts have been
made by the HSE to work with industry to reduce the number of fatalities and major accidents,
cases of ill-health and the number of working days lost through work related injury and ill-
health. Percentage reduction targets have been set with the aim to achieve these targets by
2009/10.
The HSE has Electrical Specialist Groups working to investigate electrical related accidents
where the outcome has been serious (i.e. fatal or major injury), and to devise interventions to
protect those working with electricity. The Reporting of Injuries, Diseases and Dangerous
Occurrences Regulations 1995 (RIDDOR) is one key source of information they use to inform
their decision-making and intervention development. However, the categorisation of RIDDOR
reportable injuries is such that if an electrician fell from a ladder, the accident may well be coded as
a ‘fall’ even if it was contact with electricity that caused the fall. Therefore, to gain better insight
into all those accidents involving working with or around electricity it is necessary to analyse a
larger data set beyond those accidents that have been directly attributed to electricity. This provides
a broad data set that includes those workers that have suffered handling/sprain injuries, trips or falls
whilst undertaking electricity-related work as well as those injured through contact with electricity.
As a result, best use can be made of HSE resources in targeting groups of workers involved in
activities such as cabling, where HSE’s falls from height, slips and trips, and musculoskeletal
disorder priority programmes may want to get their messages over to the same group.
Since these considerations were the basis of a 2003 study commissioned by the HSE and
undertaken by BOMEL Limited (now incorporated into and known as GL Noble Denton), there
is a need to update the data range to cover years up to and including 2008/09p, and to draw
appropriate conclusions. This report supersedes the original 2003 report1, and has been written
as a standalone document, and is intended to be referred to without the need to access the
original report.
1.3 OBJECTIVES AND SCOPE OF WORK
The full electricity-related accident data has been incorporated into the Electricity RIDDOR
Report Tool, which has been used for the analyses presented in this report.
The overall objectives of this study are to:
1. Develop an electricity-related accident data set from ‘supply to switch’ to provide a
baseline for measuring improvements across a range of industry sectors.
1
2. Analyse the electricity-related accident data to gain an insight into what type of
accidents occur, who was involved in them and what they were doing at the time.
3. Produce a report that contains analyses of the electricity-related accident data; identify
the key issues; and identify key priority areas for intervention.
1.4 SCOPE OF THIS REPORT
The study is presented in the report as follows:
Chapter 2 provides brief summary details about how the electricity data set was
created and divided into three component data sets.
Chapter 3 presents the analyses of the ‘direct contact’ with electricity (or electrical
discharge) data set.
Chapter 4 presents the analyses of the ‘electrical based’ data set.
Chapter 5 presents the analyses of the entire data set (termed the ‘all related’ data set).
Chapter 6 highlights the main conclusions.
Chapter 7 provides overall study recommendations.
Chapter 8 contains the references used in the main body of this report.
Appendix 1 provides a more in-depth description of how the electrical data set was
created from the RIDDOR database.
1.5 HOW TO USE THIS REPORT
1.5.1 The data sets used
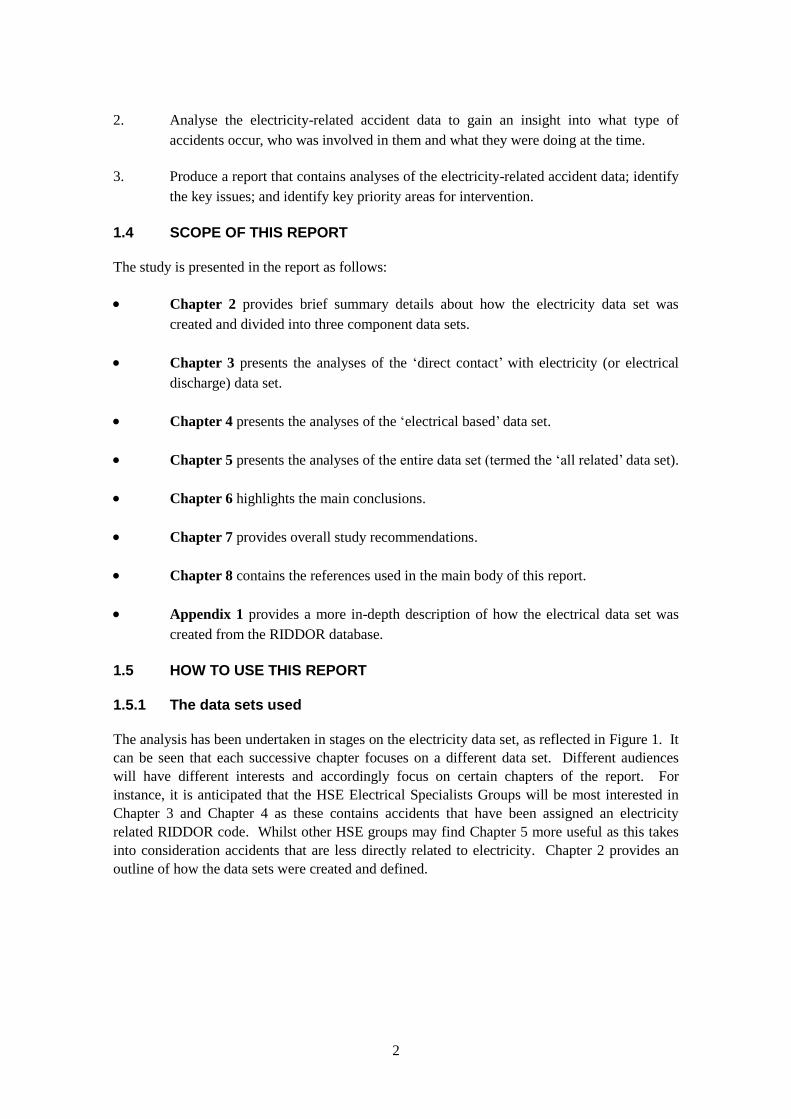
The analysis has been undertaken in stages on the electricity data set, as reflected in Figure 1. It
can be seen that each successive chapter focuses on a different data set. Different audiences
will have different interests and accordingly focus on certain chapters of the report. For
instance, it is anticipated that the HSE Electrical Specialists Groups will be most interested in
Chapter 3 and Chapter 4 as these contains accidents that have been assigned an electricity
related RIDDOR code. Whilst other HSE groups may find Chapter 5 more useful as this takes
into consideration accidents that are less directly related to electricity. Chapter 2 provides an
outline of how the data sets were created and defined.
2
Chapter 4
‘Electrical based’
including ‘direct
contact’
Chapter 5
‘All related’ accidents
including ‘electrical
based’
Chapter 3
‘Direct contact’
with electricity
1
3
2
4
Signpost table
Key message
Main graph
Table of accident
numbers
5 Detailed result
text
Figure 1 Breakdown of the overall electricity data set and associated chapters
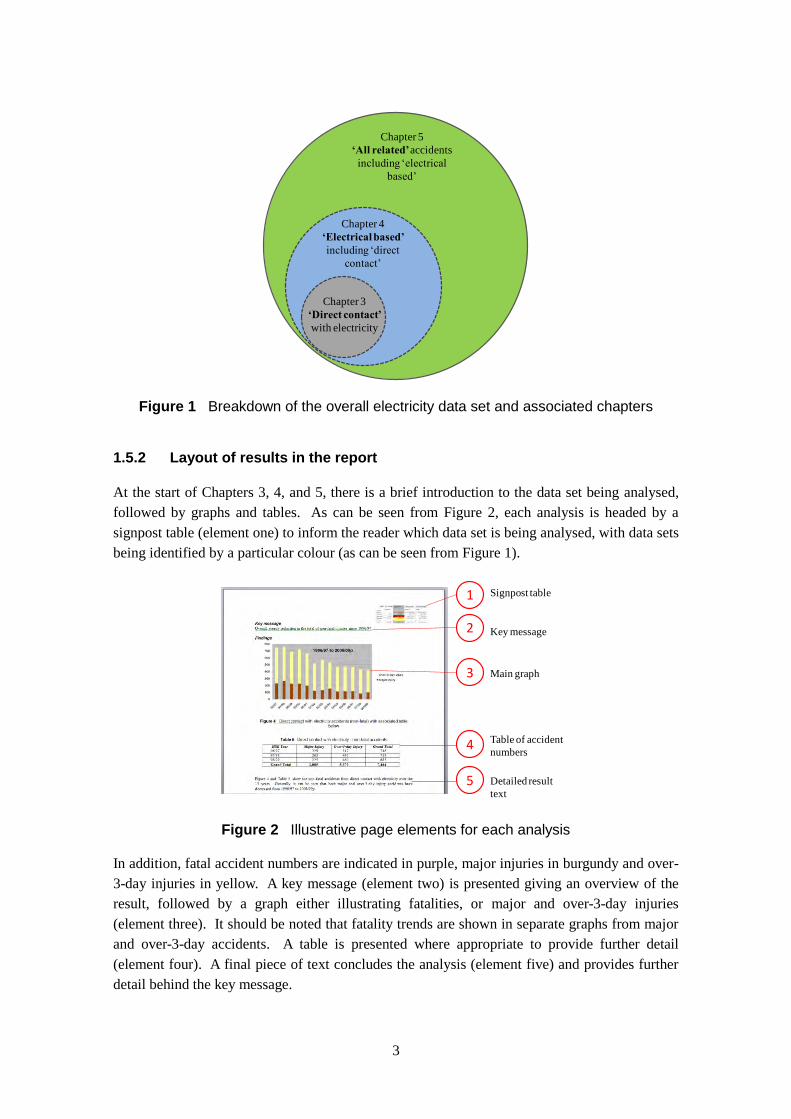
1.5.2 Layout of results in the report
At the start of Chapters 3, 4, and 5, there is a brief introduction to the data set being analysed,
followed by graphs and tables. As can be seen from Figure 2, each analysis is headed by a
signpost table (element one) to inform the reader which data set is being analysed, with data sets
being identified by a particular colour (as can be seen from Figure 1).
Figure 2 Illustrative page elements for each analysis
In addition, fatal accident numbers are indicated in purple, major injuries in burgundy and over-
3-day injuries in yellow. A key message (element two) is presented giving an overview of the
result, followed by a graph either illustrating fatalities, or major and over-3-day injuries
(element three). It should be noted that fatality trends are shown in separate graphs from major
and over-3-day accidents. A table is presented where appropriate to provide further detail
(element four). A final piece of text concludes the analysis (element five) and provides further
detail behind the key message.
3
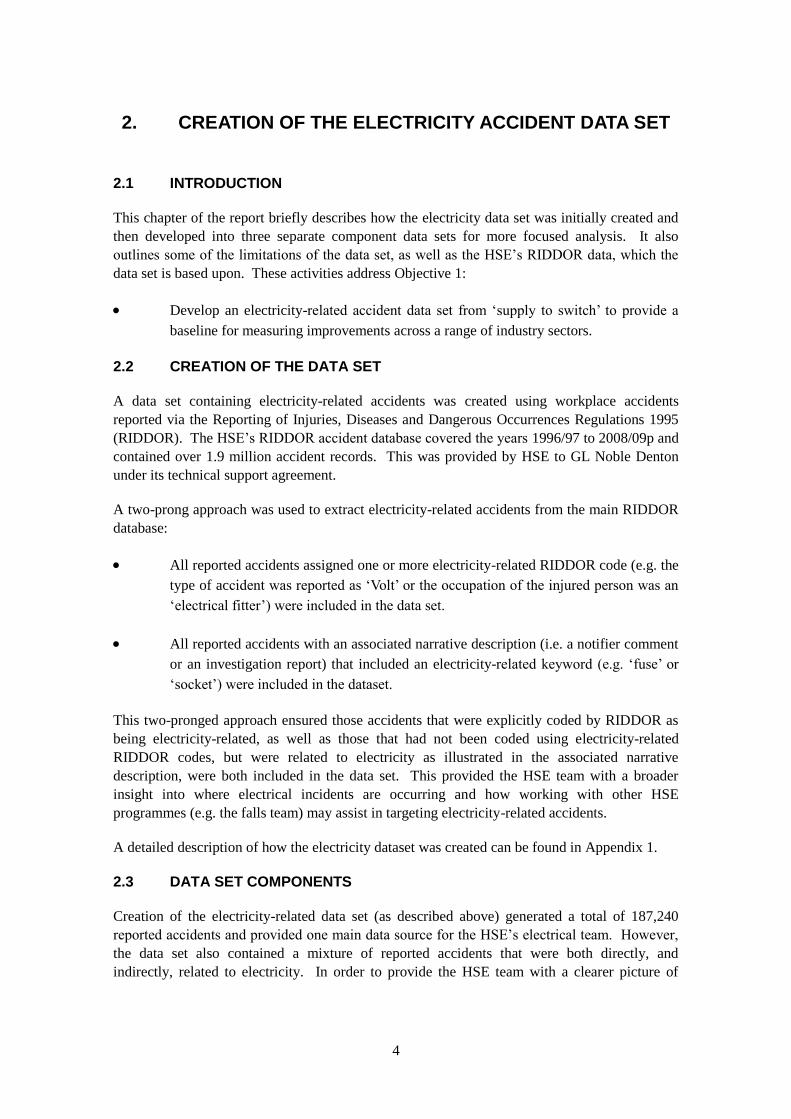
2. CREATION OF THE ELECTRICITY ACCIDENT DATA SET
2.1 INTRODUCTION
This chapter of the report briefly describes how the electricity data set was initially created and
then developed into three separate component data sets for more focused analysis. It also
outlines some of the limitations of the data set, as well as the HSE’s RIDDOR data, which the
data set is based upon. These activities address Objective 1:
Develop an electricity-related accident data set from ‘supply to switch’ to provide a
baseline for measuring improvements across a range of industry sectors.
2.2 CREATION OF THE DATA SET
A data set containing electricity-related accidents was created using workplace accidents
reported via the Reporting of Injuries, Diseases and Dangerous Occurrences Regulations 1995
(RIDDOR). The HSE’s RIDDOR accident database covered the years 1996/97 to 2008/09p and
contained over 1.9 million accident records. This was provided by HSE to GL Noble Denton
under its technical support agreement.
A two-prong approach was used to extract electricity-related accidents from the main RIDDOR
database:
All reported accidents assigned one or more electricity-related RIDDOR code (e.g. the
type of accident was reported as ‘Volt’ or the occupation of the injured person was an
‘electrical fitter’) were included in the data set.
All reported accidents with an associated narrative description (i.e. a notifier comment
or an investigation report) that included an electricity-related keyword (e.g. ‘fuse’ or
‘socket’) were included in the dataset.
This two-pronged approach ensured those accidents that were explicitly coded by RIDDOR as
being electricity-related, as well as those that had not been coded using electricity-related
RIDDOR codes, but were related to electricity as illustrated in the associated narrative
description, were both included in the data set. This provided the HSE team with a broader
insight into where electrical incidents are occurring and how working with other HSE
programmes (e.g. the falls team) may assist in targeting electricity-related accidents.
A detailed description of how the electricity dataset was created can be found in Appendix 1.
2.3 DATA SET COMPONENTS
Creation of the electricity-related data set (as described above) generated a total of 187,240
reported accidents and provided one main data source for the HSE’s electrical team. However,
the data set also contained a mixture of reported accidents that were both directly, and
indirectly, related to electricity. In order to provide the HSE team with a clearer picture of
4
electricity related accidents, the main dataset was developed into two further subsidiary data
sets. In total, this equated to three separate data sets, defined as follows:
Data set 1: ‘Direct contact’ with electricity – this data set is defined purely by the
RIDDOR accident kind categories ‘Electricity’ and ‘Volt’ (i.e. it only includes
accidents reported as being either an ‘Electricity’ or ‘Volt’ accident type).
Data set 2: ‘Electrical based’ (including ‘direct contact’) – this larger data set
contains the ‘direct contact’ accidents described above, as well as accidents reported
under other electricity-related RIDDOR categories (e.g. industries such as electricity
production, installation of wiring/fitting, manufacturing of electrical appliances;
occupations such as electrical engineers, electroplaters, etc.). For a full list of the
RIDDOR categories under this definition, please refer to Table 62 to Table 66 in
Appendix 1.
Data set 3: ‘All related’ accidents (including ‘electrical based’) – this is the full
data set (as described in Chapter 5), containing the ‘electrical based’ accidents
described above (i.e. all accidents assigned an electricity-related RIDDOR code) and
accidents brought in because their associated accident narrative (i.e. the notifier
comment or investigation report) contains an electricity related keyword (e.g. ‘spark’,
‘plug’, ‘socket’, etc.). For a full list of the keywords used under this definition, please
refer to Table 67 in Appendix 1.
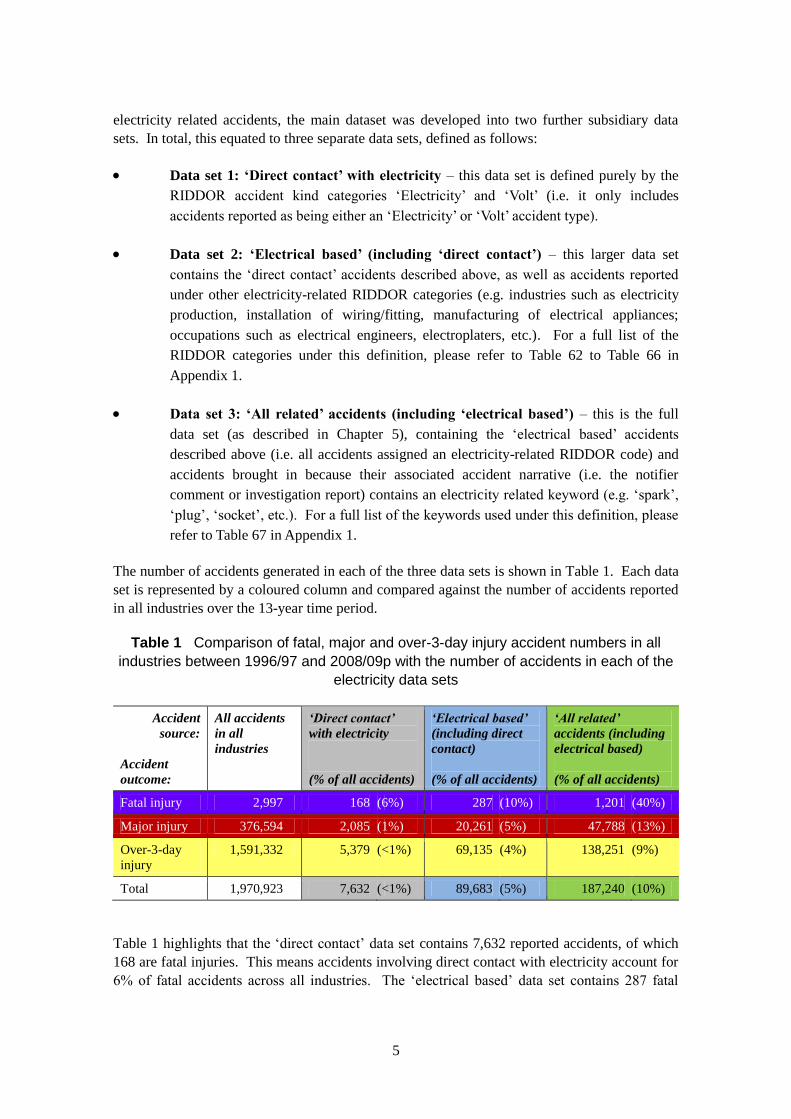
The number of accidents generated in each of the three data sets is shown in Table 1. Each data
set is represented by a coloured column and compared against the number of accidents reported
in all industries over the 13-year time period.
Table 1 Comparison of fatal, major and over-3-day injury accident numbers in all
industries between 1996/97 and 2008/09p with the number of accidents in each of the
electricity data sets
Accident
source:
Accident
outcome:
All accidents
in all
industries
‘Direct contact’
with electricity
(% of all accidents)
‘Electrical based’
(including direct
contact)
(% of all accidents)
‘All related’
accidents (including
electrical based)
(% of all accidents)
Fatal injury 2,997 168 (6%) 287 (10%) 1,201 (40%)
Major injury 376,594 2,085 (1%) 20,261 (5%) 47,788 (13%)
Over-3-day
injury
1,591,332 5,379 (<1%) 69,135 (4%) 138,251 (9%)
Total 1,970,923 7,632 (<1%) 89,683 (5%) 187,240 (10%)
Table 1 highlights that the ‘direct contact’ data set contains 7,632 reported accidents, of which
168 are fatal injuries. This means accidents involving direct contact with electricity account for
6% of fatal accidents across all industries. The ‘electrical based’ data set contains 287 fatal
5
injuries, accounting for 10% of fatal accidents across all industries and the ‘all related’ data set
contains 1,201 fatal injuries, accounting for 40% of fatal accidents across all industries.
However, some caution should be exercised when interpreting the figures for the ‘all related’
data set, as this data set does contain a number of accidents that are only indirectly related to
electricity. It is therefore recommended that any HSE policy development work is primarily
based upon the ‘direct contact’ and ‘electrical related’ data sets, as these contain accidents
assigned electricity-related RIDDOR codes only.
2.4 DATA SET LIMITATIONS
There are some potential limitations to the electricity data sets that should be highlighted, as
follows:
The keyword search approach is not a perfect science, but it is a means to efficiently
build a data set, considering the full RIDDOR database consists of over 1.9 million
accident records for the period 1996/97 to 2008/09p.
The ‘all related’ data set is highly dependent on the contents of notifier comments and
investigation reports, as well as the keyword search terms (see Table 67). Any
accident not assigned an electricity-related RIDDOR code will not be included in the
‘all related’ data set unless it has an electricity-related keyword present in the accident
narrative. Equally, there may be a number of accidents included in the data set
because their notifier comment or investigation report contains a keyword, even
though the accident may not have any real association with electricity.
There may be under-reporting of less severe incidents (which can potentially exist in
all industries). Consequently, the RIDDOR data/figures on minor accidents (over-3-
day and some major accidents) presented may be lower than is the real case.
2.5 RIDDOR DATA LIMITATIONS
To remain current and reflect changes to HSE internal operations and external industry
developments, the HSE has periodically needed to amend the codes used in RIDDOR fields,
more specifically:
Work process, Agent, and Accident Kind fields – coding changed in 2001/02 due to
the implementation of the Incident Contact Centre (ICC)
Occupation field – coding changed in 2002/03 due to change in the Standard
Occupational Classification (SOC)
All remaining RIDDOR fields – stayed the same throughout the 13 years from
1996/97 to 2008/09p.
6

For the affected fields the graphs have been split into two (this is clearly stated in the report).
For example, graphs will represent the ‘pre-ICC’ and ‘post-ICC’ timeframe because there is no
mapping between the pre-ICC and ICC system.
Finally, it should be noted that the data reported for each year is final data (i.e. it has undergone
a process of verification by HSE). The only exception is for the year 2008/09p, which is
differentiated on the graphs with a ‘p’ for ‘provisional’. This data was provisional at the time of
writing this report and therefore may be subject to minor future amendments following HSE
verification.
7
3. MAIN ANALYSIS OF ACCIDENTS INVOLVING ‘DIRECT
CONTACT’ WITH ELECTRICITY
3.1 INTRODUCTION
This chapter helps to address Objective 2, which is to:
Analyse the electricity-related accident data to gain an insight into what type of
accidents occur, who was involved in them and what they were doing at the time.
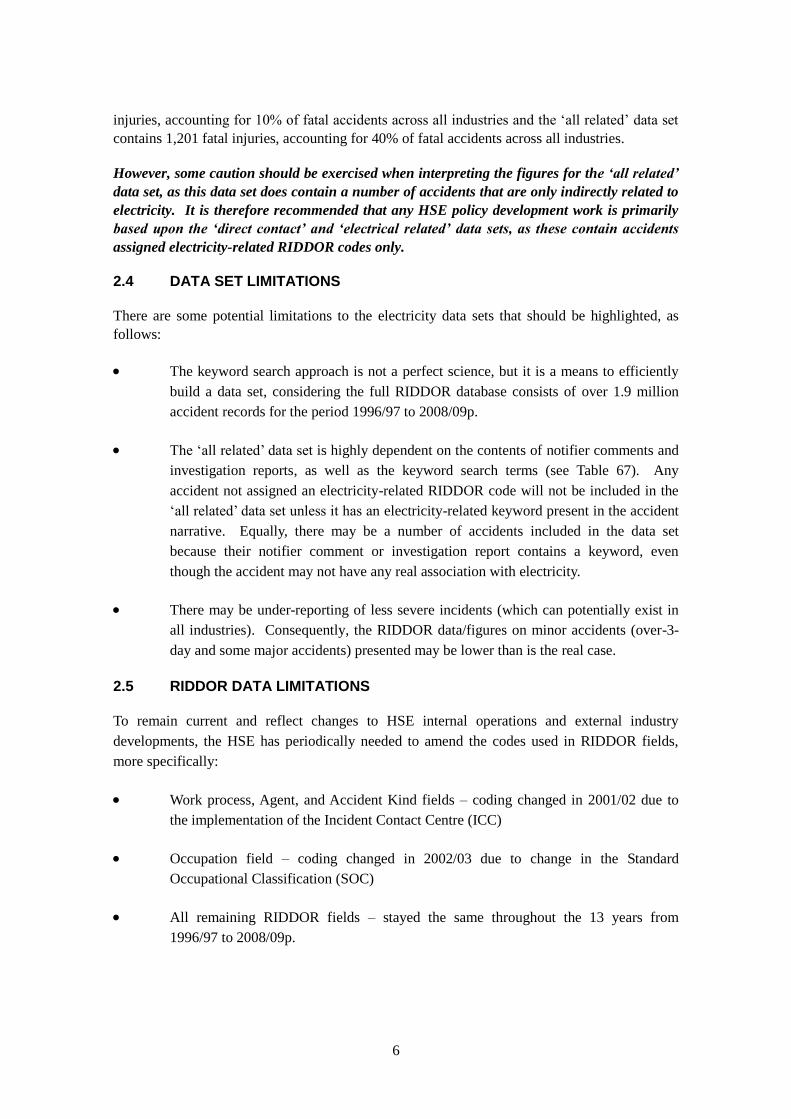
The analyses presented in this chapter relates to the ‘direct contact’ with electricity data set,
which are accidents that have been categorised as either ‘volt’ or ‘electricity’ under the
RIDDOR accident kind code. More specifically, Table 2 highlights the column of data that is
being presented in this chapter. It suggests that around 6% of all fatal accidents (across all
industries) have been caused by direct contact with electricity, amounting to 168 fatalities over
the 13 year period.
Table 2 Comparison of fatal, major and over-3-day injury accident numbers in all industries between 1996/97 and 2008/09p with the number of accidents in each of the
electricity data sets
Accident
source:
Accident
outcome:
All accidents
in all
industries
‘Direct contact’ ‘Electrical based’
(including direct
contact)
(% of all accidents)
‘All related’
accidents (including
electrical based)
(% of all accidents)
with electricity
(% of all accidents)
Fatal injury 2,997 168 (6%) 287 (10%) 1,201 (40%)
Major injury 376,594 2,085 (1%) 20,261 (5%) 47,788 (13%)
Over-3-day
injury
1,591,332 5,379 (<1%) 69,135 (4%) 138,251 (9%)
Total 1,970,923 7,632 (<1%) 89,683 (5%) 187,240 (10%)
NB: data highlighted in colour has been presented in this chapter
8
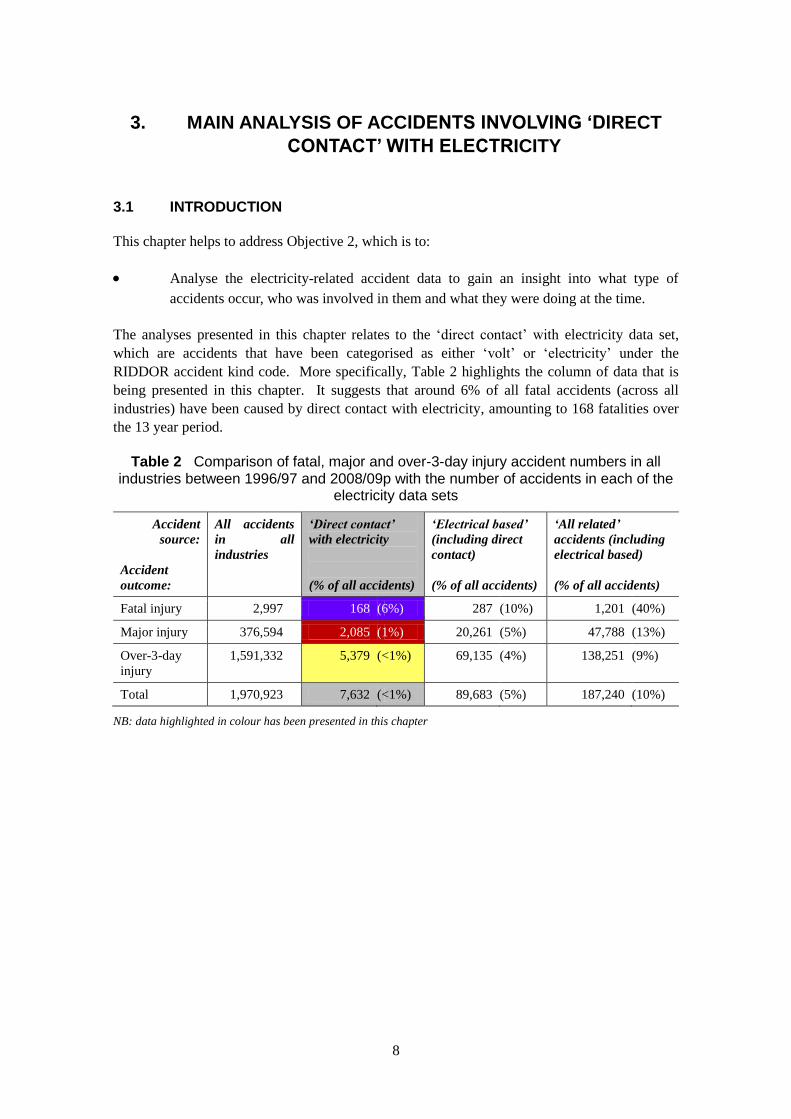
Yearly trends in ‘direct contact’ accidents (HSE year)
Key message
mixed picture regarding the number of fatal accidents over the years, although some
indication that fatality levels have improved over the most recent years with the exception of
2006/07.
Findings
0
2
4
6
8
10
12
14
16
18
20
96/97 97/98 98/99 99/00 00/01 01/02 02/03 03/04 04/05 05/06 06/07 07/08 08/09P
Fatality
1996/97 to 2008/09p
3.1.1
A
Figure 3 All fatal accidents from „direct contact‟ with electricity
Figure 3 shows the number of fatal accidents caused by direct contact with electricity over the
13 years. It can be seen that a peak in the number of accidents was reported in 1999/2000 with
18 fatalities, with a fluctuating improvement in subsequent years, except for 2006/07 where
fatalities climbed back up to 17.
9
0
100
200
300
400
500
600
700
800
96/97 97/98 98/99 99/00 00/01 01/02 02/03 03/04 04/05 05/06 06/07 07/08 08/09P
Over-3-day Injury
Major Injury
1996/97 to 2008/09p
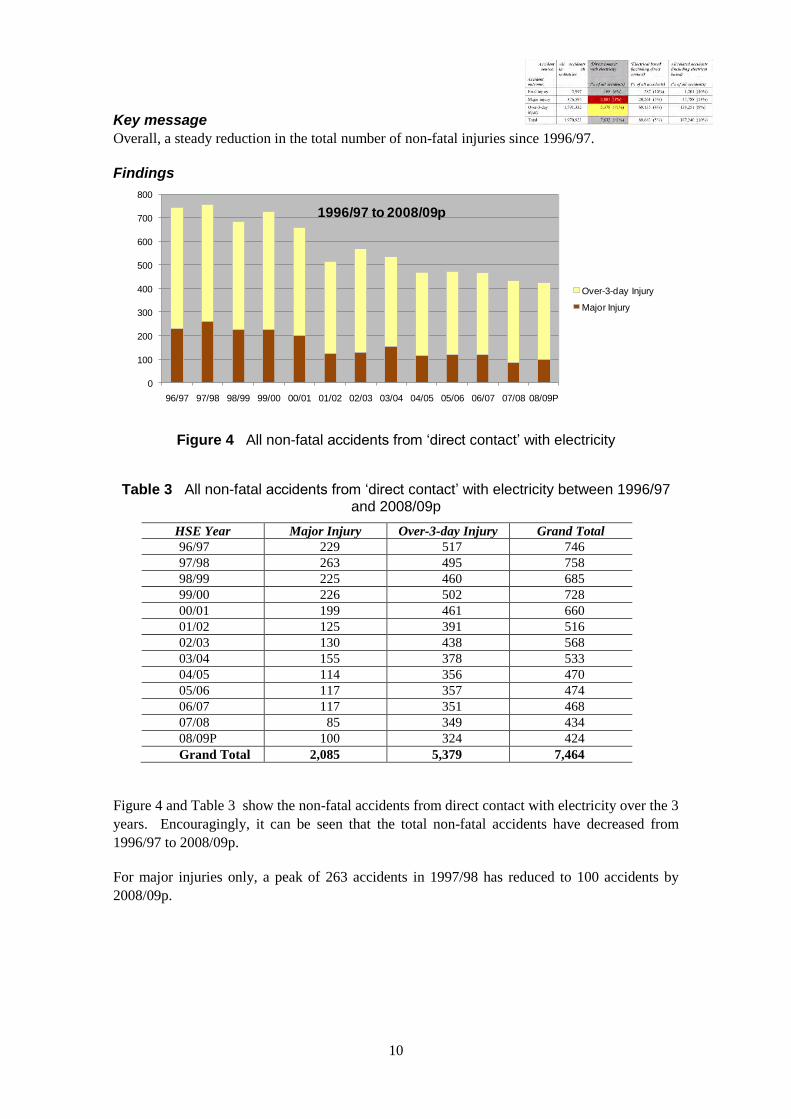
Key message
Overall, a steady reduction in the total number of non-fatal injuries since 1996/97.
Findings
Figure 4 All non-fatal accidents from „direct contact‟ with electricity
Table 3 All non-fatal accidents from „direct contact‟ with electricity between 1996/97 and 2008/09p
HSE Year Major Injury Over-3-day Injury Grand Total
96/97 229 517 746
97/98 263 495 758
98/99 225 460 685
99/00 226 502 728
00/01 199 461 660
01/02 125 391 516
02/03 130 438 568
03/04 155 378 533
04/05 114 356 470
05/06 117 357 474
06/07 117 351 468
07/08 85 349 434
08/09P 100 324 424
Grand Total 2,085 5,379 7,464
Figure 4 and Table 3 show the non-fatal accidents from direct contact with electricity over the 3
years. Encouragingly, it can be seen that the total non-fatal accidents have decreased from
1996/97 to 2008/09p.
For major injuries only, a peak of 263 accidents in 1997/98 has reduced to 100 accidents by
2008/09p.
10
4. MAIN ANALYSIS OF ‘ELECTRICAL BASED’ ACCIDENTS
4.1 INTRODUCTION
This chapter also helps to address Objective 2, which is to:
Analyse the electricity-related accident data to gain an insight into what type of
accidents occur, who was involved in them and what they were doing at the time.
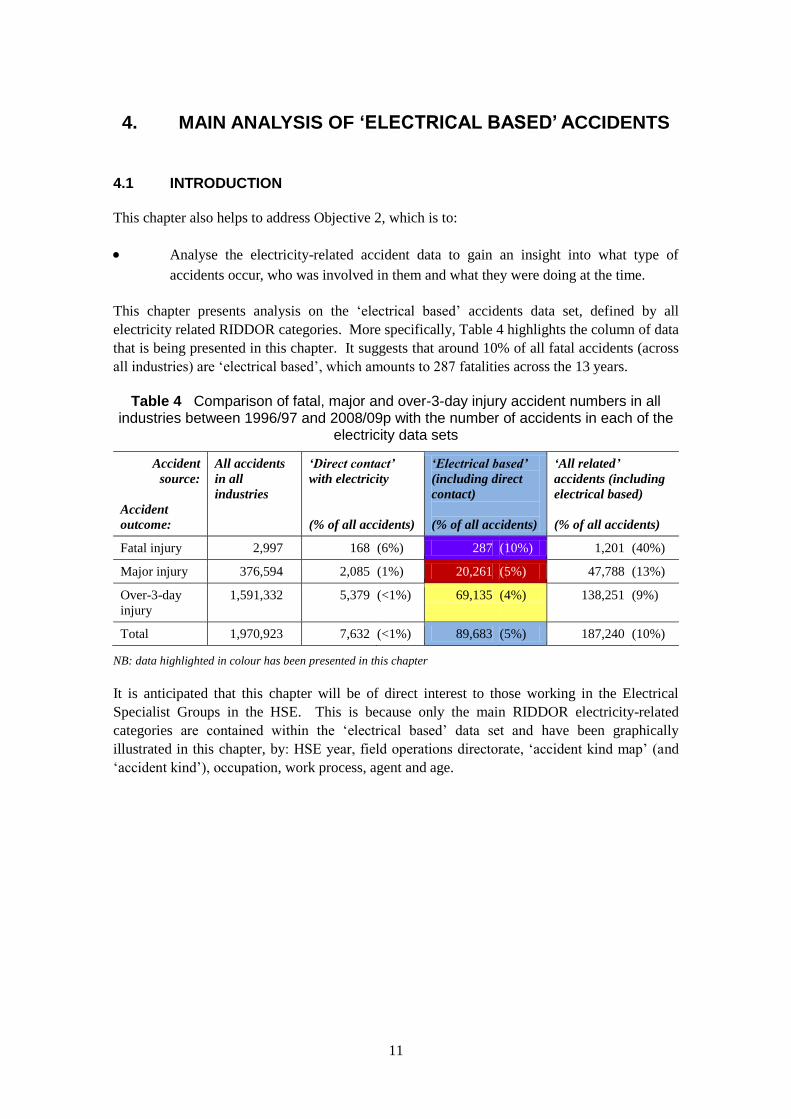
This chapter presents analysis on the ‘electrical based’ accidents data set, defined by all
electricity related RIDDOR categories. More specifically, Table 4 highlights the column of data
that is being presented in this chapter. It suggests that around 10% of all fatal accidents (across
all industries) are ‘electrical based’, which amounts to 287 fatalities across the 13 years.
Table 4 Comparison of fatal, major and over-3-day injury accident numbers in all industries between 1996/97 and 2008/09p with the number of accidents in each of the
electricity data sets
Accident
source:
Accident
outcome:
All accidents
in all
industries
‘Direct contact’
with electricity
(% of all accidents)
‘Electrical based’ ‘All related’
accidents (including
electrical based)
(% of all accidents)
(including direct
contact)
(% of all accidents)
Fatal injury 2,997 168 (6%) 287 10%) ( 1,201 (40%)
Major injury 376,594 2,085 (1%) 20,261 (5%) 47,788 (13%)
Over-3-day
injury
1,591,332 5,379 (<1%) 69,135 (4%) 138,251 (9%)
Total 1,970,923 7,632 (<1%) 89,683 (5%) 187,240 (10%)
NB: data highlighted in colour has been presented in this chapter
It is anticipated that this chapter will be of direct interest to those working in the Electrical
Specialist Groups in the HSE. This is because only the main RIDDOR electricity-related
categories are contained within the ‘electrical based’ data set and have been graphically
illustrated in this chapter, by: HSE year, field operations directorate, ‘accident kind map’ (and
‘accident kind’), occupation, work process, agent and age.
11
4.1.1 Yearly trends in ‘electrical based’ accidents (HSE year)
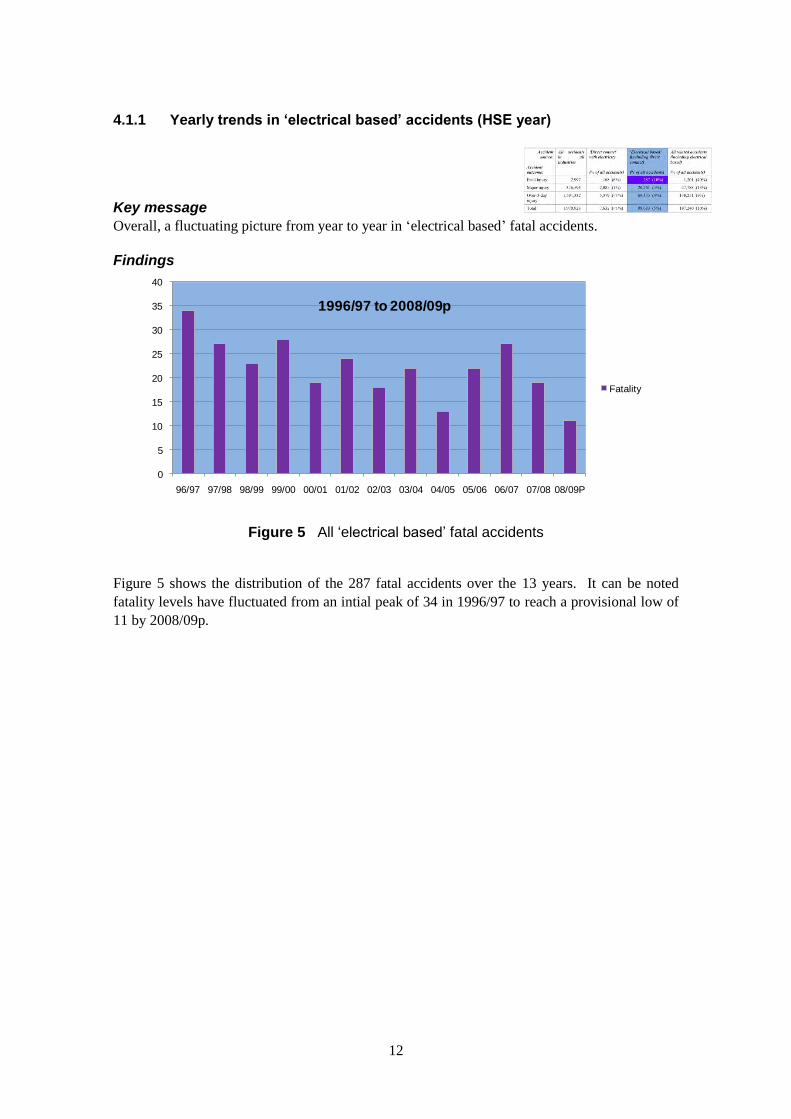
Key message
Overall, a fluctuating picture from year to year in electrical based fatal accidents.
Findings
0
5
10
15
20
25
30
35
40
96/97 97/98 98/99 99/00 00/01 01/02 02/03 03/04 04/05 05/06 06/07 07/08 08/09P
Fatality
1996/97 to 2008/09p
‘ ’
Figure 5 All „electrical based‟ fatal accidents
Figure 5 shows the distribution of the 287 fatal accidents over the 13 years. It can be noted
fatality levels have fluctuated from an intial peak of 34 in 1996/97 to reach a provisional low of
11 by 2008/09p.
12
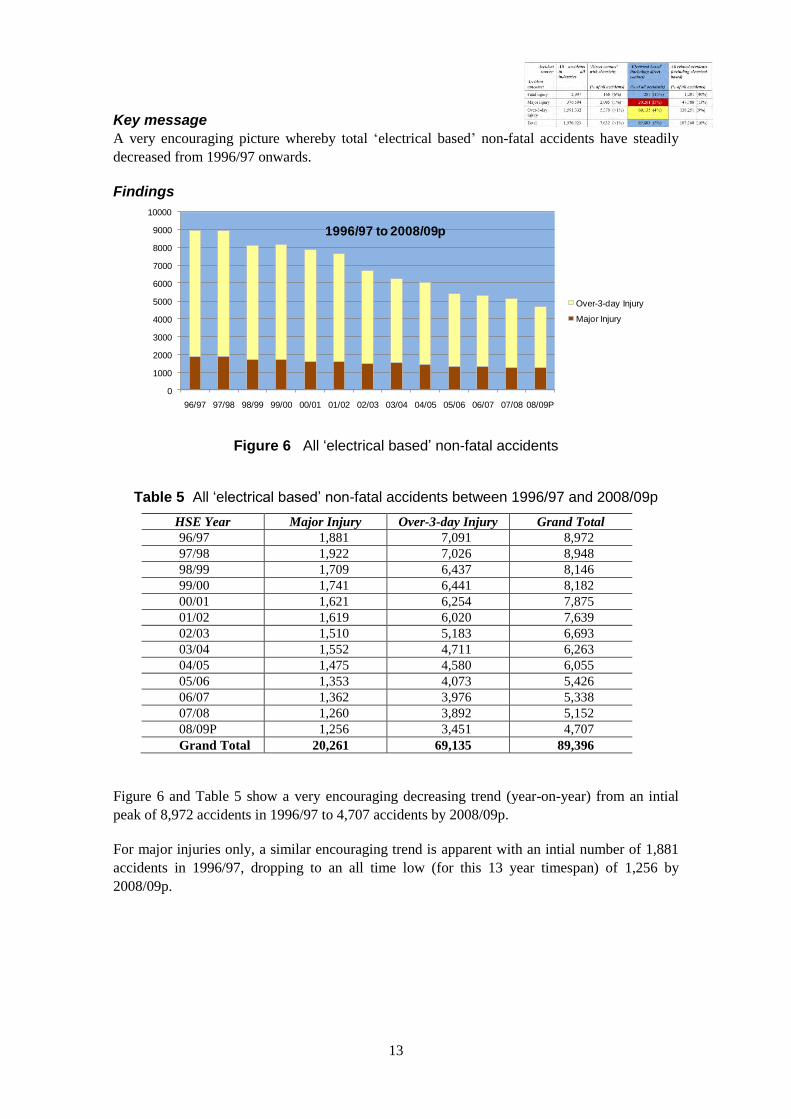
Key message
A very encouraging picture whereby total electrical based non-fatal accidents have steadily
decreased from 1996/97 onwards.
Findings
0
1000
2000
3000
4000
5000
6000
7000
8000
9000
10000
96/97 97/98 98/99 99/00 00/01 01/02 02/03 03/04 04/05 05/06 06/07 07/08 08/09P
Over-3-day Injury
Major Injury
1996/97 to 2008/09p
‘ ’
Figure 6 All „electrical based‟ non-fatal accidents
Table 5 All „electrical based‟ non-fatal accidents between 1996/97 and 2008/09p
HSE Year Major Injury Over-3-day Injury Grand Total
96/97 1,881 7,091 8,972
97/98 1,922 7,026 8,948
98/99 1,709 6,437 8,146
99/00 1,741 6,441 8,182
00/01 1,621 6,254 7,875
01/02 1,619 6,020 7,639
02/03 1,510 5,183 6,693
03/04 1,552 4,711 6,263
04/05 1,475 4,580 6,055
05/06 1,353 4,073 5,426
06/07 1,362 3,976 5,338
07/08 1,260 3,892 5,152
08/09P 1,256 3,451 4,707
Grand Total 20,261 69,135 89,396
Figure 6 and Table 5 show a very encouraging decreasing trend (year-on-year) from an intial
peak of 8,972 accidents in 1996/97 to 4,707 accidents by 2008/09p.
For major injuries only, a similar encouraging trend is apparent with an intial number of 1,881
accidents in 1996/97, dropping to an all time low (for this 13 year timespan) of 1,256 by
2008/09p.
13
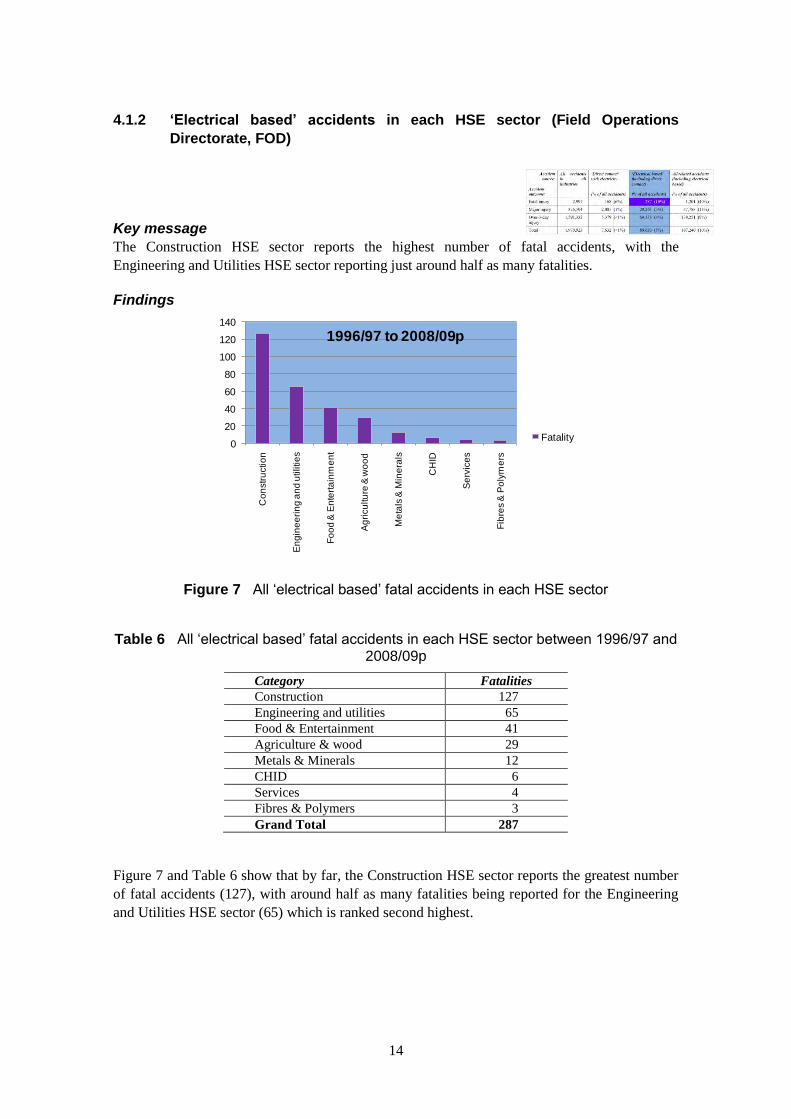
‘Electrical based’ accidents in each HSE sector (Field Operations
Directorate, FOD)
Construction HSE sector reports the highest number of fatal accidents, with the
Engineering and Utilities HSE sector reporting just around half as many fatalities.
0
20
40
60
80
100
120
140
Co
nstr
uctio
n
En
gin
ee
rin
g a
nd
utilitie
s
Fo
od
& E
nte
rta
inm
en
t
Ag
ricu
ltu
re &
wo
od
Me
tals
& M
ine
rals
CH
ID
Se
rvic
es
Fib
res &
Po
lym
ers
Fatality
1996/97 to 2008/09p
4.1.2
Key message
The
Findings
Figure 7 All „electrical based‟ fatal accidents in each HSE sector
Table 6 All „electrical based‟ fatal accidents in each HSE sector between 1996/97 and 2008/09p
Category Fatalities
Construction 127
Engineering and utilities 65
Food & Entertainment 41
Agriculture & wood 29
Metals & Minerals 12
CHID 6
Services 4
Fibres & Polymers 3
Grand Total 287
Figure 7 and Table 6 show that by far, the Construction HSE sector reports the greatest number
of fatal accidents (127), with around half as many fatalities being reported for the Engineering
and Utilities HSE sector (65) which is ranked second highest.
14
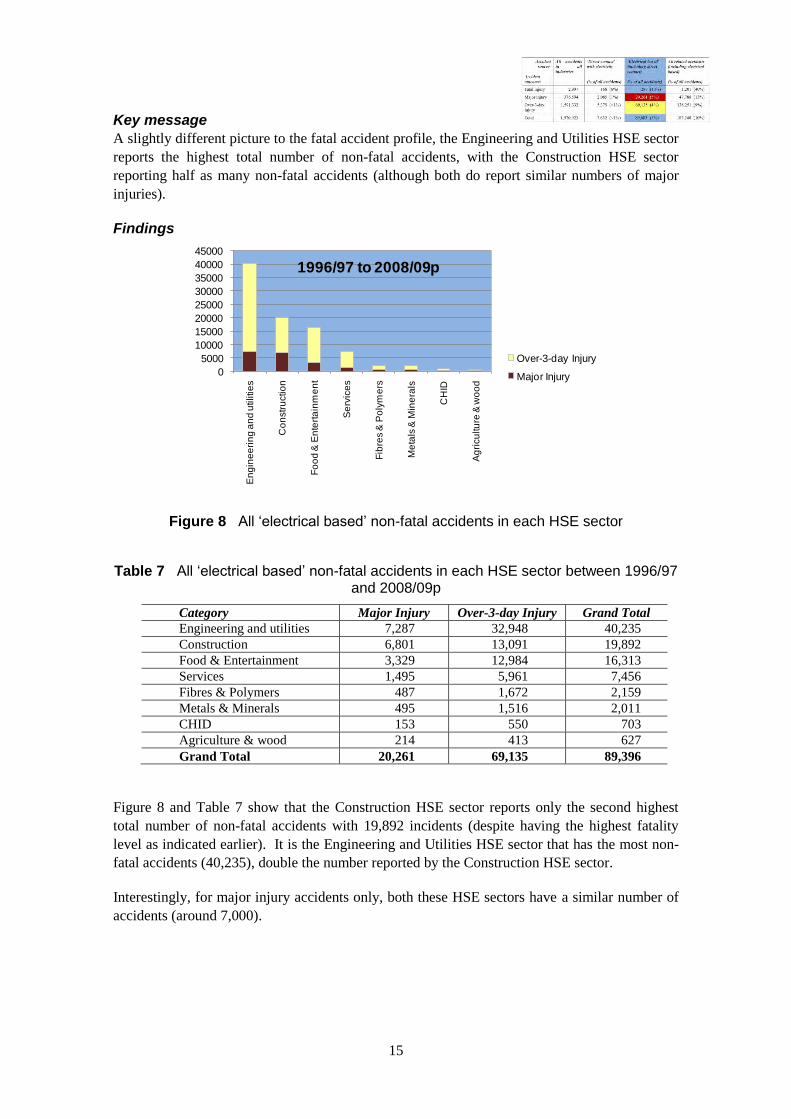
Key message
A slightly different picture to the fatal accident profile, the Engineering and Utilities HSE sector
the highest total number of non-fatal accidents, with the Construction HSE sector
reporting half as many non-fatal accidents (although both do report similar numbers of major
0
5000
10000
15000
20000
25000
30000
35000
40000
45000E
ng
ine
eri
ng
an
d u
tilitie
s
Co
nstr
uctio
n
Fo
od
& E
nte
rta
inm
en
t
Se
rvic
es
Fib
res &
Po
lym
ers
Me
tals
& M
ine
rals
CH
ID
Ag
ricu
ltu
re &
wo
od
Over-3-day Injury
Major Injury
1996/97 to 2008/09p
reports
injuries).
Findings
Figure 8 All „electrical based‟ non-fatal accidents in each HSE sector
Table 7 All „electrical based‟ non-fatal accidents in each HSE sector between 1996/97 and 2008/09p
Category Major Injury Over-3-day Injury Grand Total
Engineering and utilities 7,287 32,948 40,235
Construction 6,801 13,091 19,892
Food & Entertainment 3,329 12,984 16,313
Services 1,495 5,961 7,456
Fibres & Polymers 487 1,672 2,159
Metals & Minerals 495 1,516 2,011
CHID 153 550 703
Agriculture & wood 214 413 627
Grand Total 20,261 69,135 89,396
Figure 8 and Table 7 show that the Construction HSE sector reports only the second highest
total number of non-fatal accidents with 19,892 incidents (despite having the highest fatality
level as indicated earlier). It is the Engineering and Utilities HSE sector that has the most non-
fatal accidents (40,235), double the number reported by the Construction HSE sector.
Interestingly, for major injury accidents only, both these HSE sectors have a similar number of
accidents (around 7,000).
15
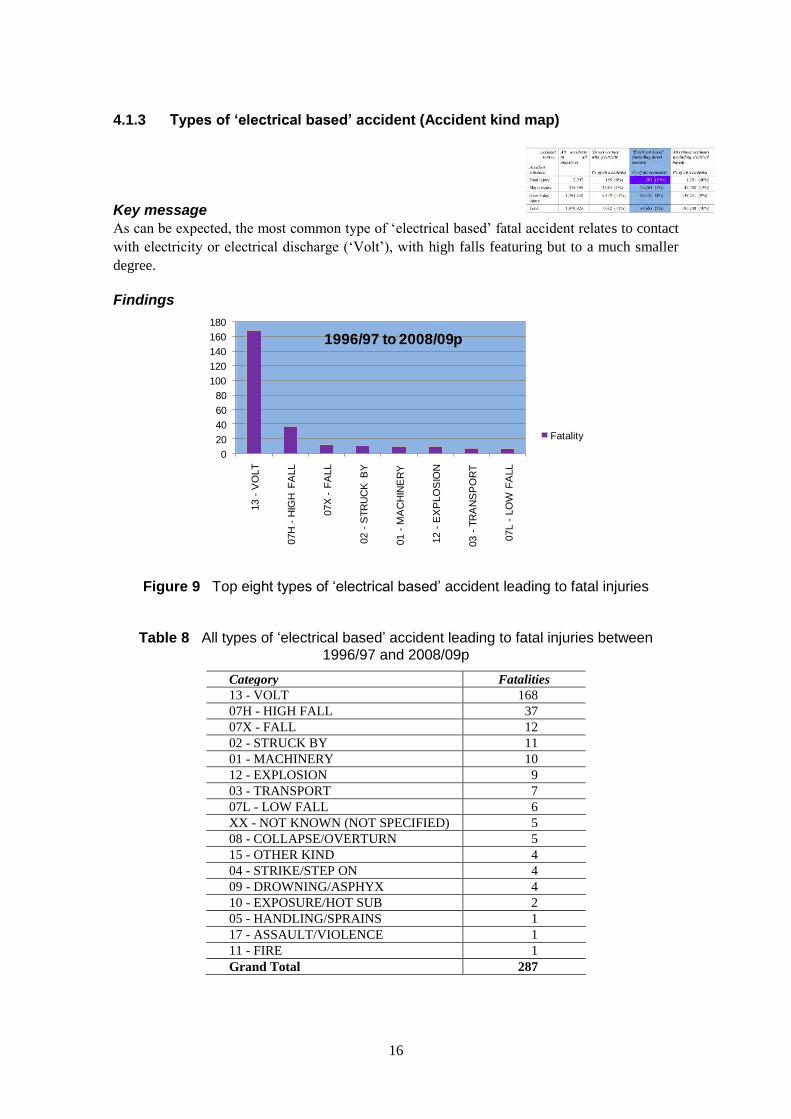
Types of ‘electrical based’ accident (Accident kind map)
Key message
As can be expected, the most common type of ‘electrical based’ fatal accident relates to contact
with electricity or electrical discharge (‘Volt’), with high falls featuring but to a much smaller
0
20
40
60
80
100
120
140
160
180
13 -
VO
LT
07H
-H
IGH
FA
LL
07X
-F
ALL
02 -
STR
UC
K B
Y
01 -
MA
CH
INE
RY
12 -
EX
PLO
SIO
N
03 -
TR
AN
SP
OR
T
07L -
LO
W F
ALL
Fatality
1996/97 to 2008/09p
4.1.3
degree.
Findings
Figure 9 Top eight types of „electrical based‟ accident leading to fatal injuries
Table 8 All types of „electrical based‟ accident leading to fatal injuries between 1996/97 and 2008/09p
Category Fatalities
13 - VOLT 168
07H - HIGH FALL 37
07X - FALL 12
02 - STRUCK BY 11
01 - MACHINERY 10
12 - EXPLOSION 9
03 - TRANSPORT 7
07L - LOW FALL 6
XX - NOT KNOWN (NOT SPECIFIED) 5
08 - COLLAPSE/OVERTURN 5
15 - OTHER KIND 4
04 - STRIKE/STEP ON 4
09 - DROWNING/ASPHYX 4
10 - EXPOSURE/HOT SUB 2
05 - HANDLING/SPRAINS 1
17 - ASSAULT/VIOLENCE 1
11 - FIRE 1
Grand Total 287
16

Figure 9 and Table 8 show that contact with electricity or electrical discharge (as shown by the
‘Volt’ bar) have clearly caused the highest number of fatalities (168 constituting around 59% of
all ‘electrical based’ fatalities over the 13 year period).
The next most common type of accident associated with fatal accidents, albeit it much lower
than the ‘volt’ category, relates to high falls (37 deaths).
17
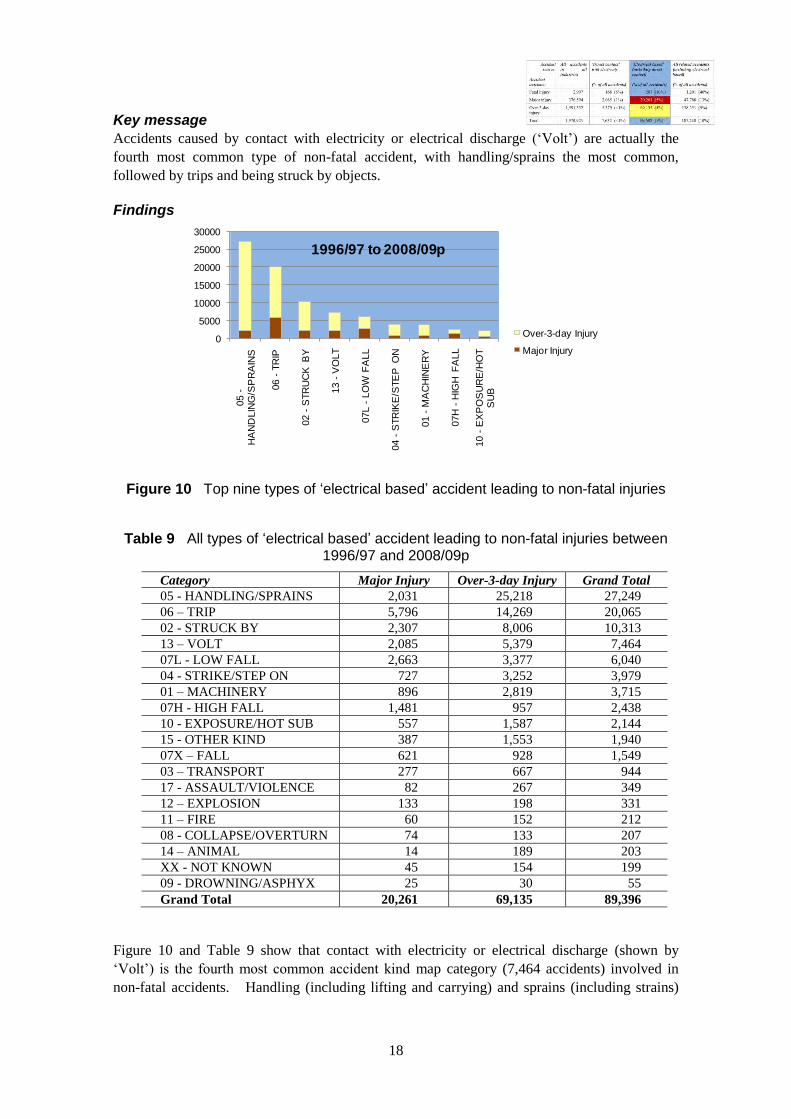
Key message
Accidents caused by contact with electricity or electrical discharge (‘Volt’) are actually the
most common type of non-fatal accident, with handling/sprains the most common,
followed by trips and being struck by objects.
0
5000
10000
15000
20000
25000
3000005 -
HA
ND
LIN
G/S
PR
AIN
S
06 -
TR
IP
02 -
STR
UC
K B
Y
13 -
VO
LT
07L -
LO
W F
ALL
04 -
STR
IKE
/STE
P O
N
01 -
MA
CH
INE
RY
07H
-H
IGH
FA
LL
10 -
EX
PO
SU
RE
/HO
T
SU
B
Over-3-day Injury
Major Injury
1996/97 to 2008/09p
fourth
Findings
Figure 10 Top nine types of „electrical based‟ accident leading to non-fatal injuries
Table 9 All types of „electrical based‟ accident leading to non-fatal injuries between 1996/97 and 2008/09p
Category Major Injury Over-3-day Injury Grand Total
05 - HANDLING/SPRAINS 2,031 25,218 27,249
06 – TRIP 5,796 14,269 20,065
02 - STRUCK BY 2,307 8,006 10,313
13 – VOLT 2,085 5,379 7,464
07L - LOW FALL 2,663 3,377 6,040
04 - STRIKE/STEP ON 727 3,252 3,979
01 – MACHINERY 896 2,819 3,715
07H - HIGH FALL 1,481 957 2,438
10 - EXPOSURE/HOT SUB 557 1,587 2,144
15 - OTHER KIND 387 1,553 1,940
07X – FALL 621 928 1,549
03 – TRANSPORT 277 667 944
17 - ASSAULT/VIOLENCE 82 267 349
12 – EXPLOSION 133 198 331
11 – FIRE 60 152 212
08 - COLLAPSE/OVERTURN 74 133 207
14 – ANIMAL 14 189 203
XX - NOT KNOWN 45 154 199
09 - DROWNING/ASPHYX 25 30 55
Grand Total 20,261 69,135 89,396
Figure 10 and Table 9 show that contact with electricity or electrical discharge (shown by
‘Volt’) is the fourth most common accident kind map category (7,464 accidents) involved in
non-fatal accidents. Handling (including lifting and carrying) and sprains (including strains)
18

are the most common accident kind with 27,249 accidents. Trips (20,065) and being struck by
an object (10,313) are the next most common kinds of accident.
19
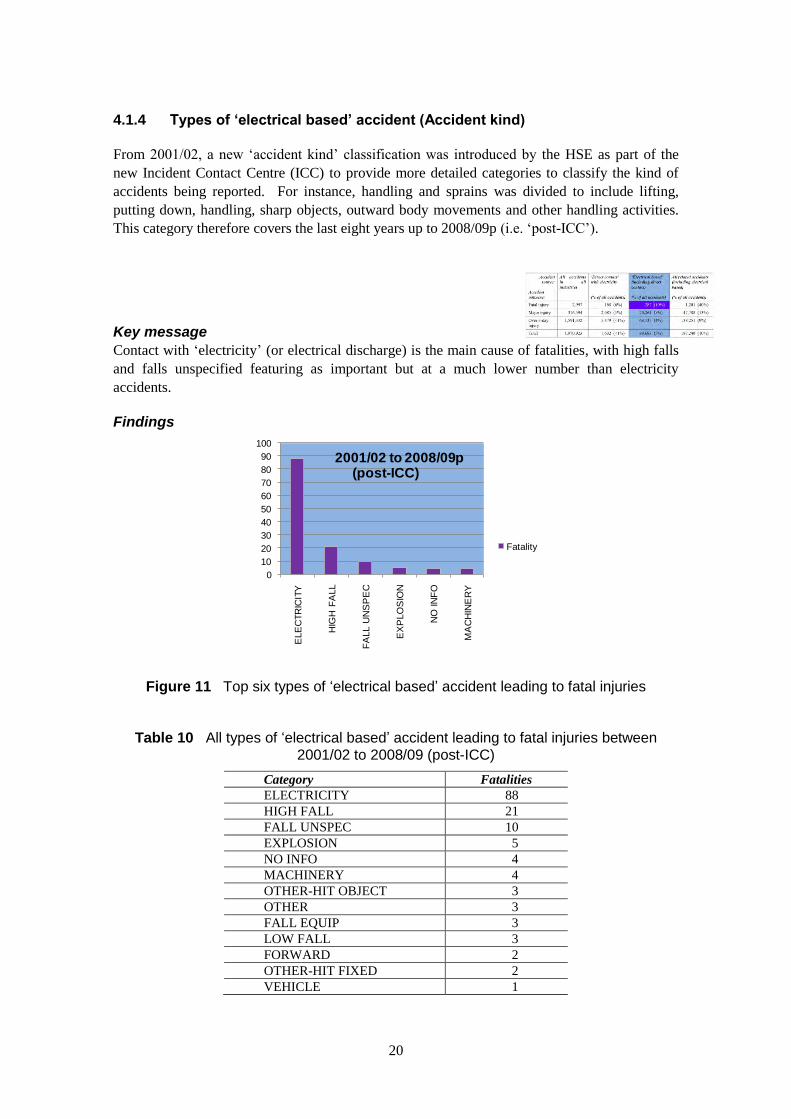
Types of ‘electrical based’ accident (Accident kind)
‘accident kind’ classification was introduced by the HSE as part of the
new Incident Contact Centre (ICC) to provide more detailed categories to classify the kind of
accidents being reported. For instance, handling and sprains was divided to include lifting,
putting down, handling, sharp objects, outward body movements and other handling activities.
This category therefore covers the last eight years up to 2008/09p (i.e. ‘post ICC’).
electricity (or electrical discharge) is the main cause of fatalities, with high falls
featuring as important but at a much lower number than electricity
0
10
20
30
40
50
60
70
80
90
100
ELE
CTR
ICIT
Y
HIG
H F
ALL
FA
LL U
NS
PE
C
EX
PLO
SIO
N
NO
IN
FO
MA
CH
INE
RY
Fatality
2001/02 to 2008/09p(post-ICC)
4.1.4
From 2001/02, a new
-
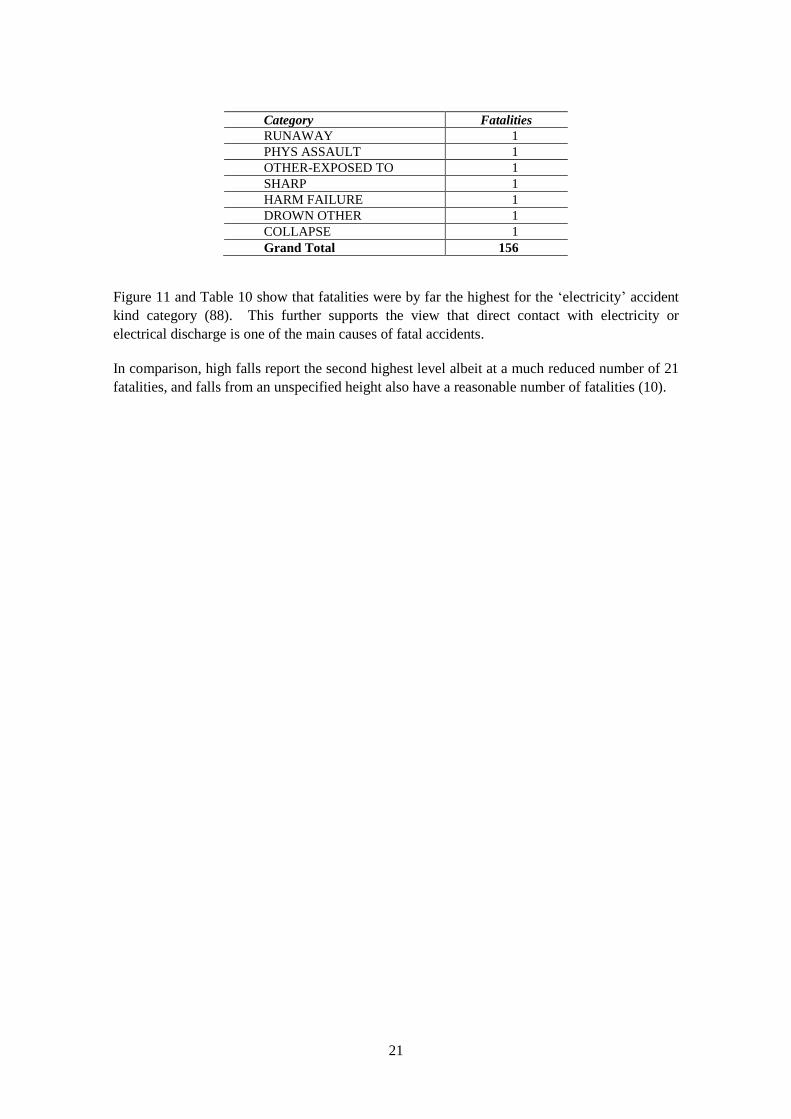
Key message
Contact with ‘ ’
and falls unspecified
accidents.
Findings
Figure 11 Top six types of „electrical based‟ accident leading to fatal injuries
Table 10 All types of „electrical based‟ accident leading to fatal injuries between 2001/02 to 2008/09 (post-ICC)
Category Fatalities
ELECTRICITY 88
HIGH FALL 21
FALL UNSPEC 10
EXPLOSION 5
NO INFO 4
MACHINERY 4
OTHER-HIT OBJECT 3
OTHER 3
FALL EQUIP 3
LOW FALL 3
FORWARD 2
OTHER-HIT FIXED 2
VEHICLE 1
20
Category Fatalities
RUNAWAY 1
PHYS ASSAULT 1
OTHER-EXPOSED TO 1
SHARP 1
HARM FAILURE 1
DROWN OTHER 1
COLLAPSE 1
Grand Total 156
Figure 11 and Table 10 show that fatalities were by far the highest for the ‘electricity’ accident
kind category (88). This further supports the view that direct contact with electricity or
electrical discharge is one of the main causes of fatal accidents.
In comparison, high falls report the second highest level albeit at a much reduced number of 21
fatalities, and falls from an unspecified height also have a reasonable number of fatalities (10).
21
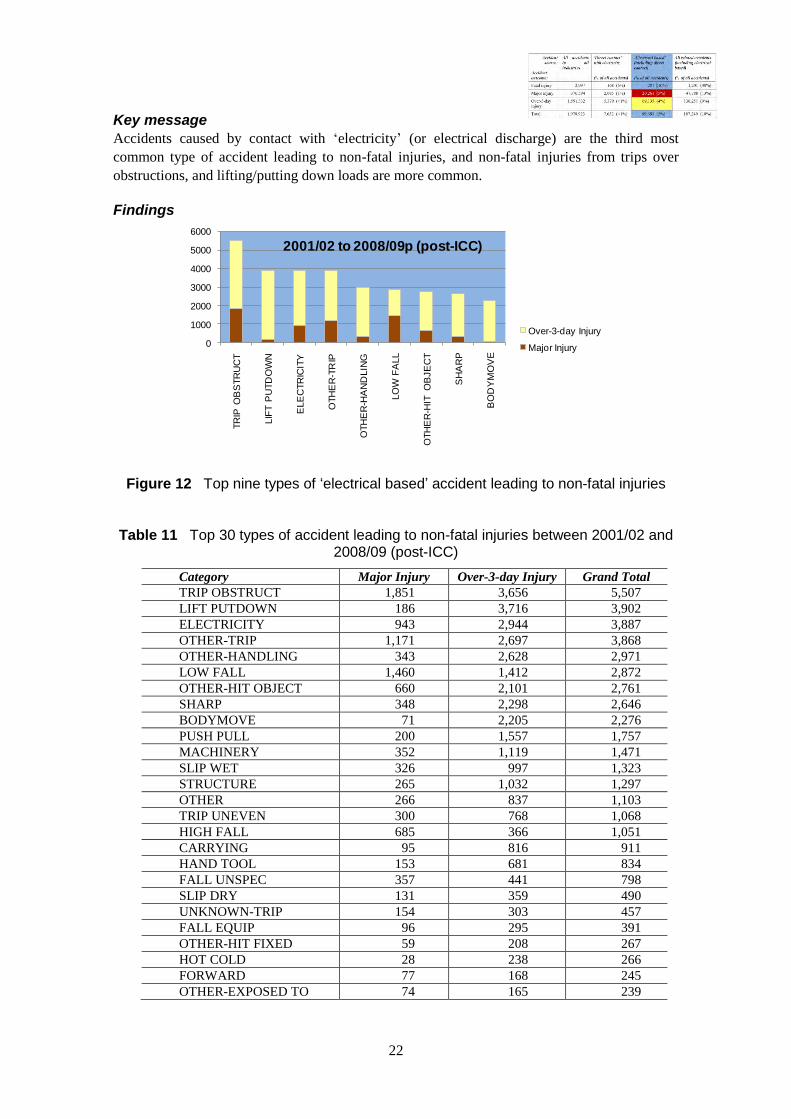
Key message
caused by contact with electricity (or electrical discharge) are the third most
common type of accident leading to non-fatal injuries, and non-fatal injuries from trips over
obstructions, and lifting/putting down loads are more common.
0
1000
2000
3000
4000
5000
6000TR
IP O
BS
TR
UC
T
LIF
T P
UTD
OW
N
ELE
CTR
ICIT
Y
OTH
ER
-TR
IP
OTH
ER
-HA
ND
LIN
G
LO
W F
ALL
OTH
ER
-HIT
O
BJE
CT
SH
AR
P
BO
DY
MO
VE
Over-3-day Injury
Major Injury
2001/02 to 2008/09p (post-ICC)
Accidents ‘ ’
Findings
Figure 12 Top nine types of „electrical based‟ accident leading to non-fatal injuries
Table 11 Top 30 types of accident leading to non-fatal injuries between 2001/02 and 2008/09 (post-ICC)
Category Major Injury Over-3-day Injury Grand Total
TRIP OBSTRUCT 1,851 3,656 5,507
LIFT PUTDOWN 186 3,716 3,902
ELECTRICITY 943 2,944 3,887
OTHER-TRIP 1,171 2,697 3,868
OTHER-HANDLING 343 2,628 2,971
LOW FALL 1,460 1,412 2,872
OTHER-HIT OBJECT 660 2,101 2,761
SHARP 348 2,298 2,646
BODYMOVE 71 2,205 2,276
PUSH PULL 200 1,557 1,757
MACHINERY 352 1,119 1,471
SLIP WET 326 997 1,323
STRUCTURE 265 1,032 1,297
OTHER 266 837 1,103
TRIP UNEVEN 300 768 1,068
HIGH FALL 685 366 1,051
CARRYING 95 816 911
HAND TOOL 153 681 834
FALL UNSPEC 357 441 798
SLIP DRY 131 359 490
UNKNOWN-TRIP 154 303 457
FALL EQUIP 96 295 391
OTHER-HIT FIXED 59 208 267
HOT COLD 28 238 266
FORWARD 77 168 245
OTHER-EXPOSED TO 74 165 239
22
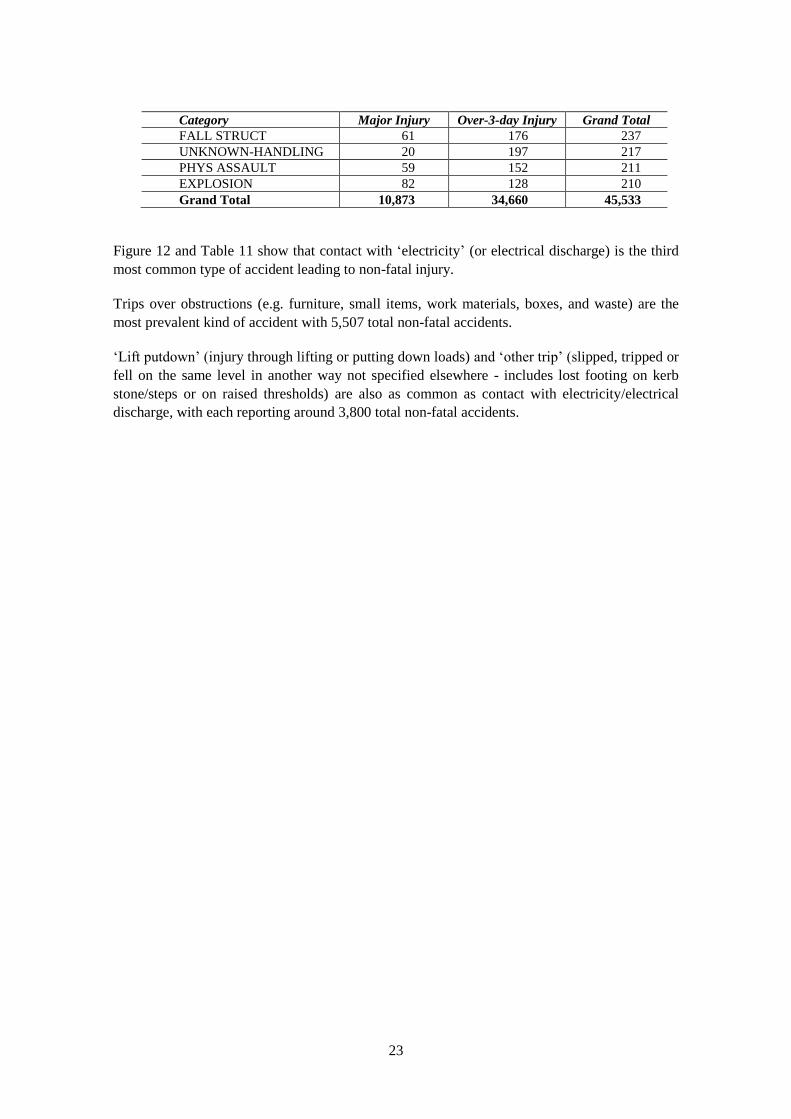
Category Major Injury Over-3-day Injury Grand Total
FALL STRUCT 61 176 237
UNKNOWN-HANDLING 20 197 217
PHYS ASSAULT 59 152 211
EXPLOSION 82 128 210
Grand Total 10,873 34,660 45,533
Figure 12 and Table 11 show that contact with ‘electricity’ (or electrical discharge) is the third
most common type of accident leading to non-fatal injury.
Trips over obstructions (e.g. furniture, small items, work materials, boxes, and waste) are the
most prevalent kind of accident with 5,507 total non-fatal accidents.
‘Lift putdown’ (injury through lifting or putting down loads) and ‘other trip’ (slipped, tripped or
fell on the same level in another way not specified elsewhere - includes lost footing on kerb
stone/steps or on raised thresholds) are also as common as contact with electricity/electrical
discharge, with each reporting around 3,800 total non-fatal accidents.
23
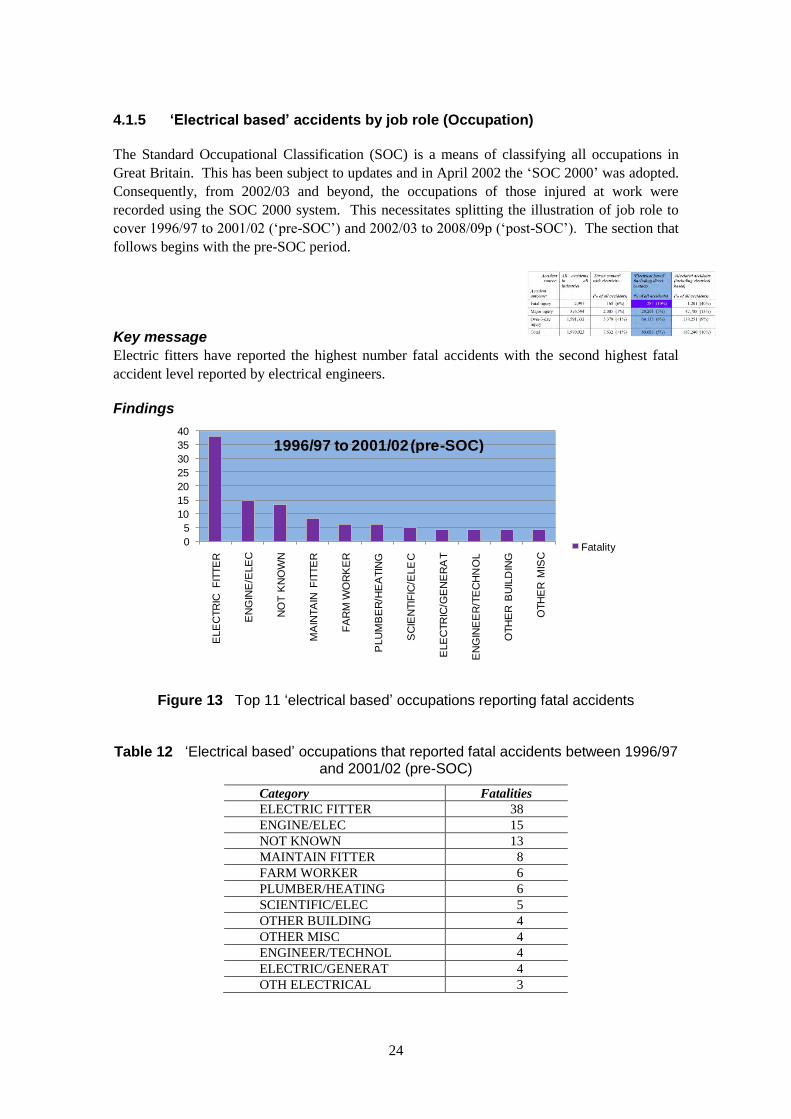
‘Electrical based’ accidents by job role (Occupation)
The Standard Occupational Classification (SOC) is a means of classifying all occupations in
Great Britain. This has been subject to updates and in April 2002 the SOC 2000 was adopted.
Consequently, from 2002/03 and beyond, the occupations of those injured at work were
recorded using the SOC 2000 system. This necessitates splitting the illustration of job role to
cover 1996/97 to 2001/02 (‘pre SOC’) and 2002/03 to 2008/09p (‘post-SOC’). The section that
follows begins with the pre-SOC period.
Key message
Electric fitters have reported the highest number fatal accidents with the second highest fatal
accident level reported by electrical engineers.
Findings
0
5
10
15
20
25
30
35
40
ELE
CTR
IC F
ITTE
R
EN
GIN
E/E
LE
C
NO
T K
NO
WN
MA
INTA
IN F
ITTE
R
FA
RM
WO
RK
ER
PLU
MB
ER
/HE
ATIN
G
SC
IEN
TIF
IC/E
LE
C
ELE
CTR
IC/G
EN
ER
AT
EN
GIN
EE
R/T
EC
HN
OL
OTH
ER
BU
ILD
ING
OTH
ER
MIS
CFatality
1996/97 to 2001/02 (pre-SOC)
4.1.5
‘ ’
-
Figure 13 Top 11 „electrical based‟ occupations reporting fatal accidents
Table 12 „Electrical based‟ occupations that reported fatal accidents between 1996/97 and 2001/02 (pre-SOC)
Category Fatalities
ELECTRIC FITTER 38
ENGINE/ELEC 15
NOT KNOWN 13
MAINTAIN FITTER 8
FARM WORKER 6
PLUMBER/HEATING 6
SCIENTIFIC/ELEC 5
OTHER BUILDING 4
OTHER MISC 4
ENGINEER/TECHNOL 4
ELECTRIC/GENERAT 4
OTH ELECTRICAL 3
24

Category Fatalities
OTHER MANUAL 3
GOODS DRIVER 3
BUILDER 3
AGRIC/MANAGERS 3
OTH CONSTRUCTION 3
OTH AGRICULTURE 2
OTH/TRANS/MACH 2
ROAD CONSTRUCT 2
BUILDING LABOUR 2
CABLE JOINTER 2
FORESTRY 2
OTH MACH/PLANT 2
Grand Total 139
Figure 13 and Table 12 shows that electric fitters have the greatest number of fatal accidents
(38). The next highest fatalities are reported for electrical engineers (15), and then maintenance
fitters (8).
In order to present the data succinctly, the table only shows occupations that have reported two
or more ‘electrical based’ fatalities.
25
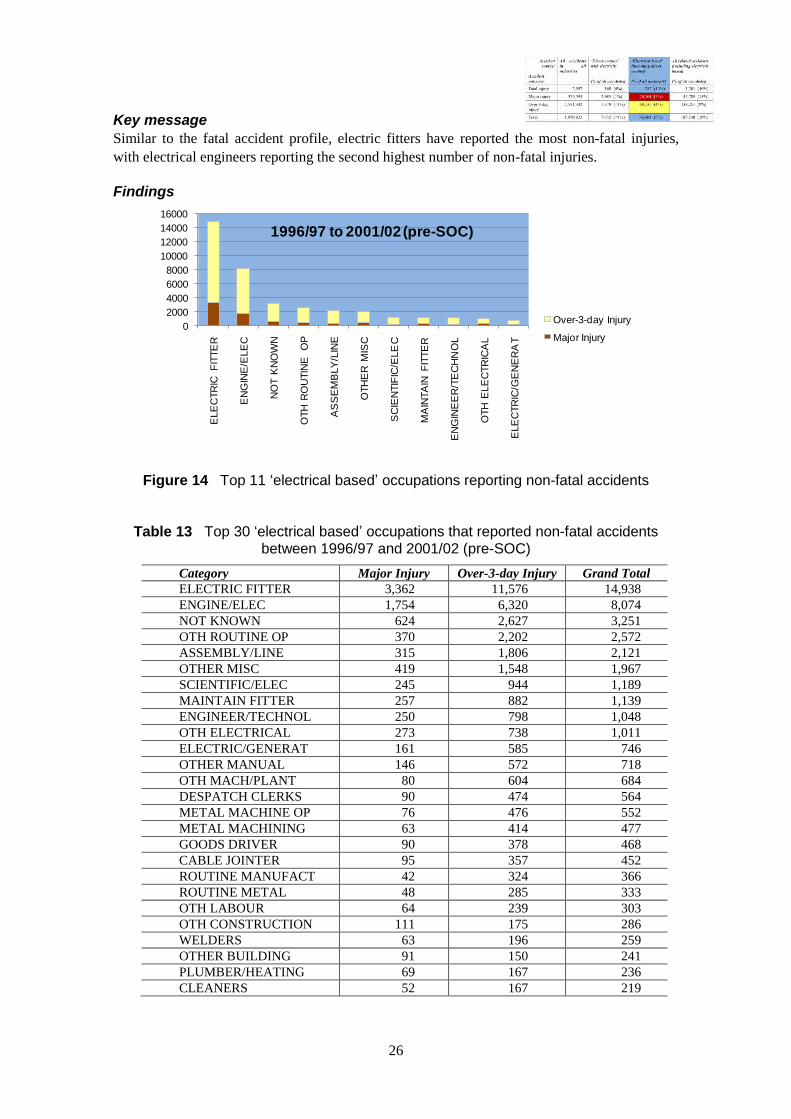
Key message
Similar to the fatal accident profile, electric fitters have reported the most non-fatal injuries,
with electrical engineers reporting the second highest number of non-fatal injuries.
Findings
0
2000
4000
6000
8000
10000
12000
14000
16000E
LE
CTR
IC F
ITTE
R
EN
GIN
E/E
LE
C
NO
T K
NO
WN
OTH
RO
UTIN
E
OP
AS
SE
MB
LY
/LIN
E
OTH
ER
MIS
C
SC
IEN
TIF
IC/E
LE
C
MA
INTA
IN F
ITTE
R
EN
GIN
EE
R/T
EC
HN
OL
OTH
ELE
CTR
ICA
L
ELE
CTR
IC/G
EN
ER
AT
Over-3-day Injury
Major Injury
1996/97 to 2001/02 (pre-SOC)
Figure 14 Top 11 „electrical based‟ occupations reporting non-fatal accidents
Table 13 Top 30 „electrical based‟ occupations that reported non-fatal accidents between 1996/97 and 2001/02 (pre-SOC)
Category Major Injury Over-3-day Injury Grand Total
ELECTRIC FITTER 3,362 11,576 14,938
ENGINE/ELEC 1,754 6,320 8,074
NOT KNOWN 624 2,627 3,251
OTH ROUTINE OP 370 2,202 2,572
ASSEMBLY/LINE 315 1,806 2,121
OTHER MISC 419 1,548 1,967
SCIENTIFIC/ELEC 245 944 1,189
MAINTAIN FITTER 257 882 1,139
ENGINEER/TECHNOL 250 798 1,048
OTH ELECTRICAL 273 738 1,011
ELECTRIC/GENERAT 161 585 746
OTHER MANUAL 146 572 718
OTH MACH/PLANT 80 604 684
DESPATCH CLERKS 90 474 564
METAL MACHINE OP 76 476 552
METAL MACHINING 63 414 477
GOODS DRIVER 90 378 468
CABLE JOINTER 95 357 452
ROUTINE MANUFACT 42 324 366
ROUTINE METAL 48 285 333
OTH LABOUR 64 239 303
OTH CONSTRUCTION 111 175 286
WELDERS 63 196 259
OTHER BUILDING 91 150 241
PLUMBER/HEATING 69 167 236
CLEANERS 52 167 219
26

Category Major Injury Over-3-day Injury Grand Total
CARPENTER/JOINER 53 150 203
OTH CRAFT/MANUAL 30 170 200
OTH PROC OP 25 168 193
OTH MACHINING 31 155 186
Grand Total 9,349 35,647 44,996
Figure 14 and Table 13 show that again, it is clear that electric fitters reported the highest
number of injuries with 14,938 total non-fatal accidents.
Electrical engineers also have a significant number of total non-fatal accidents (8,074) followed
by other routine operatives (2,572).
27
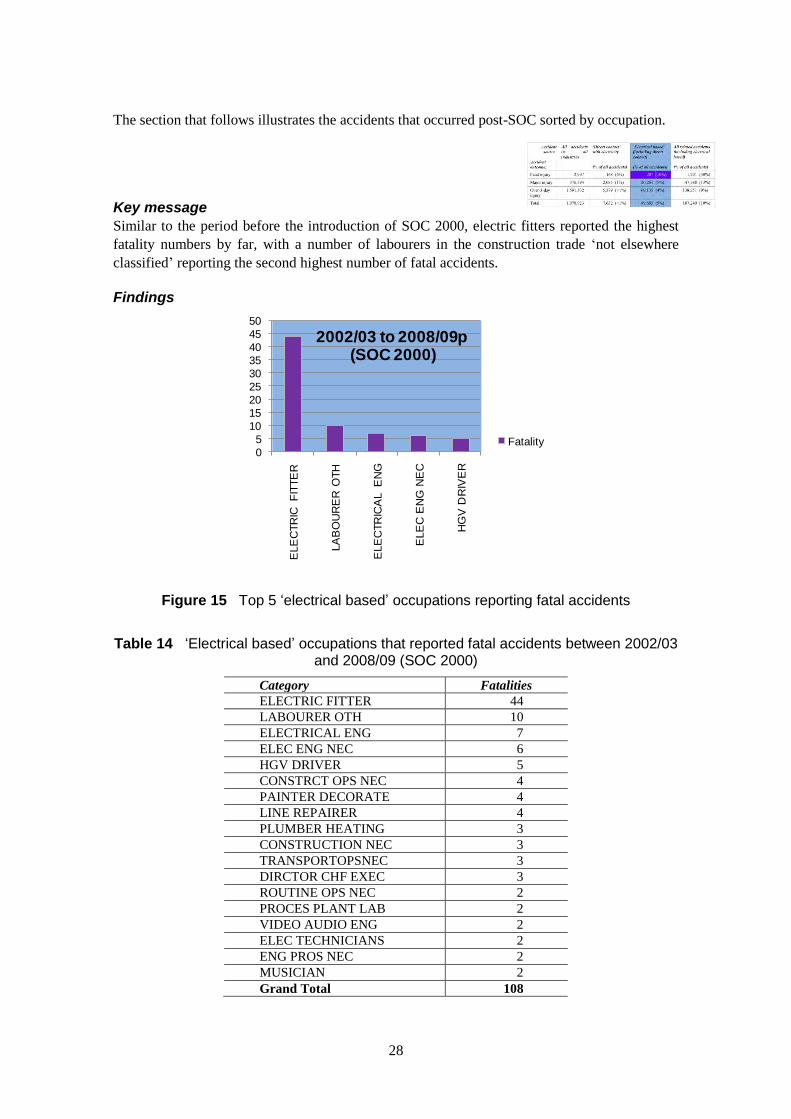
The section that follows illustrates the accidents that occurred post-SOC sorted by occupation.
Similar to the period before the introduction of SOC 2000, electric fitters reported the highest
fatality numbers by far, with a number of labourers in the construction trade not elsewhere
reporting the second highest number of fatal accidents.
0
5
10
15
20
25
30
35
40
45
50
ELE
CTR
IC F
ITTE
R
LA
BO
UR
ER
OTH
ELE
CTR
ICA
L E
NG
ELE
C E
NG
NE
C
HG
V D
RIV
ER
Fatality
2002/03 to 2008/09p (SOC 2000)
Key message
‘
classified’
Findings
Figure 15 Top 5 „electrical based‟ occupations reporting fatal accidents
Table 14 „Electrical based‟ occupations that reported fatal accidents between 2002/03 and 2008/09 (SOC 2000)
Category Fatalities
ELECTRIC FITTER 44
LABOURER OTH 10
ELECTRICAL ENG 7
ELEC ENG NEC 6
HGV DRIVER 5
CONSTRCT OPS NEC 4
PAINTER DECORATE 4
LINE REPAIRER 4
PLUMBER HEATING 3
CONSTRUCTION NEC 3
TRANSPORTOPSNEC 3
DIRCTOR CHF EXEC 3
ROUTINE OPS NEC 2
PROCES PLANT LAB 2
VIDEO AUDIO ENG 2
ELEC TECHNICIANS 2
ENG PROS NEC 2
MUSICIAN 2
Grand Total 108
28

Figure 15 and Table 14 show that similar to the results from the pre-SOC classification (as was
seen in Figure 13), electrical fitters report the greatest number of fatalities (44).
Of interest, the second highest number of reported fatal accidents (10) are reported for
‘Labourer oth’ (labourers in other construction trades n.e.c. (not elsewhere classified)), with
electrical engineers (7) and electrical engineers n.e.c. (6) reporting similar numbers.
In order to present the data succinctly, the table only shows occupations that have reported two
or more ‘electrical based’ fatalities.
29
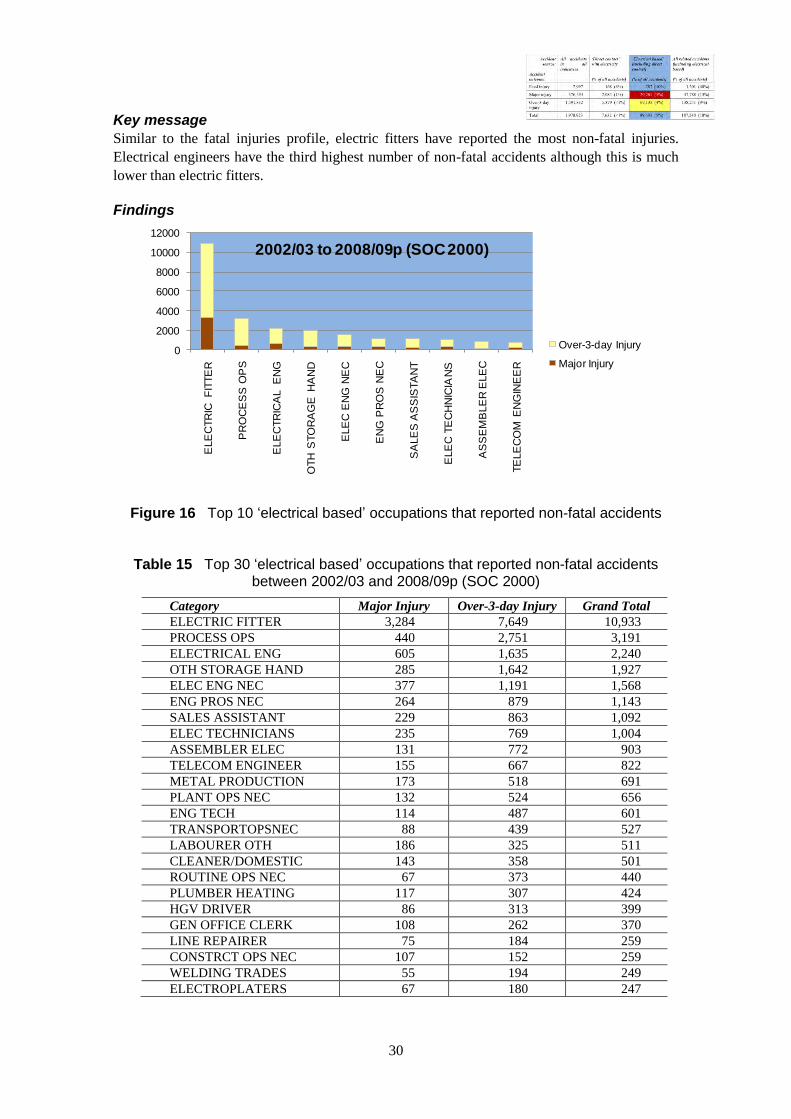
Key message
Similar to the fatal injuries profile, electric fitters have reported the most non-fatal injuries.
Electrical engineers have the third highest number of non-fatal accidents although this is much
lower than electric fitters.
Findings
0
2000
4000
6000
8000
10000
12000
ELE
CTR
IC F
ITTE
R
PR
OC
ES
S O
PS
ELE
CTR
ICA
L E
NG
OTH
STO
RA
GE
HA
ND
ELE
C E
NG
NE
C
EN
G P
RO
S N
EC
SA
LE
S A
SS
ISTA
NT
ELE
C T
EC
HN
ICIA
NS
AS
SE
MB
LE
R E
LE
C
TE
LE
CO
M E
NG
INE
ER
Over-3-day Injury
Major Injury
2002/03 to 2008/09p (SOC2000)
Figure 16 Top 10 „electrical based‟ occupations that reported non-fatal accidents
Table 15 Top 30 „electrical based‟ occupations that reported non-fatal accidents between 2002/03 and 2008/09p (SOC 2000)
Category Major Injury Over-3-day Injury Grand Total
ELECTRIC FITTER 3,284 7,649 10,933
PROCESS OPS 440 2,751 3,191
ELECTRICAL ENG 605 1,635 2,240
OTH STORAGE HAND 285 1,642 1,927
ELEC ENG NEC 377 1,191 1,568
ENG PROS NEC 264 879 1,143
SALES ASSISTANT 229 863 1,092
ELEC TECHNICIANS 235 769 1,004
ASSEMBLER ELEC 131 772 903
TELECOM ENGINEER 155 667 822
METAL PRODUCTION 173 518 691
PLANT OPS NEC 132 524 656
ENG TECH 114 487 601
TRANSPORTOPSNEC 88 439 527
LABOURER OTH 186 325 511
CLEANER/DOMESTIC 143 358 501
ROUTINE OPS NEC 67 373 440
PLUMBER HEATING 117 307 424
HGV DRIVER 86 313 399
GEN OFFICE CLERK 108 262 370
LINE REPAIRER 75 184 259
CONSTRCT OPS NEC 107 152 259
WELDING TRADES 55 194 249
ELECTROPLATERS 67 180 247
30
Category Major Injury Over-3-day Injury Grand Total
CARE ASSISTANT 57 190 247
RETAIL MGR 68 147 215
CATER ASSISTANT 42 170 212
CONSTRUCTION NEC 79 132 211
NURSES 53 154 207
CARPENTER 57 146 203
Grand Total 7,879 24,373 32,252
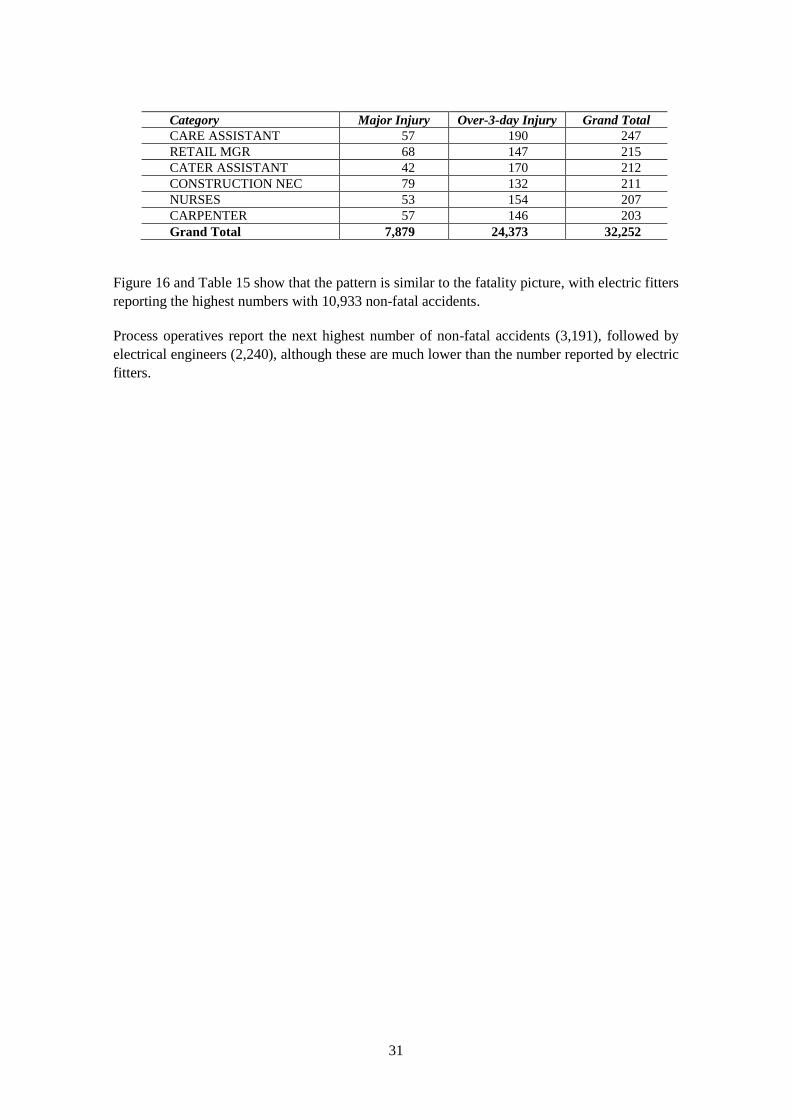
Figure 16 and Table 15 show that the pattern is similar to the fatality picture, with electric fitters
reporting the highest numbers with 10,933 non-fatal accidents.
Process operatives report the next highest number of non-fatal accidents (3,191), followed by
electrical engineers (2,240), although these are much lower than the number reported by electric
fitters.
31
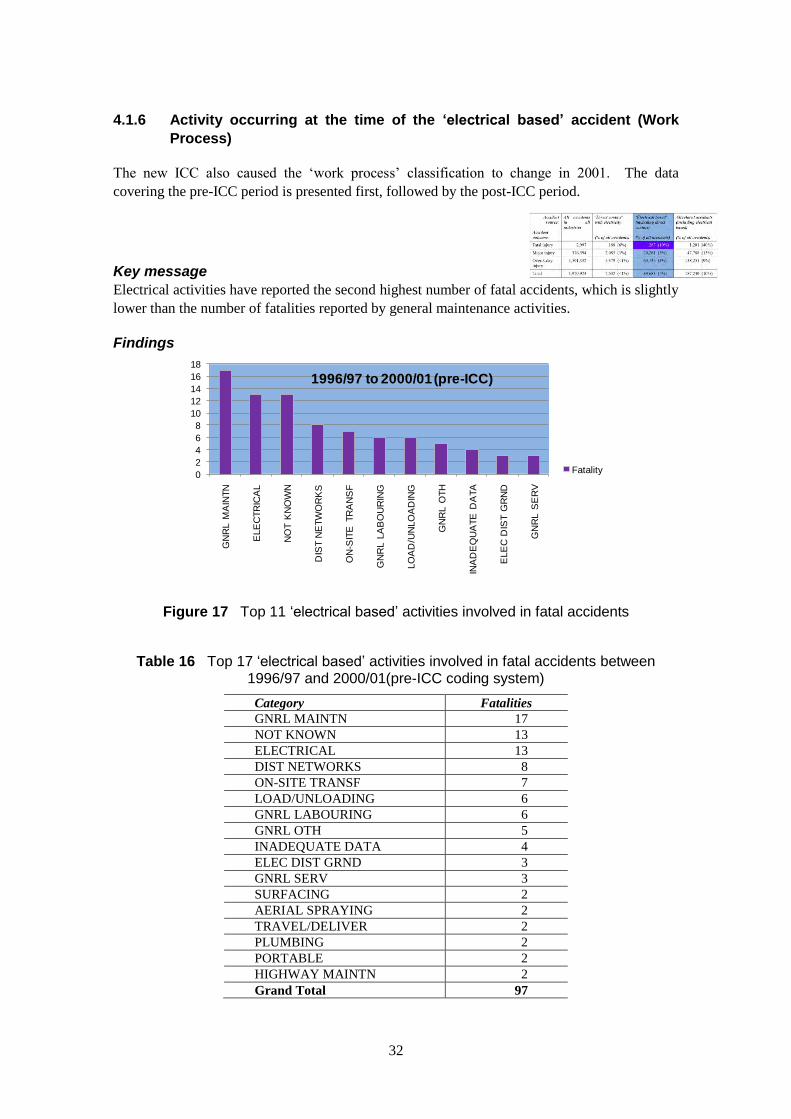
Activity occurring at the time of the ‘electrical based’ accident (Work
Process)
ICC also caused the ‘work process’ classification to change in 2001. The data
covering the pre-ICC period is presented first, followed by the post-ICC period.
Key message
Electrical activities have reported the second highest number of fatal accidents, which is slightly
lower than the number of fatalities reported by general maintenance activities.
0
2
4
6
8
10
12
14
16
18
GN
RL M
AIN
TN
ELE
CTR
ICA
L
NO
T K
NO
WN
DIS
T N
ETW
OR
KS
ON
-SIT
E T
RA
NS
F
GN
RL L
AB
OU
RIN
G
LO
AD
/UN
LO
AD
ING
GN
RL O
TH
INA
DE
QU
ATE
DA
TA
ELE
C D
IST G
RN
D
GN
RL S
ER
V
Fatality
1996/97 to 2000/01 (pre-ICC)
4.1.6
The new
Findings
Figure 17 Top 11 „electrical based‟ activities involved in fatal accidents
Table 16 Top 17 „electrical based‟ activities involved in fatal accidents between 1996/97 and 2000/01(pre-ICC coding system)
Category Fatalities
GNRL MAINTN 17
NOT KNOWN 13
ELECTRICAL 13
DIST NETWORKS 8
ON-SITE TRANSF 7
LOAD/UNLOADING 6
GNRL LABOURING 6
GNRL OTH 5
INADEQUATE DATA 4
ELEC DIST GRND 3
GNRL SERV 3
SURFACING 2
AERIAL SPRAYING 2
TRAVEL/DELIVER 2
PLUMBING 2
PORTABLE 2
HIGHWAY MAINTN 2
Grand Total 97
32

Figure 17 and Table 16 show that electrical work processes have the second highest number of
fatalities (13), after general maintenance (including repair, renovation, cleaning activities at
temporary locations, inspection; excluding building maintenance) with 17 fatalities.
Distribution networks (including electricity, gas, water, telecommunications and postal, meter
reading, mail collection, delivery and sorting) also have a relatively high number of fatalities
(8).
In order to present the data succinctly, the table only shows work processes that have reported
two or more ‘electrical based’ fatalities.
33
Key message
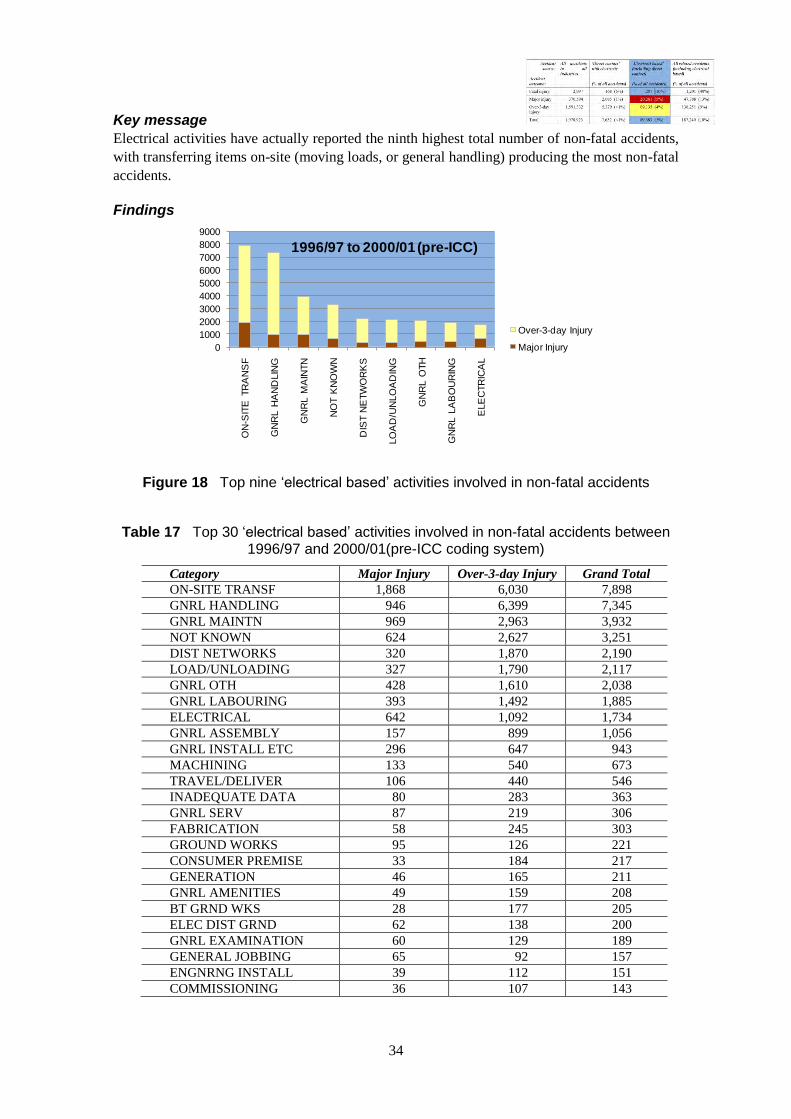
Electrical activities have actually reported the ninth highest total number of non-fatal accidents,
with transferring items on-site (moving loads, or general handling) producing the most non-fatal
0
1000
2000
3000
4000
5000
6000
7000
8000
9000
ON
-SIT
E T
RA
NS
F
GN
RL H
AN
DLIN
G
GN
RL M
AIN
TN
NO
T K
NO
WN
DIS
T N
ETW
OR
KS
LO
AD
/UN
LO
AD
ING
GN
RL O
TH
GN
RL L
AB
OU
RIN
G
ELE
CTR
ICA
L
Over-3-day Injury
Major Injury
1996/97 to 2000/01 (pre-ICC)
accidents.
Findings
Figure 18 Top nine „electrical based‟ activities involved in non-fatal accidents
Table 17 Top 30 „electrical based‟ activities involved in non-fatal accidents between 1996/97 and 2000/01(pre-ICC coding system)
Category Major Injury Over-3-day Injury Grand Total
ON-SITE TRANSF 1,868 6,030 7,898
GNRL HANDLING 946 6,399 7,345
GNRL MAINTN 969 2,963 3,932
NOT KNOWN 624 2,627 3,251
DIST NETWORKS 320 1,870 2,190
LOAD/UNLOADING 327 1,790 2,117
GNRL OTH 428 1,610 2,038
GNRL LABOURING 393 1,492 1,885
ELECTRICAL 642 1,092 1,734
GNRL ASSEMBLY 157 899 1,056
GNRL INSTALL ETC 296 647 943
MACHINING 133 540 673
TRAVEL/DELIVER 106 440 546
INADEQUATE DATA 80 283 363
GNRL SERV 87 219 306
FABRICATION 58 245 303
GROUND WORKS 95 126 221
CONSUMER PREMISE 33 184 217
GENERATION 46 165 211
GNRL AMENITIES 49 159 208
BT GRND WKS 28 177 205
ELEC DIST GRND 62 138 200
GNRL EXAMINATION 60 129 189
GENERAL JOBBING 65 92 157
ENGNRNG INSTALL 39 112 151
COMMISSIONING 36 107 143
34
Category Major Injury Over-3-day Injury Grand Total
GNRL STORING 23 117 140
GNRL PACKING 16 115 131
FINISHING PROCS 42 80 122
TOOL SETTING 17 104 121
Grand Total 8,045 30,951 38,996
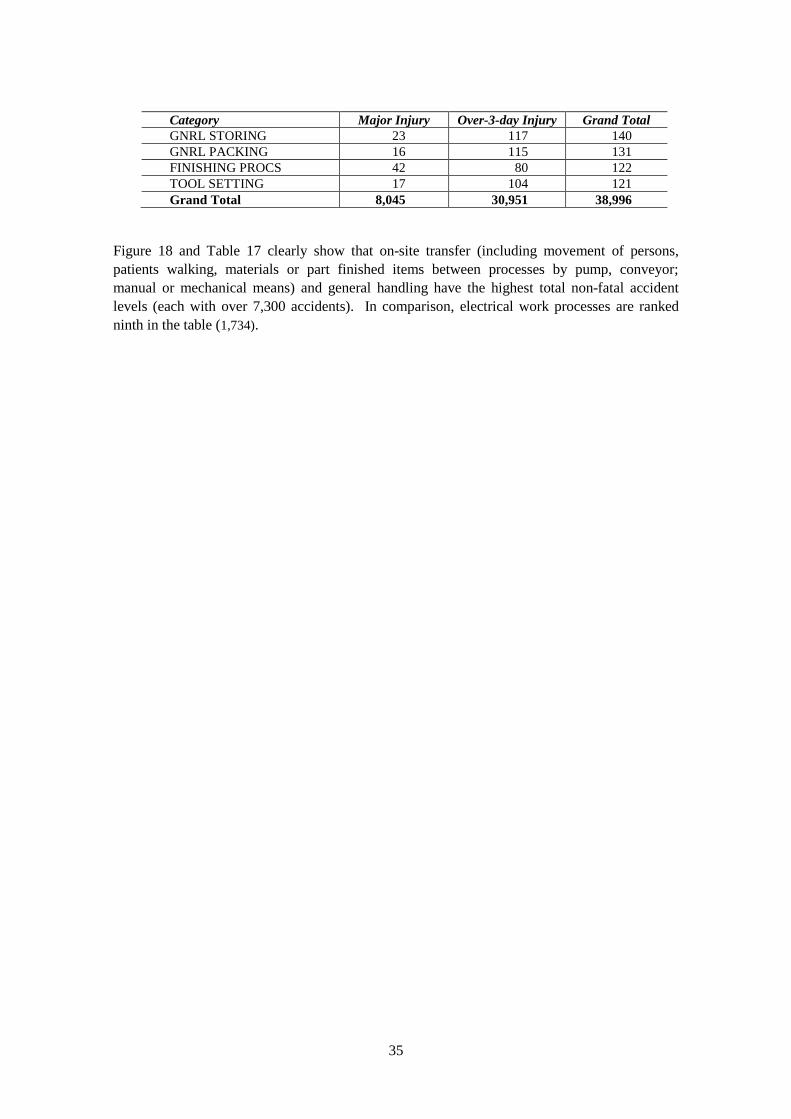
Figure 18 and Table 17 clearly show that on-site transfer (including movement of persons,
patients walking, materials or part finished items between processes by pump, conveyor;
manual or mechanical means) and general handling have the highest total non-fatal accident
levels (each with over 7,300 accidents). In comparison, electrical work processes are ranked
ninth in the table (1,734).
35
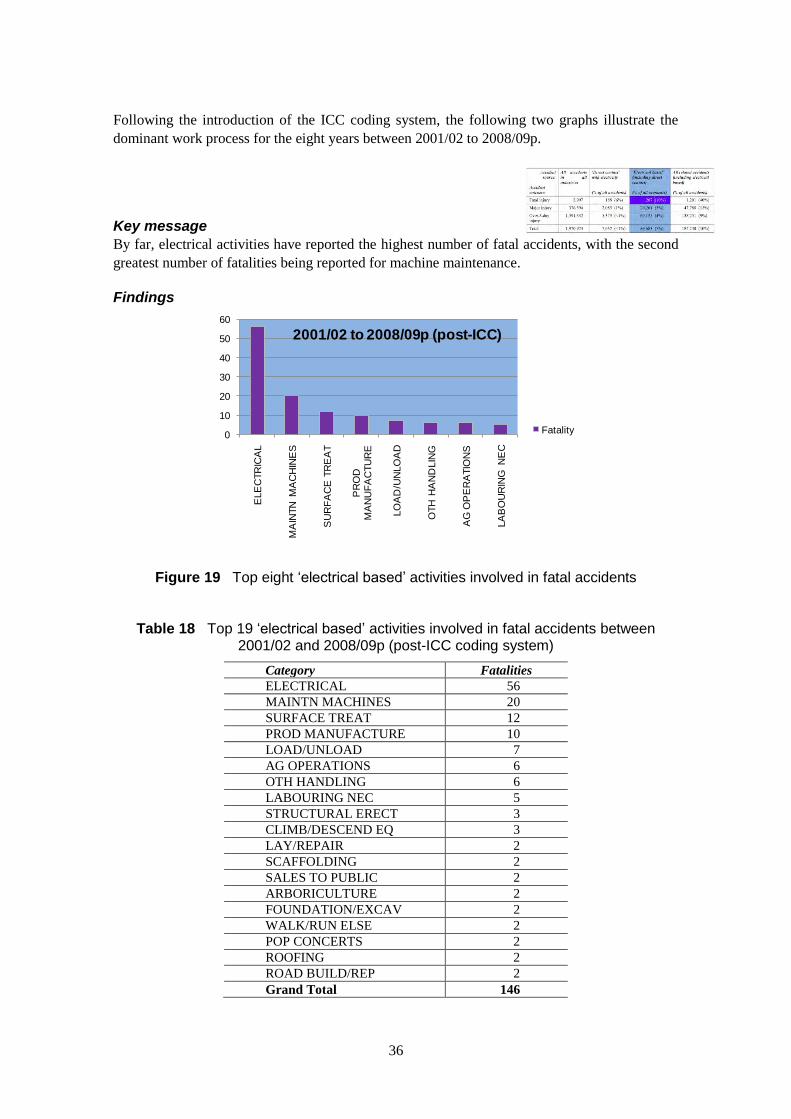
Following the introduction of the ICC coding system, the following two graphs illustrate the
dominant work process for the eight years between 2001/02 to 2008/09p.
By far, electrical activities have reported the highest number of fatal accidents, with the second
greatest number of fatalities being reported for machine maintenance.
0
10
20
30
40
50
60
ELE
CTR
ICA
L
MA
INTN
MA
CH
INE
S
SU
RF
AC
E T
RE
AT
PR
OD
M
AN
UF
AC
TU
RE
LO
AD
/UN
LO
AD
OTH
HA
ND
LIN
G
AG
OP
ER
ATIO
NS
LA
BO
UR
ING
NE
C
Fatality
2001/02 to 2008/09p (post-ICC)
Key message
Findings
Figure 19 Top eight „electrical based‟ activities involved in fatal accidents
Table 18 Top 19 „electrical based‟ activities involved in fatal accidents between 2001/02 and 2008/09p (post-ICC coding system)
Category Fatalities
ELECTRICAL 56
MAINTN MACHINES 20
SURFACE TREAT 12
PROD MANUFACTURE 10
LOAD/UNLOAD 7
AG OPERATIONS 6
OTH HANDLING 6
LABOURING NEC 5
STRUCTURAL ERECT 3
CLIMB/DESCEND EQ 3
LAY/REPAIR 2
SCAFFOLDING 2
SALES TO PUBLIC 2
ARBORICULTURE 2
FOUNDATION/EXCAV 2
WALK/RUN ELSE 2
POP CONCERTS 2
ROOFING 2
ROAD BUILD/REP 2
Grand Total 146
36

Figure 19 and Table 18 show that electrical activities occurring at the time of accident report the
highest fatal accident numbers (56).
In comparison, machine maintenance and surface treatment (painting, decorating, plastering,
flooring, plumbing, joinery) report 20 and 12 fatalities respectively.
In order to present the data succinctly, the table only shows work processes that have reported
two or more ‘electrical based’ fatalities.
37

Key message
the fatal accident profile, electrical activities have been involved in the highest
number of non-fatal accidents, with a similar number also found for manufacturing production
0100020003000400050006000700080009000
10000
EL
EC
TR
ICA
L
PR
OD
MA
NU
FA
CT
UR
E
MA
INT
N M
AC
HIN
ES
OT
H H
AN
DL
ING
WA
LK
/RU
N E
LS
E
CL
IMB
/DE
SC
EN
D E
Q
LO
AD
/UN
LO
AD
ST
OR
ING
Over-3-day Injury
Major Injury
2001/02 to 2008/09p (post-ICC)
Similar to
activities.
Findings
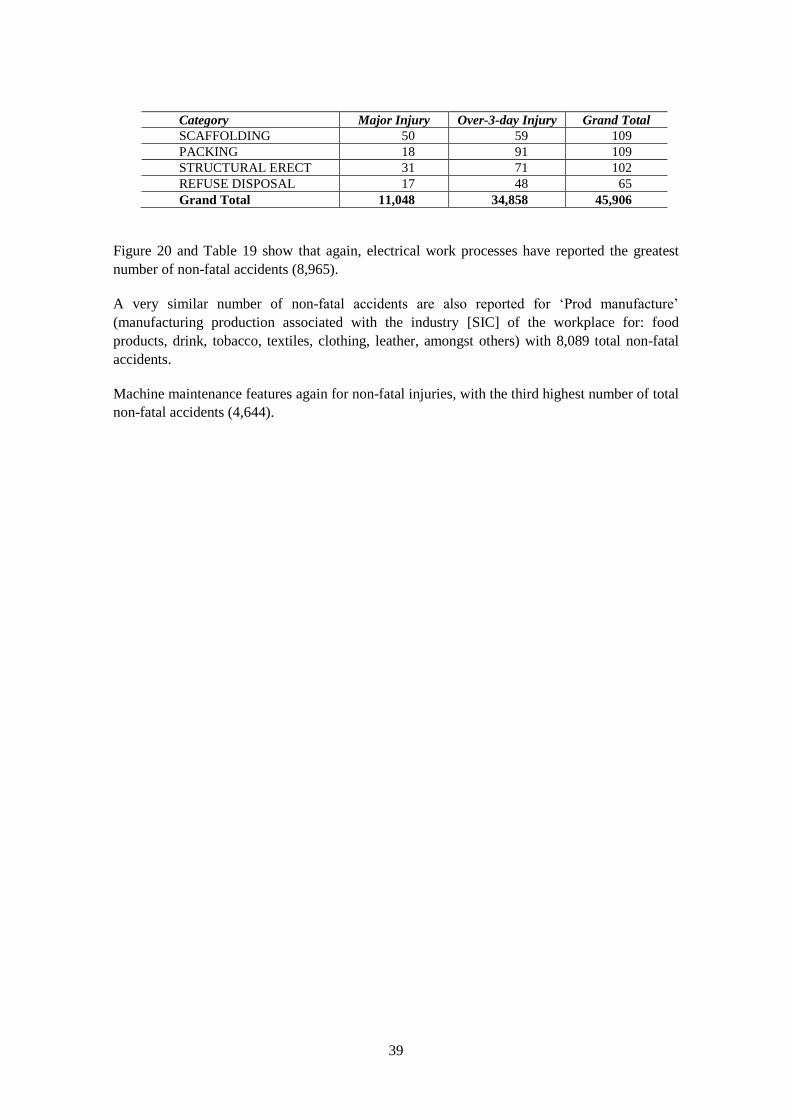
Figure 20 Top eight „electrical based‟ activities involved in non-fatal accidents
Table 19 Top 30 „electrical based‟ activities involved in non-fatal accidents between 2001/02 and 2008/09p (post-ICC coding system)
Category Major Injury Over-3-day Injury Grand Total
ELECTRICAL 2,932 6,033 8,965
PROD MANUFACTURE 1,351 6,738 8,089
MAINTN MACHINES 1,023 3,621 4,644
OTH HANDLING 626 3,630 4,256
WALK/RUN ELSE 1,079 2,687 3,766
CLIMB/DESCEND EQ 1,011 2,120 3,131
LOAD/UNLOAD 338 1,773 2,111
STORING 317 1,680 1,997
SALES TO PUBLIC 345 1,082 1,427
LABOURING NEC 294 888 1,182
SURFACE TREAT 298 747 1,045
ADMIN WORK 248 675 923
CLEAN INTERNAL 167 431 598
ENTER/LEAVE 135 331 466
SOCIAL CARE ELSE 112 314 426
VEHICLE REPAIR 87 327 414
FOOD REP 62 280 342
AMENITIES 61 266 327
WALK/RUN CARPARK 115 157 272
FOUNDATION/EXCAV 82 154 236
LAY/REPAIR 57 129 186
TEACHING 59 118 177
TRAV ON HIGHWAY 31 130 161
TRAV IN VEHICLE 44 107 151
NURSING 27 89 116
ROAD BUILD/REP 31 82 113
38
Category Major Injury Over-3-day Injury Grand Total
SCAFFOLDING 50 59 109
PACKING 18 91 109
STRUCTURAL ERECT 31 71 102
REFUSE DISPOSAL 17 48 65
Grand Total 11,048 34,858 45,906
Figure 20 and Table 19 show that again, electrical work processes have reported the greatest
number of non-fatal accidents (8,965).
A very similar number of non-fatal accidents are also reported for ‘Prod manufacture’
(manufacturing production associated with the industry [SIC] of the workplace for: food
products, drink, tobacco, textiles, clothing, leather, amongst others) with 8,089 total non-fatal
accidents.
Machine maintenance features again for non-fatal injuries, with the third highest number of total
non-fatal accidents (4,644).
39
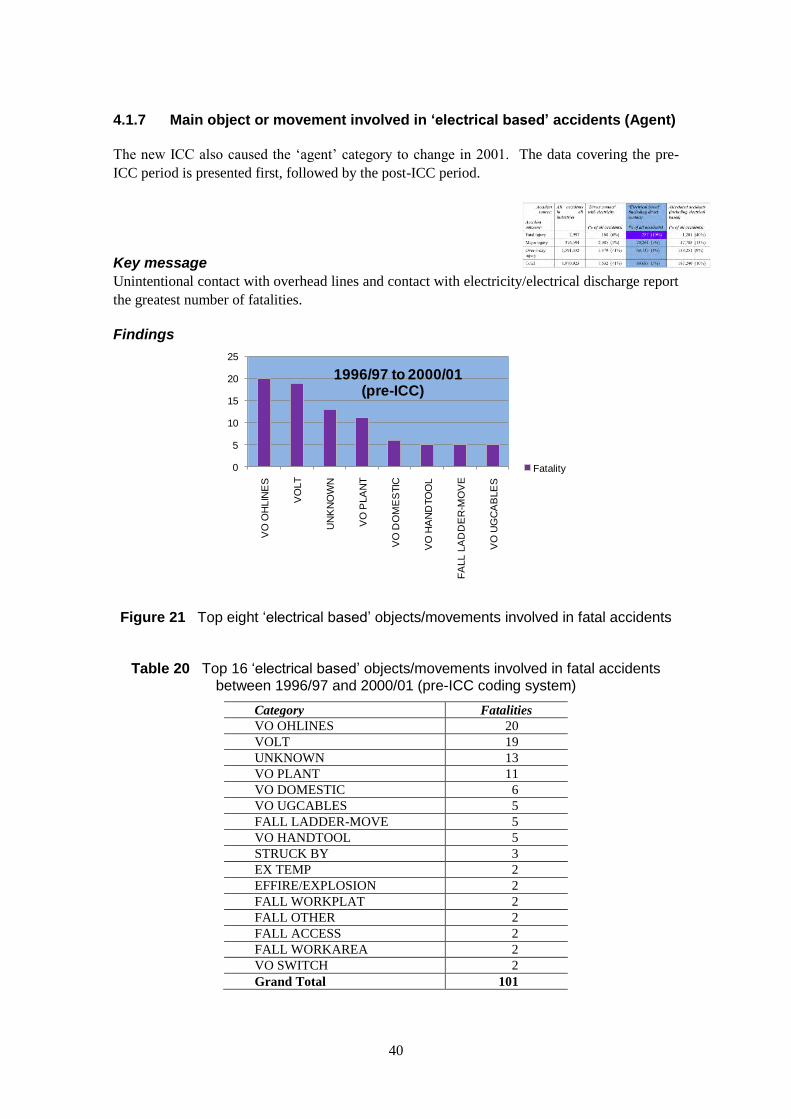
Main object or movement involved in ‘electrical based’ accidents (Agent)
The new ICC also caused the ‘agent’ category to change in 2001. The data covering the pre-
ICC period is presented first, followed by the post-ICC period.
Unintentional contact with overhead lines and contact with electricity/electrical discharge report
the greatest number of fatalities.
0
5
10
15
20
25
VO
OH
LIN
ES
VO
LT
UN
KN
OW
N
VO
PLA
NT
VO
DO
ME
STIC
VO
HA
ND
TO
OL
FA
LL L
AD
DE
R-M
OV
E
VO
UG
CA
BLE
S
Fatality
1996/97 to 2000/01 (pre-ICC)
4.1.7
Key message
Findings
Figure 21 Top eight „electrical based‟ objects/movements involved in fatal accidents
Table 20 Top 16 „electrical based‟ objects/movements involved in fatal accidents between 1996/97 and 2000/01 (pre-ICC coding system)
Category Fatalities
VO OHLINES 20
VOLT 19
UNKNOWN 13
VO PLANT 11
VO DOMESTIC 6
VO UGCABLES 5
FALL LADDER-MOVE 5
VO HANDTOOL 5
STRUCK BY 3
EX TEMP 2
EFFIRE/EXPLOSION 2
FALL WORKPLAT 2
FALL OTHER 2
FALL ACCESS 2
FALL WORKAREA 2
VO SWITCH 2
Grand Total 101
40

Figure 21 and Table 20 show that ‘Vo ohlines’ (overhead lines - unintentional contact) and
‘Volt’ (contact with electricity or electrical discharge) have reported 20 and 19 fatalities
respectively.
‘Vo plant’ (industrial plant, vessels or equipment) additionally reports a high level of fatalities
(11).
In order to present the data succinctly, the table only shows main objects/movements that have
reported two or more ‘electrical based’ fatalities.
41
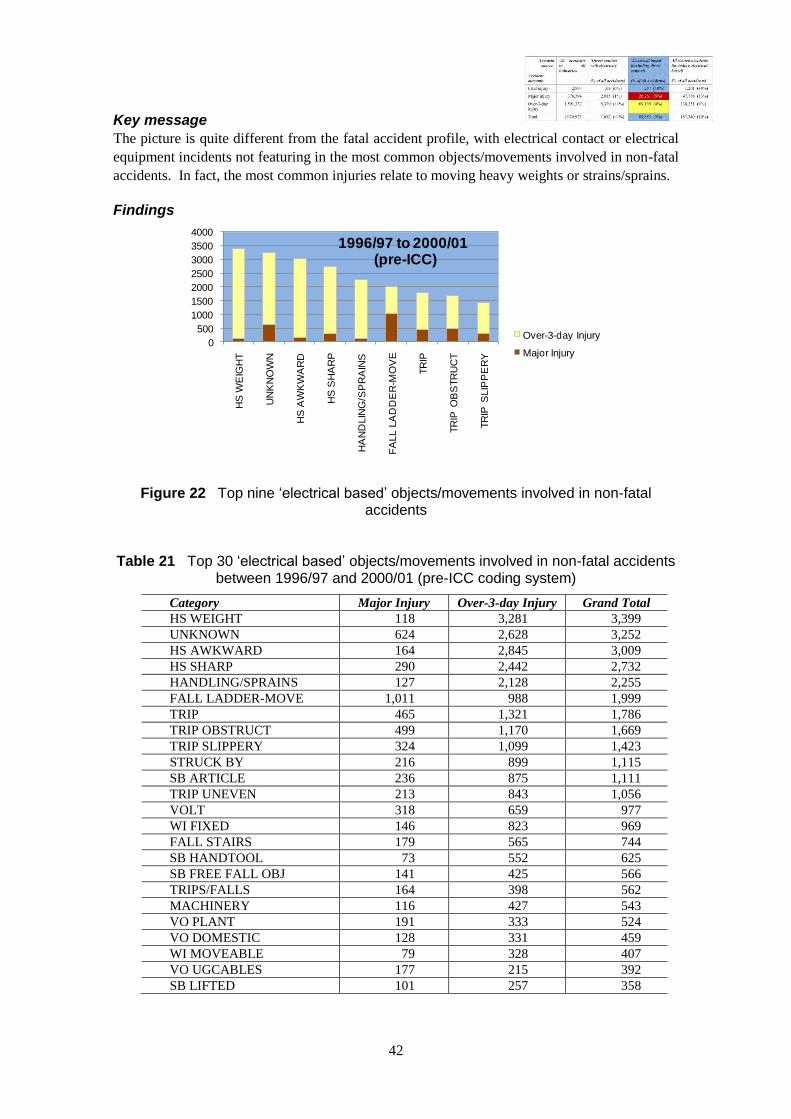
Key message
The picture is quite different from the fatal accident profile, with electrical contact or electrical
equipment incidents not featuring in the most common objects/movements involved in non-fatal
In fact, the most common injuries relate to moving heavy weights or strains/sprains.
0
500
1000
1500
2000
2500
3000
3500
4000H
S W
EIG
HT
UN
KN
OW
N
HS
AW
KW
AR
D
HS
SH
AR
P
HA
ND
LIN
G/S
PR
AIN
S
FA
LL L
AD
DE
R-M
OV
E
TR
IP
TR
IP O
BS
TR
UC
T
TR
IP S
LIP
PE
RY
Over-3-day Injury
Major Injury
1996/97 to 2000/01(pre-ICC)
accidents.
Findings
Figure 22 Top nine „electrical based‟ objects/movements involved in non-fatal accidents
Table 21 Top 30 „electrical based‟ objects/movements involved in non-fatal accidents between 1996/97 and 2000/01 (pre-ICC coding system)
Category Major Injury Over-3-day Injury Grand Total
HS WEIGHT 118 3,281 3,399
UNKNOWN 624 2,628 3,252
HS AWKWARD 164 2,845 3,009
HS SHARP 290 2,442 2,732
HANDLING/SPRAINS 127 2,128 2,255
FALL LADDER-MOVE 1,011 988 1,999
TRIP 465 1,321 1,786
TRIP OBSTRUCT 499 1,170 1,669
TRIP SLIPPERY 324 1,099 1,423
STRUCK BY 216 899 1,115
SB ARTICLE 236 875 1,111
TRIP UNEVEN 213 843 1,056
VOLT 318 659 977
WI FIXED 146 823 969
FALL STAIRS 179 565 744
SB HANDTOOL 73 552 625
SB FREE FALL OBJ 141 425 566
TRIPS/FALLS 164 398 562
MACHINERY 116 427 543
VO PLANT 191 333 524
VO DOMESTIC 128 331 459
WI MOVEABLE 79 328 407
VO UGCABLES 177 215 392
SB LIFTED 101 257 358
42
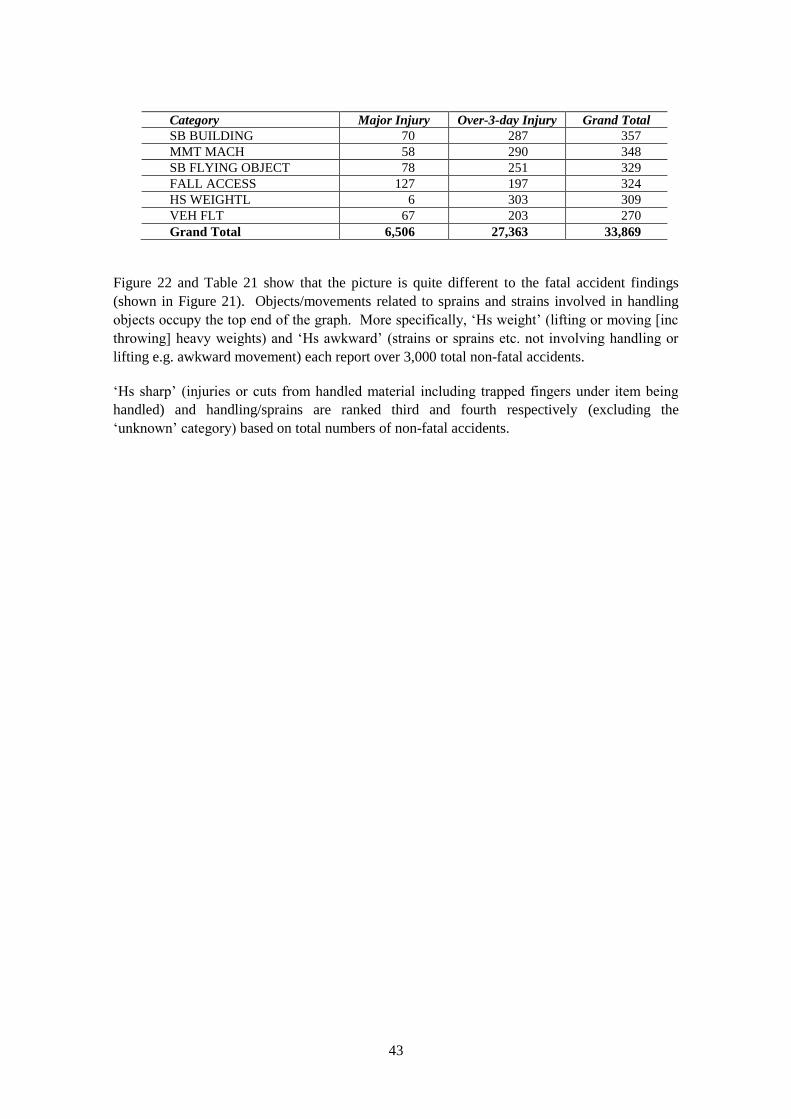
Category Major Injury Over-3-day Injury Grand Total
SB BUILDING 70 287 357
MMT MACH 58 290 348
SB FLYING OBJECT 78 251 329
FALL ACCESS 127 197 324
HS WEIGHTL 6 303 309
VEH FLT 67 203 270
Grand Total 6,506 27,363 33,869
Figure 22 and Table 21 show that the picture is quite different to the fatal accident findings
(shown in Figure 21). Objects/movements related to sprains and strains involved in handling
objects occupy the top end of the graph. More specifically, ‘Hs weight’ (lifting or moving [inc
throwing] heavy weights) and ‘Hs awkward’ (strains or sprains etc. not involving handling or
lifting e.g. awkward movement) each report over 3,000 total non-fatal accidents.
‘Hs sharp’ (injuries or cuts from handled material including trapped fingers under item being
handled) and handling/sprains are ranked third and fourth respectively (excluding the
‘unknown’ category) based on total numbers of non-fatal accidents.
43
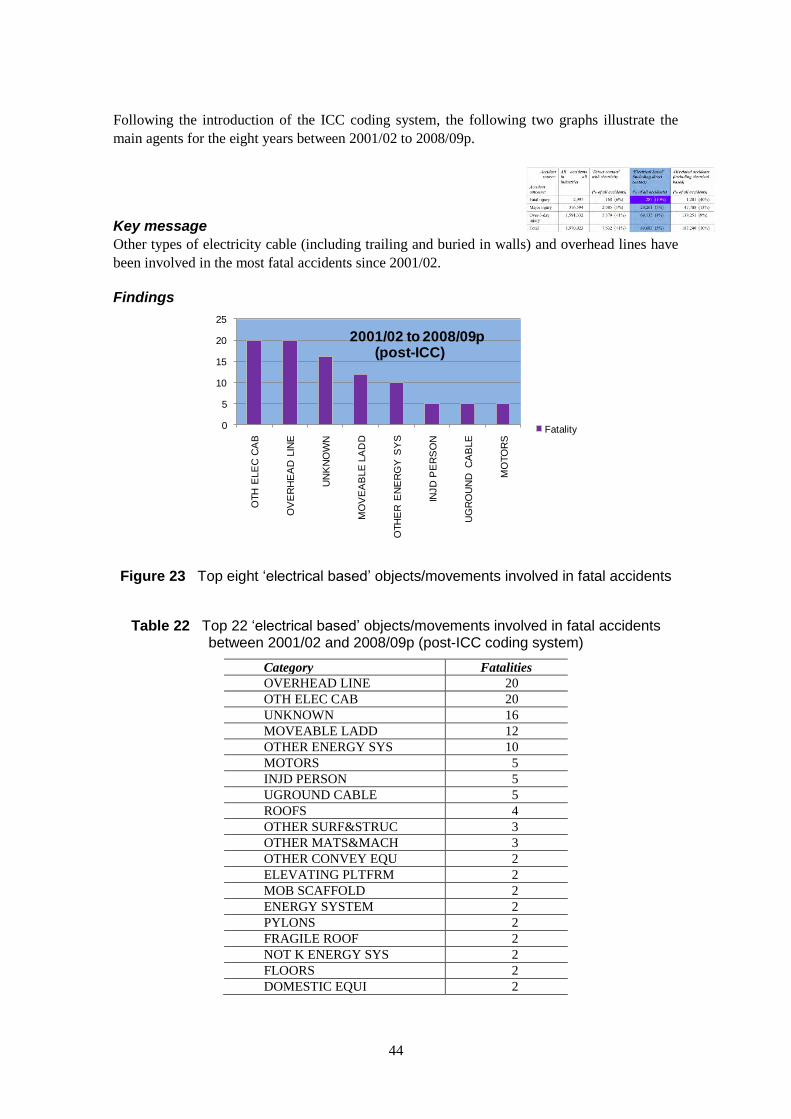
Following the introduction of the ICC coding system, the following two graphs illustrate the
main agents for the eight years between 2001/02 to 2008/09p.
Key message
Other types of electricity cable (including trailing and buried in walls) and overhead lines have
been involved in the most fatal accidents since 2001/02.
0
5
10
15
20
25
OTH
ELE
C C
AB
OV
ER
HE
AD
LIN
E
UN
KN
OW
N
MO
VE
AB
LE
LA
DD
OTH
ER
EN
ER
GY
SY
S
INJD
PE
RS
ON
UG
RO
UN
D C
AB
LE
MO
TO
RS
Fatality
2001/02 to 2008/09p(post-ICC)
Findings
Figure 23 Top eight „electrical based‟ objects/movements involved in fatal accidents
Table 22 Top 22 „electrical based‟ objects/movements involved in fatal accidents between 2001/02 and 2008/09p (post-ICC coding system)
Category Fatalities
OVERHEAD LINE 20
OTH ELEC CAB 20
UNKNOWN 16
MOVEABLE LADD 12
OTHER ENERGY SYS 10
MOTORS 5
INJD PERSON 5
UGROUND CABLE 5
ROOFS 4
OTHER SURF&STRUC 3
OTHER MATS&MACH 3
OTHER CONVEY EQU 2
ELEVATING PLTFRM 2
MOB SCAFFOLD 2
ENERGY SYSTEM 2
PYLONS 2
FRAGILE ROOF 2
NOT K ENERGY SYS 2
FLOORS 2
DOMESTIC EQUI 2
44
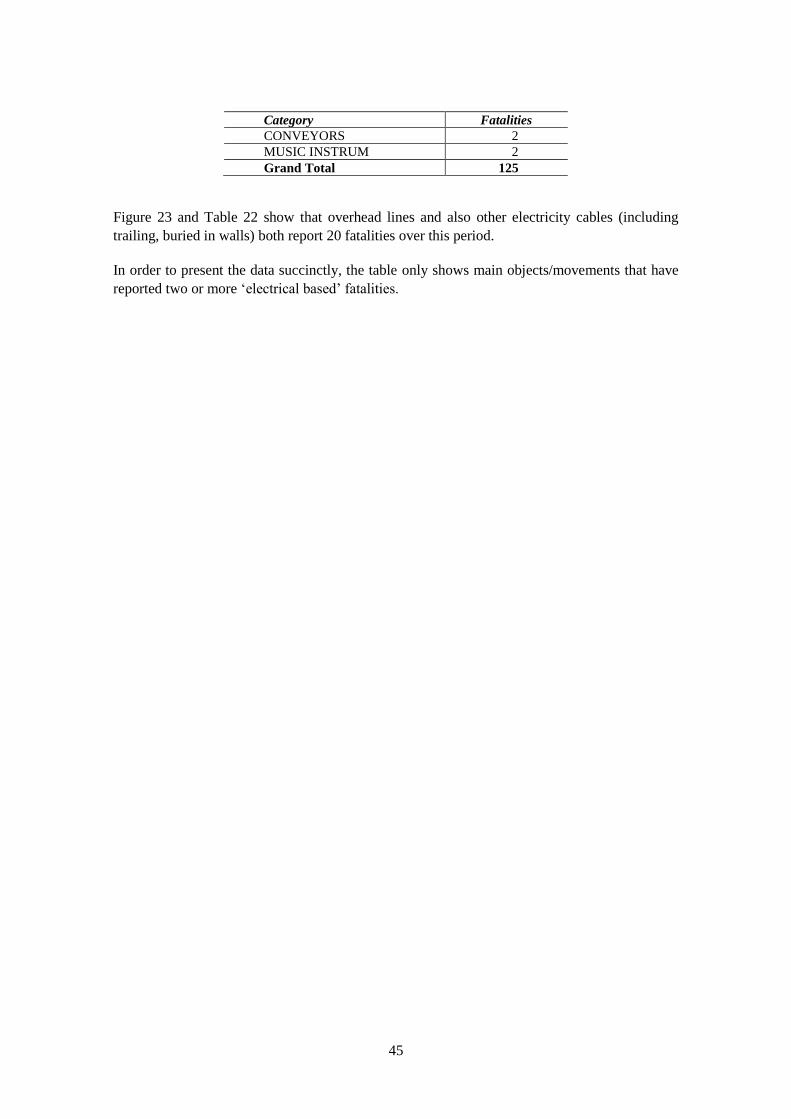
Category Fatalities
CONVEYORS 2
MUSIC INSTRUM 2
Grand Total 125
Figure 23 and Table 22 show that overhead lines and also other electricity cables (including
trailing, buried in walls) both report 20 fatalities over this period.
In order to present the data succinctly, the table only shows main objects/movements that have
reported two or more ‘electrical based’ fatalities.
45
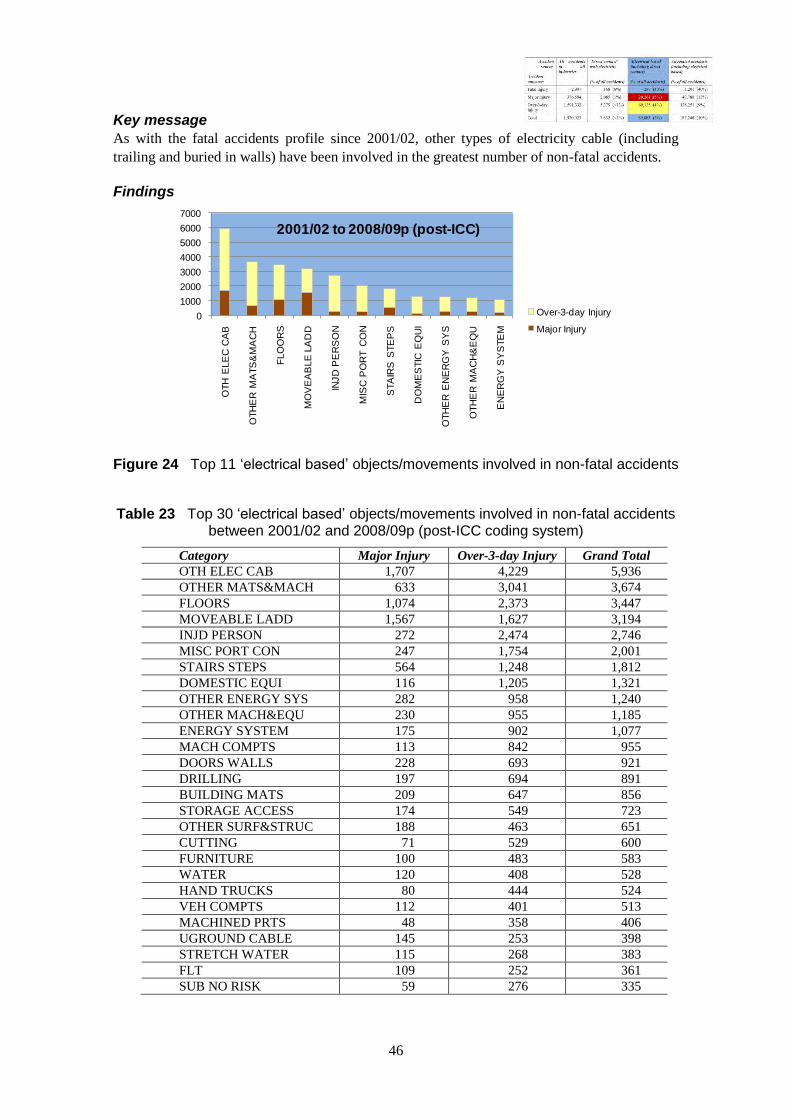
Key message
As with the fatal accidents profile since 2001/02, other types of electricity cable (including
trailing and buried in walls) have been involved in the greatest number of non-fatal accidents.
Findings
0
1000
2000
3000
4000
5000
6000
7000O
TH
ELE
C C
AB
OTH
ER
MA
TS
&M
AC
H
FLO
OR
S
MO
VE
AB
LE
LA
DD
INJD
PE
RS
ON
MIS
C P
OR
T C
ON
STA
IRS
STE
PS
DO
ME
STIC
EQ
UI
OTH
ER
EN
ER
GY
SY
S
OTH
ER
MA
CH
&E
QU
EN
ER
GY
SY
STE
M
Over-3-day Injury
Major Injury
2001/02 to 2008/09p (post-ICC)
Figure 24 Top 11 „electrical based‟ objects/movements involved in non-fatal accidents
Table 23 Top 30 „electrical based‟ objects/movements involved in non-fatal accidents between 2001/02 and 2008/09p (post-ICC coding system)
Category Major Injury Over-3-day Injury Grand Total
OTH ELEC CAB 1,707 4,229 5,936
OTHER MATS&MACH 633 3,041 3,674
FLOORS 1,074 2,373 3,447
MOVEABLE LADD 1,567 1,627 3,194
INJD PERSON 272 2,474 2,746
MISC PORT CON 247 1,754 2,001
STAIRS STEPS 564 1,248 1,812
DOMESTIC EQUI 116 1,205 1,321
OTHER ENERGY SYS 282 958 1,240
OTHER MACH&EQU 230 955 1,185
ENERGY SYSTEM 175 902 1,077
MACH COMPTS 113 842 955
DOORS WALLS 228 693 921
DRILLING 197 694 891
BUILDING MATS 209 647 856
STORAGE ACCESS 174 549 723
OTHER SURF&STRUC 188 463 651
CUTTING 71 529 600
FURNITURE 100 483 583
WATER 120 408 528
HAND TRUCKS 80 444 524
VEH COMPTS 112 401 513
MACHINED PRTS 48 358 406
UGROUND CABLE 145 253 398
STRETCH WATER 115 268 383
FLT 109 252 361
SUB NO RISK 59 276 335
46
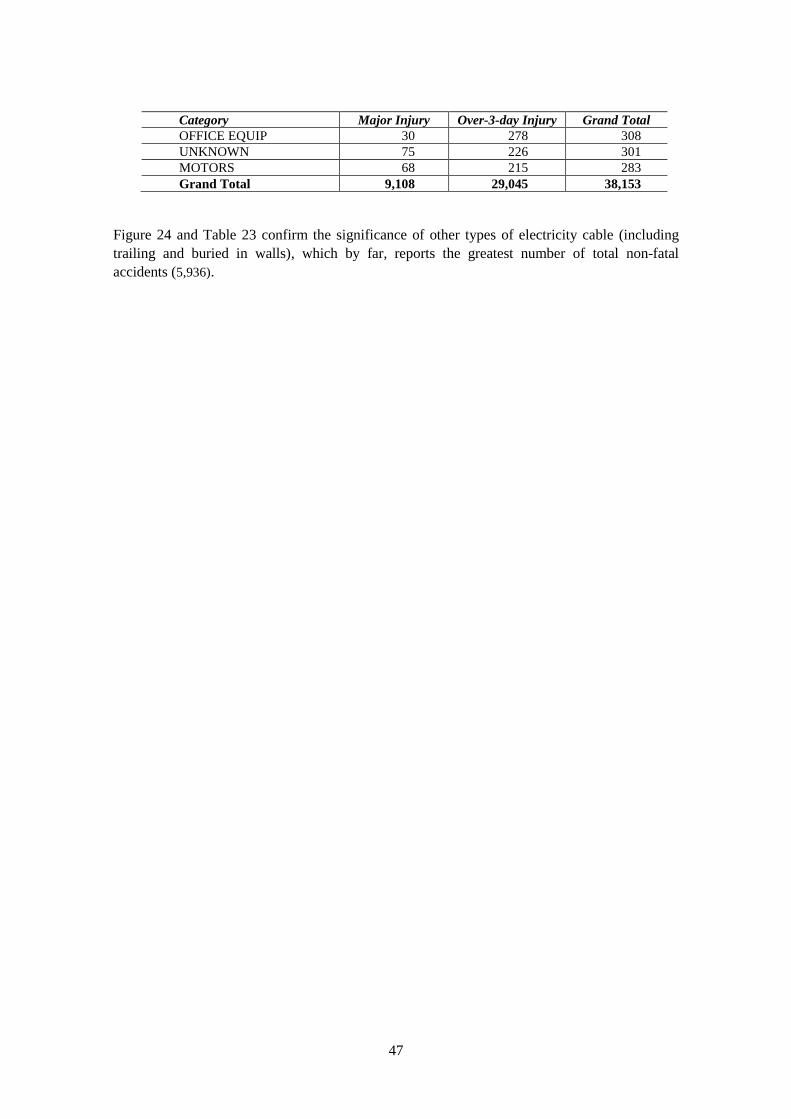
Category Major Injury Over-3-day Injury Grand Total
OFFICE EQUIP 30 278 308
UNKNOWN 75 226 301
MOTORS 68 215 283
Grand Total 9,108 29,045 38,153
Figure 24 and Table 23 confirm the significance of other types of electricity cable (including
trailing and buried in walls), which by far, reports the greatest number of total non-fatal
accidents (5,936).
47
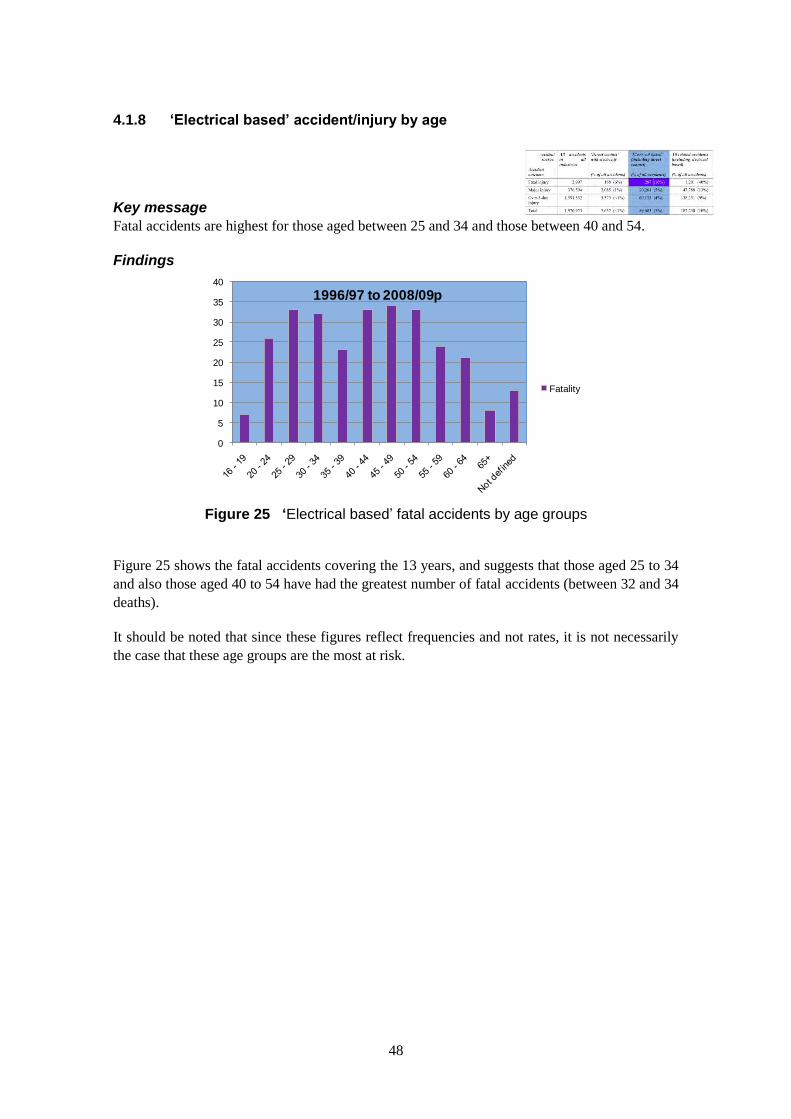
4.1.8 ‘Electrical based’ accident/injury by age
Key message
Fatal accidents are highest for those aged between 25 and 34 and those between 40 and 54.
Findings
0
5
10
15
20
25
30
35
40
Fatality
1996/97 to 2008/09p
Figure 25 ‘Electrical based‟ fatal accidents by age groups
Figure 25 shows the fatal accidents covering the 13 years, and suggests that those aged 25 to 34 and also those aged 40 to 54 have had the greatest number of fatal accidents (between 32 and 34 deaths).
It should be noted that since these figures reflect frequencies and not rates, it is not necessarily
the case that these age groups are the most at risk.
48
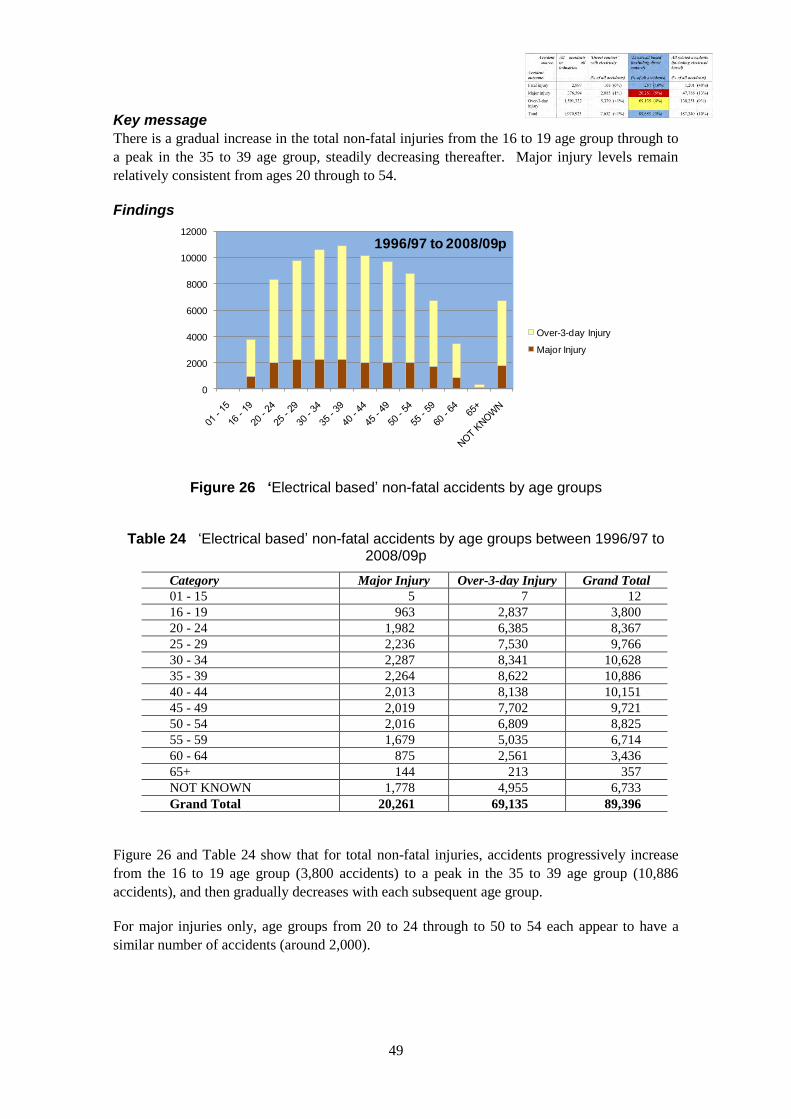
Key message
There is a gradual increase in the total non-fatal injuries from the 16 to 19 age group through to
a peak in the 35 to 39 age group, steadily decreasing thereafter. Major injury levels remain
relatively consistent from ages 20 through to 54.
Findings
0
2000
4000
6000
8000
10000
12000
Over-3-day Injury
Major Injury
1996/97 to 2008/09p
Figure 26 ‘Electrical based‟ non-fatal accidents by age groups
Table 24 „Electrical based‟ non-fatal accidents by age groups between 1996/97 to 2008/09p
Category Major Injury Over-3-day Injury Grand Total
01 - 15 5 7 12
16 - 19 963 2,837 3,800
20 - 24 1,982 6,385 8,367
25 - 29 2,236 7,530 9,766
30 - 34 2,287 8,341 10,628
35 - 39 2,264 8,622 10,886
40 - 44 2,013 8,138 10,151
45 - 49 2,019 7,702 9,721
50 - 54 2,016 6,809 8,825
55 - 59 1,679 5,035 6,714
60 - 64 875 2,561 3,436
65+ 144 213 357
NOT KNOWN 1,778 4,955 6,733
Grand Total 20,261 69,135 89,396
Figure 26 and Table 24 show that for total non-fatal injuries, accidents progressively increase
from the 16 to 19 age group (3,800 accidents) to a peak in the 35 to 39 age group (10,886
accidents), and then gradually decreases with each subsequent age group.
For major injuries only, age groups from 20 to 24 through to 50 to 54 each appear to have a
similar number of accidents (around 2,000).
49
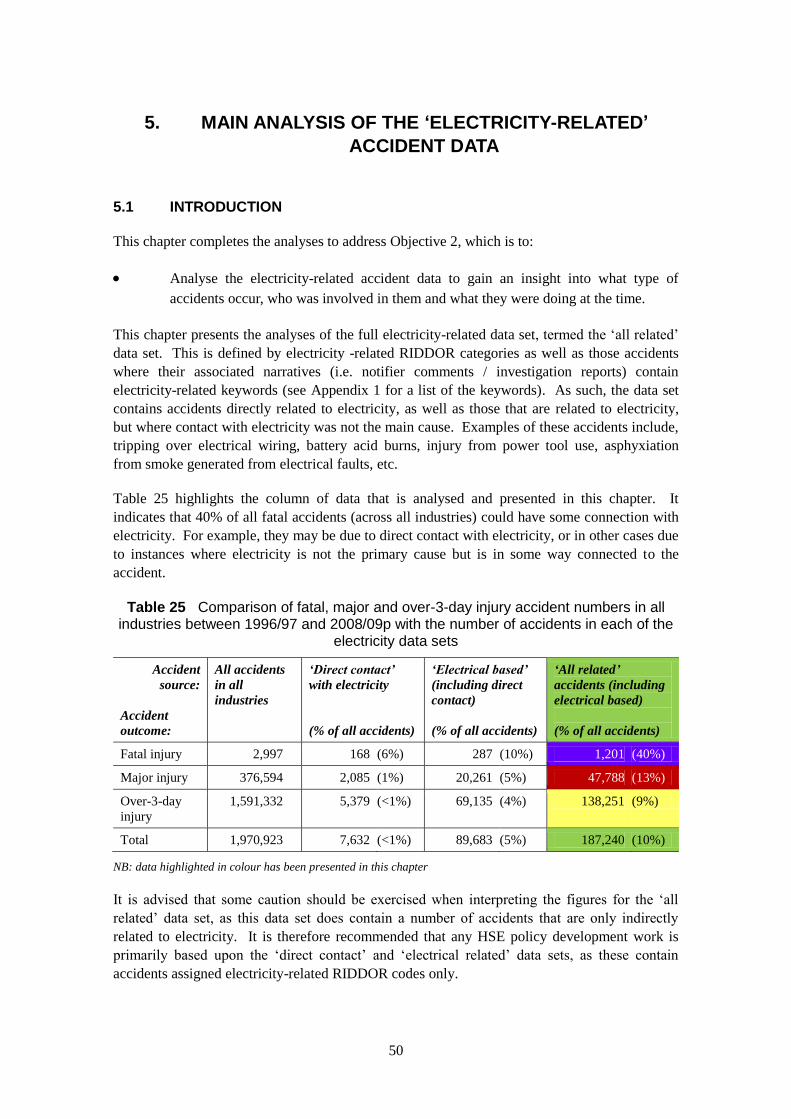
5. MAIN ANALYSIS OF THE ‘ELECTRICITY-RELATED’
ACCIDENT DATA
5.1 INTRODUCTION
This chapter completes the analyses to address Objective 2, which is to:
Analyse the electricity-related accident data to gain an insight into what type of
accidents occur, who was involved in them and what they were doing at the time.
This chapter presents the analyses of the full electricity-related data set, termed the ‘all related’
data set. This is defined by electricity -related RIDDOR categories as well as those accidents
where their associated narratives (i.e. notifier comments / investigation reports) contain
electricity-related keywords (see Appendix 1 for a list of the keywords). As such, the data set
contains accidents directly related to electricity, as well as those that are related to electricity,
but where contact with electricity was not the main cause. Examples of these accidents include,
tripping over electrical wiring, battery acid burns, injury from power tool use, asphyxiation
from smoke generated from electrical faults, etc.
Table 25 highlights the column of data that is analysed and presented in this chapter. It
indicates that 40% of all fatal accidents (across all industries) could have some connection with
electricity. For example, they may be due to direct contact with electricity, or in other cases due
to instances where electricity is not the primary cause but is in some way connected to the
accident.
Table 25 Comparison of fatal, major and over-3-day injury accident numbers in all industries between 1996/97 and 2008/09p with the number of accidents in each of the
electricity data sets
Accident
source:
Accident
outcome:
All accidents
in all
industries
‘Direct contact’
with electricity
(% of all accidents)
‘Electrical based’
(including direct
contact)
(% of all accidents)
‘All related’
accidents (including
electrical based)
(% of all accidents)
Fatal injury 2,997 168 (6%) 287 (10%) 1,201 40%) (
Major injury 376,594 2,085 (1%) 20,261 (5%) 47,788 13%) (
Over-3-day
injury
1,591,332 5,379 (<1%) 69,135 (4%) 138,251 (9%)
Total 1,970,923 7,632 (<1%) 89,683 (5%) 187,240 10%) (
NB: data highlighted in colour has been presented in this chapter
It is advised that some caution should be exercised when interpreting the figures for the ‘all
related’ data set, as this data set does contain a number of accidents that are only indirectly
related to electricity. It is therefore recommended that any HSE policy development work is
primarily based upon the ‘directcontact’ and ‘electrical related’ data sets, as these contain accidents assigned electricity-related RIDDOR codes only.
50

Yearly trends in ‘all related’ accidents (HSE year)
Key message
A fluctuating picture in the fatal accident levels, with a peak occurring in 2007/08, although
accidents do provisionally decrease dramatically in the following year.
Findings
0
20
40
60
80
100
120
140
160
96/97 97/98 98/99 99/00 00/01 01/02 02/03 03/04 04/05 05/06 06/07 07/08 08/09P
Fatality
1996/97 to 2008/09p
5.1.1
Figure 27 „All related‟ fatal accidents
Table 26 „All related‟ fatal accidents between 1996/97 and 2008/09p
HSE year Fatalities
96/97 78
97/98 102
98/99 101
99/00 89
00/01 113
01/02 110
02/03 77
03/04 90
04/05 84
05/06 76
06/07 117
07/08 136
08/09P 28
Grand Total 1,201
Figure 27 and Table 26 show that the pattern of fatalities has fluctuated from year to year. It is
important to note that the time from 1996/97 to 2000/01 should not be directly compared to the
time from 2001/02 to 2008/09p. This is due to the introduction of notifier comments in 2001,
which required the notifier to describe the accident. As the ‘all related’ data set contains
accidents with an electricity related keyword in their notifier comment, it is expected that from
51

2001/02 the ‘all related’ accident data set would contain more accidents due to the introduction
of notifier comments.
From 2001/02 onwards, it can be reliably deduced that fatal accident numbers do fluctuate, and
reach a peak in 2007/08 (136) but then dramatically fall in 2008/09p. However, it should be
viewed with caution given that the figures for 2008/09 have yet to be finalised by HSE.
52
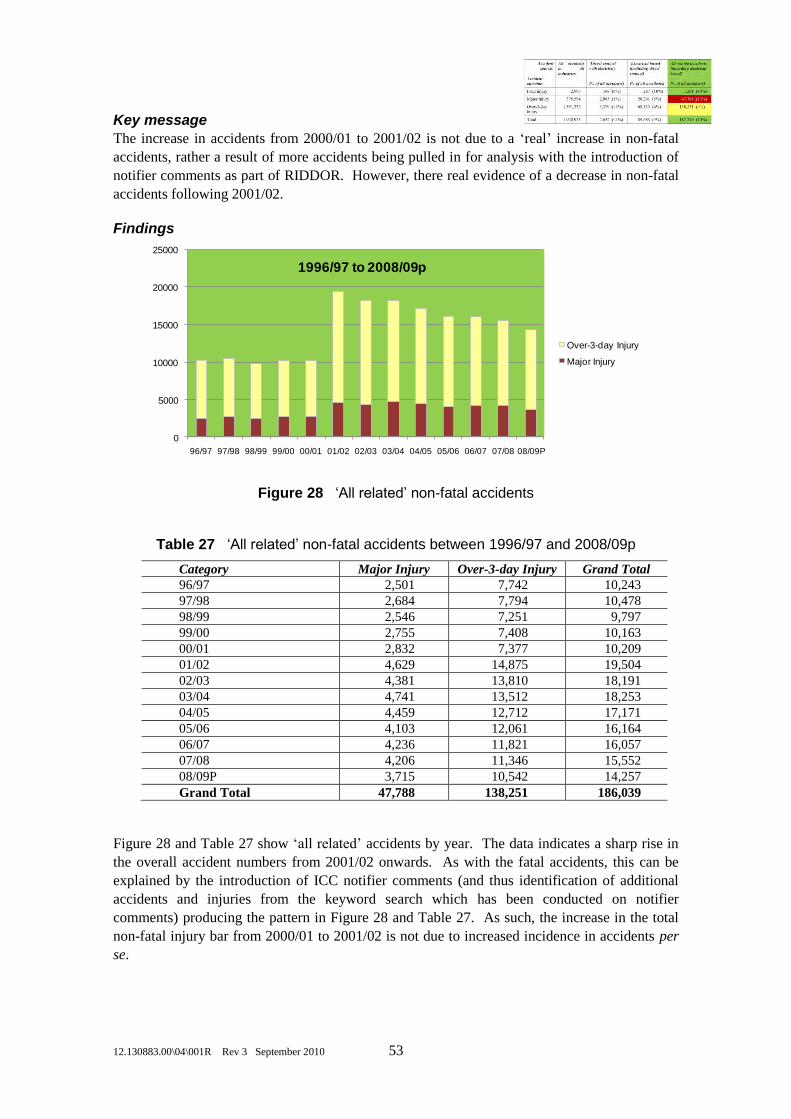
Key message
The increase in accidents from 2000/01 to 2001/02 is not due to a real increase in non-fatal
accidents, rather a result of more accidents being pulled in for analysis with the introduction of
notifier comments as part of RIDDOR. However, there real evidence of a decrease in non-fatal
accidents following 2001/02.
Findings
0
5000
10000
15000
20000
25000
96/97 97/98 98/99 99/00 00/01 01/02 02/03 03/04 04/05 05/06 06/07 07/08 08/09P
Over-3-day Injury
Major Injury
1996/97 to 2008/09p
‘ ’
Figure 28 „All related‟ non-fatal accidents
Table 27 „All related‟ non-fatal accidents between 1996/97 and 2008/09p
Category Major Injury Over-3-day Injury Grand Total
96/97 2,501 7,742 10,243
97/98 2,684 7,794 10,478
98/99 2,546 7,251 9,797
99/00 2,755 7,408 10,163
00/01 2,832 7,377 10,209
01/02 4,629 14,875 19,504
02/03 4,381 13,810 18,191
03/04 4,741 13,512 18,253
04/05 4,459 12,712 17,171
05/06 4,103 12,061 16,164
06/07 4,236 11,821 16,057
07/08 4,206 11,346 15,552
08/09P 3,715 10,542 14,257
Grand Total 47,788 138,251 186,039
Figure 28 and Table 27 show ‘all related’ accidents by year. The data indicates a sharp rise in
the overall accident numbers from 2001/02 onwards. As with the fatal accidents, this can be
explained by the introduction of ICC notifier comments (and thus identification of additional
accidents and injuries from the keyword search which has been conducted on notifier
comments) producing the pattern in Figure 28 and Table 27. As such, the increase in the total
non-fatal injury bar from 2000/01 to 2001/02 is not due to increased incidence in accidents per
se.
12.130883.00\04\001R Rev 3 September 2010 53

2001/02 the ‘all related’ accident data set would contain more accidents due to the introduction
of notifier comments.
From 2001/02 onwards, it can be reliably deduced that fatal accident numbers do fluctuate, and
reach a peak in 2007/08 (136) but then dramatically fall in 2008/09p. However, it should be
viewed with caution given that the figures for 2008/09 have yet to be finalised by HSE.
52
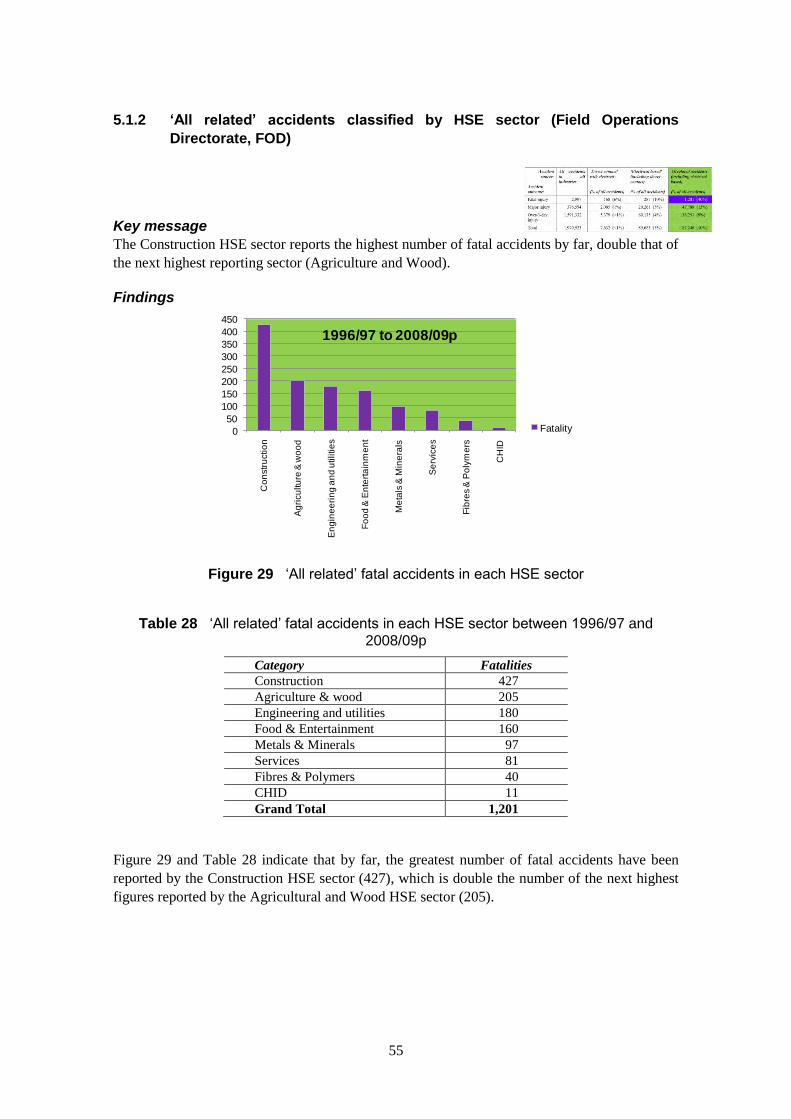
related’ accidents classified by HSE sector (Field Operations
Directorate, FOD)
The Construction HSE sector reports the highest number of fatal accidents by far, double that of
the next highest reporting sector (Agriculture and Wood).
0
50
100
150
200
250
300
350
400
450
Co
nstr
uctio
n
Ag
ricu
ltu
re &
wo
od
En
gin
ee
rin
g a
nd
utilitie
s
Fo
od
& E
nte
rta
inm
en
t
Me
tals
& M
ine
rals
Se
rvic
es
Fib
res &
Po
lym
ers
CH
ID
Fatality
1996/97 to 2008/09p
5.1.2 ‘All
Key message
Findings
Figure 29 „All related‟ fatal accidents in each HSE sector
Table 28 „All related‟ fatal accidents in each HSE sector between 1996/97 and 2008/09p
Category Fatalities
Construction 427
Agriculture & wood 205
Engineering and utilities 180
Food & Entertainment 160
Metals & Minerals 97
Services 81
Fibres & Polymers 40
CHID 11
Grand Total 1,201
Figure 29 and Table 28 indicate that by far, the greatest number of fatal accidents have been
reported by the Construction HSE sector (427), which is double the number of the next highest
figures reported by the Agricultural and Wood HSE sector (205).
55

Key message
Engineering and Utilities HSE sector reports the highest total number of non-fatal
However, it is the Construction HSE sector that reports the highest levels of major
injury accidents.
0
10000
20000
30000
40000
50000
60000
70000
En
gin
ee
rin
g a
nd
utilitie
s
Fo
od
& E
nte
rta
inm
en
t
Co
nstr
uctio
n
Se
rvic
es
Fib
res &
Po
lym
ers
Me
tals
& M
ine
rals
Ag
ricu
ltu
re &
wo
od
CH
ID
Over-3-day Injury
Major Injury
1996/97 to 2008/09p
The
accidents.
Findings
Figure 30 „All related‟ non-fatal accidents in each HSE sector
Table 29 „All related‟ non-fatal accidents in each HSE sector between 1996/97 and 2008/09p
Category Major Injury Over-3-day Injury Grand Total
Engineering and utilities 11,854 45,799 57,653
Food & Entertainment 10,586 34,368 44,954
Construction 12,448 20,108 32,556
Services 5,418 21,046 26,464
Fibres & Polymers 2,650 7,418 10,068
Metals & Minerals 2,355 5,338 7,693
Agriculture & wood 2,054 3,095 5,149
CHID 423 1,079 1,502
Grand Total 47,788 138,251 186,039
Figure 30 and Table 29 show that the Engineering and Utilities HSE sector reports the highest
total number of non-fatal accidents (57,653), followed by the Food and Entertainment HSE
sector (44,954). Both have similar numbers of major injuries.
Interestingly, the Construction HSE sector has the third highest total number of non-fatal
accidents (32,556), but has the highest number of major injuries (12,448) of any HSE sector. In
effect, 38% of all non-fatal injuries reported by this HSE sector are major injury accidents.
56
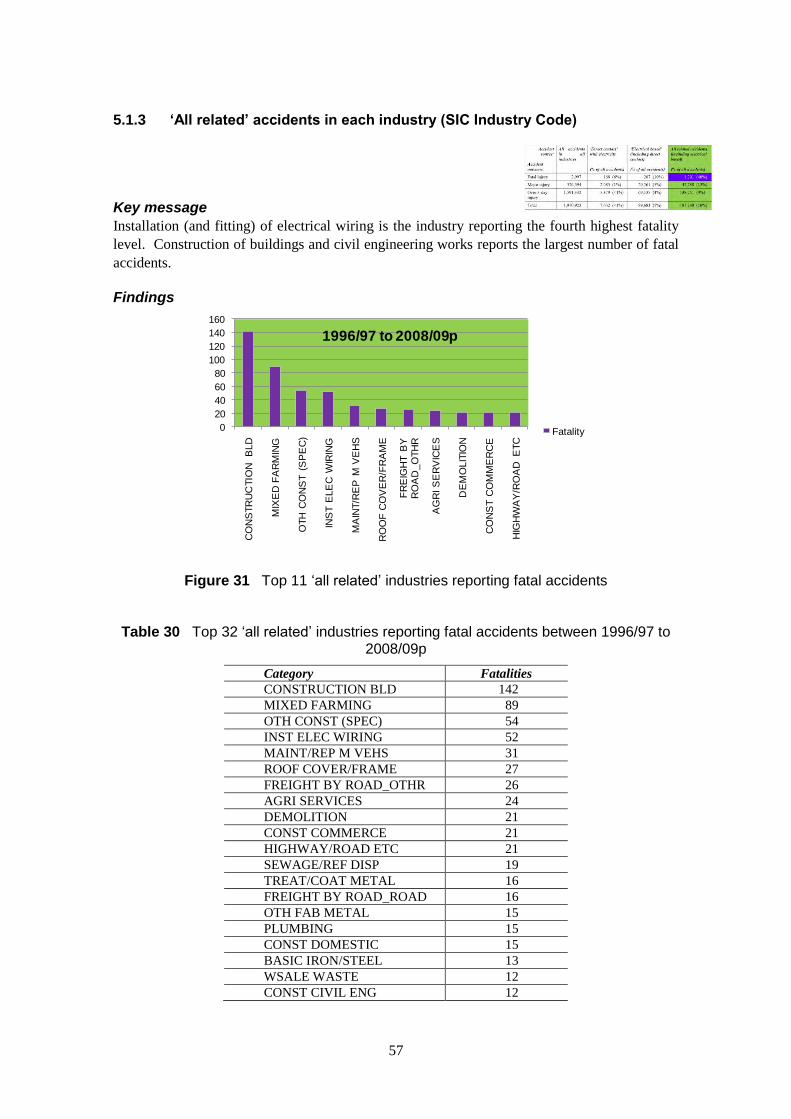
‘All related’ accidents in each industry (SIC Industry Code)
Key message
Installation (and fitting) of electrical wiring is the industry reporting the fourth highest fatality
Construction of buildings and civil engineering works reports the largest number of fatal
0
20
40
60
80
100
120
140
160
CO
NS
TR
UC
TIO
N
BLD
MIX
ED
FA
RM
ING
OTH
CO
NS
T (
SP
EC
)
INS
T E
LE
C W
IRIN
G
MA
INT/R
EP
M V
EH
S
RO
OF
CO
VE
R/F
RA
ME
FR
EIG
HT B
Y
RO
AD
_O
TH
R
AG
RI S
ER
VIC
ES
DE
MO
LIT
ION
CO
NS
T C
OM
ME
RC
E
HIG
HW
AY
/RO
AD
ETC
Fatality
1996/97 to 2008/09p
5.1.3
level.
accidents.
Findings
Figure 31 Top 11 „all related‟ industries reporting fatal accidents
Table 30 Top 32 „all related‟ industries reporting fatal accidents between 1996/97 to 2008/09p
Category Fatalities
CONSTRUCTION BLD 142
MIXED FARMING 89
OTH CONST (SPEC) 54
INST ELEC WIRING 52
MAINT/REP M VEHS 31
ROOF COVER/FRAME 27
FREIGHT BY ROAD_OTHR 26
AGRI SERVICES 24
DEMOLITION 21
CONST COMMERCE 21
HIGHWAY/ROAD ETC 21
SEWAGE/REF DISP 19
TREAT/COAT METAL 16
FREIGHT BY ROAD_ROAD 16
OTH FAB METAL 15
PLUMBING 15
CONST DOMESTIC 15
BASIC IRON/STEEL 13
WSALE WASTE 12
CONST CIVIL ENG 12
57
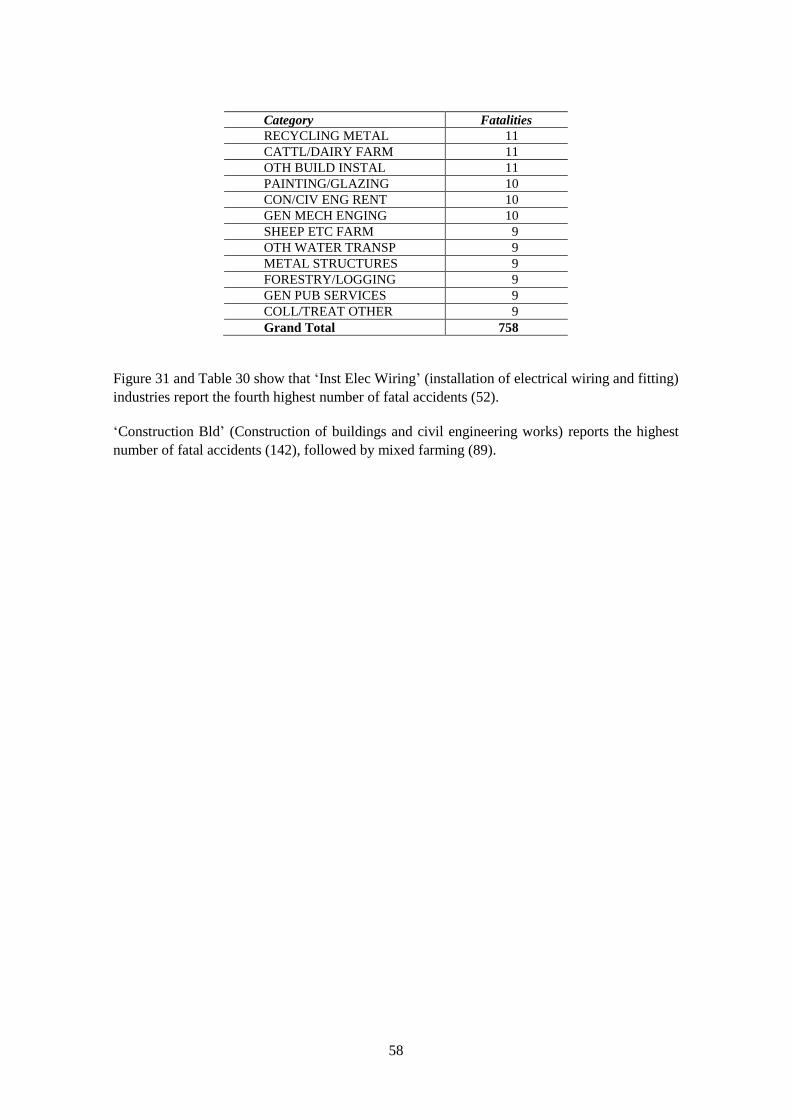
Category Fatalities
RECYCLING METAL 11
CATTL/DAIRY FARM 11
OTH BUILD INSTAL 11
PAINTING/GLAZING 10
CON/CIV ENG RENT 10
GEN MECH ENGING 10
SHEEP ETC FARM 9
OTH WATER TRANSP 9
METAL STRUCTURES 9
FORESTRY/LOGGING 9
GEN PUB SERVICES 9
COLL/TREAT OTHER 9
Grand Total 758
Figure 31 and Table 30 show that ‘Inst Elec Wiring’ (installation of electrical wiring and fitting)
industries report the fourth highest number of fatal accidents (52).
‘Construction Bld’ (Construction of buildings and civil engineering works) reports the highest
number of fatal accidents (142), followed by mixed farming (89).
58
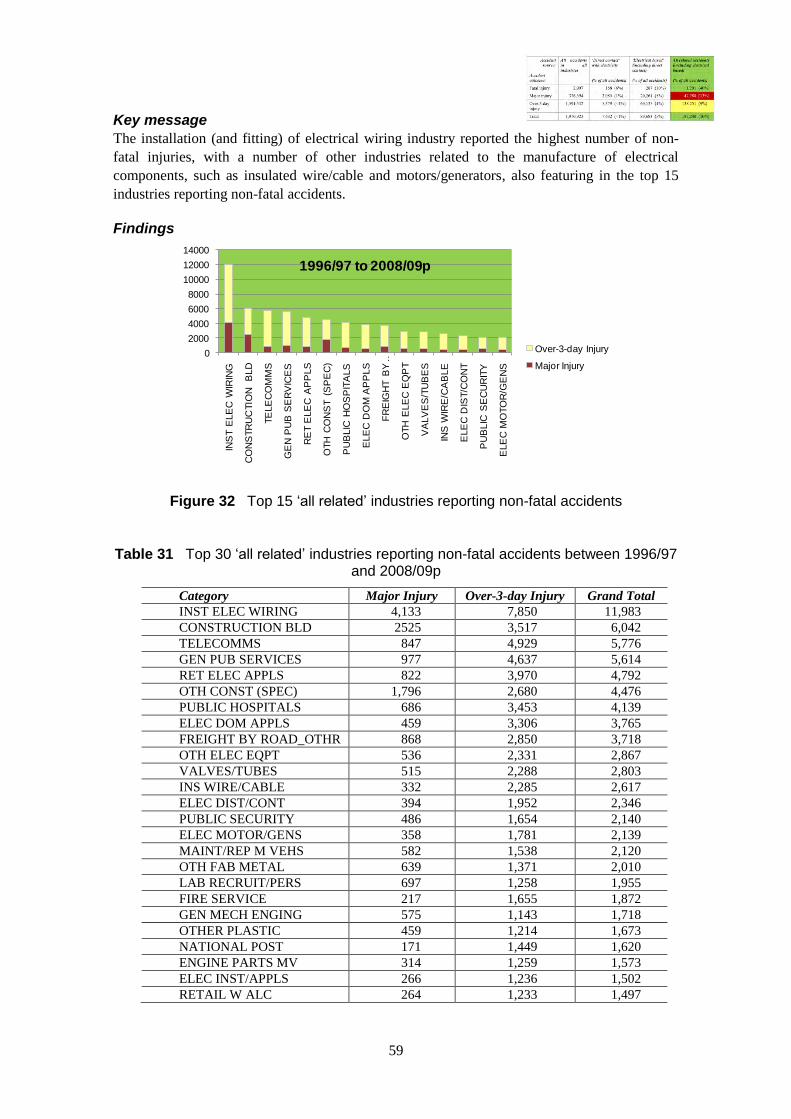
Key message
The installation (and fitting) of electrical wiring industry reported the highest number of non-
injuries, with a number of other industries related to the manufacture of electrical
components, such as insulated wire/cable and motors/generators, also featuring in the top 15
industries reporting non-fatal accidents.
Findings
0
2000
4000
6000
8000
10000
12000
14000
INS
T E
LE
C W
IRIN
G
CO
NS
TR
UC
TIO
N
BLD
TE
LE
CO
MM
S
GE
N P
UB
SE
RV
ICE
S
RE
T E
LE
C A
PP
LS
OTH
CO
NS
T (
SP
EC
)
PU
BLIC
HO
SP
ITA
LS
ELE
C D
OM
AP
PLS
FR
EIG
HT B
Y …
OTH
ELE
C E
QP
T
VA
LV
ES
/TU
BE
S
INS
WIR
E/C
AB
LE
ELE
C D
IST/C
ON
T
PU
BLIC
SE
CU
RIT
Y
ELE
C M
OTO
R/G
EN
S
Over-3-day Injury
Major Injury
1996/97 to 2008/09p
fatal
Figure 32 Top 15 „all related‟ industries reporting non-fatal accidents
Table 31 Top 30 „all related‟ industries reporting non-fatal accidents between 1996/97 and 2008/09p
Category Major Injury Over-3-day Injury Grand Total
INST ELEC WIRING 4,133 7,850 11,983
CONSTRUCTION BLD 2525 3,517 6,042
TELECOMMS 847 4,929 5,776
GEN PUB SERVICES 977 4,637 5,614
RET ELEC APPLS 822 3,970 4,792
OTH CONST (SPEC) 1,796 2,680 4,476
PUBLIC HOSPITALS 686 3,453 4,139
ELEC DOM APPLS 459 3,306 3,765
FREIGHT BY ROAD_OTHR 868 2,850 3,718
OTH ELEC EQPT 536 2,331 2,867
VALVES/TUBES 515 2,288 2,803
INS WIRE/CABLE 332 2,285 2,617
ELEC DIST/CONT 394 1,952 2,346
PUBLIC SECURITY 486 1,654 2,140
ELEC MOTOR/GENS 358 1,781 2,139
MAINT/REP M VEHS 582 1,538 2,120
OTH FAB METAL 639 1,371 2,010
LAB RECRUIT/PERS 697 1,258 1,955
FIRE SERVICE 217 1,655 1,872
GEN MECH ENGING 575 1,143 1,718
OTHER PLASTIC 459 1,214 1,673
NATIONAL POST 171 1,449 1,620
ENGINE PARTS MV 314 1,259 1,573
ELEC INST/APPLS 266 1,236 1,502
RETAIL W ALC 264 1,233 1,497
59
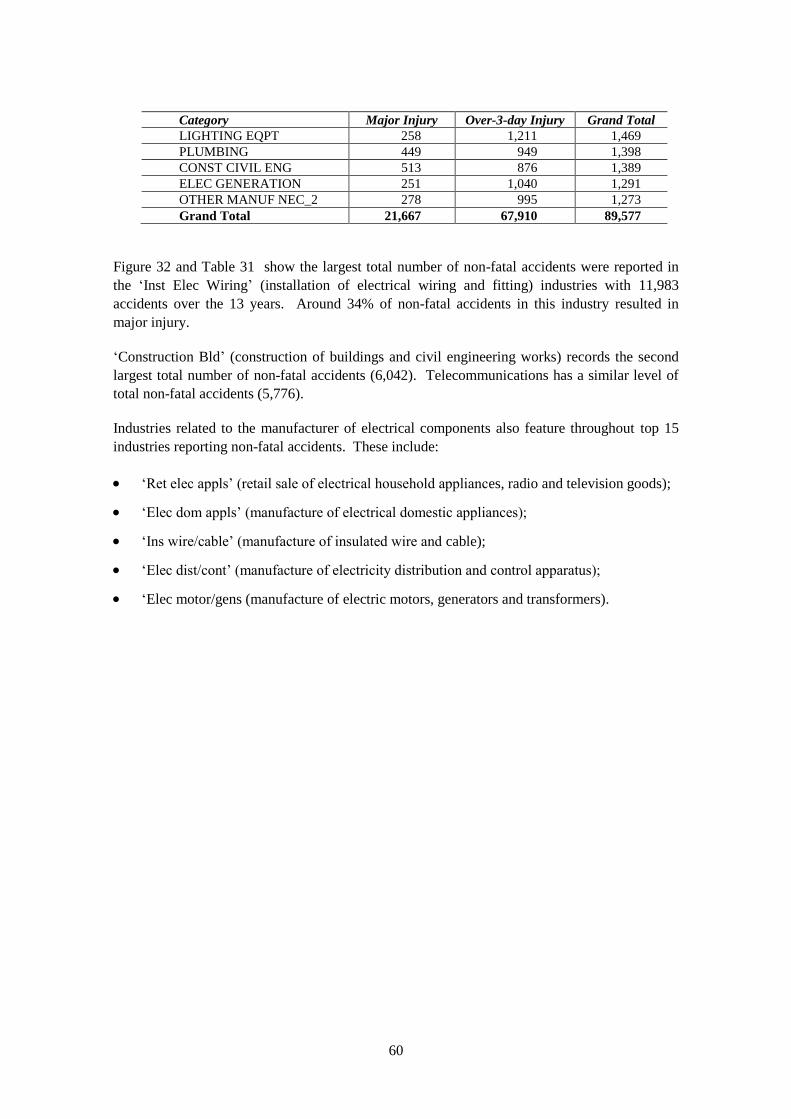
Category Major Injury Over-3-day Injury Grand Total
LIGHTING EQPT 258 1,211 1,469
PLUMBING 449 949 1,398
CONST CIVIL ENG 513 876 1,389
ELEC GENERATION 251 1,040 1,291
OTHER MANUF NEC_2 278 995 1,273
Grand Total 21,667 67,910 89,577
Figure 32 and Table 31 show the largest total number of non-fatal accidents were reported in
the ‘Inst Elec Wiring’ (installation of electrical wiring and fitting) industries with 11,983
accidents over the 13 years. Around 34% of non-fatal accidents in this industry resulted in
major injury.
‘Construction Bld’ (construction of buildings and civil engineering works) records the second
largest total number of non-fatal accidents (6,042). Telecommunications has a similar level of
total non-fatal accidents (5,776).
Industries related to the manufacturer of electrical components also feature throughout top 15
industries reporting non-fatal accidents. These include:
‘Ret elec appls’ (retail sale of electrical household appliances, radio and television goods);
‘Elec dom appls’ (manufacture of electrical domestic appliances);
‘Ins wire/cable’ (manufacture of insulated wire and cable);
‘Elec dist/cont’ (manufacture of electricity distribution and control apparatus);
‘Elec motor/gens (manufacture of electric motors, generators and transformers).
60
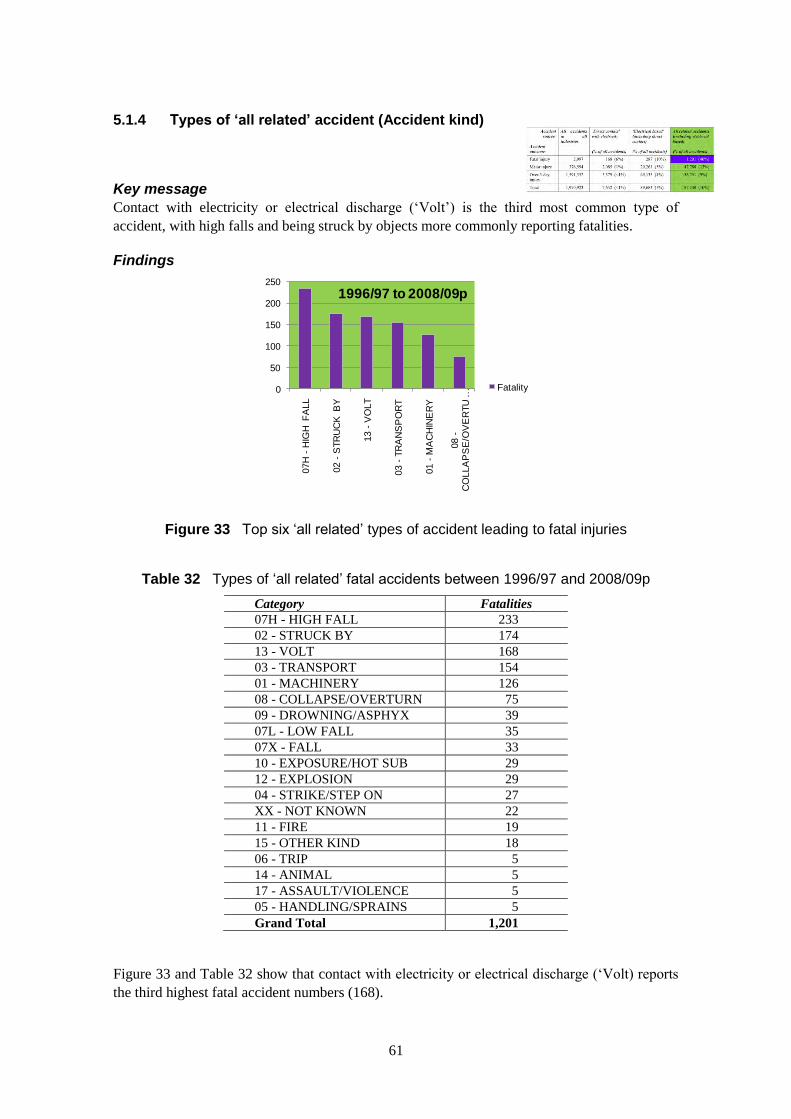
Types of ‘all related’ accident (Accident kind)
ity or electrical discharge (‘Volt’) is the third most common type of
accident, with high falls and being struck by objects more commonly reporting fatalities.
0
50
100
150
200
250
07H
-H
IGH
FA
LL
02 -
STR
UC
K B
Y
13 -
VO
LT
03 -
TR
AN
SP
OR
T
01 -
MA
CH
INE
RY
08 -
CO
LLA
PS
E/O
VE
RTU
…
Fatality
1996/97 to 2008/09p
5.1.4
Key message
Contact with electric
Findings
Figure 33 Top six „all related‟ types of accident leading to fatal injuries
Table 32 Types of „all related‟ fatal accidents between 1996/97 and 2008/09p
Category Fatalities
07H - HIGH FALL 233
02 - STRUCK BY 174
13 - VOLT 168
03 - TRANSPORT 154
01 - MACHINERY 126
08 - COLLAPSE/OVERTURN 75
09 - DROWNING/ASPHYX 39
07L - LOW FALL 35
07X - FALL 33
10 - EXPOSURE/HOT SUB 29
12 - EXPLOSION 29
04 - STRIKE/STEP ON 27
XX - NOT KNOWN 22
11 - FIRE 19
15 - OTHER KIND 18
06 - TRIP 5
14 - ANIMAL 5
17 - ASSAULT/VIOLENCE 5
05 - HANDLING/SPRAINS 5
Grand Total 1,201
Figure 33 and Table 32 show that contact with electricity or electrical discharge (‘Volt) reports
the third highest fatal accident numbers (168).
61

High falls (i.e. above 2 metres) are the type of accident reporting the highest number of fatalities
(233), followed by being struck by moving, flying or falling objects (including accidents
involving powered hand tools or accidental assault such as horseplay) (174 fatalities).
62
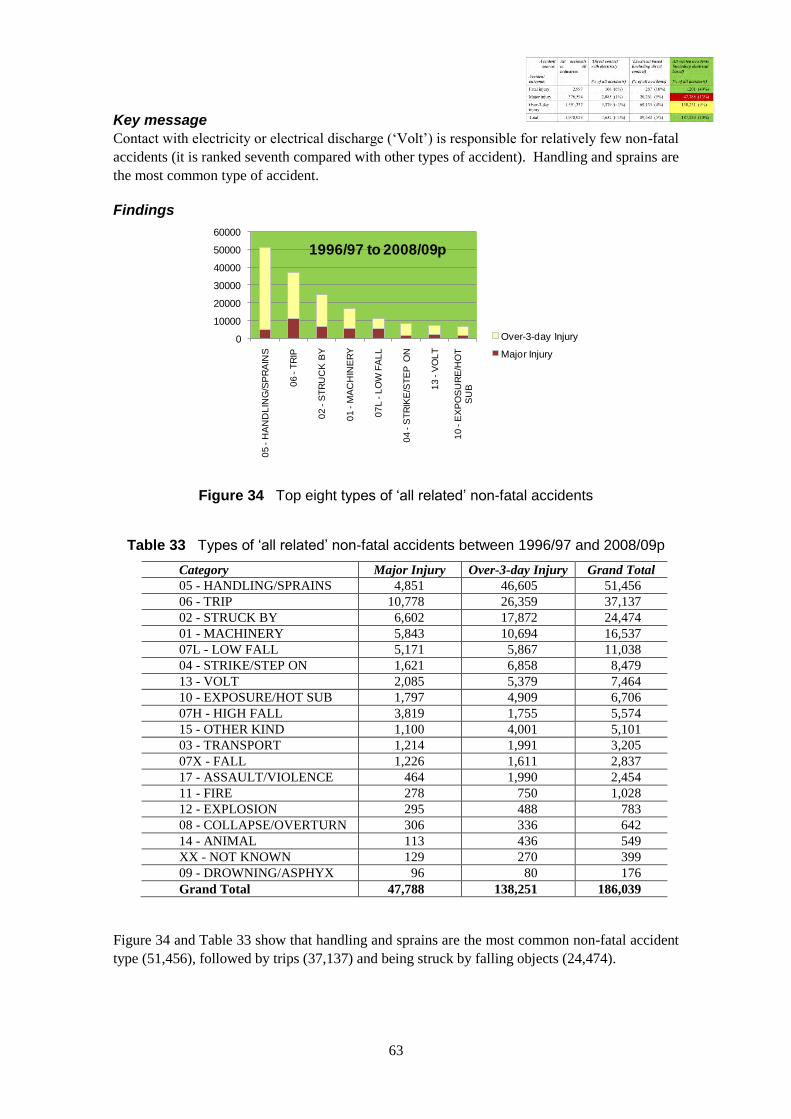
Key message
ontact with electricity or electrical discharge (‘Volt’) is responsible for relatively few non-fatal
accidents (it is ranked seventh compared with other types of accident). Handling and sprains are
the most common type of accident.
0
10000
20000
30000
40000
50000
60000
05
-H
AN
DL
ING
/SP
RA
INS
06
-T
RIP
02
-S
TR
UC
K B
Y
01
-M
AC
HIN
ER
Y
07
L -
LO
W F
AL
L
04
-S
TR
IKE
/ST
EP
ON
13
-V
OL
T
10
-E
XP
OS
UR
E/H
OT
S
UB
Over-3-day Injury
Major Injury
1996/97 to 2008/09p
C
Findings
Figure 34 Top eight types of „all related‟ non-fatal accidents
Table 33 Types of „all related‟ non-fatal accidents between 1996/97 and 2008/09p
Category Major Injury Over-3-day Injury Grand Total
05 - HANDLING/SPRAINS 4,851 46,605 51,456
06 - TRIP 10,778 26,359 37,137
02 - STRUCK BY 6,602 17,872 24,474
01 - MACHINERY 5,843 10,694 16,537
07L - LOW FALL 5,171 5,867 11,038
04 - STRIKE/STEP ON 1,621 6,858 8,479
13 - VOLT 2,085 5,379 7,464
10 - EXPOSURE/HOT SUB 1,797 4,909 6,706
07H - HIGH FALL 3,819 1,755 5,574
15 - OTHER KIND 1,100 4,001 5,101
03 - TRANSPORT 1,214 1,991 3,205
07X - FALL 1,226 1,611 2,837
17 - ASSAULT/VIOLENCE 464 1,990 2,454
11 - FIRE 278 750 1,028
12 - EXPLOSION 295 488 783
08 - COLLAPSE/OVERTURN 306 336 642
14 - ANIMAL 113 436 549
XX - NOT KNOWN 129 270 399
09 - DROWNING/ASPHYX 96 80 176
Grand Total 47,788 138,251 186,039
Figure 34 and Table 33 show that handling and sprains are the most common non-fatal accident
type (51,456), followed by trips (37,137) and being struck by falling objects (24,474).
63

Contact with electricity or electrical discharge (‘Volt’) in comparison reports relatively few
accidents and is ranked seventh in terms of the total number of non-fatal accidents (7,464).
64
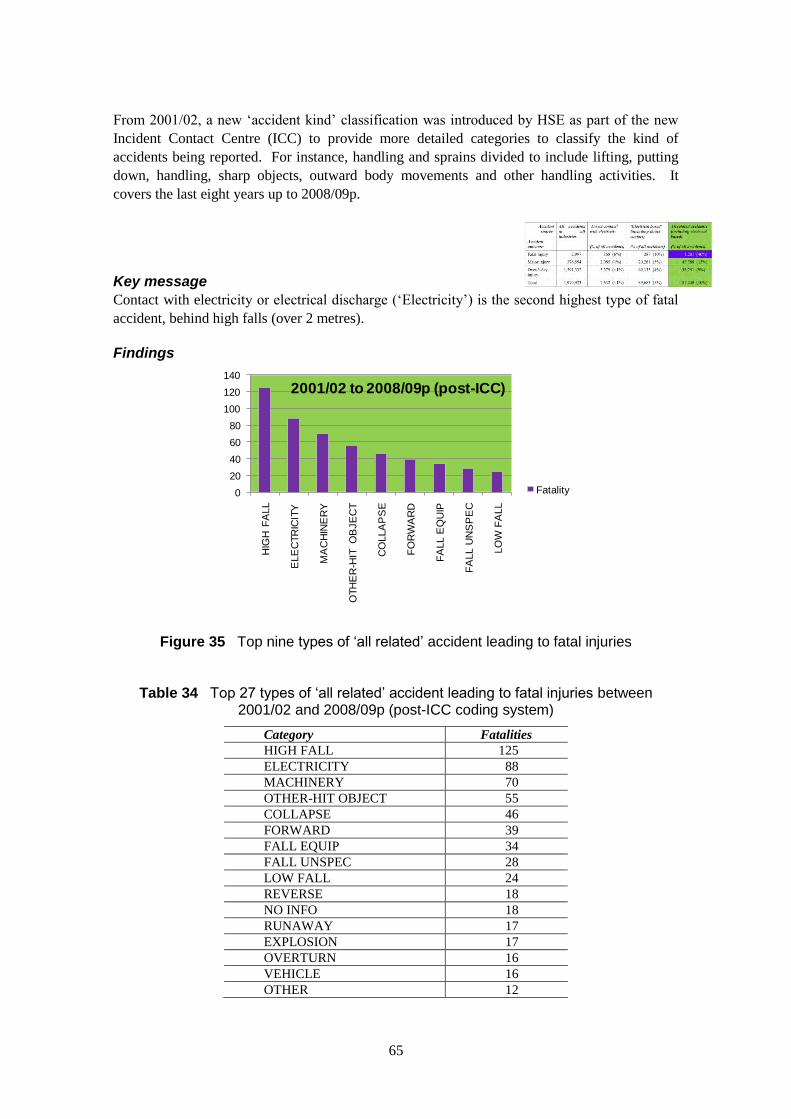
From 2001/02, a new ‘accident kind’ classification was introduced by HSE as part of the new
Incident Contact Centre (ICC) to provide more detailed categories to classify the kind of
accidents being reported. For instance, handling and sprains divided to include lifting, putting
sharp objects, outward body movements and other handling activities. It
covers the last eight years up to 2008/09p.
Contact with electricity or electrical discharge (‘Electricity’) is the second highest type of fatal
accident, behind high falls (over 2 metres).
0
20
40
60
80
100
120
140
HIG
H F
ALL
ELE
CTR
ICIT
Y
MA
CH
INE
RY
OTH
ER
-HIT
O
BJE
CT
CO
LLA
PS
E
FO
RW
AR
D
FA
LL E
QU
IP
FA
LL U
NS
PE
C
LO
W F
ALL
Fatality
2001/02 to 2008/09p (post-ICC)
down, handling,
Key message
Findings
Figure 35 Top nine types of „all related‟ accident leading to fatal injuries
Table 34 Top 27 types of „all related‟ accident leading to fatal injuries between 2001/02 and 2008/09p (post-ICC coding system)
Category Fatalities
HIGH FALL 125
ELECTRICITY 88
MACHINERY 70
OTHER-HIT OBJECT 55
COLLAPSE 46
FORWARD 39
FALL EQUIP 34
FALL UNSPEC 28
LOW FALL 24
REVERSE 18
NO INFO 18
RUNAWAY 17
EXPLOSION 17
OVERTURN 16
VEHICLE 16
OTHER 12
65
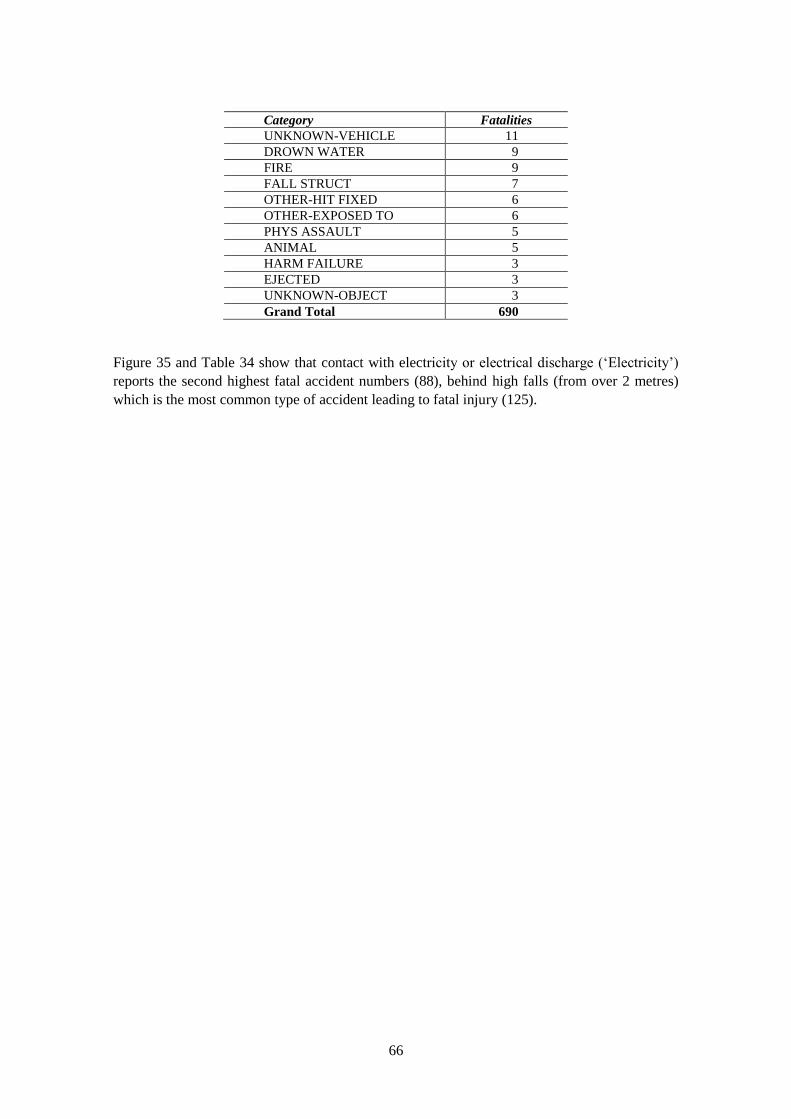
Category Fatalities
UNKNOWN-VEHICLE 11
DROWN WATER 9
FIRE 9
FALL STRUCT 7
OTHER-HIT FIXED 6
OTHER-EXPOSED TO 6
PHYS ASSAULT 5
ANIMAL 5
HARM FAILURE 3
EJECTED 3
UNKNOWN-OBJECT 3
Grand Total 690
Figure 35 and Table 34 show that contact with electricity or electrical discharge (‘Electricity’)
reports the second highest fatal accident numbers (88), behind high falls (from over 2 metres)
which is the most common type of accident leading to fatal injury (125).
66
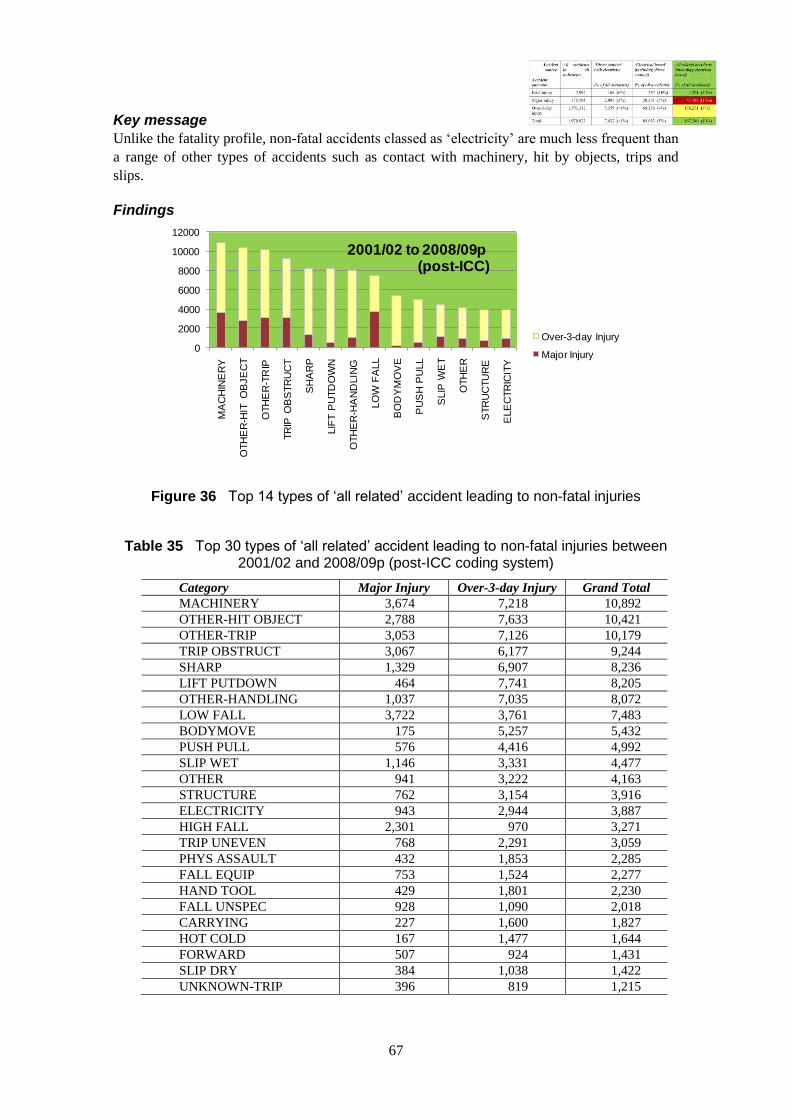
Key message
Unlike the fatality profile, non-fatal accidents classed as ‘electricity’ are much less frequent than
a range of other types of accidents such as contact with machinery, hit by objects, trips and
Findings
0
2000
4000
6000
8000
10000
12000
MA
CH
INE
RY
OTH
ER
-HIT
O
BJE
CT
OTH
ER
-TR
IP
TR
IP O
BS
TR
UC
T
SH
AR
P
LIF
T P
UTD
OW
N
OTH
ER
-HA
ND
LIN
G
LO
W F
ALL
BO
DY
MO
VE
PU
SH
PU
LL
SLIP
WE
T
OTH
ER
STR
UC
TU
RE
ELE
CTR
ICIT
Y
Over-3-day Injury
Major Injury
2001/02 to 2008/09p (post-ICC)
slips.
Figure 36 Top 14 types of „all related‟ accident leading to non-fatal injuries
Table 35 Top 30 types of „all related‟ accident leading to non-fatal injuries between 2001/02 and 2008/09p (post-ICC coding system)
Category Major Injury Over-3-day Injury Grand Total
MACHINERY 3,674 7,218 10,892
OTHER-HIT OBJECT 2,788 7,633 10,421
OTHER-TRIP 3,053 7,126 10,179
TRIP OBSTRUCT 3,067 6,177 9,244
SHARP 1,329 6,907 8,236
LIFT PUTDOWN 464 7,741 8,205
OTHER-HANDLING 1,037 7,035 8,072
LOW FALL 3,722 3,761 7,483
BODYMOVE 175 5,257 5,432
PUSH PULL 576 4,416 4,992
SLIP WET 1,146 3,331 4,477
OTHER 941 3,222 4,163
STRUCTURE 762 3,154 3,916
ELECTRICITY 943 2,944 3,887
HIGH FALL 2,301 970 3,271
TRIP UNEVEN 768 2,291 3,059
PHYS ASSAULT 432 1,853 2,285
FALL EQUIP 753 1,524 2,277
HAND TOOL 429 1,801 2,230
FALL UNSPEC 928 1,090 2,018
CARRYING 227 1,600 1,827
HOT COLD 167 1,477 1,644
FORWARD 507 924 1,431
SLIP DRY 384 1,038 1,422
UNKNOWN-TRIP 396 819 1,215
67
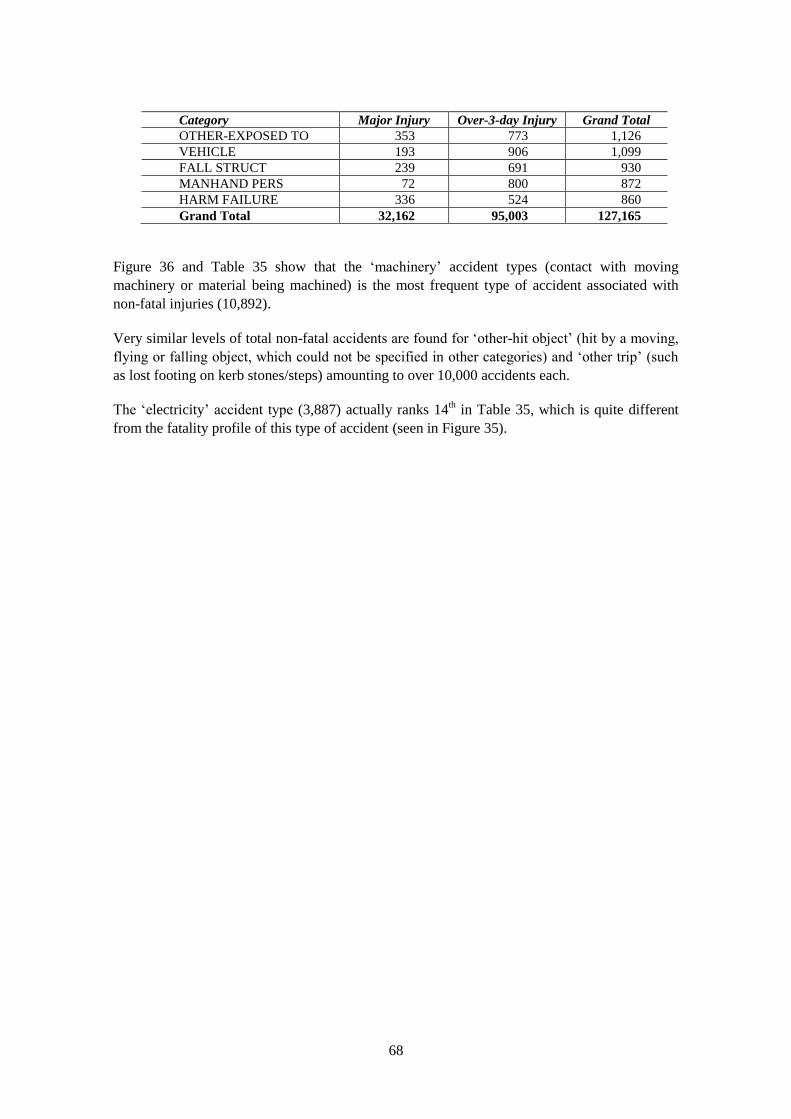
Category Major Injury Over-3-day Injury Grand Total
OTHER-EXPOSED TO 353 773 1,126
VEHICLE 193 906 1,099
FALL STRUCT 239 691 930
MANHAND PERS 72 800 872
HARM FAILURE 336 524 860
Grand Total 32,162 95,003 127,165
Figure 36 and Table 35 show that the ‘machinery’ accident types (contact with moving
machinery or material being machined) is the most frequent type of accident associated with
non-fatal injuries (10,892).
Very similar levels of total non-fatal accidents are found for ‘other-hit object’ (hit by a moving,
flying or falling object, which could not be specified in other categories) and ‘other trip’ (such
as lost footing on kerb stones/steps) amounting to over 10,000 accidents each.
The ‘electricity’ accident type (3,887) actually ranks 14th
in Table 35, which is quite different
from the fatality profile of this type of accident (seen in Figure 35).
68
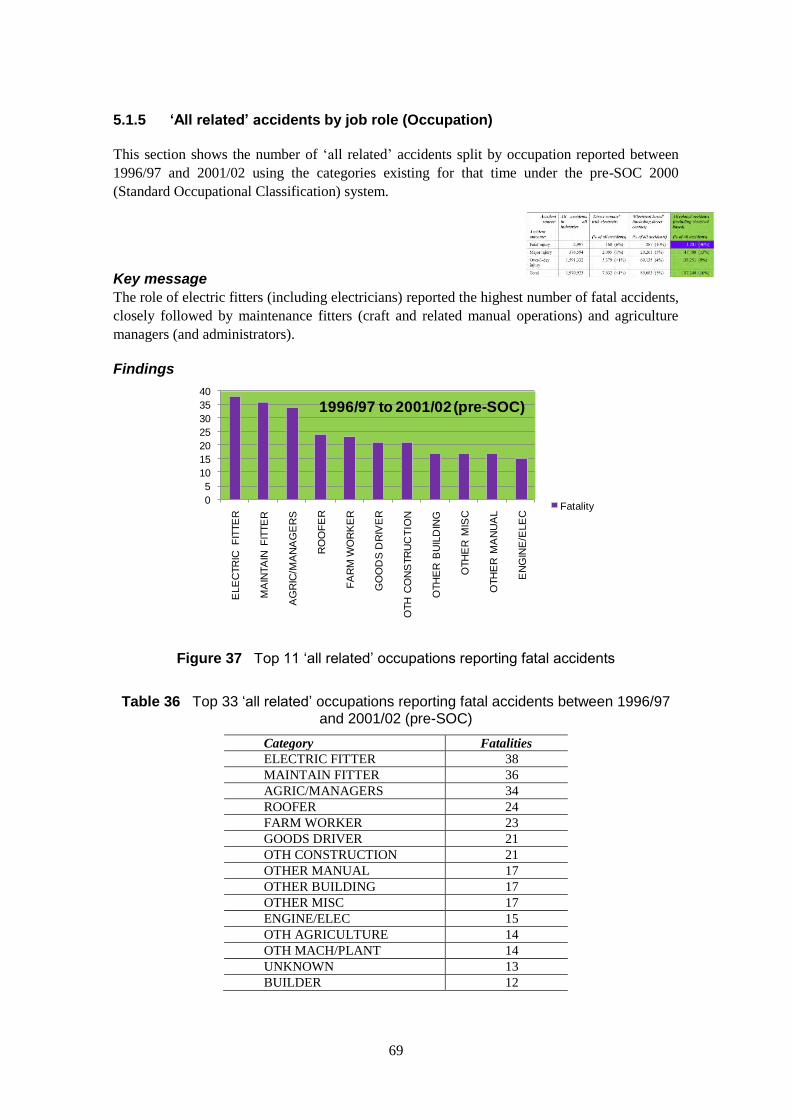
‘All related’ accidents by job role (Occupation)
This section shows the number of ‘all related accidents split by occupation reported between
1996/97 and 2001/02 using the categories existing for that time under the pre-SOC 2000
(Standard Occupational Classification) system.
Key message
The role of electric fitters (including electricians) reported the highest number of fatal accidents,
closely followed by maintenance fitters (craft and related manual operations) and agriculture
managers (and administrators).
0
5
10
15
20
25
30
35
40
ELE
CTR
IC F
ITTE
R
MA
INTA
IN F
ITTE
R
AG
RIC
/MA
NA
GE
RS
RO
OF
ER
FA
RM
WO
RK
ER
GO
OD
S D
RIV
ER
OTH
CO
NS
TR
UC
TIO
N
OTH
ER
BU
ILD
ING
OTH
ER
MIS
C
OTH
ER
MA
NU
AL
EN
GIN
E/E
LE
C
Fatality
1996/97 to 2001/02 (pre-SOC)
5.1.5
’
Findings
Figure 37 Top 11 „all related‟ occupations reporting fatal accidents
Table 36 Top 33 „all related‟ occupations reporting fatal accidents between 1996/97 and 2001/02 (pre-SOC)
Category Fatalities
ELECTRIC FITTER 38
MAINTAIN FITTER 36
AGRIC/MANAGERS 34
ROOFER 24
FARM WORKER 23
GOODS DRIVER 21
OTH CONSTRUCTION 21
OTHER MANUAL 17
OTHER BUILDING 17
OTHER MISC 17
ENGINE/ELEC 15
OTH AGRICULTURE 14
OTH MACH/PLANT 14
UNKNOWN 13
BUILDER 12
69
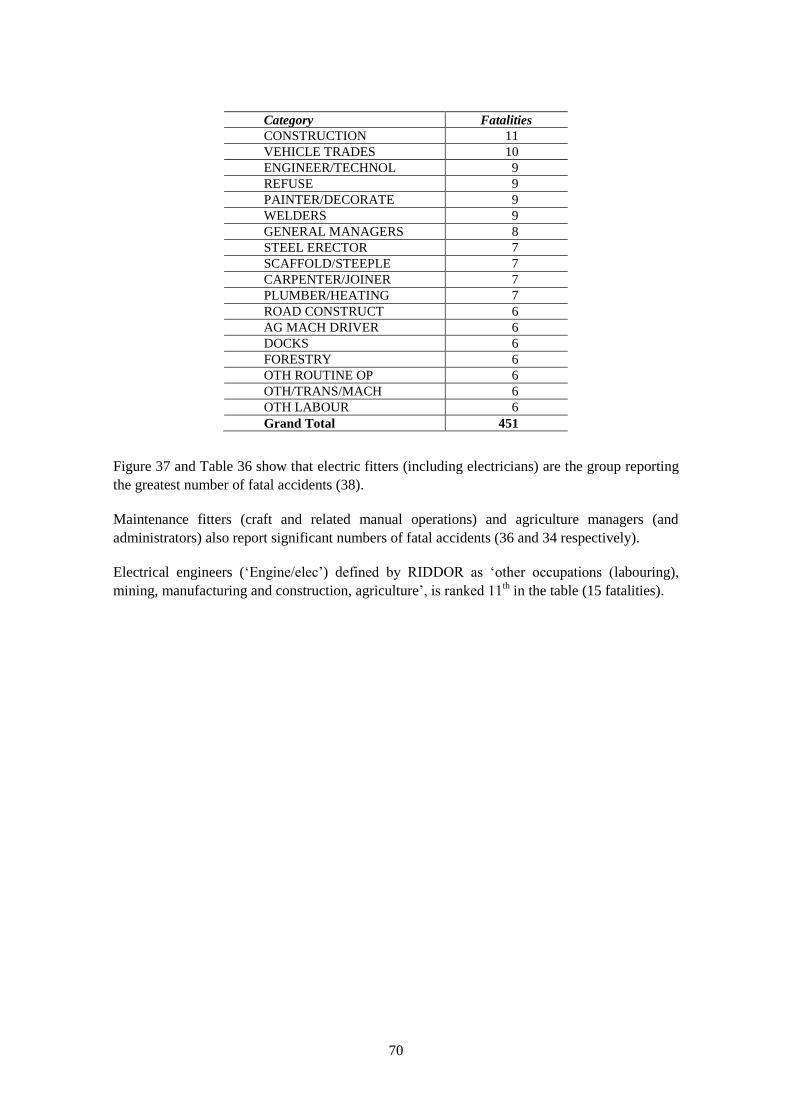
Category Fatalities
CONSTRUCTION 11
VEHICLE TRADES 10
ENGINEER/TECHNOL 9
REFUSE 9
PAINTER/DECORATE 9
WELDERS 9
GENERAL MANAGERS 8
STEEL ERECTOR 7
SCAFFOLD/STEEPLE 7
CARPENTER/JOINER 7
PLUMBER/HEATING 7
ROAD CONSTRUCT 6
AG MACH DRIVER 6
DOCKS 6
FORESTRY 6
OTH ROUTINE OP 6
OTH/TRANS/MACH 6
OTH LABOUR 6
Grand Total 451
Figure 37 and Table 36 show that electric fitters (including electricians) are the group reporting
the greatest number of fatal accidents (38).
Maintenance fitters (craft and related manual operations) and agriculture managers (and
administrators) also report significant numbers of fatal accidents (36 and 34 respectively).
Electrical engineers (‘Engine/elec’) defined by RIDDOR as ‘other occupations (labouring),
mining, manufacturing and construction, agriculture’, is ranked 11th in the table (15 fatalities).
70
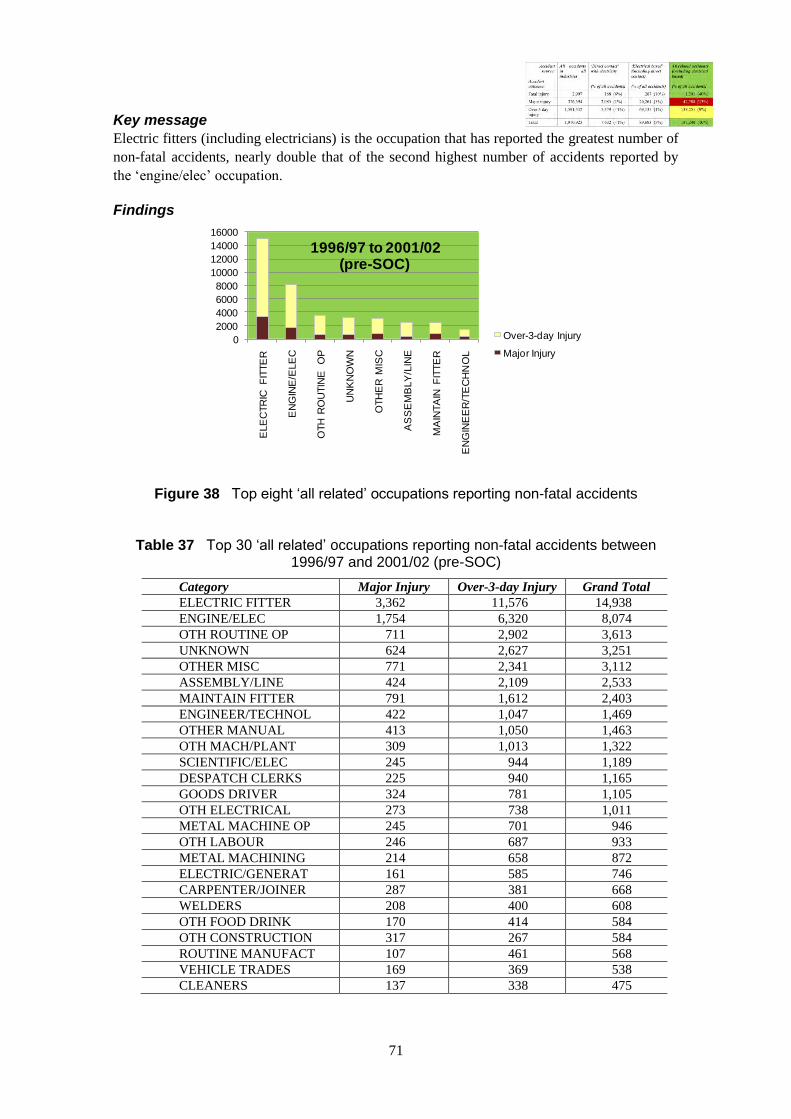
Key message
Electric fitters (including electricians) is the occupation that has reported the greatest number of
non-fatal accidents, nearly double that of the second highest number of accidents reported by
the ‘engine/elec’ occupation.
0
2000
4000
6000
8000
10000
12000
14000
16000
ELE
CTR
IC F
ITTE
R
EN
GIN
E/E
LE
C
OTH
RO
UTIN
E
OP
UN
KN
OW
N
OTH
ER
MIS
C
AS
SE
MB
LY
/LIN
E
MA
INTA
IN F
ITTE
R
EN
GIN
EE
R/T
EC
HN
OL
Over-3-day Injury
Major Injury
1996/97 to 2001/02(pre-SOC)
Findings
Figure 38 Top eight „all related‟ occupations reporting non-fatal accidents
Table 37 Top 30 „all related‟ occupations reporting non-fatal accidents between 1996/97 and 2001/02 (pre-SOC)
Category Major Injury Over-3-day Injury Grand Total
ELECTRIC FITTER 3,362 11,576 14,938
ENGINE/ELEC 1,754 6,320 8,074
OTH ROUTINE OP 711 2,902 3,613
UNKNOWN 624 2,627 3,251
OTHER MISC 771 2,341 3,112
ASSEMBLY/LINE 424 2,109 2,533
MAINTAIN FITTER 791 1,612 2,403
ENGINEER/TECHNOL 422 1,047 1,469
OTHER MANUAL 413 1,050 1,463
OTH MACH/PLANT 309 1,013 1,322
SCIENTIFIC/ELEC 245 944 1,189
DESPATCH CLERKS 225 940 1,165
GOODS DRIVER 324 781 1,105
OTH ELECTRICAL 273 738 1,011
METAL MACHINE OP 245 701 946
OTH LABOUR 246 687 933
METAL MACHINING 214 658 872
ELECTRIC/GENERAT 161 585 746
CARPENTER/JOINER 287 381 668
WELDERS 208 400 608
OTH FOOD DRINK 170 414 584
OTH CONSTRUCTION 317 267 584
ROUTINE MANUFACT 107 461 568
VEHICLE TRADES 169 369 538
CLEANERS 137 338 475
71
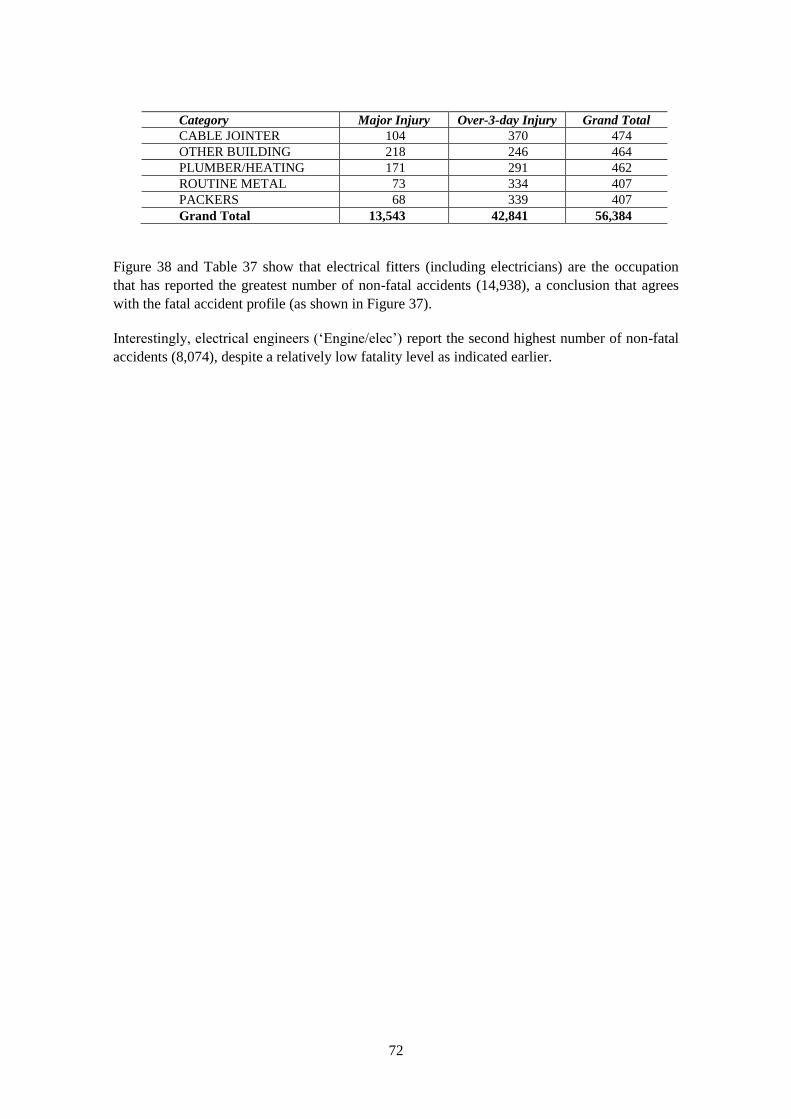
Category Major Injury Over-3-day Injury Grand Total
CABLE JOINTER 104 370 474
OTHER BUILDING 218 246 464
PLUMBER/HEATING 171 291 462
ROUTINE METAL 73 334 407
PACKERS 68 339 407
Grand Total 13,543 42,841 56,384
Figure 38 and Table 37 show that electrical fitters (including electricians) are the occupation
that has reported the greatest number of non-fatal accidents (14,938), a conclusion that agrees
with the fatal accident profile (as shown in Figure 37).
Interestingly, electrical engineers (‘Engine/elec’) report the second highest number of non-fatal
accidents (8,074), despite a relatively low fatality level as indicated earlier.
72
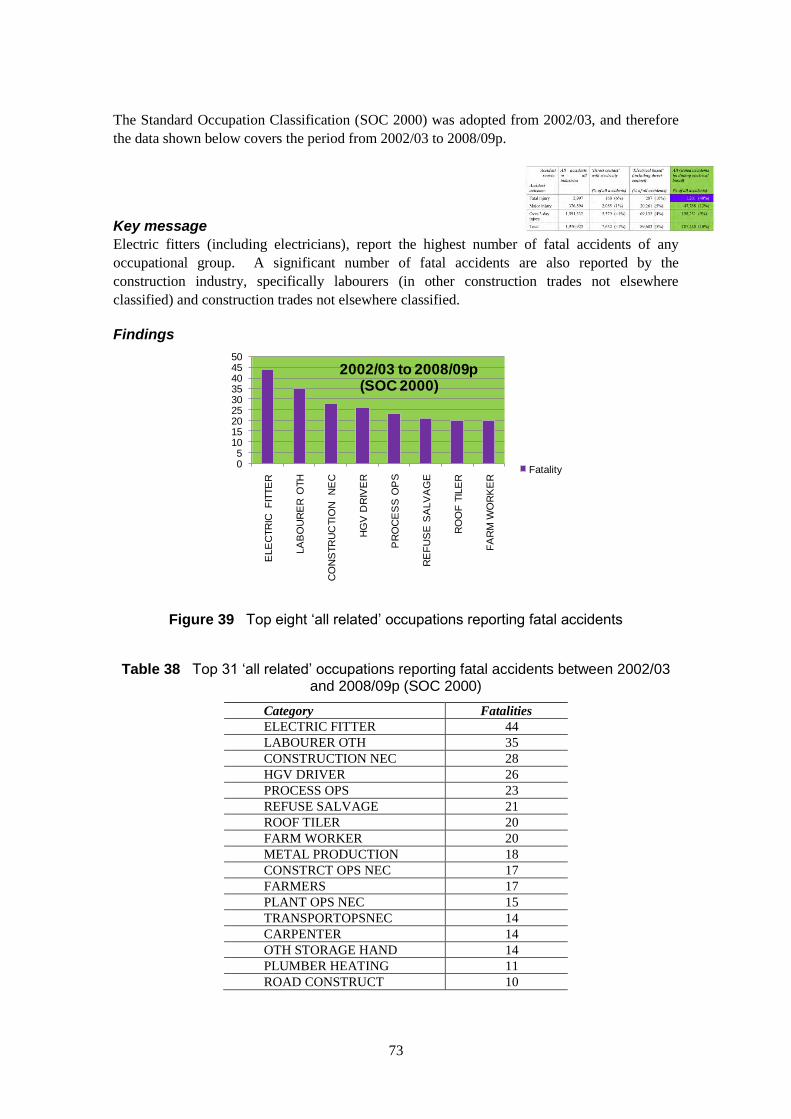
The Standard Occupation Classification (SOC 2000) was adopted from 2002/03, and therefore
the data shown below covers the period from 2002/03 to 2008/09p.
(including electricians), report the highest number of fatal accidents of any
group. A significant number of fatal accidents are also reported by the
industry, specifically labourers (in other construction trades not elsewhere
classified) and construction trades not elsewhere classified.
05
101520253035404550
ELE
CTR
IC F
ITTE
R
LA
BO
UR
ER
OTH
CO
NS
TR
UC
TIO
N
NE
C
HG
V D
RIV
ER
PR
OC
ES
S O
PS
RE
FU
SE
SA
LV
AG
E
RO
OF
TIL
ER
FA
RM
WO
RK
ER
Fatality
2002/03 to 2008/09p (SOC 2000)
Key message
Electric fitters
occupational
construction
Findings
Figure 39 Top eight „all related‟ occupations reporting fatal accidents
Table 38 Top 31 „all related‟ occupations reporting fatal accidents between 2002/03 and 2008/09p (SOC 2000)
Category Fatalities
ELECTRIC FITTER 44
LABOURER OTH 35
CONSTRUCTION NEC 28
HGV DRIVER 26
PROCESS OPS 23
REFUSE SALVAGE 21
ROOF TILER 20
FARM WORKER 20
METAL PRODUCTION 18
CONSTRCT OPS NEC 17
FARMERS 17
PLANT OPS NEC 15
TRANSPORTOPSNEC 14
CARPENTER 14
OTH STORAGE HAND 14
PLUMBER HEATING 11
ROAD CONSTRUCT 10
73
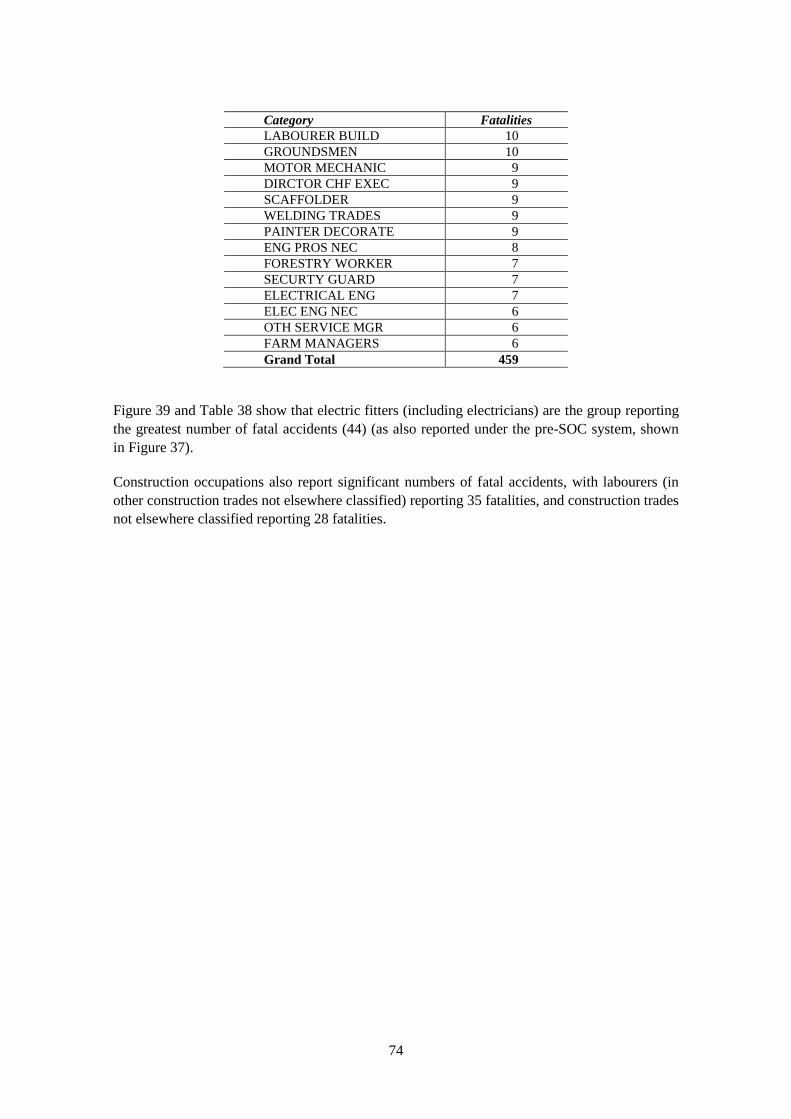
Category Fatalities
LABOURER BUILD 10
GROUNDSMEN 10
MOTOR MECHANIC 9
DIRCTOR CHF EXEC 9
SCAFFOLDER 9
WELDING TRADES 9
PAINTER DECORATE 9
ENG PROS NEC 8
FORESTRY WORKER 7
SECURTY GUARD 7
ELECTRICAL ENG 7
ELEC ENG NEC 6
OTH SERVICE MGR 6
FARM MANAGERS 6
Grand Total 459
Figure 39 and Table 38 show that electric fitters (including electricians) are the group reporting
the greatest number of fatal accidents (44) (as also reported under the pre-SOC system, shown
in Figure 37).
Construction occupations also report significant numbers of fatal accidents, with labourers (in
other construction trades not elsewhere classified) reporting 35 fatalities, and construction trades
not elsewhere classified reporting 28 fatalities.
74

Key message
Similar to the fatality profile, electrical fitters (including electricians) have reported the most
non-fatal accidents of any occupation. Electrical engineers report a number of accidents, but
these are low in comparison to electrical fitters.
0
2000
4000
6000
8000
10000
12000
ELE
CTR
IC F
ITTE
R
PR
OC
ES
S O
PS
OTH
STO
RA
GE
HA
ND
ME
TA
L P
RO
DU
CTIO
N
SA
LE
S A
SS
ISTA
NT
HG
V D
RIV
ER
EN
G P
RO
S N
EC
PLA
NT O
PS
NE
C
FO
OD
DR
INK
TO
BA
CC
O
ELE
CTR
ICA
L E
NG
Over-3-day Injury
Major Injury
2002/03 to 2008/09p (SOC 2000)
Findings
Figure 40 Top 10 „all related‟ occupations reporting non-fatal accidents
Table 39 Top 30 „all related‟ occupations reporting non-fatal accidents between 2002/03 and 2008/09p (SOC 2000)
Category Major Injury Over-3-day Injury Grand Total
ELECTRIC FITTER 3,284 7,649 10,933
PROCESS OPS 1,782 7,157 8,939
OTH STORAGE HAND 1,282 5,795 7,077
METAL PRODUCTION 940 2,395 3,335
SALES ASSISTANT 601 2,187 2,788
HGV DRIVER 757 1,944 2,701
ENG PROS NEC 740 1,949 2,689
PLANT OPS NEC 722 1,910 2,632
FOODDRINKTOBACCO 483 2,105 2,588
ELECTRICAL ENG 605 1,635 2,240
LABOURER OTH 863 1,242 2,105
CLEANER/DOMESTIC 507 1,471 1,978
TRANSPORTOPSNEC 433 1,537 1,970
CARPENTER 691 1,166 1,857
CARE ASSISTANT 305 1,484 1,789
PLUMBER HEATING 453 1,173 1,626
METAL MAKE/TREAT 393 1,210 1,603
POLICE OFFICER L 372 1,196 1,568
ELEC ENG NEC 377 1,191 1,568
TELECOM ENGINEER 296 1,264 1,560
ENG TECH 373 1,171 1,544
CONSTRCT OPS NEC 656 879 1,535
FIRE OFFICER 169 1,348 1,517
POSTAL WORKER 158 1,294 1,452
MOTOR MECHANIC 331 1,118 1,449
75
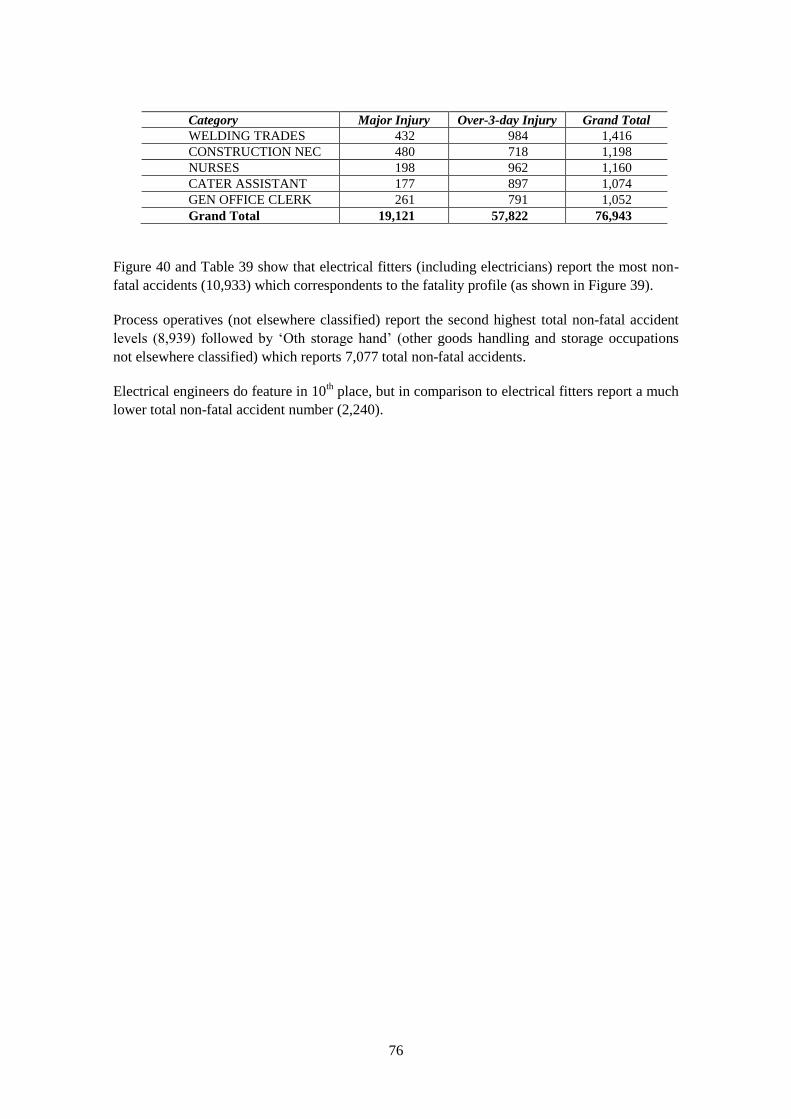
Category Major Injury Over-3-day Injury Grand Total
WELDING TRADES 432 984 1,416
CONSTRUCTION NEC 480 718 1,198
NURSES 198 962 1,160
CATER ASSISTANT 177 897 1,074
GEN OFFICE CLERK 261 791 1,052
Grand Total 19,121 57,822 76,943
Figure 40 and Table 39 show that electrical fitters (including electricians) report the most non-
fatal accidents (10,933) which correspondents to the fatality profile (as shown in Figure 39).
Process operatives (not elsewhere classified) report the second highest total non-fatal accident
levels (8,939) followed by ‘Oth storage hand’ (other goods handling and storage occupations
not elsewhere classified) which reports 7,077 total non-fatal accidents.
Electrical engineers do feature in 10th
place, but in comparison to electrical fitters report a much
lower total non-fatal accident number (2,240).
76

To provide further context, the analyses that follow provide a detailed breakdown of the kinds
of accident experienced by electric fitters across the 13 years (classified using the accident kind
Key message
of electric fitters (including electricians) are primarily due to direct contact with
or electrical discharge. Fatalities from high falls (over 2 metres) are also quite
0
5
10
15
20
25
30
35
13 -
VO
LT
07H
-H
IGH
FA
LL
01 -
MA
CH
INE
RY
02 -
STR
UC
K B
Y
07X
-F
ALL
15 -
OTH
ER
KIN
D
03 -
TR
AN
SP
OR
T
04 -
STR
IKE
/STE
P O
N
12 -
EX
PLO
SIO
N
07L -
LO
W F
ALL
XX
-N
OT K
NO
WN
10 -
EX
PO
SU
RE
/HO
T
SU
B
Fatality
1996/97 to 2008/09p
map).
Fatalities
electricity
significant.
Findings
Figure 41 All types of fatal accident reported by electric fitters
Figure 41 shows that the highest number of fatal accidents involve contact with electricity or
electrical discharge (i.e. the ‘Volt’ category) incurring 31 fatalities, followed by high falls with
20 fatalities.
77
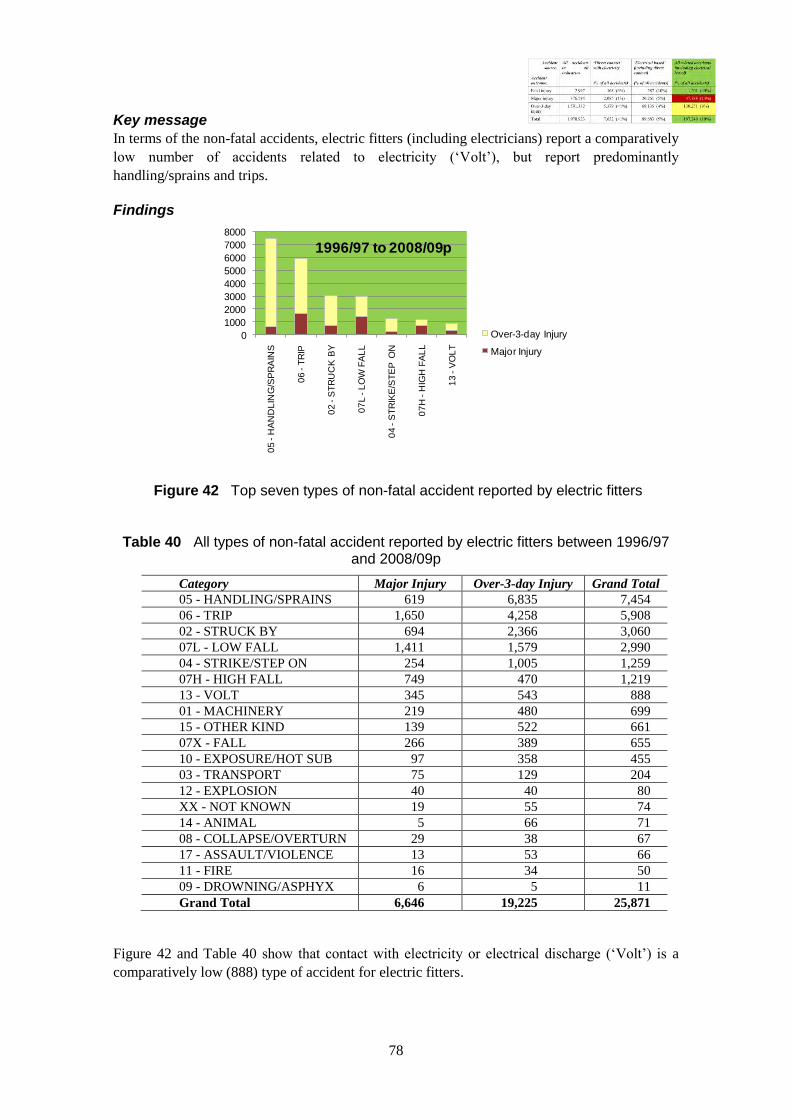
In terms of the non-fatal accidents, electric fitters (including electricians) report a comparatively
of accidents related to electricity (‘Volt’), but report predominantly
handling/sprains and trips.
0
1000
2000
3000
4000
5000
6000
7000
8000
05
-H
AN
DL
ING
/SP
RA
INS
06
-T
RIP
02
-S
TR
UC
K B
Y
07
L -
LO
W F
AL
L
04
-S
TR
IKE
/ST
EP
ON
07
H -
HIG
H F
AL
L
13
-V
OL
T
Over-3-day Injury
Major Injury
1996/97 to 2008/09p
Key message
low number
Findings
Figure 42 Top seven types of non-fatal accident reported by electric fitters
Table 40 All types of non-fatal accident reported by electric fitters between 1996/97 and 2008/09p
Category Major Injury Over-3-day Injury Grand Total
05 - HANDLING/SPRAINS 619 6,835 7,454
06 - TRIP 1,650 4,258 5,908
02 - STRUCK BY 694 2,366 3,060
07L - LOW FALL 1,411 1,579 2,990
04 - STRIKE/STEP ON 254 1,005 1,259
07H - HIGH FALL 749 470 1,219
13 - VOLT 345 543 888
01 - MACHINERY 219 480 699
15 - OTHER KIND 139 522 661
07X - FALL 266 389 655
10 - EXPOSURE/HOT SUB 97 358 455
03 - TRANSPORT 75 129 204
12 - EXPLOSION 40 40 80
XX - NOT KNOWN 19 55 74
14 - ANIMAL 5 66 71
08 - COLLAPSE/OVERTURN 29 38 67
17 - ASSAULT/VIOLENCE 13 53 66
11 - FIRE 16 34 50
09 - DROWNING/ASPHYX 6 5 11
Grand Total 6,646 19,225 25,871
Figure 42 and Table 40 show that contact with electricity or electrical discharge (‘Volt’) is a
comparatively low (888) type of accident for electric fitters.
78

Handling and sprains make up the highest total non-fatal accident number (7,454). Trips are
also common (5,908).
It would appear that trips and low falls are responsible for the highest frequency of major
injuries for electric fitters over the 13 year time period.
79
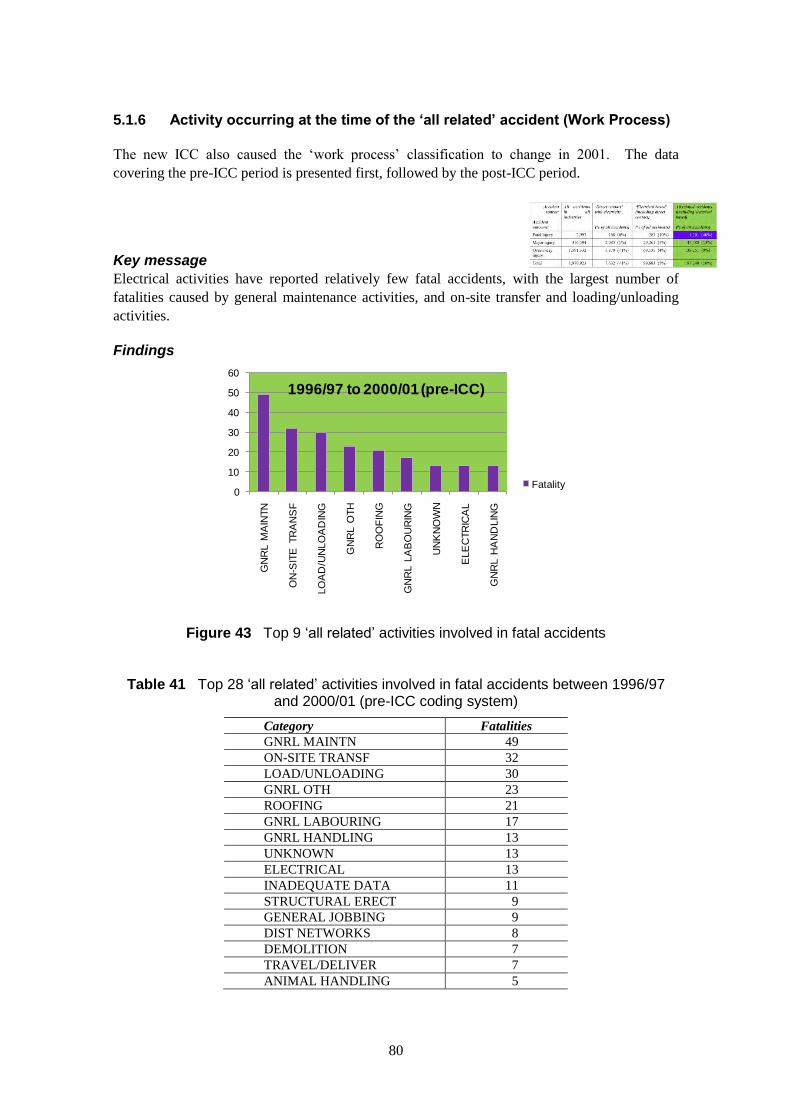
Activity occurring at the time of the ‘all related’ accident (Work Process)
ICC also caused the ‘work process’ classification to change in 2001. The data
covering the pre-ICC period is presented first, followed by the post-ICC period.
activities have reported relatively few fatal accidents, with the largest number of
fatalities caused by general maintenance activities, and on-site transfer and loading/unloading
0
10
20
30
40
50
60
GN
RL M
AIN
TN
ON
-SIT
E T
RA
NS
F
LO
AD
/UN
LO
AD
ING
GN
RL O
TH
RO
OF
ING
GN
RL L
AB
OU
RIN
G
UN
KN
OW
N
ELE
CTR
ICA
L
GN
RL H
AN
DLIN
GFatality
1996/97 to 2000/01 (pre-ICC)
5.1.6
The new
Key message
Electrical
activities.
Findings
Figure 43 Top 9 „all related‟ activities involved in fatal accidents
Table 41 Top 28 „all related‟ activities involved in fatal accidents between 1996/97 and 2000/01 (pre-ICC coding system)
Category Fatalities
GNRL MAINTN 49
ON-SITE TRANSF 32
LOAD/UNLOADING 30
GNRL OTH 23
ROOFING 21
GNRL LABOURING 17
GNRL HANDLING 13
UNKNOWN 13
ELECTRICAL 13
INADEQUATE DATA 11
STRUCTURAL ERECT 9
GENERAL JOBBING 9
DIST NETWORKS 8
DEMOLITION 7
TRAVEL/DELIVER 7
ANIMAL HANDLING 5
80
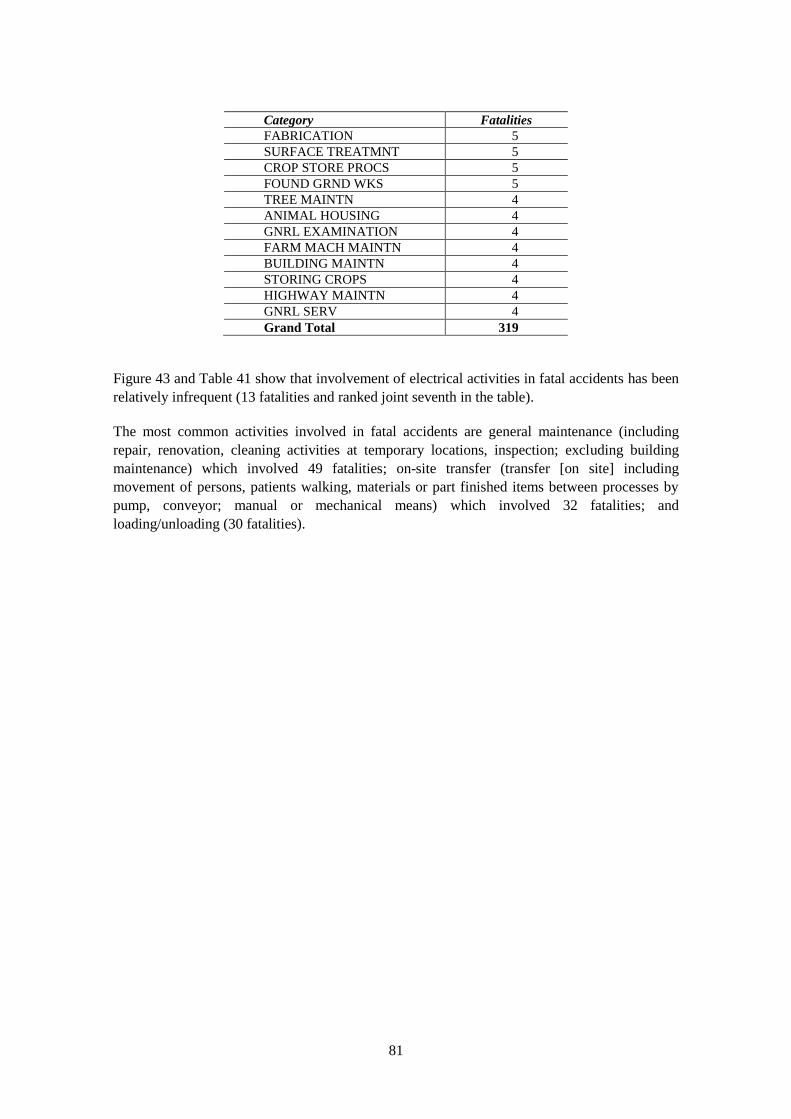
Category Fatalities
FABRICATION 5
SURFACE TREATMNT 5
CROP STORE PROCS 5
FOUND GRND WKS 5
TREE MAINTN 4
ANIMAL HOUSING 4
GNRL EXAMINATION 4
FARM MACH MAINTN 4
BUILDING MAINTN 4
STORING CROPS 4
HIGHWAY MAINTN 4
GNRL SERV 4
Grand Total 319
Figure 43 and Table 41 show that involvement of electrical activities in fatal accidents has been
relatively infrequent (13 fatalities and ranked joint seventh in the table).
The most common activities involved in fatal accidents are general maintenance (including
repair, renovation, cleaning activities at temporary locations, inspection; excluding building
maintenance) which involved 49 fatalities; on-site transfer (transfer [on site] including
movement of persons, patients walking, materials or part finished items between processes by
pump, conveyor; manual or mechanical means) which involved 32 fatalities; and
loading/unloading (30 fatalities).
81

Key message
Similar to the fatal accident profile, electrical activities have been responsible for fewer non-
fatal accidents than a range of other activities such as on-site transfer and general handling.
0
1000
2000
3000
4000
5000
6000
7000
8000
9000
10000
ON
-SIT
E T
RA
NS
F
GN
RL H
AN
DLIN
G
GN
RL M
AIN
TN
UN
KN
OW
N
GN
RL O
TH
LO
AD
/UN
LO
AD
ING
GN
RL L
AB
OU
RIN
G
DIS
T N
ETW
OR
KS
ELE
CTR
ICA
L
Over-3-day Injury
Major Injury
1996/97 to 2000/01 (pre-ICC)
Findings
Figure 44 Top nine „all related‟ activities involved in non-fatal accidents
Table 42 Top 30 „all related‟ activities involved in non-fatal accidents between 1996/97 and 2000/01 (pre-ICC coding)
Category Major Injury Over-3-day Injury Grand Total
ON-SITE TRANSF 2,265 6,387 8,652
GNRL HANDLING 1,375 7,029 8,404
GNRL MAINTN 1,579 3,510 5,089
UNKNOWN 624 2,627 3,251
GNRL OTH 631 1,844 2,475
LOAD/UNLOADING 504 1,938 2,442
GNRL LABOURING 572 1,654 2,226
DIST NETWORKS 326 1,889 2,215
ELECTRICAL 642 1,092 1,734
GNRL ASSEMBLY 236 975 1,211
GNRL INSTALL ETC 352 683 1,035
MACHINING 278 657 935
TRAVEL/DELIVER 130 458 588
INADEQUATE DATA 117 326 443
FABRICATION 103 313 416
GNRL SERV 110 234 344
GROUND WORKS 127 140 267
GNRL AMENITIES 59 174 233
GNRL PACKING 44 187 231
GNRL EXAMINATION 89 140 229
GENERAL JOBBING 119 108 227
CONSUMER PREMISE 34 184 218
GENERATION 46 165 211
BT GRND WKS 29 178 207
ELEC DIST GRND 62 138 200
TOOL SETTING 46 136 182
FINISHING PROCS 81 91 172
ENGNRNG INSTALL 52 120 172
82

Category Major Injury Over-3-day Injury Grand Total
WOOD SAWING 78 93 171
GNRL STORING 39 129 168
Grand Total 10,749 33,599 44,348
Figure 44 and Table 42 show that the activities involved in non-fatal accidents are similar to the
fatal accident profile (as shown in Figure 43), whereby electrical accidents do feature (1,734
accidents and ranked ninth), but are comparatively infrequent in relation to other activities.
The activities that have been involved in the greatest total number of non-fatal accidents are
mainly on-site transfer (8,652) and general handling (8,404).
83
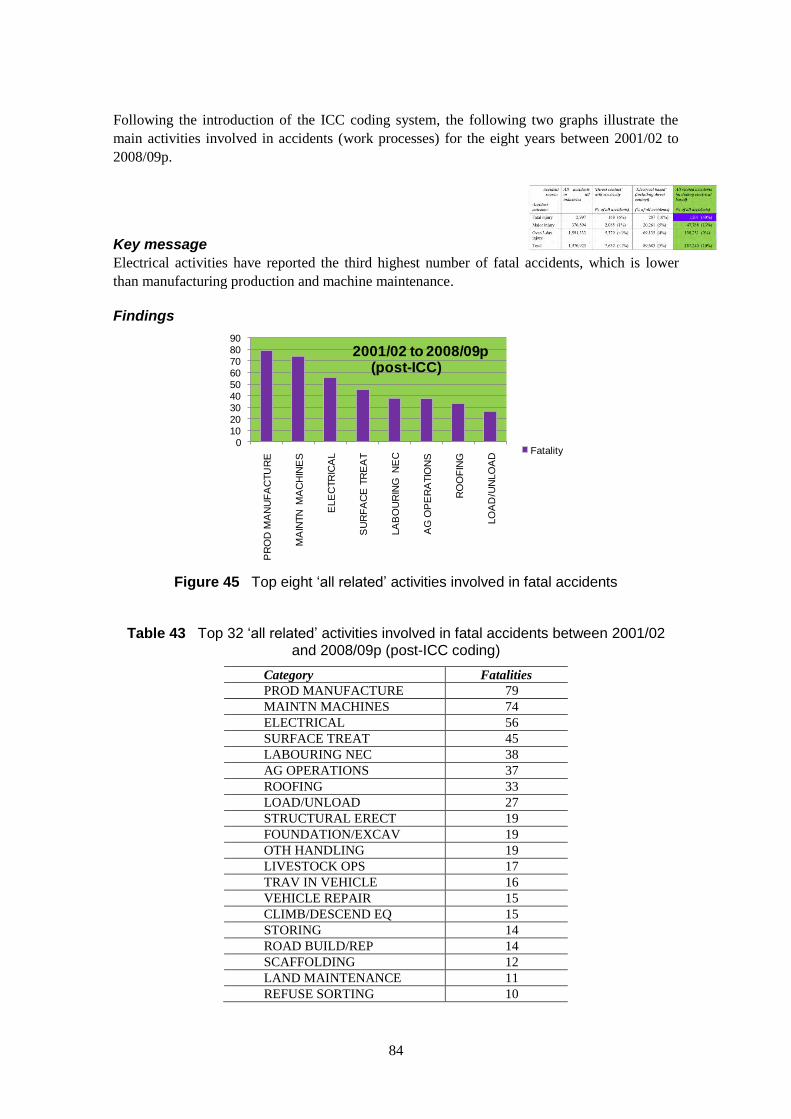
Following the introduction of the ICC coding system, the following two graphs illustrate the
main activities involved in accidents (work processes) for the eight years between 2001/02 to
Electrical activities have reported the third highest number of fatal accidents, which is lower
than manufacturing production and machine maintenance.
0102030405060708090
PR
OD
MA
NU
FA
CTU
RE
MA
INTN
MA
CH
INE
S
ELE
CTR
ICA
L
SU
RF
AC
E T
RE
AT
LA
BO
UR
ING
NE
C
AG
OP
ER
ATIO
NS
RO
OF
ING
LO
AD
/UN
LO
AD
Fatality
2001/02 to 2008/09p (post-ICC)
2008/09p.
Key message
Findings
Figure 45 Top eight „all related‟ activities involved in fatal accidents
Table 43 Top 32 „all related‟ activities involved in fatal accidents between 2001/02 and 2008/09p (post-ICC coding)
Category Fatalities
PROD MANUFACTURE 79
MAINTN MACHINES 74
ELECTRICAL 56
SURFACE TREAT 45
LABOURING NEC 38
AG OPERATIONS 37
ROOFING 33
LOAD/UNLOAD 27
STRUCTURAL ERECT 19
FOUNDATION/EXCAV 19
OTH HANDLING 19
LIVESTOCK OPS 17
TRAV IN VEHICLE 16
VEHICLE REPAIR 15
CLIMB/DESCEND EQ 15
STORING 14
ROAD BUILD/REP 14
SCAFFOLDING 12
LAND MAINTENANCE 11
REFUSE SORTING 10
84

Category Fatalities
WALK/RUN ELSE 10
DEMOLITION 9
TRAV ON HIGHWAY 8
REFUSE COLLECT 8
ARBORICULTURE 7
QUARRYING 6
REFUSE DISPOSAL 6
LAY/REPAIR 6
METAL SCRAP 5
DOCK OTHER 4
ENFORCE OTHER 4
CLEAN INTERNAL 4
Grand Total 647
Figure 45 and Table 43 show that electrical activity is ranked third, based on the number of fatal
accidents reported (56).
The highest numbers of fatal accident are related to ‘Prod manufacture’ (manufacturing
production) which has 79 fatalities and machine maintenance (74 fatalities).
85
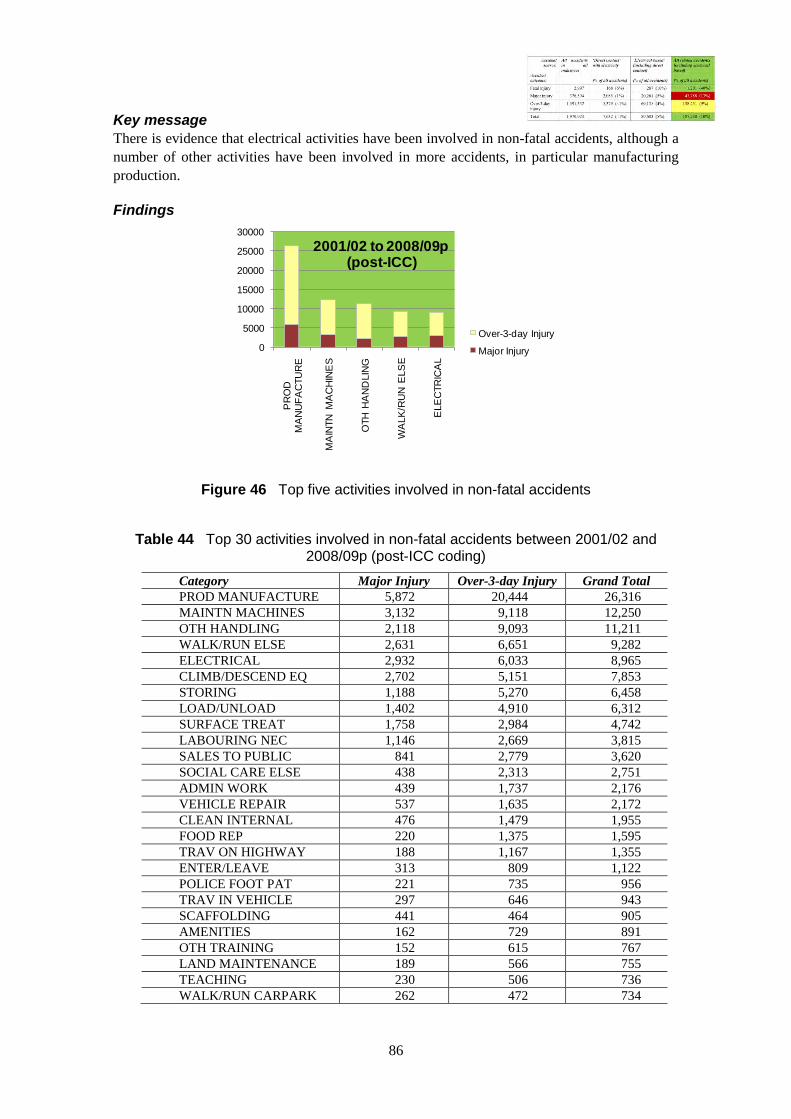
There is evidence that electrical activities have been involved in non-fatal accidents, although a
number of other activities have been involved in more accidents, in particular manufacturing
0
5000
10000
15000
20000
25000
30000
PR
OD
M
AN
UF
AC
TU
RE
MA
INTN
MA
CH
INE
S
OTH
HA
ND
LIN
G
WA
LK
/RU
N E
LS
E
ELE
CTR
ICA
L
Over-3-day Injury
Major Injury
2001/02 to 2008/09p (post-ICC)
Key message
production.
Findings
Figure 46 Top five activities involved in non-fatal accidents
Table 44 Top 30 activities involved in non-fatal accidents between 2001/02 and 2008/09p (post-ICC coding)
Category Major Injury Over-3-day Injury Grand Total
PROD MANUFACTURE 5,872 20,444 26,316
MAINTN MACHINES 3,132 9,118 12,250
OTH HANDLING 2,118 9,093 11,211
WALK/RUN ELSE 2,631 6,651 9,282
ELECTRICAL 2,932 6,033 8,965
CLIMB/DESCEND EQ 2,702 5,151 7,853
STORING 1,188 5,270 6,458
LOAD/UNLOAD 1,402 4,910 6,312
SURFACE TREAT 1,758 2,984 4,742
LABOURING NEC 1,146 2,669 3,815
SALES TO PUBLIC 841 2,779 3,620
SOCIAL CARE ELSE 438 2,313 2,751
ADMIN WORK 439 1,737 2,176
VEHICLE REPAIR 537 1,635 2,172
CLEAN INTERNAL 476 1,479 1,955
FOOD REP 220 1,375 1,595
TRAV ON HIGHWAY 188 1,167 1,355
ENTER/LEAVE 313 809 1,122
POLICE FOOT PAT 221 735 956
TRAV IN VEHICLE 297 646 943
SCAFFOLDING 441 464 905
AMENITIES 162 729 891
OTH TRAINING 152 615 767
LAND MAINTENANCE 189 566 755
TEACHING 230 506 736
WALK/RUN CARPARK 262 472 734
86
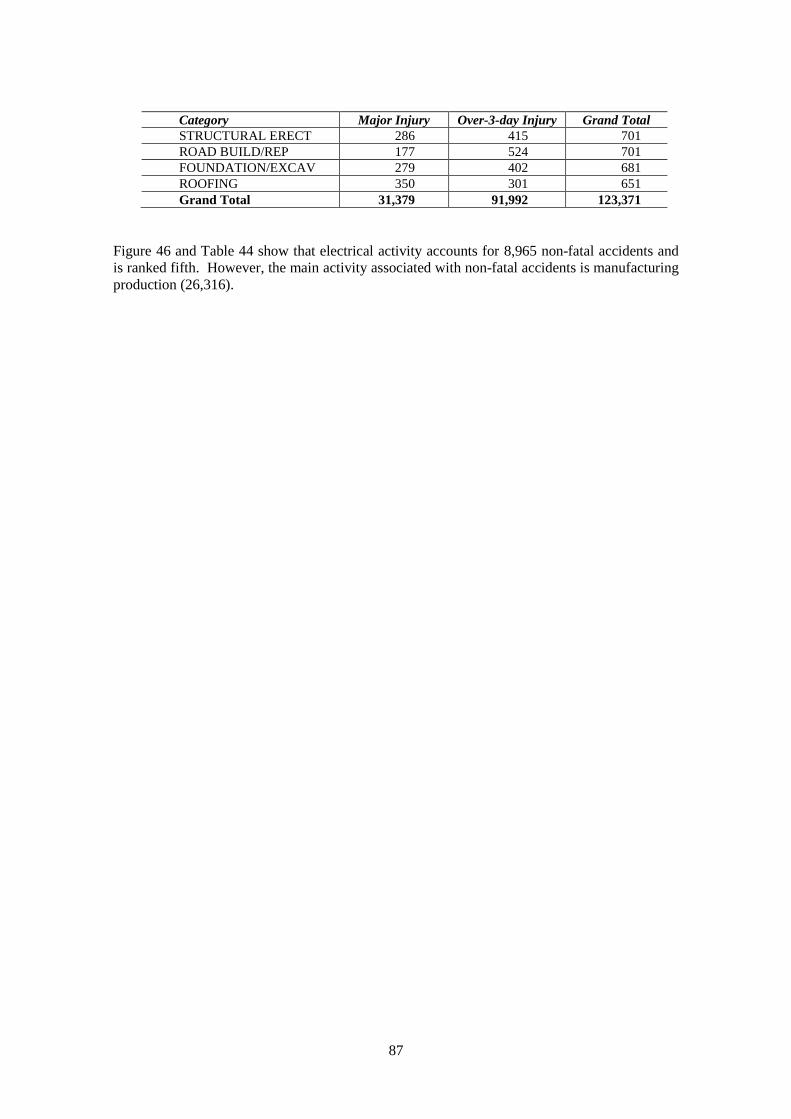
Category Major Injury Over-3-day Injury Grand Total
STRUCTURAL ERECT 286 415 701
ROAD BUILD/REP 177 524 701
FOUNDATION/EXCAV 279 402 681
ROOFING 350 301 651
Grand Total 31,379 91,992 123,371
Figure 46 and Table 44 show that electrical activity accounts for 8,965 non-fatal accidents and
is ranked fifth. However, the main activity associated with non-fatal accidents is manufacturing
production (26,316).
87
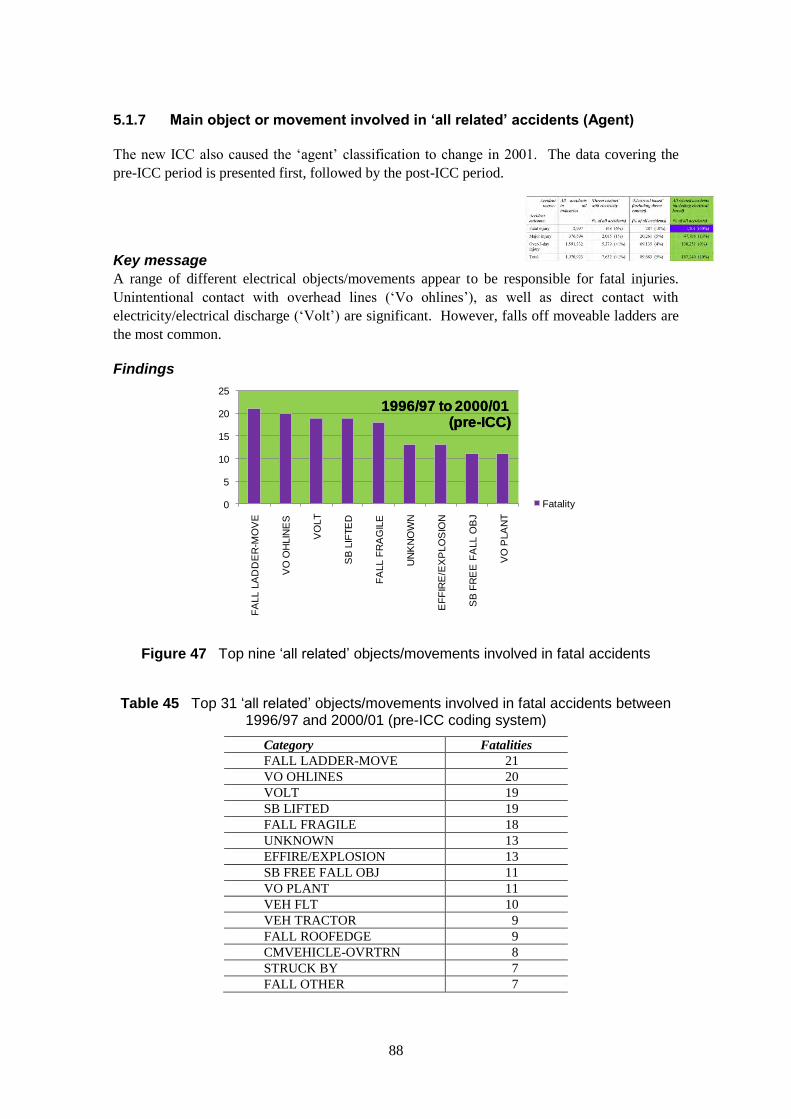
Main object or movement involved in ‘all related’ accidents (Agent)
The new ICC also caused the ‘agent’ classification to change in 2001. The data covering the
pre-ICC period is presented first, followed by the post-ICC period.
Key message
A range of different electrical objects/movements appear to be responsible for fatal injuries.
contact with overhead lines (‘Vo ohlines’), as well as direct contact with
electricity/electrical discharge (‘Volt’) are significant. However, falls off moveable ladders are
the most common.
0
5
10
15
20
25
FA
LL L
AD
DE
R-M
OV
E
VO
OH
LIN
ES
VO
LT
SB
LIF
TE
D
FA
LL F
RA
GIL
E
UN
KN
OW
N
EF
FIR
E/E
XP
LO
SIO
N
SB
FR
EE
FA
LL O
BJ
VO
PLA
NT
Fatality
1996/97 to 2000/01 (pre-ICC)
1996/97 to 2000/01 (pre-ICC)
5.1.7
Unintentional
Findings
Figure 47 Top nine „all related‟ objects/movements involved in fatal accidents
Table 45 Top 31 „all related‟ objects/movements involved in fatal accidents between 1996/97 and 2000/01 (pre-ICC coding system)
Category Fatalities
FALL LADDER-MOVE 21
VO OHLINES 20
VOLT 19
SB LIFTED 19
FALL FRAGILE 18
UNKNOWN 13
EFFIRE/EXPLOSION 13
SB FREE FALL OBJ 11
VO PLANT 11
VEH FLT 10
VEH TRACTOR 9
FALL ROOFEDGE 9
CMVEHICLE-OVRTRN 8
STRUCK BY 7
FALL OTHER 7
88

Category Fatalities
FALL STRUCT 7
FALL TOWER 7
SB BUILDING 7
FALL SCAFFOLD 7
AD WATER 7
AS ASPHYXIATION 6
VEH GOODS HGV 6
VO DOMESTIC 6
FALL VEHICLE_OTH 6
MLC FLT-MACH 6
VO UGCABLES 5
VO HANDTOOL 5
MAGTRCTOR-WH-MCH 5
VEH PRIVATE CAR 5
CM PLANT 5
SB ARTICLE 5
Grand Total 290
Figure 47 and Table 45 show that falls off moveable ladders (including step ladders) are the
category of object/movement responsible for most fatal injuries (21). However, electricity
related objects/movements contribute a similar number of fatal accidents, specifically ‘Vo
ohlines’ - unintentional contact overhead power lines (20) and ‘Volt’ - direct contact with
electricity/electrical discharge (19).
89
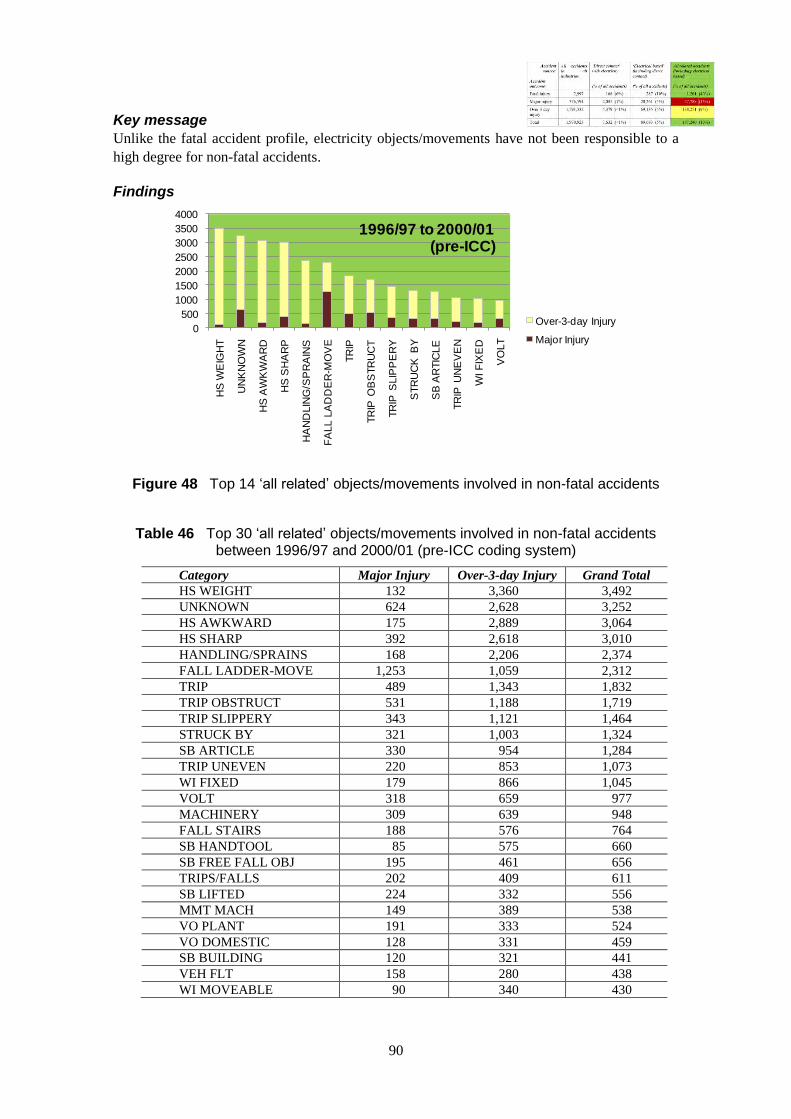
Key message
Unlike the fatal accident profile, electricity objects/movements have not been responsible to a
high degree for non-fatal accidents.
Findings
0
500
1000
1500
2000
2500
3000
3500
4000H
S W
EIG
HT
UN
KN
OW
N
HS
AW
KW
AR
D
HS
SH
AR
P
HA
ND
LIN
G/S
PR
AIN
S
FA
LL L
AD
DE
R-M
OV
E
TR
IP
TR
IP O
BS
TR
UC
T
TR
IP S
LIP
PE
RY
STR
UC
K B
Y
SB
AR
TIC
LE
TR
IP U
NE
VE
N
WI F
IXE
D
VO
LT
Over-3-day Injury
Major Injury
1996/97 to 2000/01 (pre-ICC)
Figure 48 Top 14 „all related‟ objects/movements involved in non-fatal accidents
Table 46 Top 30 „all related‟ objects/movements involved in non-fatal accidents between 1996/97 and 2000/01 (pre-ICC coding system)
Category Major Injury Over-3-day Injury Grand Total
HS WEIGHT 132 3,360 3,492
UNKNOWN 624 2,628 3,252
HS AWKWARD 175 2,889 3,064
HS SHARP 392 2,618 3,010
HANDLING/SPRAINS 168 2,206 2,374
FALL LADDER-MOVE 1,253 1,059 2,312
TRIP 489 1,343 1,832
TRIP OBSTRUCT 531 1,188 1,719
TRIP SLIPPERY 343 1,121 1,464
STRUCK BY 321 1,003 1,324
SB ARTICLE 330 954 1,284
TRIP UNEVEN 220 853 1,073
WI FIXED 179 866 1,045
VOLT 318 659 977
MACHINERY 309 639 948
FALL STAIRS 188 576 764
SB HANDTOOL 85 575 660
SB FREE FALL OBJ 195 461 656
TRIPS/FALLS 202 409 611
SB LIFTED 224 332 556
MMT MACH 149 389 538
VO PLANT 191 333 524
VO DOMESTIC 128 331 459
SB BUILDING 120 321 441
VEH FLT 158 280 438
WI MOVEABLE 90 340 430
90
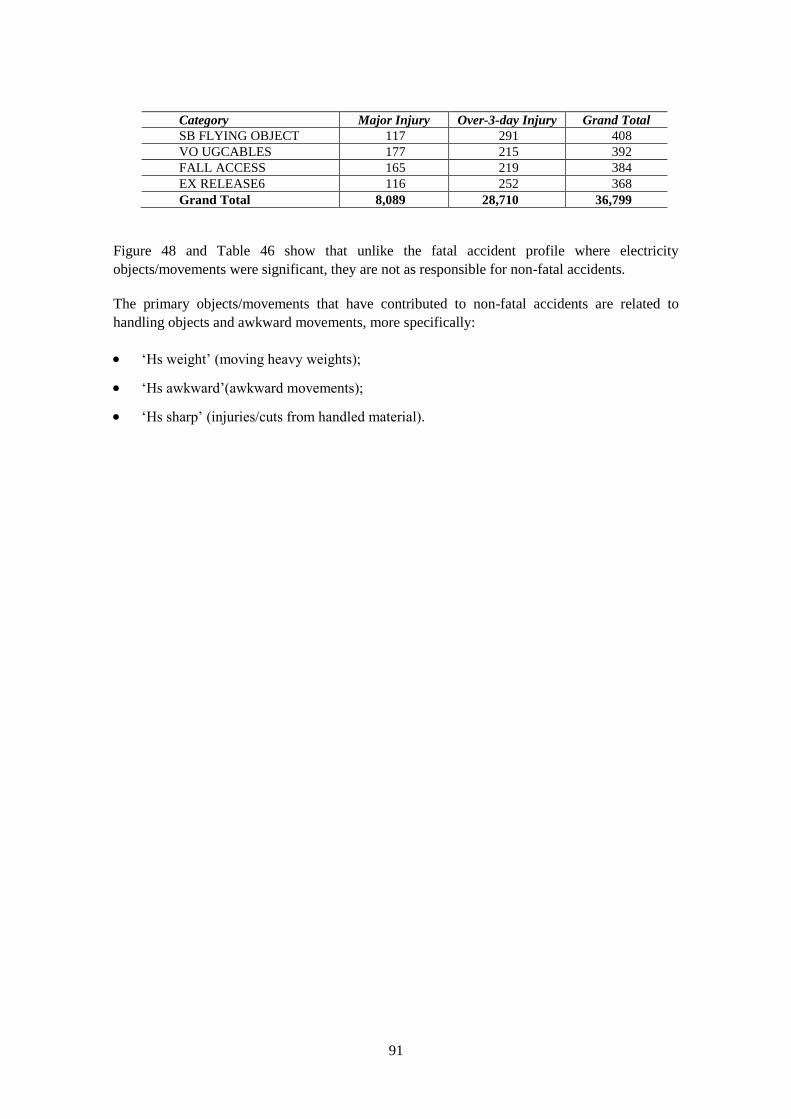
Category Major Injury Over-3-day Injury Grand Total
SB FLYING OBJECT 117 291 408
VO UGCABLES 177 215 392
FALL ACCESS 165 219 384
EX RELEASE6 116 252 368
Grand Total 8,089 28,710 36,799
Figure 48 and Table 46 show that unlike the fatal accident profile where electricity
objects/movements were significant, they are not as responsible for non-fatal accidents.
The primary objects/movements that have contributed to non-fatal accidents are related to
handling objects and awkward movements, more specifically:
‘Hs weight’ (moving heavy weights);
‘Hs awkward’(awkward movements);
‘Hs sharp’ (injuries/cuts from handled material).
91
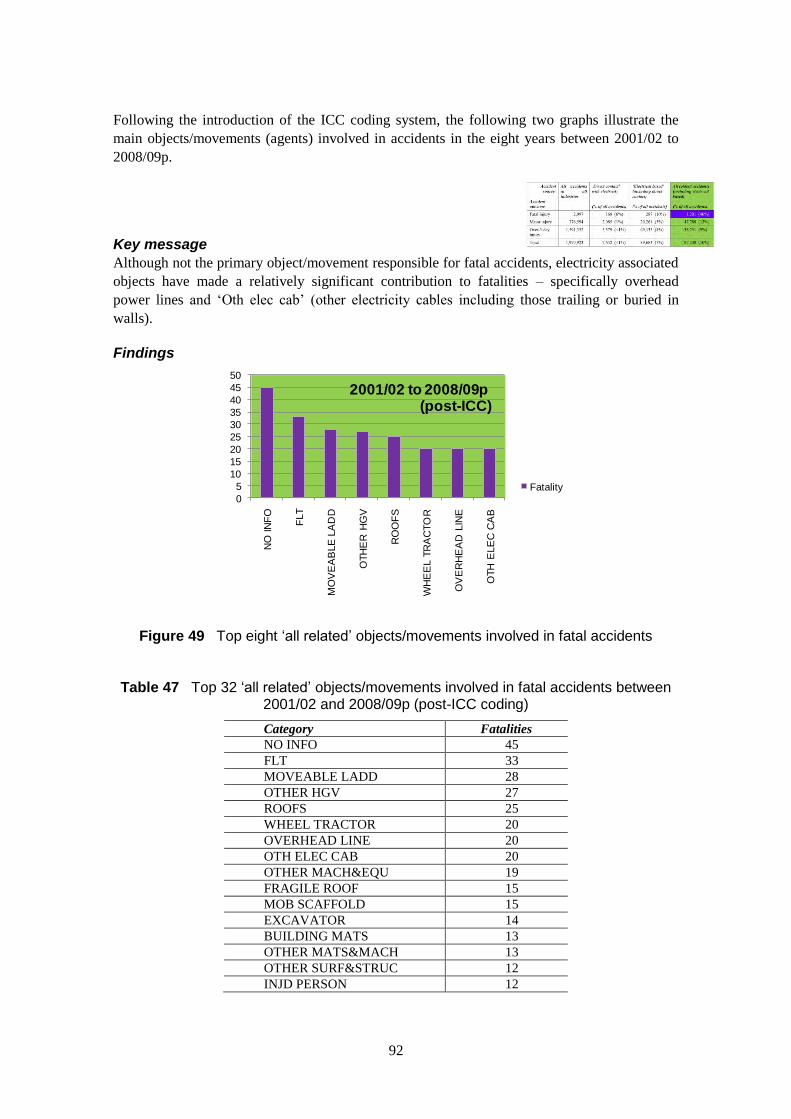
Following the introduction of the ICC coding system, the following two graphs illustrate the
main objects/movements (agents) involved in accidents in the eight years between 2001/02 to
Although not the primary object/movement responsible for fatal accidents, electricity associated
made a relatively significant contribution to fatalities specifically overhead
‘Oth elec cab’ (other electricity cables including those trailing or buried in
0
5
10
15
20
25
30
35
40
45
50
NO
IN
FO
FLT
MO
VE
AB
LE
LA
DD
OTH
ER
HG
V
RO
OF
S
WH
EE
L T
RA
CTO
R
OV
ER
HE
AD
LIN
E
OTH
ELE
C C
AB
Fatality
2001/02 to 2008/09p (post-ICC)
2008/09p.
Key message
objects have –power lines and walls).
Findings
Figure 49 Top eight „all related‟ objects/movements involved in fatal accidents
Table 47 Top 32 „all related‟ objects/movements involved in fatal accidents between 2001/02 and 2008/09p (post-ICC coding)
Category Fatalities
NO INFO 45
FLT 33
MOVEABLE LADD 28
OTHER HGV 27
ROOFS 25
WHEEL TRACTOR 20
OVERHEAD LINE 20
OTH ELEC CAB 20
OTHER MACH&EQU 19
FRAGILE ROOF 15
MOB SCAFFOLD 15
EXCAVATOR 14
BUILDING MATS 13
OTHER MATS&MACH 13
OTHER SURF&STRUC 12
INJD PERSON 12
92
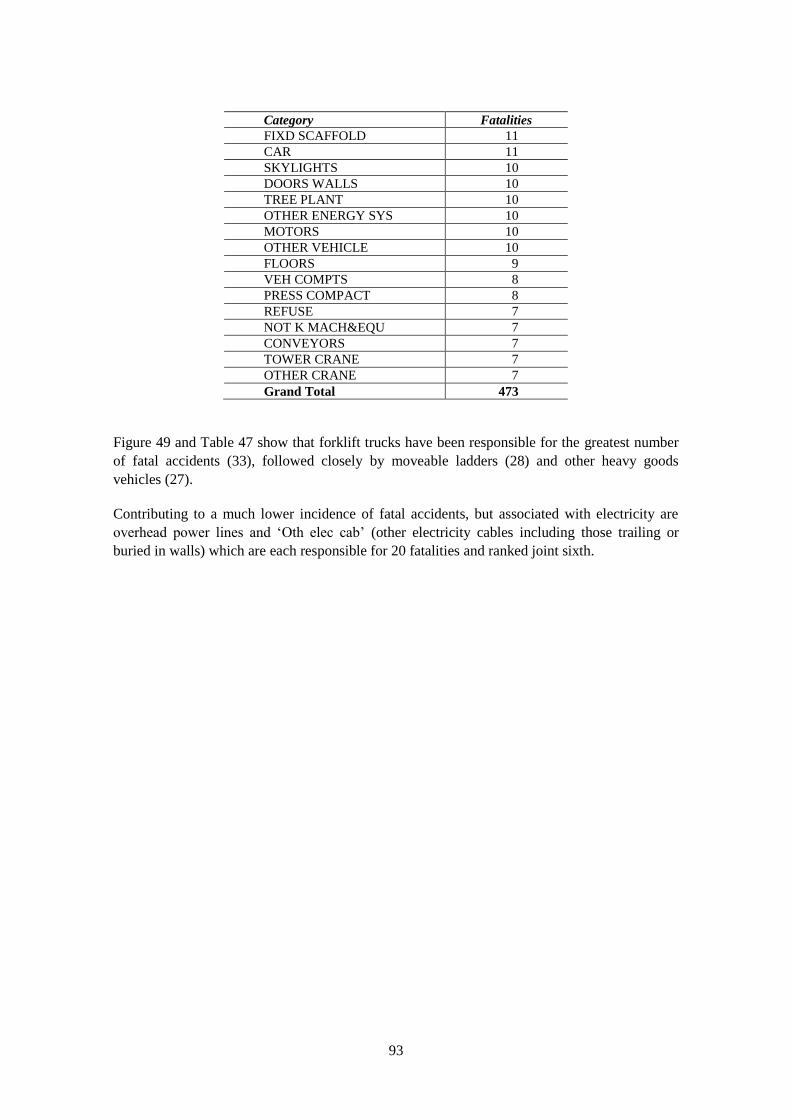
Category Fatalities
FIXD SCAFFOLD 11
CAR 11
SKYLIGHTS 10
DOORS WALLS 10
TREE PLANT 10
OTHER ENERGY SYS 10
MOTORS 10
OTHER VEHICLE 10
FLOORS 9
VEH COMPTS 8
PRESS COMPACT 8
REFUSE 7
NOT K MACH&EQU 7
CONVEYORS 7
TOWER CRANE 7
OTHER CRANE 7
Grand Total 473
Figure 49 and Table 47 show that forklift trucks have been responsible for the greatest number
of fatal accidents (33), followed closely by moveable ladders (28) and other heavy goods
vehicles (27).
Contributing to a much lower incidence of fatal accidents, but associated with electricity are
overhead power lines and ‘Oth elec cab’ (other electricity cables including those trailing or
buried in walls) which are each responsible for 20 fatalities and ranked joint sixth.
93
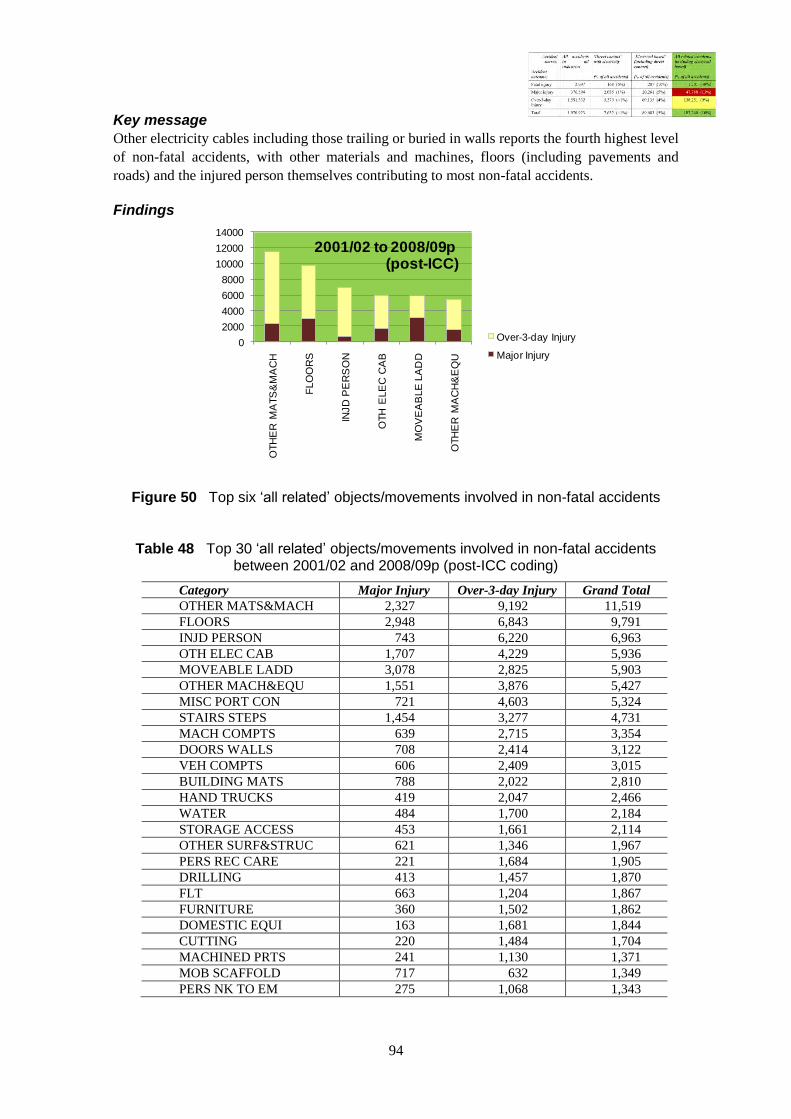
Key message
Other electricity cables including those trailing or buried in walls reports the fourth highest level
accidents, with other materials and machines, floors (including pavements and
roads) and the injured person themselves contributing to most non-fatal accidents.
0
2000
4000
6000
8000
10000
12000
14000
OTH
ER
MA
TS
&M
AC
H
FLO
OR
S
INJD
PE
RS
ON
OTH
ELE
C C
AB
MO
VE
AB
LE
LA
DD
OTH
ER
MA
CH
&E
QU
Over-3-day Injury
Major Injury
2001/02 to 2008/09p (post-ICC)
of non-fatal
Findings
Figure 50 Top six „all related‟ objects/movements involved in non-fatal accidents
Table 48 Top 30 „all related‟ objects/movements involved in non-fatal accidents between 2001/02 and 2008/09p (post-ICC coding)
Category Major Injury Over-3-day Injury Grand Total
OTHER MATS&MACH 2,327 9,192 11,519
FLOORS 2,948 6,843 9,791
INJD PERSON 743 6,220 6,963
OTH ELEC CAB 1,707 4,229 5,936
MOVEABLE LADD 3,078 2,825 5,903
OTHER MACH&EQU 1,551 3,876 5,427
MISC PORT CON 721 4,603 5,324
STAIRS STEPS 1,454 3,277 4,731
MACH COMPTS 639 2,715 3,354
DOORS WALLS 708 2,414 3,122
VEH COMPTS 606 2,409 3,015
BUILDING MATS 788 2,022 2,810
HAND TRUCKS 419 2,047 2,466
WATER 484 1,700 2,184
STORAGE ACCESS 453 1,661 2,114
OTHER SURF&STRUC 621 1,346 1,967
PERS REC CARE 221 1,684 1,905
DRILLING 413 1,457 1,870
FLT 663 1,204 1,867
FURNITURE 360 1,502 1,862
DOMESTIC EQUI 163 1,681 1,844
CUTTING 220 1,484 1,704
MACHINED PRTS 241 1,130 1,371
MOB SCAFFOLD 717 632 1,349
PERS NK TO EM 275 1,068 1,343
94
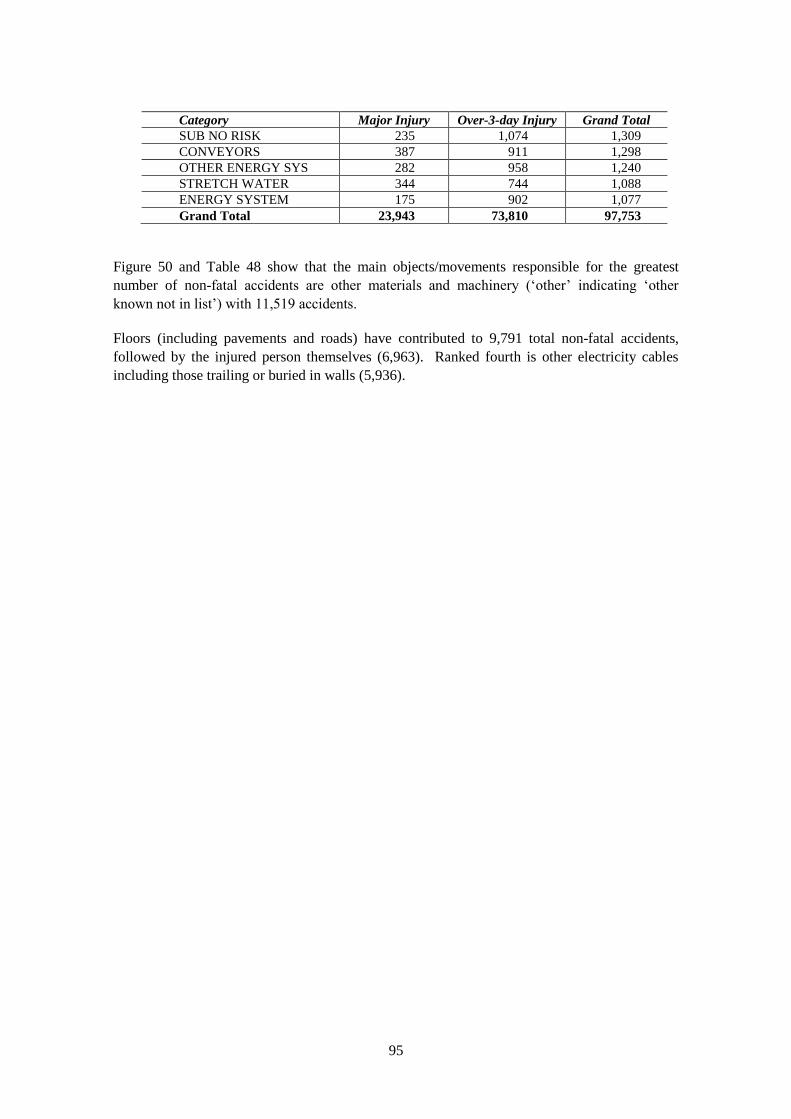
Category Major Injury Over-3-day Injury Grand Total
SUB NO RISK 235 1,074 1,309
CONVEYORS 387 911 1,298
OTHER ENERGY SYS 282 958 1,240
STRETCH WATER 344 744 1,088
ENERGY SYSTEM 175 902 1,077
Grand Total 23,943 73,810 97,753
Figure 50 and Table 48 show that the main objects/movements responsible for the greatest
number of non-fatal accidents are other materials and machinery (‘other’ indicating ‘other
known not in list’) with 11,519 accidents.
Floors (including pavements and roads) have contributed to 9,791 total non-fatal accidents,
followed by the injured person themselves (6,963). Ranked fourth is other electricity cables
including those trailing or buried in walls (5,936).
95
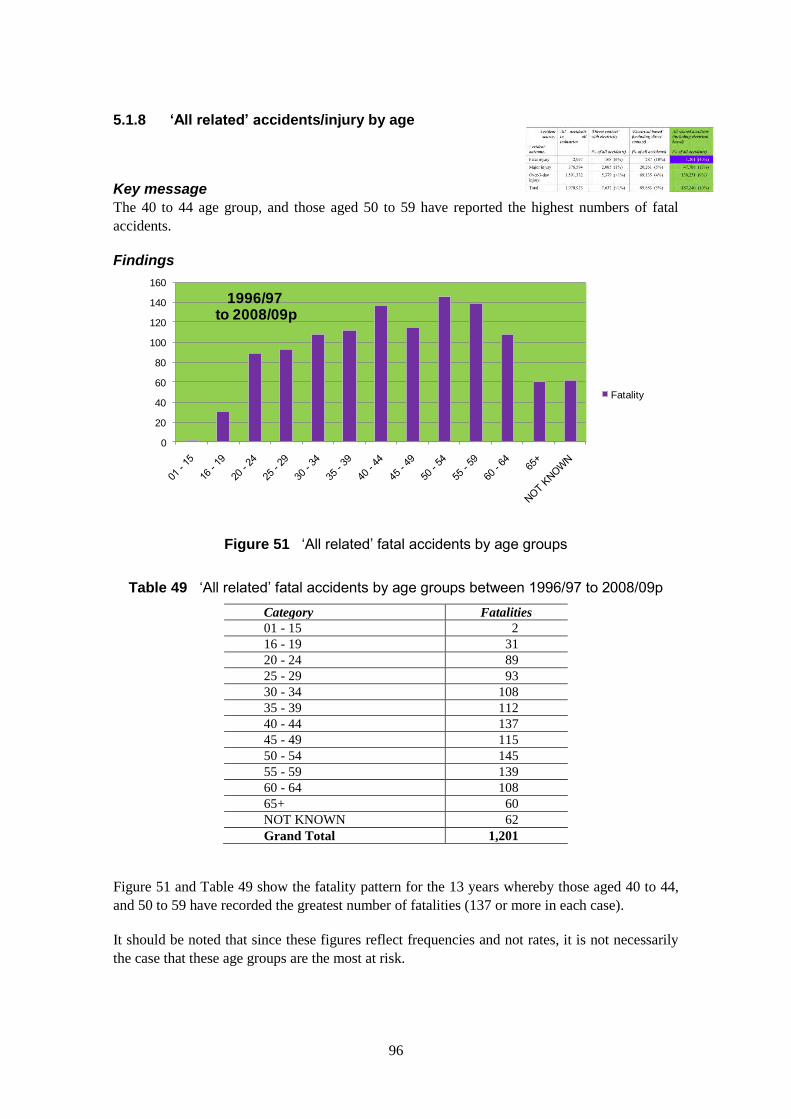
5.1.8 ‘All related’ accidents/injury by age
Key message
The 40 to 44 age group, and those aged 50 to 59 have reported the highest numbers of fatal
accidents.
Findings
0
20
40
60
80
100
120
140
160
Fatality
1996/97 to 2008/09p
Figure 51 „All related‟ fatal accidents by age groups
Table 49 „All related‟ fatal accidents by age groups between 1996/97 to 2008/09p
Category Fatalities
01 - 15 2
16 - 19 31
20 - 24 89
25 - 29 93
30 - 34 108
35 - 39 112
40 - 44 137
45 - 49 115
50 - 54 145
55 - 59 139
60 - 64 108
65+ 60
NOT KNOWN 62
Grand Total 1,201
Figure 51 and Table 49 show the fatality pattern for the 13 years whereby those aged 40 to 44,
and 50 to 59 have recorded the greatest number of fatalities (137 or more in each case).
It should be noted that since these figures reflect frequencies and not rates, it is not necessarily
the case that these age groups are the most at risk.
96

Key message
Increasing numbers of non-fatal injuries from around 16 years until around 35 to 39 years of
age, with subsequent decrease in accidents thereafter.
Findings
0
5000
10000
15000
20000
25000
Over-3-day Injury
Major Injury
1996/97 to 2008/09p
Figure 52 „All related‟ non-fatal accidents by age groups
Table 50 „All related‟ non-fatal accidents by age groups between 1996/97 to 2008/09p
Category Major Injury Over-3-day Injury Grand Total
01 - 15 26 23 49
16 - 19 2,112 5,331 7,443
20 - 24 4,315 12,258 16,573
25 - 29 4,859 14,259 19,118
30 - 34 5,257 16,298 21,555
35 - 39 5,331 17,599 22,930
40 - 44 5,013 16,722 21,735
45 - 49 4,821 15,270 20,091
50 - 54 4,766 13,346 18,112
55 - 59 4,055 10,294 14,349
60 - 64 2,263 5,387 7,650
65+ 435 501 936
NOT KNOWN 4,535 10,963 15,498
Grand Total 47,788 138,251 186,039
Figure 52 and Table 50 show non-fatal injuries increase from the 16 to 19 age group (7,443
incidents) to a peak in the 35 to 39 age group (22,930 incidents), then slowly decrease thereafter
for the remaining age groups.
In terms of major injuries only, from 20 to 24 through to 55 to 59 there are over 4,000 reported
accidents in each age group.
97
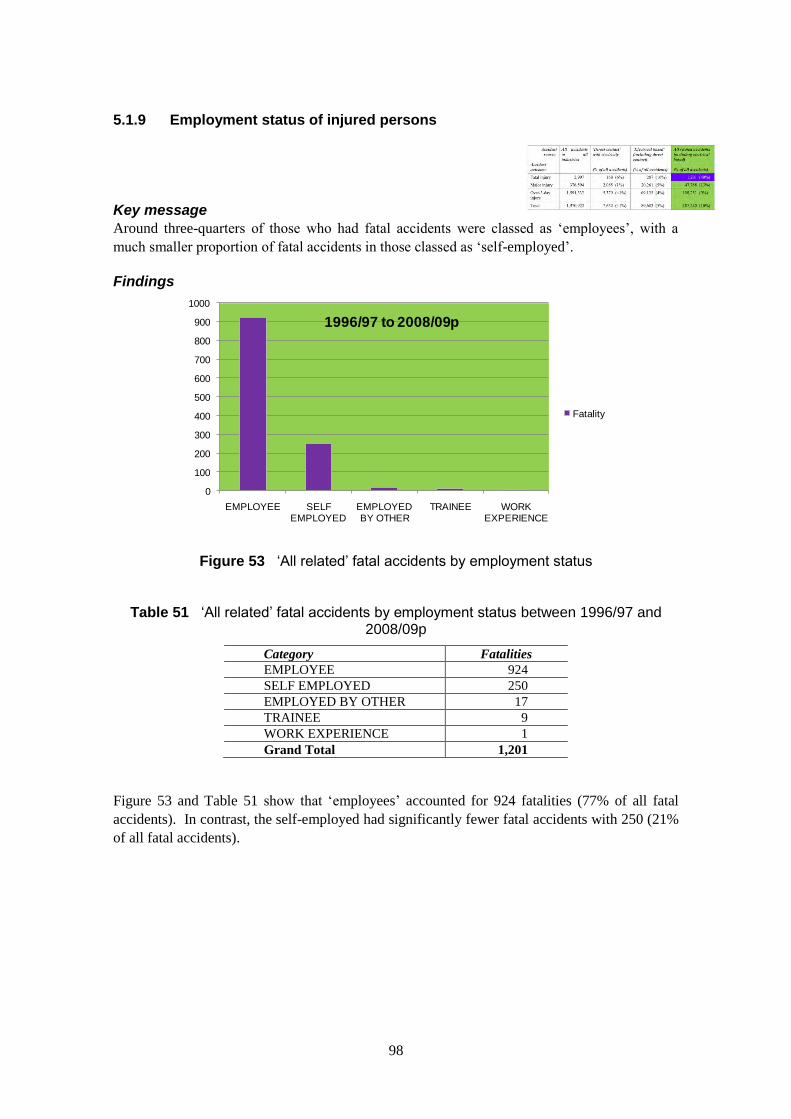
Employment status of injured persons
Key message
Around three-quarters of those who had fatal accidents were classed as ‘employees’, with a
much smaller proportion of fatal accidents in those classed as ‘self-employed’.
0
100
200
300
400
500
600
700
800
900
1000
EMPLOYEE SELF EMPLOYED
EMPLOYED BY OTHER
TRAINEE WORK EXPERIENCE
Fatality
1996/97 to 2008/09p
5.1.9
Findings
Figure 53 „All related‟ fatal accidents by employment status
Table 51 „All related‟ fatal accidents by employment status between 1996/97 and 2008/09p
Category Fatalities
EMPLOYEE 924
SELF EMPLOYED 250
EMPLOYED BY OTHER 17
TRAINEE 9
WORK EXPERIENCE 1
Grand Total 1,201
Figure 53 and Table 51 show that ‘employees’ accounted for 924 fatalities (77% of all fatal
accidents). In contrast, the self-employed had significantly fewer fatal accidents with 250 (21%
of all fatal accidents).
98
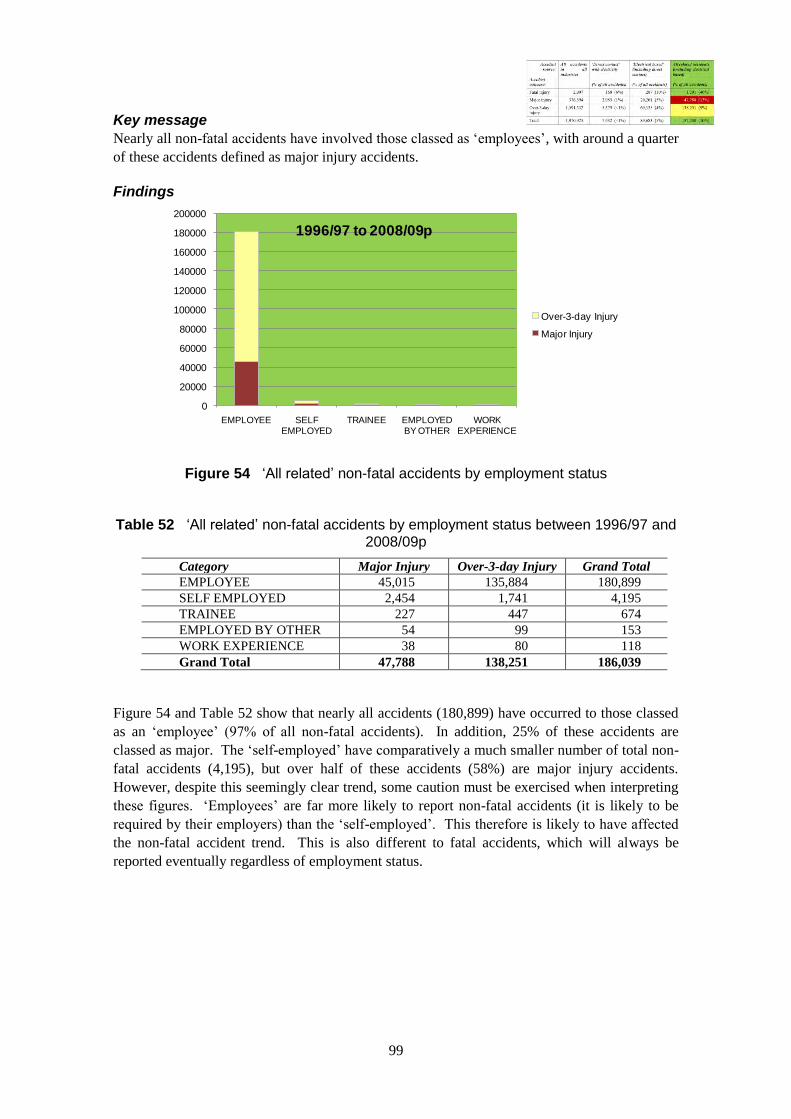
Key message
Nearly all non-fatal accidents have involved those classed as ‘employees’, with around a quarter
of these accidents defined as major injury accidents.
Findings
0
20000
40000
60000
80000
100000
120000
140000
160000
180000
200000
EMPLOYEE SELF EMPLOYED
TRAINEE EMPLOYED BY OTHER
WORK EXPERIENCE
Over-3-day Injury
Major Injury
1996/97 to 2008/09p
Figure 54 „All related‟ non-fatal accidents by employment status
Table 52 „All related‟ non-fatal accidents by employment status between 1996/97 and 2008/09p
Category Major Injury Over-3-day Injury Grand Total
EMPLOYEE 45,015 135,884 180,899
SELF EMPLOYED 2,454 1,741 4,195
TRAINEE 227 447 674
EMPLOYED BY OTHER 54 99 153
WORK EXPERIENCE 38 80 118
Grand Total 47,788 138,251 186,039
Figure 54 and Table 52 show that nearly all accidents (180,899) have occurred to those classed
as an ‘employee’ (97% of all non-fatal accidents). In addition, 25% of these accidents are
classed as major. The ‘self-employed’ have comparatively a much smaller number of total non-
fatal accidents (4,195), but over half of these accidents (58%) are major injury accidents.
However, despite this seemingly clear trend, some caution must be exercised when interpreting
these figures. ‘Employees’ are far more likely to report non-fatal accidents (it is likely to be
required by their employers) than the ‘self-employed’. This therefore is likely to have affected
the non-fatal accident trend. This is also different to fatal accidents, which will always be
reported eventually regardless of employment status.
99
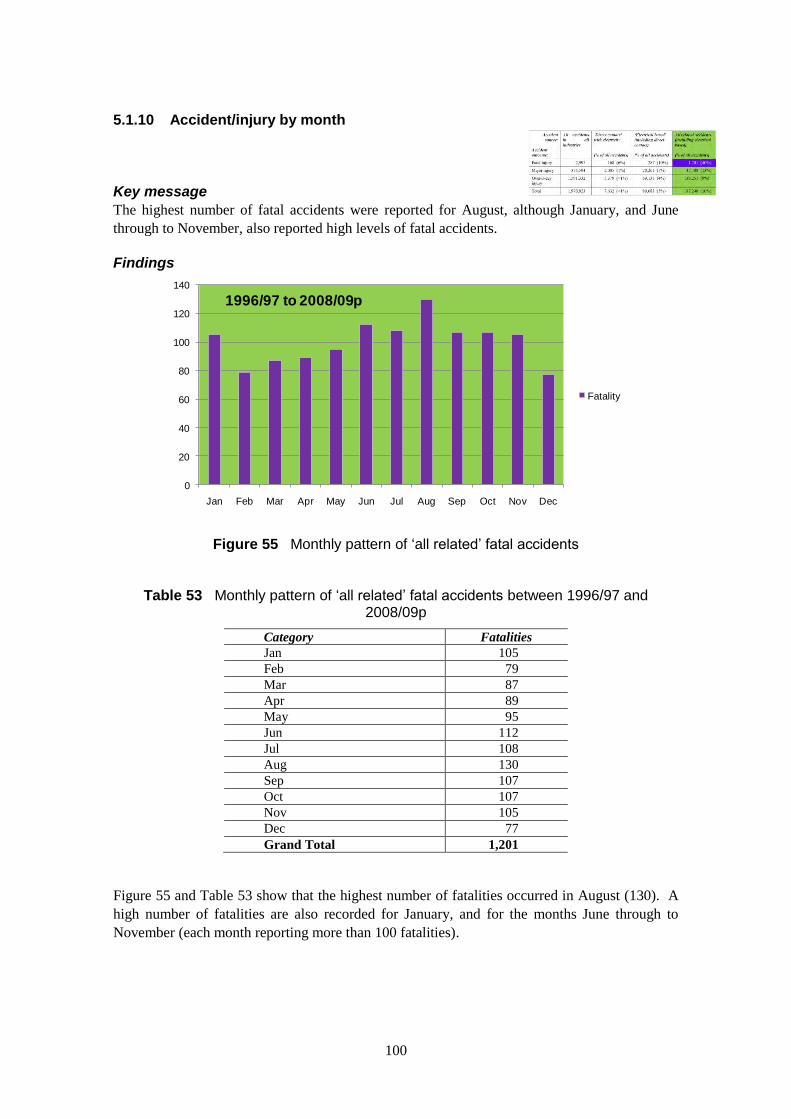
Accident/injury by month
Key message
The highest number of fatal accidents were reported for August, although January, and June
through to November, also reported high levels of fatal accidents.
Findings
0
20
40
60
80
100
120
140
Jan Feb Mar Apr May Jun Jul Aug Sep Oct Nov Dec
Fatality
1996/97 to 2008/09p
5.1.10
Figure 55 Monthly pattern of „all related‟ fatal accidents
Table 53 Monthly pattern of „all related‟ fatal accidents between 1996/97 and 2008/09p
Category Fatalities
Jan 105
Feb 79
Mar 87
Apr 89
May 95
Jun 112
Jul 108
Aug 130
Sep 107
Oct 107
Nov 105
Dec 77
Grand Total 1,201
Figure 55 and Table 53 show that the highest number of fatalities occurred in August (130). A
high number of fatalities are also recorded for January, and for the months June through to
November (each month reporting more than 100 fatalities).
100
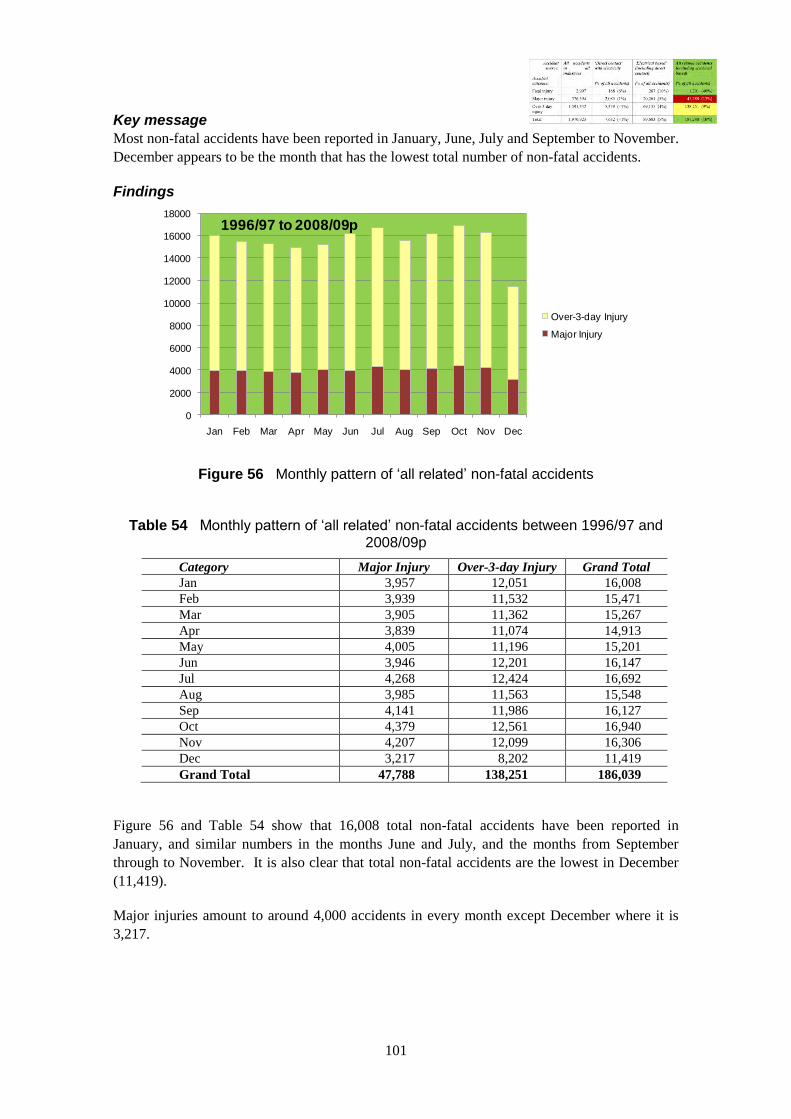
Key message
Most non-fatal accidents have been reported in January, June, July and September to November.
December appears to be the month that has the lowest total number of non-fatal accidents.
Findings
0
2000
4000
6000
8000
10000
12000
14000
16000
18000
Jan Feb Mar Apr May Jun Jul Aug Sep Oct Nov Dec
Over-3-day Injury
Major Injury
1996/97 to 2008/09p
Figure 56 Monthly pattern of „all related‟ non-fatal accidents
Table 54 Monthly pattern of „all related‟ non-fatal accidents between 1996/97 and 2008/09p
Category Major Injury Over-3-day Injury Grand Total
Jan 3,957 12,051 16,008
Feb 3,939 11,532 15,471
Mar 3,905 11,362 15,267
Apr 3,839 11,074 14,913
May 4,005 11,196 15,201
Jun 3,946 12,201 16,147
Jul 4,268 12,424 16,692
Aug 3,985 11,563 15,548
Sep 4,141 11,986 16,127
Oct 4,379 12,561 16,940
Nov 4,207 12,099 16,306
Dec 3,217 8,202 11,419
Grand Total 47,788 138,251 186,039
Figure 56 and Table 54 show that 16,008 total non-fatal accidents have been reported in
January, and similar numbers in the months June and July, and the months from September
through to November. It is also clear that total non-fatal accidents are the lowest in December
(11,419).
Major injuries amount to around 4,000 accidents in every month except December where it is
3,217.
101
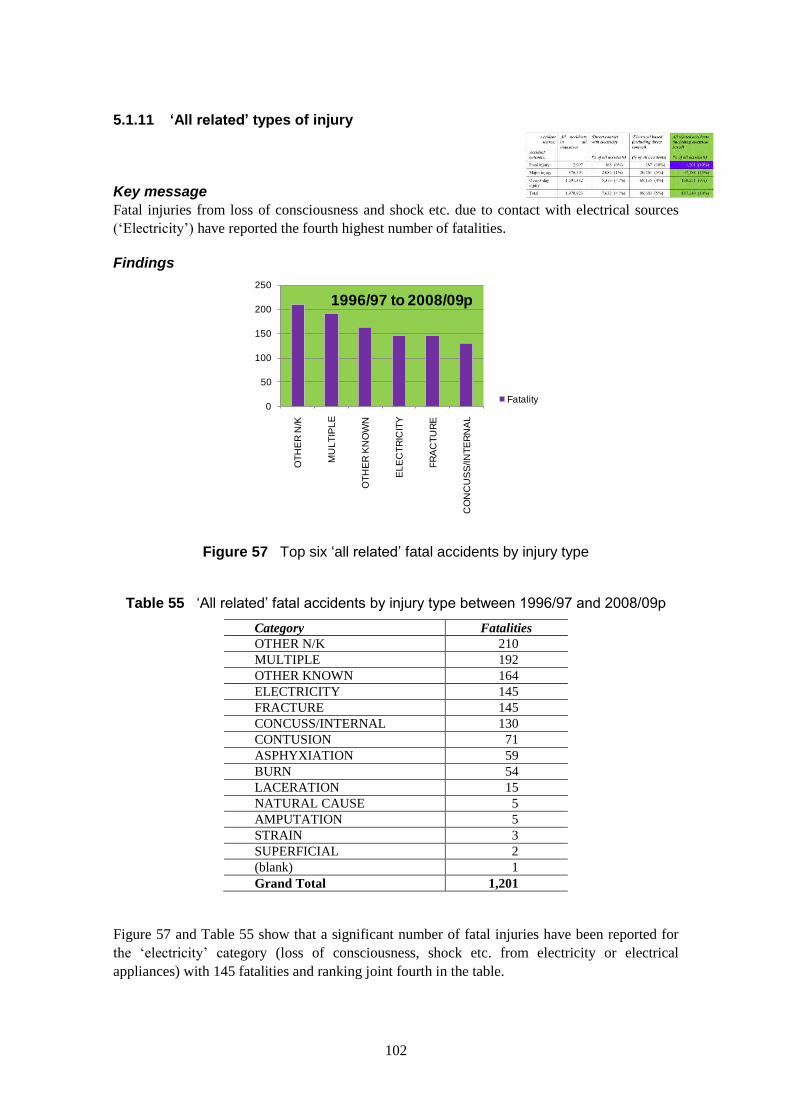
ll related’ types of injury
Fatal injuries from loss of consciousness and shock etc. due to contact with electrical sources
have reported the fourth highest number of fatalities.
0
50
100
150
200
250O
TH
ER
N/K
MU
LT
IPL
E
OT
HE
R K
NO
WN
EL
EC
TR
ICIT
Y
FR
AC
TU
RE
CO
NC
US
S/IN
TE
RN
AL
Fatality
1996/97 to 2008/09p
5.1.11 ‘A
Key message
(‘Electricity’)
Findings
Figure 57 Top six „all related‟ fatal accidents by injury type
Table 55 „All related‟ fatal accidents by injury type between 1996/97 and 2008/09p
Category Fatalities
OTHER N/K 210
MULTIPLE 192
OTHER KNOWN 164
ELECTRICITY 145
FRACTURE 145
CONCUSS/INTERNAL 130
CONTUSION 71
ASPHYXIATION 59
BURN 54
LACERATION 15
NATURAL CAUSE 5
AMPUTATION 5
STRAIN 3
SUPERFICIAL 2
(blank) 1
Grand Total 1,201
Figure 57 and Table 55 show that a significant number of fatal injuries have been reported for
the ‘electricity’ category (loss of consciousness, shock etc. from electricity or electrical
appliances) with 145 fatalities and ranking joint fourth in the table.
102
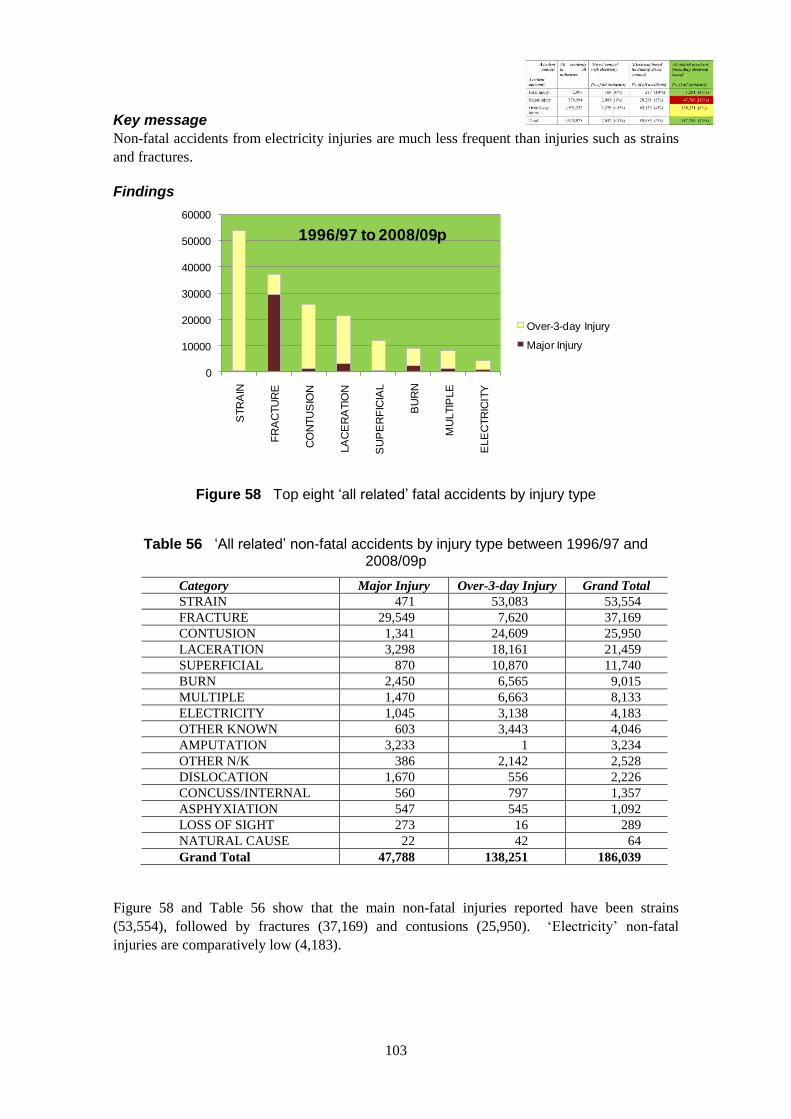
Key message
Non-fatal accidents from electricity injuries are much less frequent than injuries such as strains
and fractures.
Findings
0
10000
20000
30000
40000
50000
60000
STR
AIN
FR
AC
TU
RE
CO
NTU
SIO
N
LA
CE
RA
TIO
N
SU
PE
RF
ICIA
L
BU
RN
MU
LTIP
LE
ELE
CTR
ICIT
Y
Over-3-day Injury
Major Injury
1996/97 to 2008/09p
Figure 58 Top eight „all related‟ fatal accidents by injury type
Table 56 „All related‟ non-fatal accidents by injury type between 1996/97 and 2008/09p
Category Major Injury Over-3-day Injury Grand Total
STRAIN 471 53,083 53,554
FRACTURE 29,549 7,620 37,169
CONTUSION 1,341 24,609 25,950
LACERATION 3,298 18,161 21,459
SUPERFICIAL 870 10,870 11,740
BURN 2,450 6,565 9,015
MULTIPLE 1,470 6,663 8,133
ELECTRICITY 1,045 3,138 4,183
OTHER KNOWN 603 3,443 4,046
AMPUTATION 3,233 1 3,234
OTHER N/K 386 2,142 2,528
DISLOCATION 1,670 556 2,226
CONCUSS/INTERNAL 560 797 1,357
ASPHYXIATION 547 545 1,092
LOSS OF SIGHT 273 16 289
NATURAL CAUSE 22 42 64
Grand Total 47,788 138,251 186,039
Figure 58 and Table 56 show that the main non-fatal injuries reported have been strains
(53,554), followed by fractures (37,169) and contusions (25,950). ‘Electricity’ non-fatal
injuries are comparatively low (4,183).
103

5.1.12 Accidents by region
Key message
The ‘East and South East’ region reports the highest fatal accident numbers followed closely by
the ‘Midlands’.
Findings
0
50
100
150
200
250
300
Ea
st a
nd
So
uth
Ea
st
Mid
lan
ds
Wa
les a
nd
So
uth
We
st
Yo
rksh
ire
an
d N
ort
h E
ast
Sco
tla
nd
No
rth
We
st
Lo
nd
on
Fatality
1996/97 to 2008/09p
Figure 59 „All related‟ fatal accidents reported by region
Table 57 „All related‟ fatal accidents reported by region between 1996/97 and 2008/09p
Category Fatalities
East and South East 243
Midlands 222
Wales and South West 190
Yorkshire and North East 161
Scotland 159
North West 130
London 96
Grand Total 1,201
Figure 59 and Table 57 show that the ‘East and South East’ has the highest total number of fatal
accidents (243). The ‘Midlands’ has the second highest numbers of fatalities (222) followed by
‘Wales and South West’ (190).
104
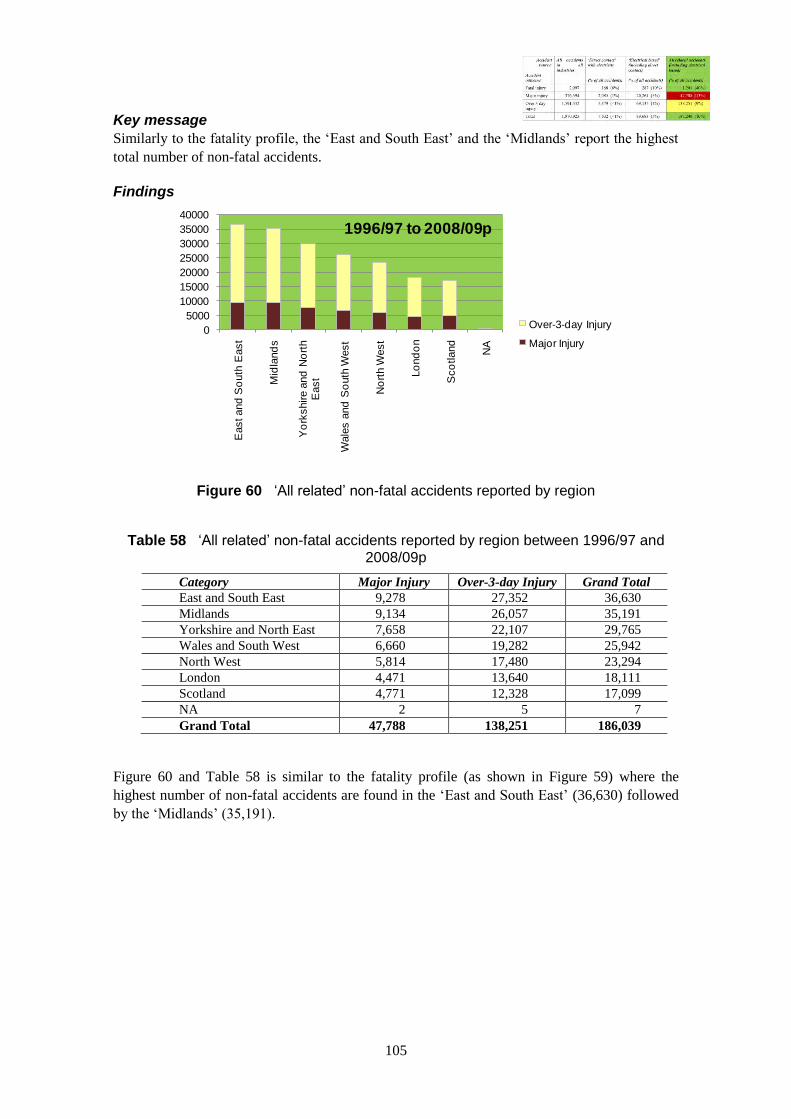
Key message
Similarly to the fatality profile, the ‘East and South East’ and the ‘Midlands’ report the highest
total number of non-fatal accidents.
Findings
0
5000
10000
15000
20000
25000
30000
35000
40000
East and
So
uth
East
Mid
land
s
Yo
rkshire a
nd
No
rth
East
Wale
s a
nd
So
uth
West
No
rth W
est
Lo
nd
on
Sco
tland
NA
Over-3-day Injury
Major Injury
1996/97 to 2008/09p
Figure 60 „All related‟ non-fatal accidents reported by region
Table 58 „All related‟ non-fatal accidents reported by region between 1996/97 and 2008/09p
Category Major Injury Over-3-day Injury Grand Total
East and South East 9,278 27,352 36,630
Midlands 9,134 26,057 35,191
Yorkshire and North East 7,658 22,107 29,765
Wales and South West 6,660 19,282 25,942
North West 5,814 17,480 23,294
London 4,471 13,640 18,111
Scotland 4,771 12,328 17,099
NA 2 5 7
Grand Total 47,788 138,251 186,039
Figure 60 and Table 58 is similar to the fatality profile (as shown in Figure 59) where the
highest number of non-fatal accidents are found in the ‘East and South East’ (36,630) followed
by the ‘Midlands’ (35,191).
105

Breaking down the information further into local authority level, generates the following results.
Key message
Manchester has reported the highest number of fatal accidents, with Sandwell and Birmingham
reporting the joint second highest number of fatalities.
0
5
10
15
20
25
MA
NC
HE
STE
R
SA
ND
WE
LL
BIR
MIN
GH
AM
SH
EF
FIE
LD
CA
RD
IFF
UA
BR
ISTO
L U
A
NE
ATH
+P
T T
ALB
UA
GLA
SG
OW
UA
BO
LTO
N
N L
AN
AR
KS
HIR
E U
A
CIT
Y W
ES
TM
INS
TE
R
Fatality
1996/97 to 2008/09p
Findings
Figure 61 Top 11 „all related‟ fatal accidents reported by local authority
Table 59 Top 38 „all related‟ fatal accidents reported by local authority between 1996/97 and 2008/09p
Category Fatalities
MANCHESTER 21
SANDWELL 16
BIRMINGHAM 16
SHEFFIELD 15
CARDIFF UA 14
BRISTOL UA 13
NEATH+PT TALB UA 12
GLASGOW UA 12
BOLTON 11
N LANARKSHIRE UA 11
CITY WESTMINSTER 11
ABERDEENSHIRE UA 10
POWYS UA 9
BRADFORD 9
TOWER HAMLETS 9
FIFE UA 9
BORDERS UA 9
SLOUGH UA 9
DUMF + GALWAY UA 9
ABERDEEN CITY UA 9
106

Category Fatalities
HEREFORDSHIRE UA 8
WOLVERHAMPTON 8
SEFTON 8
NE LINCS 8
DONCASTER 8
PLYMOUTH UA 8
PERTH/KINROSS UA 7
NORTH TYNESIDE 7
EDINBURGH UA 7
AYLESBURY VALE 7
HIGHLAND UA 7
MENDIP 7
STOKE ON TRENT 7
S LANARKSHIRE UA 7
WEST LANCASHIRE 7
DUDLEY 7
RENFREWSHIRE UA 7
HILLINGDON 7
Grand Total 366
Figure 61and Table 59 show that Manchester has had the highest number of fatal accidents (21).
Ranked joint second is Sandwell (a metropolitan borough in the West Midlands, lying next to
the city of Birmingham) and Birmingham (16).
107
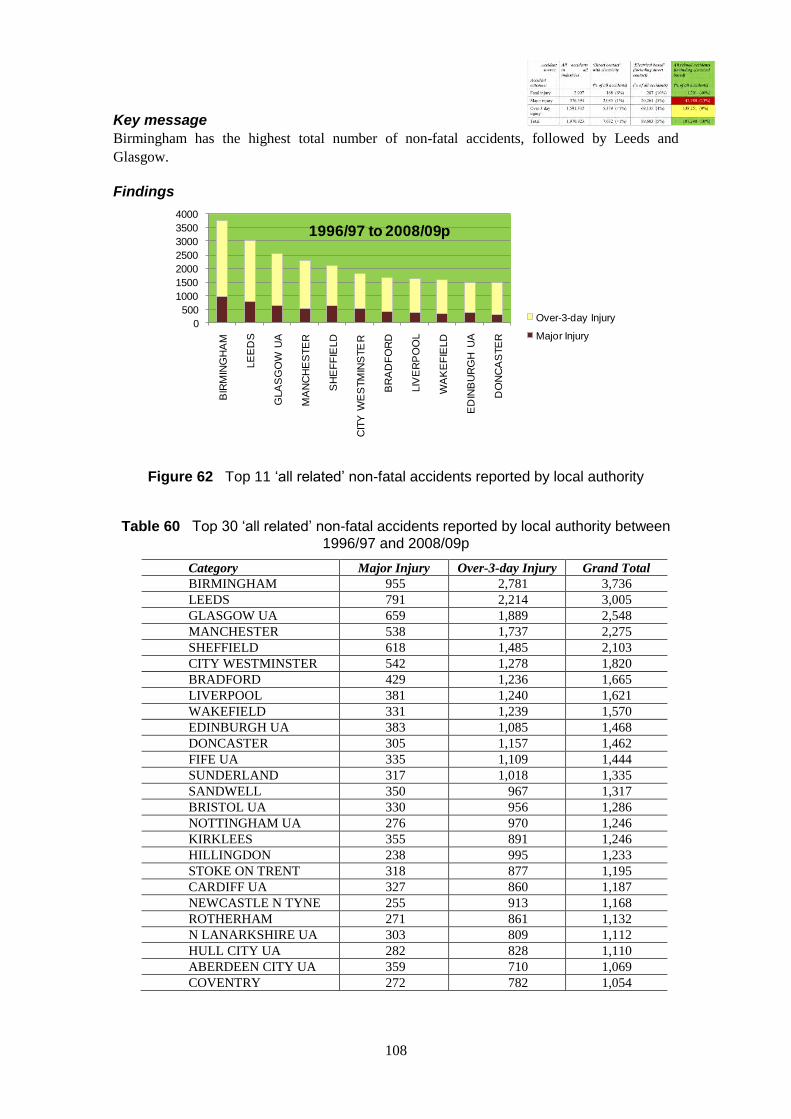
0
500
1000
1500
2000
2500
3000
3500
4000B
IRM
ING
HA
M
LE
ED
S
GLA
SG
OW
UA
MA
NC
HE
STE
R
SH
EF
FIE
LD
CIT
Y W
ES
TM
INS
TE
R
BR
AD
FO
RD
LIV
ER
PO
OL
WA
KE
FIE
LD
ED
INB
UR
GH
UA
DO
NC
AS
TE
R
Over-3-day Injury
Major Injury
1996/97 to 2008/09p
Key message
Birmingham has the highest total number of non-fatal accidents, followed by Leeds and
Glasgow.
Findings
Figure 62 Top 11 „all related‟ non-fatal accidents reported by local authority
Table 60 Top 30 „all related‟ non-fatal accidents reported by local authority between 1996/97 and 2008/09p
Category Major Injury Over-3-day Injury Grand Total
BIRMINGHAM 955 2,781 3,736
LEEDS 791 2,214 3,005
GLASGOW UA 659 1,889 2,548
MANCHESTER 538 1,737 2,275
SHEFFIELD 618 1,485 2,103
CITY WESTMINSTER 542 1,278 1,820
BRADFORD 429 1,236 1,665
LIVERPOOL 381 1,240 1,621
WAKEFIELD 331 1,239 1,570
EDINBURGH UA 383 1,085 1,468
DONCASTER 305 1,157 1,462
FIFE UA 335 1,109 1,444
SUNDERLAND 317 1,018 1,335
SANDWELL 350 967 1,317
BRISTOL UA 330 956 1,286
NOTTINGHAM UA 276 970 1,246
KIRKLEES 355 891 1,246
HILLINGDON 238 995 1,233
STOKE ON TRENT 318 877 1,195
CARDIFF UA 327 860 1,187
NEWCASTLE N TYNE 255 913 1,168
ROTHERHAM 271 861 1,132
N LANARKSHIRE UA 303 809 1,112
HULL CITY UA 282 828 1,110
ABERDEEN CITY UA 359 710 1,069
COVENTRY 272 782 1,054
108
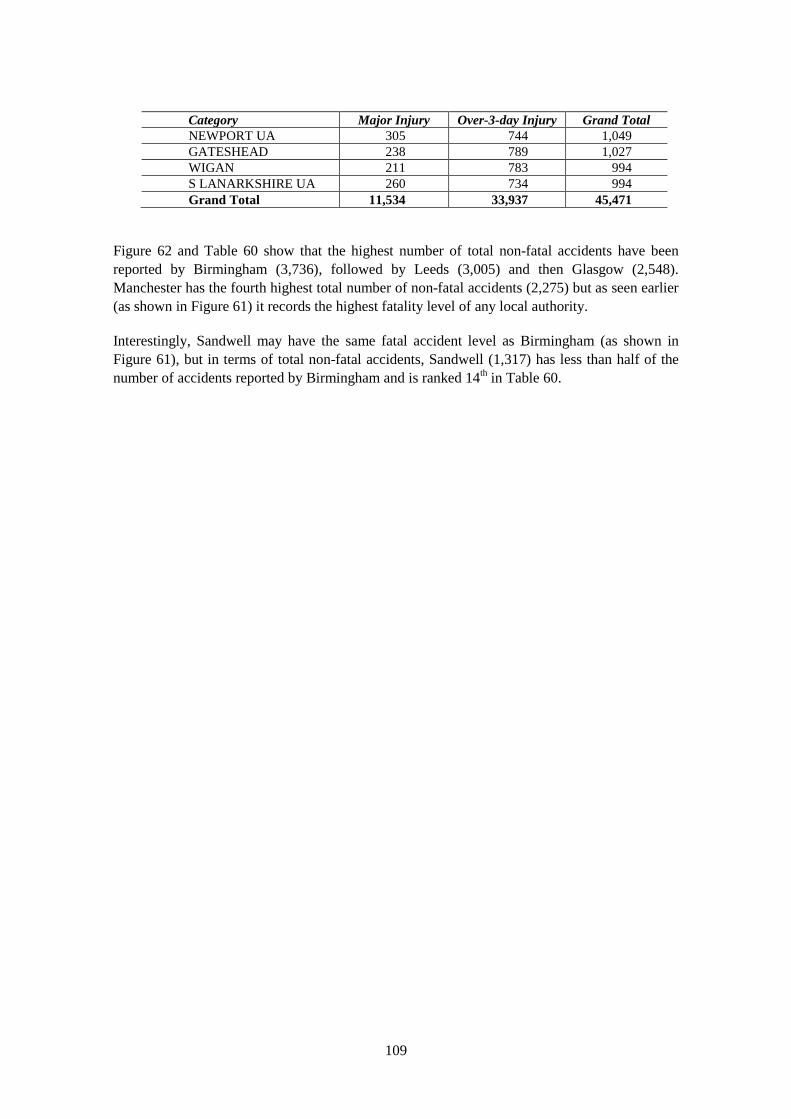
Category Major Injury Over-3-day Injury Grand Total
NEWPORT UA 305 744 1,049
GATESHEAD 238 789 1,027
WIGAN 211 783 994
S LANARKSHIRE UA 260 734 994
Grand Total 11,534 33,937 45,471
Figure 62 and Table 60 show that the highest number of total non-fatal accidents have been
reported by Birmingham (3,736), followed by Leeds (3,005) and then Glasgow (2,548).
Manchester has the fourth highest total number of non-fatal accidents (2,275) but as seen earlier
(as shown in Figure 61) it records the highest fatality level of any local authority.
Interestingly, Sandwell may have the same fatal accident level as Birmingham (as shown in
Figure 61), but in terms of total non-fatal accidents, Sandwell (1,317) has less than half of the
number of accidents reported by Birmingham and is ranked 14th in Table 60.
109
6. CONCLUSIONS
In relation to the initial project objectives, the following conclusions can be drawn from the
work undertaken in this research to:
Objective 1: Develop an electricity-related accident data set from ‘supply to switch’
to provide a baseline for measuring improvements across a range of
industry sectors.
1. A data set containing electricity-related accidents was created using workplace
accidents reported via the Reporting of Injuries, Diseases and Dangerous Occurrences
Regulations 1995 (RIDDOR).
2. The main data set contained reported accidents that were assigned an electricity-
related RIDDOR code, as well as those that were indirectly related to electricity as
their associated narrative included an electricity-related keyword. This provided the
HSE team with a broader insight into where electrical incidents are occurring and how
working with other HSE programmes (e.g. the falls team) may assist in targeting
electricity-related accidents.
3. In order to provide the HSE team with a clearer picture of electricity related accidents,
the main data set was developed into two further subsidiary data sets. In total, this
equated to three separate data sets, defined as follows:
Data set 1: ‘Direct contact’ with electricity – this data set was defined
purely by the RIDDOR accident kind categories ‘Electricity’ and ‘Volt’ (i.e.
it only included accidents reported as being either an ‘Electricity’ or ‘Volt’
accident type).
Data set 2: ‘Electrical based’ (including ‘direct contact’) – this larger data
set contained the ‘direct contact’ data set, as well as accidents reported under
other electricity-related RIDDOR categories (e.g. industries such as
electricity production, installation of wiring/fitting, manufacturing of
electrical appliances; occupations such as electrical engineers, electroplaters,
etc.).
Data set 3: ‘All related’ accidents (including ‘electrical based’) – this was
the full data set, containing the ‘electrical based’ data set (i.e. all accidents
assigned an electricity-related RIDDOR code) and accidents brought in
because their associated accident narrative (i.e. the notifier comment or
investigation report) contained an electricity related keyword (e.g. ‘spark’,
‘plug’, ‘socket’, etc.).
4. The ‘direct contact’ data set contained 7,632 reported accidents, of which 168 were
fatal injuries (accounting for 6% of fatal accidents across all industries). The
110
‘electrical based’ data set contained 287 fatal injuries, accounting for 10% of fatal
accidents across all industries and the ‘all related’ data set contained 1,201 fatal
injuries, accounting for 40% of fatal accidents across all industries. However, caution
should be exercised when interpreting the figures for the ‘all related’ data set, as this
data set does contain a number of accidents that are only indirectly related to
electricity.
5. There were also some limitations to the ‘all related’ data set as there was such high
reliance upon the quality of the text contained within notifier comments and
investigation reports. There were also limitations with the HSE’s RIDDOR data,
particularly due to changes in coding within certain RIDDOR fields during the 13-year
period.
Objective 2: Analyse the electricity-related accident data to gain an insight into what
type of accidents occur, who was involved in them and what they were
doing at the time.
‘DIRECT CONTACT’ WITH ELECTRICITY ACCIDENTS
6. 6% of all fatalities (168 deaths) over the 13 year period 1996/97 to 2008/09p, across
all industries may be due to direct contact with electricity or electrical shock (see
Table 2).
7. There is a fluctuating picture in the number of fatal accidents over the 13 year period
1996/97 to 2008/09p with a peak of 18 fatalities in 1999/2000 (see Figure 3).
8. Non-fatal injuries have steadily decreased since 1996/97 (from 746 total accidents to
424 by 2008/09p) (see Figure 4).
9. Overall, this means an average of 13 fatalities per year from 1996/97 to 2008/09p have
been caused by direct contact with electricity. Provisional data suggests that in
2008/09p there were 6 fatalities, which is the lowest number over the 13 years.
‘ELECTRICAL BASED’ ACCIDENTS
10. 10% of all fatalities (287 deaths) over the 13 year period 1996/97 to 2008/09p, across
all industries may be linked to ‘electrical based’ accidents (see Table 4).
11. Overall, this means in all electrical based work activity from 1996/97 to 2008/09p,
there has been an average of 22 fatalities per year (i.e. accidents appearing under an
electrical RIDDOR category). Provisional data suggests that in 2008/09p there were
11 fatalities, which is the lowest number over the 13 years. As noted earlier, around
13 fatalities per year are due to direct contact with electricity, and additionally an
average of around 4 fatalities per year are due to falls (both high and other types of
falls).
111
Yearly trends (HSE year):
12. For fatalities, a fluctuating picture is evident over the 13 year period 1996/97 to
2008/09p with a peak of 34 fatalities in 1996/97 and reaching a provisional low of 11
by 2008/09p (see Figure 5).
13. For non-fatal accidents, a clearer and encouraging steady decrease in accidents is
evident from 1996/97 to 2008/09p (see Figure 6).
HSE sectors (Field operations directorate, FOD):
14. From 1996/97 to 2008/09p, fatalities are highest for the Construction HSE sector (127
fatal accidents), with the Engineering and Utilities HSE sector recording the most non-
fatal accidents (40,235) (see Figure 7 and Figure 8).
Types of accident (Accident kind):
15. Over the full 13 year period 1996/97 to 2008/09p, contact with electricity or electrical
discharge is the type of accident most frequently causing fatalities (168). In terms of
non-fatal accidents, contact with electricity is relatively common (ranked fourth
highest, 7,464) but it is handling/sprains (27,249) and trips (20,065) that are far more
common (see Figure 9 and Figure 10).
16. Focusing only on more recent years (from 2001/02 to 2008/09p), a more detailed
classification of the data verifies that contact with electricity or electrical discharge is
the main cause of fatalities (88). For non-fatal accidents, contact with electricity or
electrical discharge is a common cause (ranked third highest, 3,887), but there are
significant numbers of non-fatal injuries from tripping over obstructions (5,507) and
lifting/putting down loads (3,902) (see Figure 11and Figure 12).
Job role (Occupation):
17. From 1996/97 to 2001/02, electric fitters (including electricians) reported the most
fatalities (38) followed by electrical engineers (15). Similarly, they both report the
greatest number of non-fatal injuries, with electric fitters (including electricians)
reporting 14,938 total non-fatal injuries and electrical engineers reporting 8,074 non-
fatal injuries (see Figure 13 and Figure 14).
18. From 2002/03 to 2008/09p, again electric fitters (including electricians) report the
most fatalities (44), as well as the highest total non-fatal injuries (10,933) (see Figure
15 and Figure 16).
Activity occurring at the time of accident (Work process):
19. From 1996/97 to 2000/01, electrical activities have reported the second highest
number of fatal accidents (13), with general maintenance activities being involved in
112
most fatalities (17). With non-fatal accidents, electrical activities report only the ninth
highest number of accidents (1,734), with the most accidents relating to on-site
transfer such as movement of persons or materials (7,898) and general handling
(7,345) (see Figure 17 and Figure 18).
20. From 2001/02 to 2008/09p, electrical activities by far report the highest number of
fatal accidents (56), and additionally report the highest number of non-fatal accidents
(8,965) (see Figure 19 and Figure 20).
Main object/movement involved in accidents (Agent):
21. From 1996/97 to 2000/01, unintentional contact with overhead lines as well as contact
with electricity/electrical discharge reported the first and second most fatal accidents
(20 and 19 respectively). However, for non-fatal accidents, the picture is quite
different with the moving of heavy weights or strains/sprains being involved in most
accidents (see Figure 21 and Figure 22).
22. From 2001/02 to 2008/09p, contact with overhead lines features as one of the most
common objects/movements involved in fatalities (20) along with other types of
electricity cable - including those trailing and buried in walls (20). It is this latter
category that also reports the most non-fatal accidents (5,936), with overhead lines not
appearing to be related to any significant number of non-fatal accidents (see Figure 23
and Figure 24).
Age:
23. For fatalities from 1996/97 to 2008/09p, those aged between 25 and 34 and 40 to 54
have recorded the most fatal accidents (between 32 and 34 accidents in each age
category) (see Figure 25).
24. For total non-fatal injuries from 1996/97 to 2008/09p, the number of accidents slowly
increases beyond the 16 to 19 age group (3,800) to reach a peak by 35 to 39 (10,886),
steadily decreasing thereafter. Within this, major injury levels appear to remain
relatively stable from 20 through to 54 (around 2000 accidents in each age grouping)
(see Figure 26).
‘ALL RELATED’ ACCIDENTS
25. 40% of all fatalities (1,201 deaths) over the 13 year period 1996/97 to 2008/09p,
across all industries may be potentially linked to ‘all related’ accidents (involving
either direct contact with electricity, or tenuously linked to electrical sources or
components) (see Table 25). However, due to the possible tenuous link, caution
should be exercised when using these figures.
26. Overall, this means in ‘all related’ accidents from 1996/97 to 2008/09p arising from
electrical based work and accidents indirectly related to electricity (where electricity
113
or electrical components feature in some way, although not necessarily causal in the
fatality), there has been an average of 92 fatalities per year. Provisional data suggest
that in 2008/09p there were 28 fatalities, which is the lowest number over the 13
years. As noted earlier, there is an average of 13 fatalities per year due to direct
contact with electricity, the same annual average number of accidents due to being
struck by moving, flying or falling objects, but less than the average number of 18
fatalities per year due to high falls (above 2 metres).
Yearly trends (HSE year):
27. For fatalities, a fluctuating picture is evident over the 13 year period 1996/97 to
2008/09p, with a peak in 2007/08 (136), although fatalities do dramatically fall the
following year in 2008/09p (provisionally 28) (see Figure 27).
28. For non-fatal accidents, there is evidence of total accidents remaining stable from
1996/97 to 2000/01. From 2001/02 to 2008/09p, the trend appears to show total
accidents gradually decreasing from 19,504 to 14,257 by 2008/09p (see Figure 28).
29. Overall, these findings indicate the success of efforts by HSE and industry to reduce
electricity related accidents.
HSE sectors (Field operations directorate, FOD):
30. From 1996/97 to 2008/09p, the Construction HSE sector reports the greatest number
of fatal accidents (427), double that of the next highest reporting sector, which is the
Agriculture and Wood HSE sector (205) (see Figure 29).
31. For total non-fatal accidents from 1996/97 to 2008/09p, the Engineering and Utilities
HSE sector reports the most accidents (57,653). However, the Construction HSE
sector reports the greatest number of major injury accidents (12,448) (see Figure 30).
Industry (SIC industry code):
32. From 1996/97 to 2008/09p, installation and fitting of electrical wiring reports the
fourth highest fatality numbers (52), with the greatest number of fatal accidents being
reported by the industry related to the construction of buildings and civil engineering
works (142) (see Figure 31).
33. For non-fatal injuries from 1996/97 to 2008/09p, installation and fitting of electrical
wiring reports the greatest number of total accidents (11,983), although there are other
industries related to the manufacture of various electrical components that also report
varying numbers of accidents (see Figure 32).
114
Types of accident (Accident kind):
34. Over the full 13 year period 1996/97 to 2008/09p, contact with electricity or electrical
discharge reports the third greatest number of fatal accidents (168), after high falls
(233) and being struck by objects (174). In terms of non-fatal accidents, the picture is
slightly different with contact with electricity only reporting the seventh highest
number of accidents (7,464), with most accidents due to handling/sprains (51,456)
(see Figure 33 and Figure 34).
35. Focusing only on more recent years (from 2001/02 to 2008/09p), contact with
electricity or electrical discharge reports the second highest number of fatal accidents
(88), with high falls (125) being the primary type of fatal accident. For non-fatal
injuries, contact with electricity does not feature as strongly (3,887 total non-fatal
accidents) compared to machinery, hit by objects and trips and slips (all above 10,000
accidents each) (see Figure 35 and Figure 36).
Job role (Occupation):
36. From 1996/97 to 2001/02, electric fitters (including electricians) report the greatest
number of fatal accidents (38) as well as the greatest number of total non-fatal
accidents (14,938). Electrical engineers rank eleventh in fatality numbers (15), but do
have the second highest number of non-fatal injuries (8,074) (see Figure 37 and Figure
38).
37. From 2002/03 to 2008/09p, electric fitters (including electricians) report the most fatal
accidents (44) as well as the greatest total number of non-fatal accidents (10,933) (see
Figure 39 and Figure 40).
38. Further analysis of the accidents only involving electric fitters (including electricians)
for the 13 year period 1996/97 to 2008/09p showed that fatal accidents are
predominantly related to contact with electricity/electrical discharge (31) or high falls
(20). Non-fatal injuries in this population are often handling and sprains (7,454) and
trips (5,908) (see Figure 41 and Figure 42).
39. These results suggest a need to target electric fitters (including electricians), focusing
on best practice when working in direct contact with electricity, working at height, and
handling loads.
Activity occurring at the time of accident (Work process):
40. From 1996/97 to 2000/01, electrical activities have reported relatively few fatal
accidents (13) compared to general maintenance activities (49), and on-site transfer of
people or materials (32) and loading/unloading (30). The non-fatal accident profile is
similar (see Figure 43 and Figure 44).
115
41. From 2001/02 to 2008/09p, electrical activities ranked third in terms of the highest
number of reported fatal accidents (56), with manufacturing production (79) and
machine maintenance (74) ranking higher. The non-fatal accident profile is similar
with electrical activities reporting 8,965 accidents, which is lower than manufacturing
production (26,316) and machine maintenance (12,250) (see Figure 45 and Figure 46).
Main object/movement involved in accidents (Agent):
42. From 1996/97 to 2000/01, electrical related objects/movements (i.e. unintentional
contact with overhead lines (20) and direct contact with electricity/electrical discharge
(19)) report the second and joint third highest fatal accident numbers respectively.
Falls off moveable ladders reports the highest number (21). For non-fatal accidents,
electrical objects/movements do not really feature as significantly (see Figure 47 and
Figure 48).
43. From 2001/02 to 2008/09p, the low significance of electricity objects/movements in
relation to fatal accidents is evident, with overhead power lines (20) and other
electricity cables - including those trailing and buried in walls (20) ranking low
compared to the involvement in fatal accidents of objects/movements such as fork lift
trucks (33) and moveable ladders (28). For non-fatal accidents, other electricity cables
report the fourth highest number of total accidents (5,936), with other materials and
machinery reporting the highest number (11,519) (see Figure 49 and Figure 50).
44. These results potentially indicate further consideration should be given to
interventions that do not merely focus on contact with electricity, but also working at
height (ladder use), and working around fork lift trucks and machinery.
Age:
45. For fatalities from 1996/97 to 2008/09p, the 40 to 44 age group and those 50 to 59
have reported the highest number of fatal accidents (above 137 fatalities in each age
category) (see Figure 51).
46. For total non-fatal injuries from 1996/97 to 2008/09p, the pattern of accidents
increases from 16 years of age (7,443) up to a peak by the 35 to 39 age group
(22,930), and then decreasing thereafter. Within this, major injury accident numbers
are relatively consistent (over 4,000) from the 20 to 24 age group through to the 55 to
59 age group (see Figure 52).
47. It should be noted that these figures do not necessarily indicate that certain age groups
are more vulnerable to accident (since figures presented are frequencies rather than
calculated rates).
116
Employment status:
48. From 1996/97 to 2008/09p, around three quarters of all fatalities over the 13 years
have involved those classified as ‘employees’ (924), with ‘self-employed’ fatalities
constituting around 21% of all fatalities (250) (see Figure 53).
49. Similarly to the fatalities profile, most non-fatal accidents from 1996/97 to 2008/09p
have involved ‘employees’ (in fact nearly all accidents, 180,899), with the ‘self-
employed’ being involved in a comparatively minimal number of total accidents
(4,195) (see Figure 54). However, this may be partly explained by under-reporting of
non-fatals in the self-employed.
50. It should be noted that these figures do not necessarily indicate that certain types of
employment are more vulnerable to accident (since figures presented are frequencies
rather than calculated rates).
Monthly pattern:
51. From 1996/97 to 2008/09p, accumulatively most fatalities have been reported for
August (130), with relatively high numbers (above 100 in each month) for January,
and June through to November (see Figure 55).
52. From 1996/97 to 2008/09p, accumulatively most non-fatal injuries have been reported
for January, June, July and September through to November (all around 16,000
accidents in each month). December reports the lowest number of total non-fatal
injuries (11,419) (see Figure 56).
53. These findings may provide some indication regarding the best time to launch media
campaigns or timely reminders throughout the year in order to reduce accident levels
further.
Types of injury:
54. From 1996/97 to 2008/09p, fatal accidents due to contact with electrical sources
(leading to loss of consciousness and shock, etc.) report the joint fourth highest fatal
accident numbers (145) (see Figure 57).
55. From 1996/97 to 2008/09p, non-fatal injuries caused by electricity are relatively low
(4,183 total non-fatal injury), compared to strains (53,554) and fractures (37,169) (see
Figure 58).
Region:
56. From 1996/97 to 2008/09p, the highest number of fatal accidents have been reported
by the ‘East and South East’ region (243), followed closely by the ‘Midlands’ (222), a
picture which is similar to the non-fatal injury profile whereby the ‘East and South
117
East’ (36,630) report the highest total accident level, followed by the ‘Midlands’
(35,191) (see Figure 59 and Figure 60).
57. At the local authority level from 1996/97 to 2008/09p, highest fatality numbers are
reported by Manchester (21), followed by Sandwell and Birmingham (both 16). The
non-fatal accident profile is similar, with Birmingham recording the highest total
accident number (3,736), followed by Leeds (3,005). Manchester also records the
fourth highest number of non-fatal accidents (2,275) (see Figure 61 and Figure 62).
58. With HSE insight into the resources available in different regions and cities, it may be
useful to compare any areas that report high accident levels with comparable regions
and cities that report lower levels. This exercise could yield further information into
best practice in certain areas that could be applied to other areas, particularly those
with high accident levels.
Objective 3: Produce a report that contains analyses of the electricity-related
accident data; identify the key issues; and identify key priority areas for
intervention.
59. This report directly addresses Objective 3.
60. The overall approach taken in this report is to use the RIDDOR accident data to
develop a profile of key electricity-related risks and thus help HSE develop prioritised
interventions supported by a preliminary evidence base.
61. It is recommended that the ‘direct contact’ and ‘electrical based’ data sets are primarily
used for future HSE policy development work.
118
7. RECOMMENDATIONS
The purpose of this study was to provide a preliminary evidence base for developing policy, not
to develop that policy. Nevertheless, outline recommendations have emerged from the study,
and it is suggested that the following areas be addressed in order to reduce the risks associated
with electricity-related accidents.
7.1 GENERAL RECOMMENDATIONS
Based on the work undertaken in this project, the following general recommendations are
presented as a means of improving health and safety in relation to electricity-related accidents:
1. This report is one source of evidence to supplement existing knowledge and expertise
in the HSE. Its findings should be considered in relation to existing knowledge and
guidance around some of the identified risk areas in this report.
2. Some caution should be exercised when interpreting the figures for the ‘all related’
data set, as this data set does contain a number of accidents that are only indirectly
related to electricity. It is therefore recommended that any HSE policy development
work is primarily based upon the ‘direct contact’ and ‘electrical related’ data sets, as
these contain accidents assigned electricity-related RIDDOR codes only.
3. It may be that further work is needed, such as a detailed analysis of notifier comments
and investigation reports, and workshops to drill further into the potential reasons
behind the statistics. For individuals whose roles involve working with or around
electricity, what might they perceive the risk issues to be? What might motivate them
to work more safely? Developing the evidence base will provide HSE with the means
to develop prioritised interventions, suited to the target population, and supported by a
full audit trail.
4. Whilst accidents resulting from direct contact with electricity give rise to significant
cost impact to Great Britain, they are not always the most frequently occurring. Slips,
trips, low and high falls, and handling/sprain injuries also feature prominently. The
risks associated with these accidents should therefore be addressed in conjunction with
those risks associated with contact with electricity.
5. Demographic differences in the cities and regions of GB may need to be studied more
closely given the differential levels of electricity-related accidents suggested from the
results of this study. It may be useful to compare regions of similar size, but with a
big difference in accident levels, to understand what practices are being carried out
that could be affecting accident levels. Distilling best practice could then be
transferred to other areas of the country.
119
8. REFERENCES
1 BOMEL Limited. (2010). Identifying the incidence of electricity-related accidents in Great
Britain. HSE Research Report 771. Sudbury, UK: HSE Books.
120
APPENDIX 1 CREATION OF THE ELECTRICITY DATA SET
A1.1 INTRODUCTION
This chapter addresses Objective 1, which is to:
Develop an electricity-related accident data set from ‘supply to switch’ to provide a
baseline for measuring improvements across a range of industry sectors.
The main source of data is the RIDDOR accident data as provided by HSE to GL Noble Denton
under its confidential support arrangements. The analysis and results are show in Chapters 3, 4
and 5.
In this chapter, the RIDDOR accident reporting system is introduced, followed by a description
of how the RIDDOR data is incorporated within the RIDDOR Data Tool developed by GL
Noble Denton. The definitions used to develop the electricity-related accident data set are
described along with the validation checks undertaken on the data.
In considering the analyses of the RIDDOR data it is important to appreciate the uncertainties
associated with that data, this is because RIDDOR reports are made by people from a variety of
backgrounds, some of whom may have had either very specific health and safety training or
little or no health and safety training.
A1.2 RIDDOR ACCIDENT REPORTING
Reporting of the fatal, major or minor (over three days away from work) injury accidents to
workers associated with workplace activities is a statutory requirement of RIDDOR2. This
chapter provides a brief overview of the RIDDOR data as collected by HSE and subsequently
processed and analysed by GL Noble Denton. Detailed information is provided in References
2, 3 and 4.
In the period 1996/7 to 2000/01, RIDDOR forms, once completed, were sent to the local HSE
offices, where the information on them was coded with reference to HSE guidance5
on coding,
and entered into the central HSE FOCUS database by trained clerical staff. As of April 2001, a
central Incident Contact Centre (ICC) was established where dedicated staff deal with hard
copy, web and telephone notifications, as well as coding and entry of all RIDDOR report forms.
The fields available for analysis are summarised in Table 61. Those fields that have changed
with the introduction of the ICC system are denoted in bold. Those fields marked with an
asterisk in Table 61 were not completed in the FOCUS database when the reports were received
from the local authority enforced sectors in the period 1996/97 to 2000/01 as they ran a different
coding scheme. In April 2002, the Standard Occupation Classification (SOC 2000) was
adopted. For the 2002/03 data and beyond, the occupations of those injured at work were
recorded using the SOC 2000 system.
At the 1 April 2001 juncture when the ICC system was activated, a new scheme for coding
accident agents and work processes was also introduced and the categorisation of accident kinds
was modified slightly. It is understood there is no clear mapping between agents and work
121

processes for the pre- and post-ICC schemes and therefore the data sets are presented separately
throughout this report. Although accident kinds, ‘high fall, ‘low fall’ and ‘fall’ remain, the
guidance on coding falls has apparently been clarified so that a fall initiated by a ‘trip’ (e.g.
when getting out of a vehicle or on stairs) is now coded as a ‘slip or trip’ as opposed to a fall.
As such, it may be anticipated that the number of recorded falls in 2001/2 would reduce even if
the control of risks did not alter. Caution must therefore be exercised in interpreting trends and
changes from 1996/7-2000/01 to 2001/02-2008/09p in terms of accident numbers and rates.
Table 61 RIDDOR accident/injury data available for analysis
Field Description
Accident Kind Kind of accident e.g. slip, fall, drown
Age group Age of injured person
Agent* Agent associated with the kind e.g. ladder, fragile roof etc. (The agent contains a
direct reference to the accident kind in the pre-ICC data i.e. ‘Fall vehicle’, but not
in the 2001/02-2008/09p data)
Area HSE area office (old type areas 1-21 excluding 4)
Body Part Site on body of injury e.g. back, leg
Casualty Name Name of the injured party
Client Employees UK Number employed by client in UK
Client Name Name of client
Client No Client identification number
Client Function Status of the client e.g. private company, NHS
Date Date of accident
Employment Status Employment status of injured person e.g. employee
Event No Serial number of the accident
FMU Unit No Field management unit enforcing in HSE office
Gender Gender
HSE Year Year in which the accident occurred
inc_role Role of the client at location e.g. designer, landlord
Total Workers Site Number employed by client at particular location
Incumbent No Incumbent (client at location) identification number
Industrial Workers Site Number of industrial workers employed by client at location
Injury Nature Nature of injury e.g. fracture, burn
InternalID Unique System ID for this entry
inv_no Investigation number
Investigated Flag to indicate if investigation required
Local authority Name of local authority
Location Type Type of location e.g. fixed, quarry, roadside
Notifier Comments Narrative provided by the person notifying the accident
Occupation* Occupation of injured person
Originator HSE Directorate/Division or local authority identification field
Region HSE region (7 regions)
Report type Accident report type e.g. fatal, major, over 3-days
Severity F = Fatality, M = Major injury accident, O = Over 3-days accident
SIC92 Industry Industry classification
SIC92 Sector Industry Classification Group e.g. Agriculture, Construction, Extraction/Utility,
Manufacturing or Services
Work Process* Work process taking place at time of accident
122
A1.3 GL NOBLE DENTON RIDDOR DATA TOOL
Fatal, major and over 3-day injury accident records from FOCUS were supplied to GL Noble
Denton in separate electronic files for each of the 13 years from 1996/97 to 2008/09p, together
with ‘look-up’ tables cross-referencing the FOCUS codes to short and long descriptions as
contained in the HSE coding systems.
The RIDDOR data as supplied by HSE were processed by GL Noble Denton using the
following steps in accordance with Reference 3:
The raw accident data and updated look-up tables as received from HSE were
imported into a Microsoft Access database.
The data were validated and any anomalies were resolved in conjunction with HSE
statisticians.
The GL Noble Denton RIDDOR Data Tool was updated to include all accidents
notified between 1996/97 and 2008/09p.
Analyses of the accident data were carried out using Excel spreadsheet Pivot Tables
and Charts contained in the RIDDOR Data Tool.
In updating the database and Data Tool, reference was made to the HSE manual6
covering the
new accident kind, agent and work process codings.
Figure 63 shows the layout of the GL Noble Denton RIDDOR database. There are three main
tables in the database, containing the information on:
Accidents/Injuries
Investigations
Reports
The primary table used for this study is the Accidents/Injuries table. The data contained in this
table are summarised in Table 61. The database tables contain the numerical FOCUS codes
rather than the text descriptions. The associated look-up tables shown in Figure 63 provide
access to the text descriptions required for meaningful analyses.
It is important to note that inv_no (investigation number) is the field linking the principal tables.
Furthermore, the term ‘event’ is misleading in that each person injured constitutes an ‘event’
even when there are multiple injuries resulting from an accident.
123
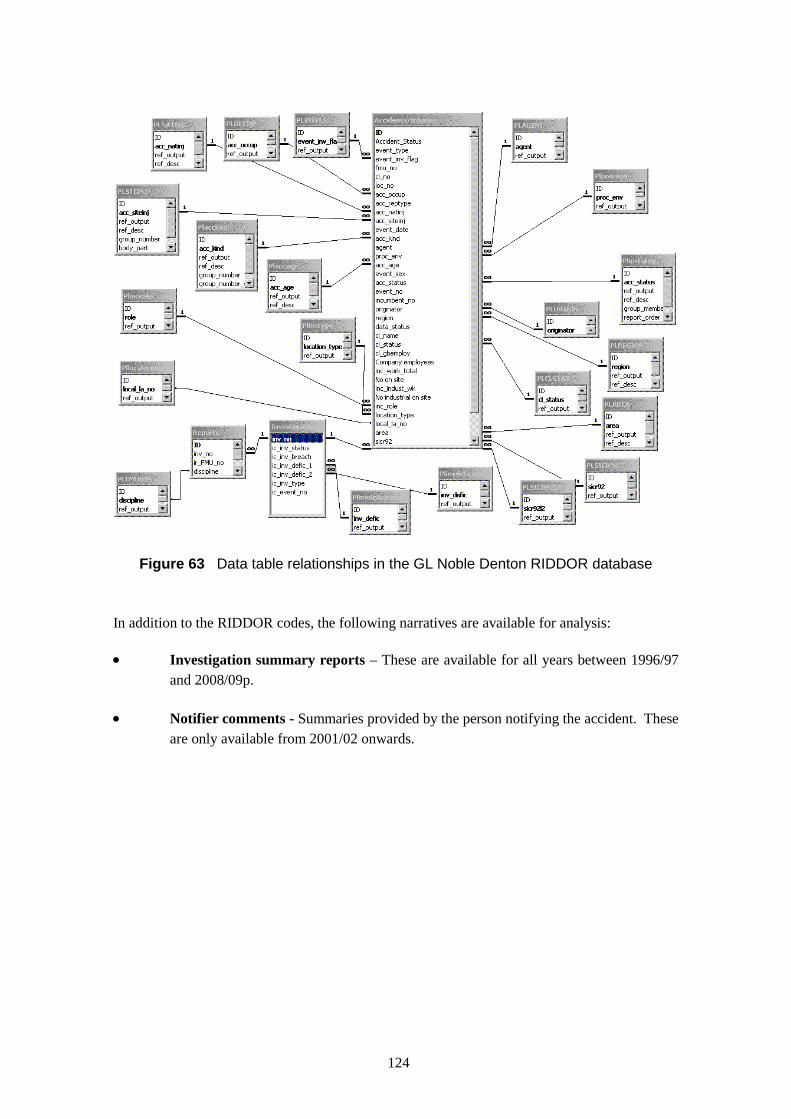
Figure 63 Data table relationships in the GL Noble Denton RIDDOR database
In addition to the RIDDOR codes, the following narratives are available for analysis:
Investigation summary reports – These are available for all years between 1996/97
and 2008/09p.
Notifier comments - Summaries provided by the person notifying the accident. These
are only available from 2001/02 onwards.
124
A1.4 DEFINITION OF THE ELECTRICITY DATA SET
The full RIDDOR database contains over 1.9 million accident records for the period 1996/97 to
2008/09p. In order to carry out a meaningful analysis of the electricity-related accidents, all of
the relevant accident data in the RIDDOR database needs to be collected together. As there
may be electricity-related accidents that were not coded as relating to electricity, the following
two-prong approach was used to identify these incidents:
Identify all those accidents with electricity-related RIDDOR codes by searching for
one or more of the codings for industries, accident kinds, occupations, work processes,
and agents that correspond to those identified for the electricity-related accidents.
Identify those accidents where either the notifier comment or the investigation
summary report contains a term (or ‘keyword’) relating to electricity.
The accident data identified in the two separate approaches was initially combined into one data
set, which encompassed all accidents related to electricity. Two further subsidiary data sets
were also created for more focused analysis. In total three data sets were created and analysed
in this report, as follows:
Data set 1: ‘Direct contact’ with electricity – this data set is defined purely by the
RIDDOR accident kind categories ‘Electricity’ and ‘Volt’ (i.e. it only includes
accidents reported as being either an ‘Electricity’ or ‘Volt’ accident type).
Data set 2: ‘Electrical based’ (including ‘direct contact’) – this larger data set
contains the ‘direct contact’ accidents described above, as well as accidents reported
under other electricity-related RIDDOR categories (e.g. industries such as electricity
production, installation of wiring/fitting, manufacturing of electrical appliances;
occupations such as electrical engineers, electroplaters, etc.). For a full list of the
RIDDOR categories under this definition, please refer to Table 62 to Table 66 in this
appendix.
Data set 3: ‘All related’ accidents (including ‘electrical based’) – this is the full
data set (as described in Chapter 5), containing the ‘electrical based’ accidents
described above (i.e. all accidents assigned an electricity-related RIDDOR code) and
accidents brought in because their associated accident narrative (i.e. the notifier
comment or investigation report) contains an electricity related keyword (e.g. ‘spark’,
‘plug’, ‘socket’, etc.). For a full list of the keywords used under this definition, please
refer to Table 67 in this appendix.
In order to validate the main electricity data set (termed ‘all related’) and ensure the appropriate
accident records were included, a number of measures were taken. These included:
Conducting a visual check on the data and graphs to assess whether the trends being
illustrated were as expected. For example, initially, ‘distribution networks’ was one of
the keywords used to build up the ‘all related’ electricity data set. However, further
125
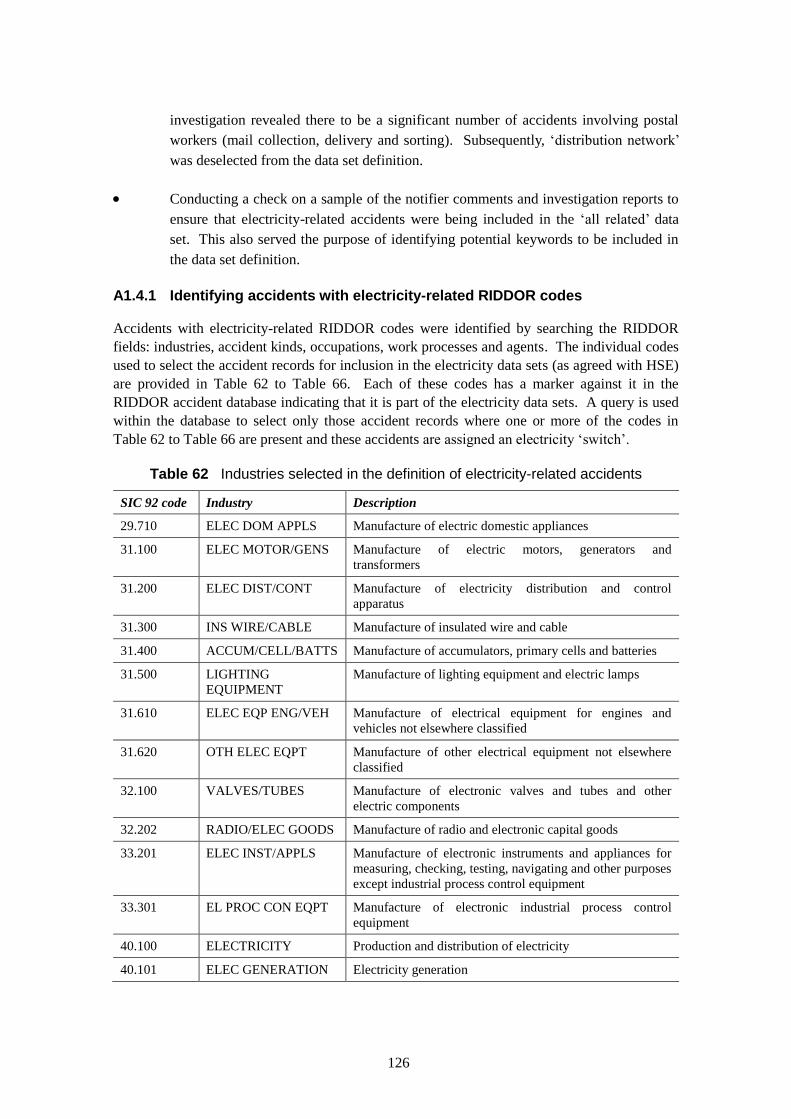
investigation revealed there to be a significant number of accidents involving postal
workers (mail collection, delivery and sorting). Subsequently, ‘distribution network’
was deselected from the data set definition.
Conducting a check on a sample of the notifier comments and investigation reports to
ensure that electricity-related accidents were being included in the ‘all related’ data
set. This also served the purpose of identifying potential keywords to be included in
the data set definition.
A1.4.1 Identifying accidents with electricity-related RIDDOR codes
Accidents with electricity-related RIDDOR codes were identified by searching the RIDDOR
fields: industries, accident kinds, occupations, work processes and agents. The individual codes
used to select the accident records for inclusion in the electricity data sets (as agreed with HSE)
are provided in Table 62 to Table 66. Each of these codes has a marker against it in the
RIDDOR accident database indicating that it is part of the electricity data sets. A query is used
within the database to select only those accident records where one or more of the codes in
Table 62 to Table 66 are present and these accidents are assigned an electricity ‘switch’.
Table 62 Industries selected in the definition of electricity-related accidents
SIC 92 code Industry Description
29.710 ELEC DOM APPLS Manufacture of electric domestic appliances
31.100 ELEC MOTOR/GENS Manufacture of electric motors, generators and
transformers
31.200 ELEC DIST/CONT Manufacture of electricity distribution and control
apparatus
31.300 INS WIRE/CABLE Manufacture of insulated wire and cable
31.400 ACCUM/CELL/BATTS Manufacture of accumulators, primary cells and batteries
31.500 LIGHTING
EQUIPMENT
Manufacture of lighting equipment and electric lamps
31.610 ELEC EQP ENG/VEH Manufacture of electrical equipment for engines and
vehicles not elsewhere classified
31.620 OTH ELEC EQPT Manufacture of other electrical equipment not elsewhere
classified
32.100 VALVES/TUBES Manufacture of electronic valves and tubes and other
electric components
32.202 RADIO/ELEC GOODS Manufacture of radio and electronic capital goods
33.201 ELEC INST/APPLS Manufacture of electronic instruments and appliances for
measuring, checking, testing, navigating and other purposes
except industrial process control equipment
33.301 EL PROC CON EQPT Manufacture of electronic industrial process control
equipment
40.100 ELECTRICITY Production and distribution of electricity
40.101 ELEC GENERATION Electricity generation
126
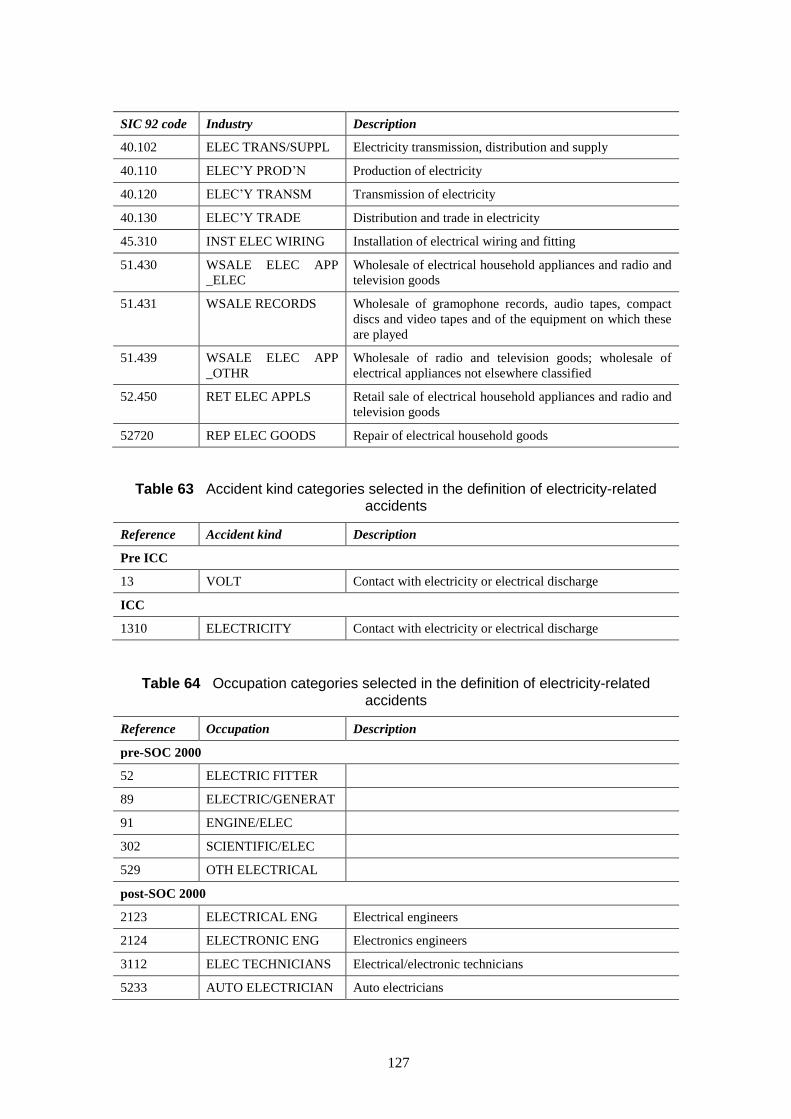
SIC 92 code Industry Description
40.102 ELEC TRANS/SUPPL Electricity transmission, distribution and supply
40.110 ELEC’Y PROD’N Production of electricity
40.120 ELEC’Y TRANSM Transmission of electricity
40.130 ELEC’Y TRADE Distribution and trade in electricity
45.310 INST ELEC WIRING Installation of electrical wiring and fitting
51.430 WSALE ELEC APP
_ELEC
Wholesale of electrical household appliances and radio and
television goods
51.431 WSALE RECORDS Wholesale of gramophone records, audio tapes, compact
discs and video tapes and of the equipment on which these
are played
51.439 WSALE ELEC APP
_OTHR
Wholesale of radio and television goods; wholesale of
electrical appliances not elsewhere classified
52.450 RET ELEC APPLS Retail sale of electrical household appliances and radio and
television goods
52720 REP ELEC GOODS Repair of electrical household goods
Table 63 Accident kind categories selected in the definition of electricity-related accidents
Reference Accident kind Description
Pre ICC
13 VOLT Contact with electricity or electrical discharge
ICC
1310 ELECTRICITY Contact with electricity or electrical discharge
Table 64 Occupation categories selected in the definition of electricity-related accidents
Reference Occupation Description
pre-SOC 2000
52 ELECTRIC FITTER
89 ELECTRIC/GENERAT
91 ENGINE/ELEC
302 SCIENTIFIC/ELEC
529 OTH ELECTRICAL
post-SOC 2000
2123 ELECTRICAL ENG Electrical engineers
2124 ELECTRONIC ENG Electronics engineers
3112 ELEC TECHNICIANS Electrical/electronic technicians
5233 AUTO ELECTRICIAN Auto electricians
127
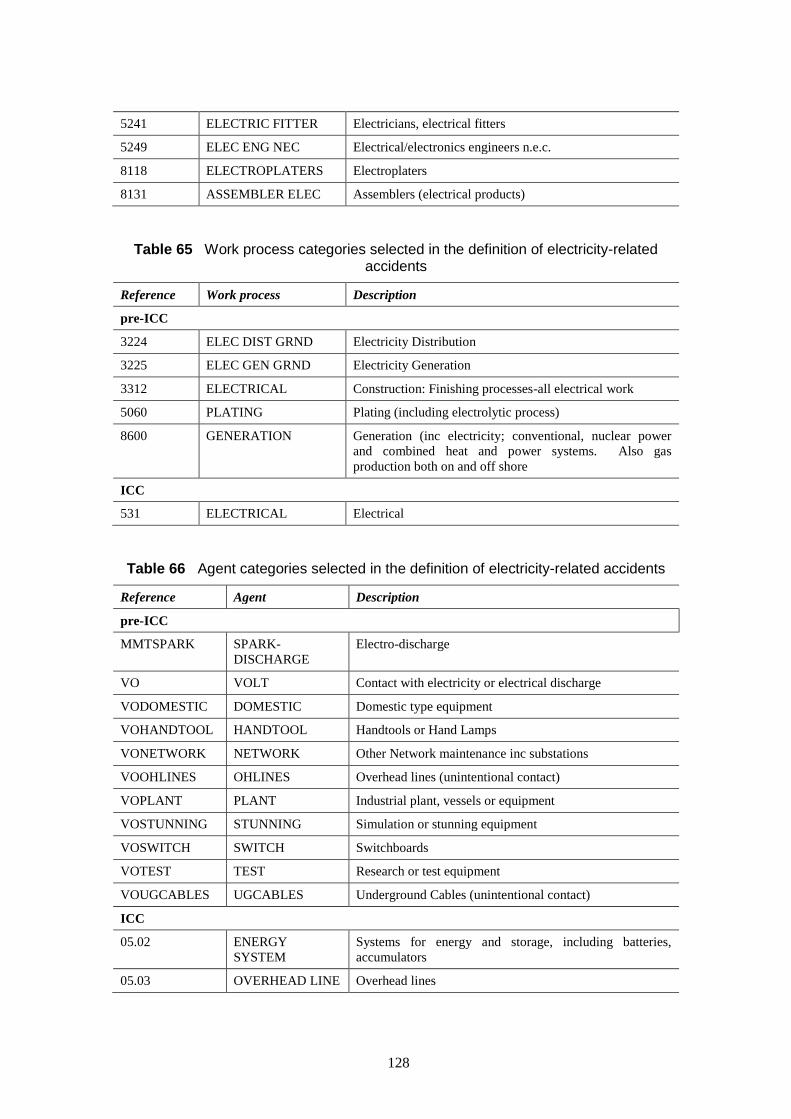
5241 ELECTRIC FITTER Electricians, electrical fitters
5249 ELEC ENG NEC Electrical/electronics engineers n.e.c.
8118 ELECTROPLATERS Electroplaters
8131 ASSEMBLER ELEC Assemblers (electrical products)
Table 65 Work process categories selected in the definition of electricity-related accidents
Reference Work process Description
pre-ICC
3224 ELEC DIST GRND Electricity Distribution
3225 ELEC GEN GRND Electricity Generation
3312 ELECTRICAL Construction: Finishing processes-all electrical work
5060 PLATING Plating (including electrolytic process)
8600 GENERATION Generation (inc electricity; conventional, nuclear power
and combined heat and power systems. Also gas
production both on and off shore
ICC
531 ELECTRICAL Electrical
Table 66 Agent categories selected in the definition of electricity-related accidents
Reference Agent Description
pre-ICC
MMTSPARK SPARK-
DISCHARGE
Electro-discharge
VO VOLT Contact with electricity or electrical discharge
VODOMESTIC DOMESTIC Domestic type equipment
VOHANDTOOL HANDTOOL Handtools or Hand Lamps
VONETWORK NETWORK Other Network maintenance inc substations
VOOHLINES OHLINES Overhead lines (unintentional contact)
VOPLANT PLANT Industrial plant, vessels or equipment
VOSTUNNING STUNNING Simulation or stunning equipment
VOSWITCH SWITCH Switchboards
VOTEST TEST Research or test equipment
VOUGCABLES UGCABLES Underground Cables (unintentional contact)
ICC
05.02 ENERGY
SYSTEM
Systems for energy
accumulators
and storage, including batteries,
05.03 OVERHEAD LINE Overhead lines
128
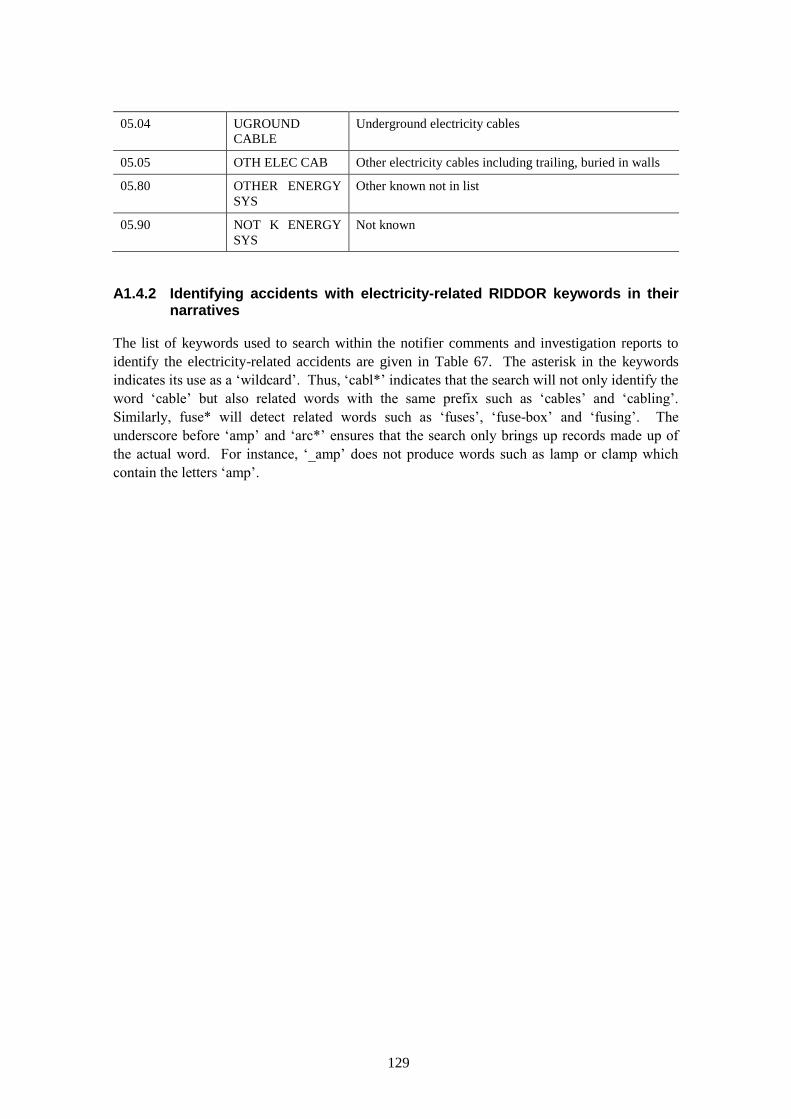
05.04 UGROUND
CABLE
Underground electricity cables
05.05 OTH ELEC CAB Other electricity cables including trailing, buried in walls
05.80 OTHER ENERGY
SYS
Other known not in list
05.90 NOT K ENERGY
SYS
Not known
A1.4.2 Identifying accidents with electricity-related RIDDOR keywords in their narratives
The list of keywords used to search within the notifier comments and investigation reports to
identify the electricity-related accidents are given in Table 67. The asterisk in the keywords
indicates its use as a ‘wildcard’. Thus, ‘cabl*’ indicates that the search will not only identify the
word ‘cable’ but also related words with the same prefix such as ‘cables’ and ‘cabling’.
Similarly, fuse* will detect related words such as ‘fuses’, ‘fuse-box’ and ‘fusing’. The
underscore before ‘amp’ and ‘arc*’ ensures that the search only brings up records made up of
the actual word. For instance, ‘_amp’ does not produce words such as lamp or clamp which
contain the letters ‘amp’.
129
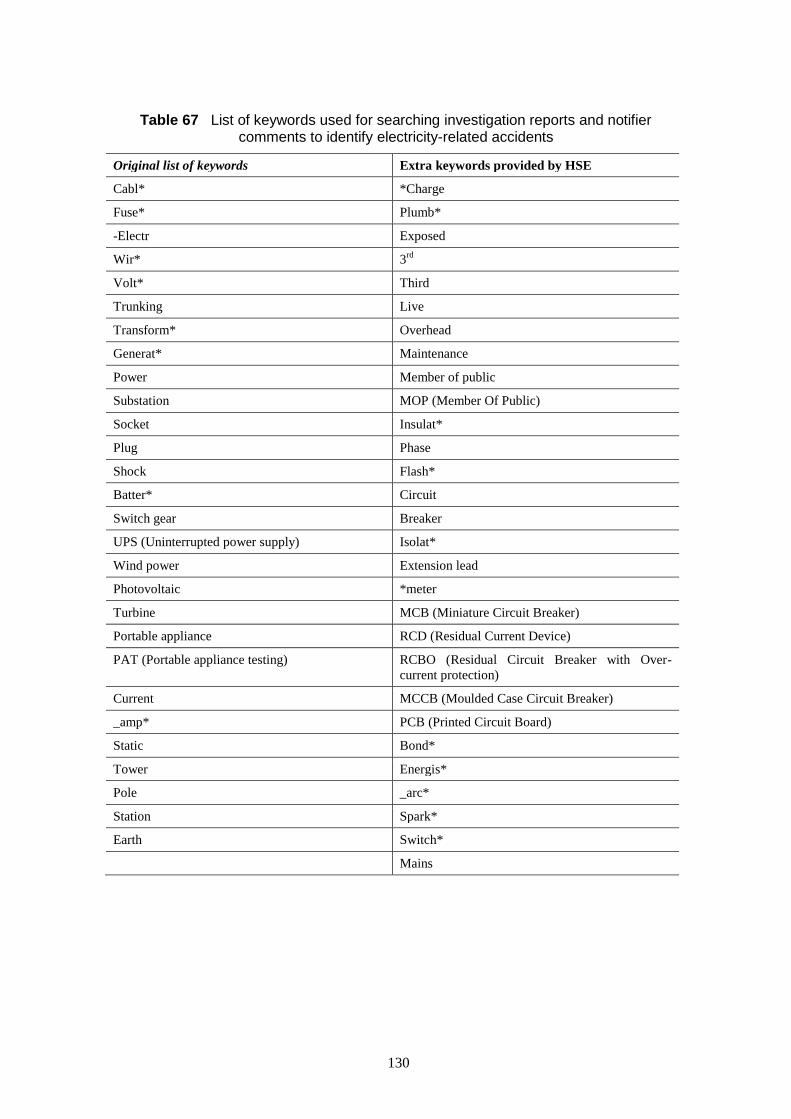
Table 67 List of keywords used for searching investigation reports and notifier comments to identify electricity-related accidents
Original list of keywords Extra keywords provided by HSE
Cabl* *Charge
Fuse* Plumb*
-Electr Exposed
Wir* 3rd
Volt* Third
Trunking Live
Transform* Overhead
Generat* Maintenance
Power Member of public
Substation MOP (Member Of Public)
Socket Insulat*
Plug Phase
Shock Flash*
Batter* Circuit
Switch gear Breaker
UPS (Uninterrupted power supply) Isolat*
Wind power Extension lead
Photovoltaic *meter
Turbine MCB (Miniature Circuit Breaker)
Portable appliance RCD (Residual Current Device)
PAT (Portable appliance testing) RCBO (Residual Circuit Breaker with Over-
current protection)
Current MCCB (Moulded Case Circuit Breaker)
_amp* PCB (Printed Circuit Board)
Static Bond*
Tower Energis*
Pole _arc*
Station Spark*
Earth Switch*
Mains
130

A1.5 APPENDIX 1 REFERENCES
2 HSE. (1995). The reporting of Injuries, Diseases and Dangerous Occurrences Regulations
1995, RIDDOR, SI No 3163, HMSO.
3 BOMEL Limited. (2004). Improving health and safety in construction Phase 2 – Volume 2:
RIDDOR Accident Data Analysis Tool. HSE Research Report 232. Sudbury, UK: HSE Books.
4 HSE. (1996). Guide to the Reporting of Injuries, Disease and Dangerous Occurrences
Regulations 1995. Sudbury, UK: HSE Books.
5 HSE. (n.d.). FOCUS Data Handbook, Version 2.0.
6 HSE. (2001). Contact Centre Coding Guidance, Version 1.1.
131

Published by the Health and Safety Executive 03/11
Health and Safety Executive
Identifying the incidence of electricity-related accidents in Great Britain An update (1996/97 to 2008/09p)
This report analyses RIDDOR based electricity-related accidents covering all industries and is intended to be an update (and standalone report) to the previous HSE research report ‘Identifying the incidence of electricity-related accidents in Great Britain’.
Using certain selection criteria, the full RIDDOR database from 1996/97 to 2008/09p was searched to identify three categories of electricity accident:
a) ‘direct contact’ with electricity; b) ‘electrical based’ accidents; and c) ‘all related’ accidents.
Analysis was carried out using RIDDOR fields such as ‘HSE year’, ‘work process’ and ‘agent’. A number of findings were revealed, including electrical fitters (including electricians) reporting the greatest number of fatalities and non-fatal injuries, with many of the accidents related to contact with electricity (or electrical discharge). However, a number of other accidents were not related to direct contact with electricity, such as handling strains/sprains and high falls. It is proposed that the results of this report constitute an updated evidence base indicating possible priority areas for intervention by the HSE.
This report and the work it describes were funded by the Health and Safety Executive (HSE). Its contents, including any opinions and/or conclusions expressed, are those of the authors alone and do not necessarily reflect HSE policy.
RR842
www.hse.gov.uk