prepared for: arizona public service company
TRANSCRIPT

PREPARED FOR: ARIZONA PUBLIC SERVICE COMPANY
Study of Compressed Air Energy Storage with Grid and Photovoltaic Energy Generation
DRAFT FINAL REPORT | AUGUST 2010
2 The Arizona Research Institute for Solar Energy (AzRISE) - APS Final Draft Report, Compressed Air Energy Storage and Photovoltaics Study, University of Arizona, August 2010
AzRISE and the University of Arizona CAES Study Teams
The study team for the Compressed Air Energy Storage (CAES) and Photovoltaic Energy Generation report included the multidisciplinary work of the College of Engineering, the Eller College of Management and the Arizona Research Institute for Solar Energy (AzRISE).
The mission of this team is to characterize and investigate approaches to renewable energy integration into the grid from distributed resources to large-scale implementation in Arizona. The Principal Investigator (PI) acknowledges the contributions made by the study team listed below.
• Dr. Joseph Simmons – Department Head of Materials Science and Engineering (MSE) and Co-Director, AzRISE – PI
• Ardeth Barnhart – Co-Director, AzRISE – Co-PI
• Dr. Stanley Reynolds – Eller Professor of Economics – Eller College of Management, Department of Economics, UA – Co-PI
• Dr. Young-Jun Son– Department of Systems and Industrial Engineering (SIE), UA – Co-PI
• Photovoltaic performance studies conducted by Dr. Alex Cronin, PI of the TEP PV test yard and AzRISE
Students:
• Esfandyar M Mazhari– SIE Graduate student
• Jiayun(Melody) Zhao– SIE Graduate student
• Nurcin Koyuncu – SIE Graduate student
• Valentina Kachanovskaya – Eller Graduate student of Economics
• Ben Lyons – Eller Graduate student of Management
3 The Arizona Research Institute for Solar Energy (AzRISE) - APS Final Draft Report, Compressed Air Energy Storage and Photovoltaics Study, University of Arizona, August 2010
CONTENTS Executive Summary
4
Figures and Tables
6
Section 1 - Study Background and Description
8
Section 2 - Battery Storage Technology Characterization and CAES Options for scaled systems
13
Section 3 - PV and CAES Cost Benefit Analysis
41
Section 4 - System Cost and Optimization Analysis
51
Section 5- Critical Developments for System Cost Reductions
71
Section 6 - Conclusion and Summary of Results
72
4 The Arizona Research Institute for Solar Energy (AzRISE) - APS Final Draft Report, Compressed Air Energy Storage and Photovoltaics Study, University of Arizona, August 2010
EXECUTIVE SUMMARY This study analyzes the technical characteristics of energy storage technologies and the costs and benefits associated with solar PV generation combined with energy storage options. This analysis provides APS with estimates of the incremental value of energy storage both as a stand-alone resource and when combined with solar PV generation. The possibility of energy storage introduces offers new options in decision-making for resource planning.
Issues associated with Solar PV Generation
Solar PV electricity generation has characteristics that present some challenges for an electric utility. The first characteristic is the intermittent nature of solar PV generation. The exact amount of generation varies hour to hour and even minute to minute depending on weather conditions. Electric system operation requires that voltage stays within a narrow range in order to continue operating. Therefore, the utility may need to provide voltage regulation services of some kind when using solar PV generation, in order to smooth out supply and continuously balance electricity supply and load. In addition, a utility may need to have backup power available to meet load for periods when solar radiation (and solar generation) is lower than expected. The second characteristic is the time pattern of solar PV generation. The average daily pattern of solar generation, for example in the summer in Arizona starts at zero around 7 a.m., gradually rises to a peak between noon and 1 p.m., and declines back to zero around 7 p.m. Solar generation is declining as the typical daily load is rising in the afternoon, with the peak load occurring at 4 – 8 p.m. Therefore, the timing of daily peak solar PV generation does not match the timing of daily peak load. Results of the Study The first part of the study examines the use of Compressed Air Energy Storage (CAES) for simple energy peak shaving. A traditional CAES system is modeled to load when energy is at its lowest cost and to release energy at the price maximum. Simulations conducted using avoided cost values supplied by APS show that using a typical CAES plant, the total cost of electricity for a summer day (August 15) will increase 2.7% when CAES storage is introduced. If moderate thermal management is applied to reduce the natural gas consumption by 50%, then the extra cost of using CAES for peak shaving is1.3%. For high thermal management which reduces natural gas consumption to 25%, then the use of CAES for peak shaving reduces the cost of electricity by 3.3%. This result shows that CAES can become a beneficial resource for peak-shaving when new thermal management approaches are put in place in the CAES system itself. The second part of the study examined the use of solar power generation for peak-shaving. Solar energy technologies consist of solar thermal and photovoltaic (PV) types of systems. Both technologies experience intermittent delivery of power due to fluctuations in weather patterns, cloud cover and a limited number of hours during the day that solar insolation is available. Batteries can provide power regulation and peak shaving and are being successfully tested while modifications in CAES to improve efficiency. They are also used to better manage the use of external fuel combustion through improved thermal cycle management. The associated modeling study consequently combined the PV system with CAES for peak-shaving. The CAES system is used to extend delivery of solar–generated electricity for peak load demand and past available sun hours to meet a summer day in August for APS. The results find that peak shaving requires a 4 GW single-axis tracking PV array coupled with 2.3 GW CAES storage system that provides storage capacity of 9,200 MWh per day and consumes 51 billion BTU of natural gas per day. If this scenario were optimized with reduced cost through thermal management improvements thus reducing the amount of natural gas required, a 3.3%

5 The Arizona Research Institute for Solar Energy (AzRISE) - APS Final Draft Report, Compressed Air Energy Storage and Photovoltaics Study, University of Arizona, August 2010
drop in the cost of the CAES system is possible. If the cost of PV is decreased to $3.00/w and optimized thermal management is utilized, the system costs can drop by 4%. Shifting generation away from non-solar resources utilizing storage technologies, Compressed Air Energy Storage (CAES) in particular, can theoretically reduce generation expenses. Modeling daily arbitrage of a PV, CAES and grid system shows that adding a CAES system to PV generation can result in net sales revenue of over 50%. While the Net Present Value (NPV) of these systems has room for improvement, further reductions in the cost of solar PV, higher efficiency in thermal management of CAES and incentives or subsides to offset the cost of installing and running CAES facilities can result in positive revenue gain in the system. Next Steps Energy storage technologies allow for the storage and dispatch of renewable energy resources on demand and contribute to the overall stability of the grid. Many new storage technologies are under development and have dedicated research programs including advanced batteries, compressed air energy storage, fuel cells and others to store intermittent renewable energy resources. As renewable energy technologies continue to come down in price and the value of these resources as a hedge against rising fossil fuel prices increases, integrating this resource into the grid so that solar and wind energy can replace fossil fuel generation becomes increasingly important. Renewable energy generation coupled with storage technology and improved forecasting for the use of this system will allow for greater integration of this resource into the grid. Introducing policies that encourage investment in storage technologies allowing for positive rates of return and requirements in renewable energy portfolio standards for greater deployment will increase adoption of these systems. Most importantly increased research and development support for all areas of energy storage are needed to improve the ability of the technology to meet our energy needs.

6 The Arizona Research Institute for Solar Energy (AzRISE) - APS Final Draft Report, Compressed Air Energy Storage and Photovoltaics Study, University of Arizona, August 2010
TABLES
Table 1.1. Energy Storage Technologies
1 – 11
Table 2.1: Comparison of lithium ion and bipolar lead acid batteries
2 – 16
Table 2.2: Characteristics of Commercially Available Batteries
2 – 20
Table 2.3: Battery Cost Estimates by Technology
2 – 21
Table 2.4: A Comparison of Performance for all Modifications
2- 35
Table 2.5: Design and Operating Parameters of Working CAES Plants
2 – 36
Table 2.6: CAES Project Comparison
2 – 36
Table 3.1: APS Avoided Cost Projections for 2015: Mid-day vs. Peak
3 – 43
Table 3.2: Resource Combinations and Scale
3 – 44
Table 3.3: PV/CAES Costs and Performance Assumptions
3 – 45
Table 3.4: 100 MW PV Project NPV Results for Daily Arbitrage Model
3 – 47
Table 3.5: 100 MW PV + Large-Scale CAES NPV Results (millions of $)
3 – 50
Table 4.1: Natural Gas prices for 2015 delivered to APS Generators ($/MBtu)
3 – 52
7 The Arizona Research Institute for Solar Energy (AzRISE) - APS Final Draft Report, Compressed Air Energy Storage and Photovoltaics Study, University of Arizona, August 2010
FIGURES
Figure 1.1 – Solar PV intermittency measured at the TEP Solar Test Yard 1 - 9Figure 1.2 – Day-to-day variation in solar PV power production due to weather. 1 - 9Figure 1.3 – Modeled data traces at Aubrey Cliffs 1 - 10Figure 1.4. Comparison of identical PV arrays (tracked vs. fixed) for May in Madison, WI. 1 - 12Figure 2.1 - Typical Battery design 1 - 12Figure 2.2 - Illustration of the operation of sodium sulfur batteries 2 - 15Figure 2.3 - Vanadium-redox flow battery from Cellstrom 2 - 18Figure 2.4 - Absolyte GP Performance Characteristics at 25 C 2 - 19Figure 2.5 - Working principle of CAES system 2 - 21Figure 2.6 - Typical advanced CAES system configuration 2 - 22Figure 2.7 - Working Principle of CAES system 2 - 23Figure 2.8 – US map showing approximate locations of bedded and domal salt deposits. 2 - 23Figure 2.9 - Arizona map showing known and potential salt deposits. 2 - 25Figure 2.10 – Comparison of CO2 emissions from coal, simple and combined cycle and CAES power generation. 2 - 28Figure 2.11 - Illustration from Del Turco [35] of a basic AACAES system. 2 - 29Figure 2.12 - Illustration from Shainker 2 - 29Figure 2.13 - Isothermal CAES system developed by SustainX. The system operates at 3,000 psi. 2 - 30Figure 2.14 - Photo of storage pipes for compressed air (0-3,000psi) for 1 MW isothermal CAES system operating ofr 4 hours. 2 - 30Figure 2.15 - First generation CAES - simplified schematic of the McIntosh plant. High construction costs. 2 - 31Figure 2.16 - Second Generation CAES with Air Injection Concept 2 - 31Figure 2.17 – CAES-AI-HP Concept 2 - 31Figure 2.18 – CAES-AI-BCE concept with the Bottoming Cycle Air Expander 2 - 31Figure 2.19 – CAES-BCE-IC – Bottoming Cycle Air Expander and Inlet Chilling 2 - 32Figure 2.20 - shows the high performance system called the CAES Bottoming Cycle Process 2 - 32Figure 2.21 - 290MW CAES plant in Huntorf 2 - 36Figure 3.1 - Load Curve vs. Solar PV Generation for Typical Household 3 - 41Figure 3.2 - NPV for Project Types in Millions of Dollars 3 - 48Figure 3.3 – Daily variation in CAES storage capacity in August 3 - 49Figure 4.1 - User Inteface of Flexible Simulation 4 - 55Figure 4.2 – Peak-shaving scenario for the grid +CAES system for August 15, 2008 to cover APS system-wide demand 4 - 56Figure 4.3 - Peak-shaving scenario for the grid + CAES + PV system for August 15, 2008 to cover APS system-wide demand 4 - 58Figure 4.4 - Plot of market price in West Texas, March 3, 2010 4 - 59

8 The Arizona Research Institute for Solar Energy (AzRISE) - APS Final Draft Report, Compressed Air Energy Storage and Photovoltaics Study, University of Arizona, August 2010
Section 1 - Study Background and Description
Today there are many renewable energy conversion approaches with promising improvements and potential reductions in system costs. These include wind turbines, solar trough technologies, large dish solar thermal, flat-plate photovoltaics and large-dish photovoltaics technologies. Wind and solar resources show high unpredictable intermittency in their operation.
Figure 1.1 – Solar PV intermittency measured at the TEP Solar Test Yard (Courtesy of Dr. Alexander Cronin, PI of the TEP PV Test Yard and AzRISE] The curves of Figure 1.1 above show a difference in power produced between two days in February 2010. The variations on February 20 are due to the passage of clouds above the PV array.
Figure 1.2 – Day-to-day variation in solar PV power production due to weather.

9 The Arizona Research Institute for Solar Energy (AzRISE) - APS Final Draft Report, Compressed Air Energy Storage and Photovoltaics Study, University of Arizona, August 2010
Unpredictable variations in power production are also associated with wind energy production, as shown below in Fig. 1.3.
Figure 1.3 – Modeled data traces at Aubrey Cliffs, contrasting the output from one turbine grouping (red) with output from the entire plant (blue) from Tom Acker, APS report [1]. Wind and solar energy generation sources will eventually benefit from energy storage as a backup for their intermittent energy generation when they become more prevalent in the energy generation mix. Energy storage options allow smoothing of power output and meeting demand with an adequate reserve. Energy storage also allows transferring energy generated in periods of low demand to periods of higher demand and provides for backup in case of unforeseen emergencies. Major applications being considered today are regulation, peak-shaving and energy arbitrage. Solar energy generation has the following storage characteristics:
- Solar thermal energy generation: thermal systems have built-in inertia and do not respond to rapid fluctuations in solar irradiance. Solar thermal systems also use molten salt baths to extend operation time by about 6 hours. The requirements for storage for this system are focused on extending the energy generated by the thermal system beyond the solar day.
- Photovoltaic systems: PV systems are desirable because of their low demand for water and their scalability from kilowatt (kW) to Gigawatt (GW) size. PV responds rapidly to variations in solar irradiance, as a consequence the storage needs span from seconds to many hours.
- Both demand and production capacity vary by season of the year, so all methods can benefit from energy storage technologies that shift energy produced in periods of over-production to periods of high demand.
A number of technologies are available today for energy storage. These include batteries and super-capacitors of various kinds, mechanical devices such as flywheels, thermal energy storage, compressed air energy storage (CAES) both below and above ground, reversed pumped hydroelectric and fuel cells. The table below updated from Barton [2] gives a summary of each approach in terms of response time and duration of storage period. This table lists Biomass and Hydrogen in its

10 The Arizona Research Institute for Solar Energy (AzRISE) - APS Final Draft Report, Compressed Air Energy Storage and Photovoltaics Study, University of Arizona, August 2010
original version, but these may be considered to be fuel rather than storage. They will not be considered here. Duration Biomass Hydrogen CAES Thermal Hydro-
Electric Fuel cell Batteries Super-
capacitor 4 mos + + + 3 weeks + + + 3 days + + + + + 6 hours + + + + + + + 2 hours + + + + + + + 40 min + + + + + + 10 min + + + + + 20 sec + + + 1 sec + Table 1.1. Energy storage technologies that span the entire range of response times and storage periods necessary to support solar generation sources. Research Proposed for APS Support and Collaboration: Each electricity generation technology and each energy storage technology has its own characteristics and costs, as well as different potential for improvement. In partnership with APS, AzRISE initiated the development and implementation of a systems analysis that allows mixing solar photovoltaics (PV) with Compressed Air Energy Storage (CAES) to find the optimum combination that will meet APS customer consumption and system-wide demand and will minimize cost. The analysis also considers estimated future improvements and provides a result of the potential for optimization with these anticipated improvements. The analysis provides “what-if” scenarios and utilizes real consumption data from APS for levels determined by APS and produces combinations of systems to meet this consumption. The proposed work conducted over a one year period consisted of two coordinated projects: (a) systems design analysis to determine optimized capacity of PV generation coupled withCAES energy storage and (b) systems cost/benefits analysis of the associated systems design. The study considers time scales over a year using hourly and daily data. The PV scope was determined using a single axis tracking PV system. In studies conducted in Europe, single-axis tracking has a 30% higher yield than fixed-plate PV in Southern European latitudes [3]. This is especially true in the Southwest where generally there are clear morning and evening skies and the demand load continues to peak past sunset. NREL (PV WATTS) shows that annual improvements can range from 29 to 42 percent depending on the location and solar resource.

11 The Arizona Research Institute for Solar Energy (AzRISE) - APS Final Draft Report, Compressed Air Energy Storage and Photovoltaics Study, University of Arizona, August 2010
Figure 1.4. Comparison of identical PV arrays (tracked vs. fixed) for May in Madison, WI. The tracked array rises quickly to full power and stays there on a clear sunny day while the fixed array only maintains the maximum power for a few hours in the middle of the day. Figure 1.5. Comparison of solar irradiance over a year between Tucson, AZ, Orlando, FL. and Newark, N.J. The graph shown in Figure 1.5 was prepared by AzRISE and compares the solar radiance over a year period between Tucson, Orlando and Newark for fixed-plate, single-axis tracking and dual-axis tracking PV. (The height of each column is the ratio of the average annual solar radiance for each case and location to the value for fixed plate in Newark (e.g. Newark is 100%). A Southwest location provides between 30 and 45 percent more solar irradiance than a Northeast location (Newark). (see comment)
Insolation, fixed and tracking
0
50
100
150
200
250
Ins(S25) 1-axis 2-axis
TucsonOrlandoNewark
12 The Arizona Research Institute for Solar Energy (AzRISE) - APS Final Draft Report, Compressed Air Energy Storage and Photovoltaics Study, University of Arizona, August 2010
Bibliography from Section 1
1. “APS Wind Integration Cost Impact Study,” Tom Acker, available at http://wind.nau.edu 2. “Energy Storage and Its Use With Intermittent Renewable Energy,” J. P. Barton, D. G.
Infeld, IEEE Trans. On energy Conversion 19, 441 (2004). 3. “An Analysis of one-axis tracking strategies for PV systems in Europe,” Huld, T., Cebecauer, T.,
Sun, M., Dunlop, E.D.,. European Commission, Joint Research Centre.

13 The Arizona Research Institute for Solar Energy (AzRISE) - APS Final Draft Report, Compressed Air Energy Storage and Photovoltaics Study, University of Arizona, August 2010
Section 2 Technology Characterization Review The simulation developed in sections 3 and 4 focus on the role of CAES energy storage in firming energy delivery and the distribution system. To conduct the simulations proposed, the investigators needed to develop average or expected performance characteristics for all components to be used for various scenarios. In this section, we review battery technologies for energy storage and regulation, and compressed air energy storage (CAES). Included are the fundamental processes that pertain to each technology, technology limitations and benefits and the performance and costs of each technology. Key Points– Technology Characterization Review:
• Solar technologies consist of solar thermal and photovoltaic. For both technologies, there are intermittencies from weather related decreases or losses in sunshine and from the day-night cycle.
o Photovoltaic technologies are subject to rapid weather-related losses in power and to very fast power fluctuations. Photovoltaic technologies also see reduced power production in the late summer afternoon when peak demand is still high.
o Solar thermal technologies take advantage of thermal inertia and exhibit slower losses in power with reduced short-time fluctuations. Solar thermal technologies can also use heat storage methods to extend the power production period for up to 6 hours.
• Batteries can provide and have been demonstrated the ability to provide power regulation (lithium titanate batteries in Kemak study)
• Battery storage for peak shaving and power regulation is being successfully tested using asymmetric lead-acid-carbon batteries.
• Compressed air energy storage designs are being developed using standard and modified approaches (Energy Storage and Power).
• Modifications in compressed air energy storage either recycle the heat of combustion during the expansion stage or transfer the heat of air compression to the expansion stage (thermal management).
14 The Arizona Research Institute for Solar Energy (AzRISE) - APS Final Draft Report, Compressed Air Energy Storage and Photovoltaics Study, University of Arizona, August 2010
2.1 Batteries for Energy Storage 2.1.1 Key Points:
• Batteries can have rapid response to demand so they can cover most power regulation needs, with enough stored energy, they can also cover turbine spin-on time.
• Batteries may compliment solar technologies by filling in the weather-related intermittency of renewable energy sources.
• Batteries can potentially provide peak-shaving by supplying power during peak demand,
either or to lengthen the solar day.
• The most significant barriers to battery technology adoption today are: o Batteries are still relatively expensive compared to other storage options at large
capacities, o Repeated deep discharge can drastically shorten battery life.
• Batteries are best used in power regulation and some peak-shaving in small-scale
distributed generation scenarios.
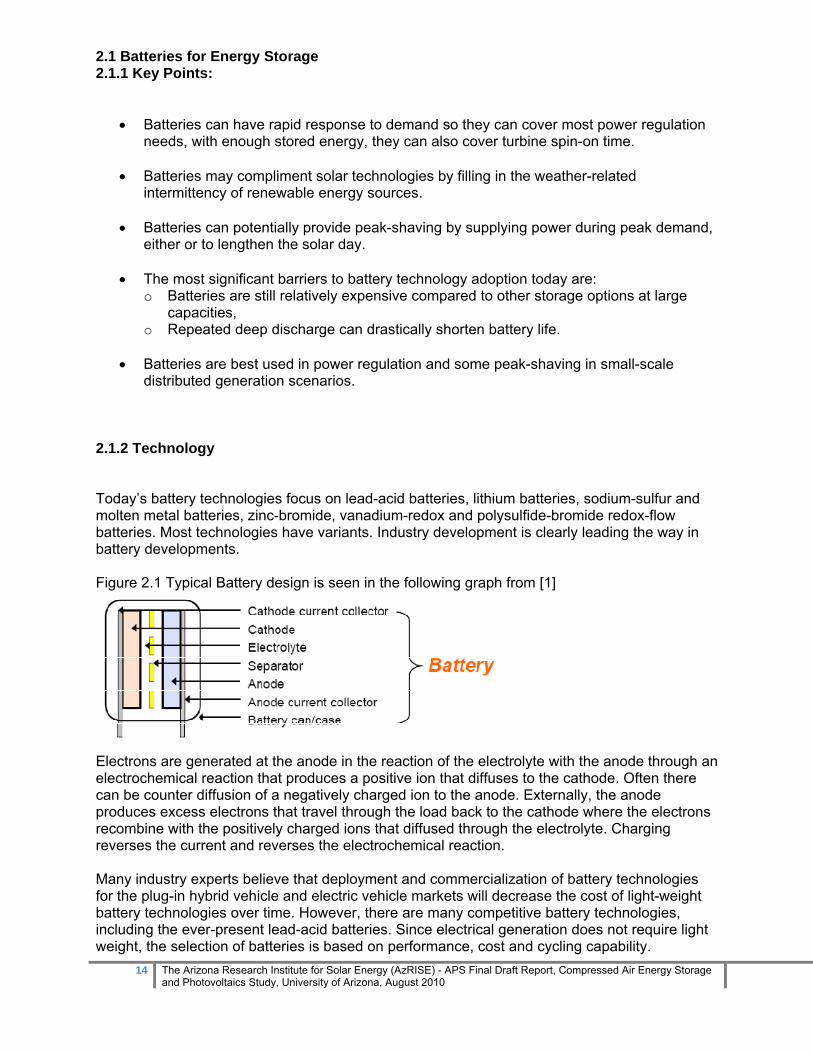
2.1.2 Technology Today’s battery technologies focus on lead-acid batteries, lithium batteries, sodium-sulfur and molten metal batteries, zinc-bromide, vanadium-redox and polysulfide-bromide redox-flow batteries. Most technologies have variants. Industry development is clearly leading the way in battery developments. Figure 2.1 Typical Battery design is seen in the following graph from [1]
Electrons are generated at the anode in the reaction of the electrolyte with the anode through an electrochemical reaction that produces a positive ion that diffuses to the cathode. Often there can be counter diffusion of a negatively charged ion to the anode. Externally, the anode produces excess electrons that travel through the load back to the cathode where the electrons recombine with the positively charged ions that diffused through the electrolyte. Charging reverses the current and reverses the electrochemical reaction. Many industry experts believe that deployment and commercialization of battery technologies for the plug-in hybrid vehicle and electric vehicle markets will decrease the cost of light-weight battery technologies over time. However, there are many competitive battery technologies, including the ever-present lead-acid batteries. Since electrical generation does not require light weight, the selection of batteries is based on performance, cost and cycling capability.

15 The Arizona Research Institute for Solar Energy (AzRISE) - APS Final Draft Report, Compressed Air Energy Storage and Photovoltaics Study, University of Arizona, August 2010
2.1.3 Lead-Acid Batteries: Typical lead acid batteries are valve regulated (VRLA) (Exide, Furukawa and GS Yuasa). Exide has installed a 1 MW – 1.4 MWh battery in Alaska [2]. These batteries suffer from negative plate sulfation that results in a steady increase in end-of-charge voltage and reduces cycling life. Gel based batteries are an improvement but they suffer from water loss that results in gel shrinkage and loss of life. GS Yuasa uses advanced silica gel technology to avoid water loss and has reached several thousand cycles with a 33% decrease in capacity [3]. Lead-carbon batteries (East Penn): East Penn produces valve-regulated gelled electrolyte batteries for renewable energy applications (available commercially - Deka Solar) and a lead acid battery (in the experimental stage under test supported by DOE) in which two batteries are built into a single cell where one has the typical PbO2/Pb cell and the other has a PbO2/C cell. This forms an asymmetric system that generates and stores excess charge in addition to its electrochemical reaction. The company claims that this type of battery responds to a load demand rapidly and acts like a battery coupled to a supercapacitor. The battery-supercapacitor combination can be used for regulation as well as peak-shaving [4]. This asymmetric design without the carbon electrode was also developed by CSIRO (Australia) [5]. Bipolar Lead-acid batteries (Applied Intellectual Capital in partnership with East Penn): This is a modification (in the developmental stage) of the lead-acid battery that uses a proprietary bipolar separator and allows stacking of many small cells to improve efficiency of the battery. This approach reduces the amount of lead used in the battery by half, improves current flow and reduces stress corrosion to improve life cycle [6]. Table 2.1 from [6] summarizes a comparison of bipolar lead-acid batteries over lithium-based batteries (Since these are not yet available commercially, the cost figures for the bipolar, lead-acid battery are projections of expected costs):
16 The Arizona Research Institute for Solar Energy (AzRISE) - APS Final Draft Report, Compressed Air Energy Storage and Photovoltaics Study, University of Arizona, August 2010
2.1.4 Lithium Batteries: Lithium ion batteries have a cathode that contains a lithium-metal oxide compound and a layered graphitic carbon anode. If the cathode is written as Li(M)Ox then the following combinations are found for M: Co/C, Mn/C, NCA/C, NMC/C, FeP/C, Mn/Ti, Ti/C. The electrolyte is composed of lithium salts like LiPF6 dissolved in organic carbonates. During charging the Li+
ions from the cathode diffuse through the electrolyte and recombine with electrons in the anode to form metallic Li deposited between the carbon layers. During discharge through a load, the Li metal decomposes and the ion diffuses back to the cathode while the freed electron is available as external current. Investigators have discovered that the discharge rate is controlled not by the Li+ diffusion, but by the rate at which the Li ions can get back into the cathode, therefore, considerable work has gone into improving transport of Li ions in the cathode. Many of the modifications seen have alloyed the Li in the cathode with different other metal oxides to better support the reaction at the cathode. The electrolyte is typically flammable and if the charging current gets too high, then the electrolyte can catch on fire [7]. Many cells in parallel during recharging can initiate the problem. If a cell begins to fail, then its external voltage drops and the charging current through the failing cell increases. Good battery controllers identify such drops in voltage and shut off charging current from the failing cells. Lithium ion batteries have generally high power density (300-400kWh/m3) due to their light weight; they have high efficiency (upper 80% to mid 90% depending on depth of discharge and long life cycles (3,000 cycles, typical at 80% depth of discharge). A123 produces and sells Lithium-ion batteries at 1MW size. Lithium titanate batteries (Altairnano): This battery uses a nanostructured lithium-titanate electrode that facilitates ion transfer and claims to have a response time of 20 milliseconds. Altairnano has a 2 coupled 1 MW – 250 kWh (15 minutes) systems that fit into 2 trailers and have been tested by KEMA [8] to show outstanding regulation as well as smoothing ramp rate up to 2 MW/min [8]. Altairnano batteries sell for about $1,800/kW though prices can change quickly. Altairnano has collaborated with AES Energy Storage LLC, in developing the pilot test at Indianapolis Power and Light from which performance data is available. Lithium iron phosphate batteries (K-2 Energy Solutions): These typically have LiFePO4 cathode and graphite anode. These batteries have a higher temperature flammable electrolyte and must be balanced during charging and discharging. But the electrolyte is stable to 80C, therefore, they are safer than other lithium-based batteries but not fully maintenance-free [9]. Lithium-Sulfur batteries: Sulfur’s high theoretical specific capacity (1,675 mAh/g) and its non-toxic nature make Li/S batteries very promising for cheap and safe high energy storage. However, problems of electrode conductivity, formation of polysulfides which can spontaneously diffuse through the electrolyte, leading to self-discharge are keeping it from the market without further research [10]. Lithium nanostructure batteries (SEEO Partnership). The volatility of electrolytes in the lithium batteries requires careful handling during charging and discharging to avoid fires and explosions. This approach uses a nanocomposite electrolyte with no volatiles and a lithium foil electrode. They produce a 25kW – 2 hour battery that is sealed and maintenance-free. Expected cost is below $1,000/kW [11].

17 The Arizona Research Institute for Solar Energy (AzRISE) - APS Final Draft Report, Compressed Air Energy Storage and Photovoltaics Study, University of Arizona, August 2010
2.1.5 Sodium-Sulfur and Molten-Metal Batteries: Sodium-sulfur batteries: These operate using molten sodium metal at the negative electrode and molten sulfur at the positive electrode. This requires an operating temperature of 300C. The
solid ceramic membrane separator is beta alumina. During discharge the sodium ions diffuse through the beta alumina and combine in the sulfur electrode to form sodium polysulfides (Na2Sx). During charging the process is reversed. The batteries are shaped in cylindrical form. Figure 2.2 - Illustration of the operation of sodium-sulfur batteries (courtesy of NGK)
These batteries have the highest market penetration of any battery system in power production. They are produced almost exclusively by NGK of Japan [12]. They are available in 1-4 MW units with 8 hours of discharge. They are claimed to be maintenance-free with a cycle life of 15 years or 2,000 cycles at 80% depth of discharge. So far NGK has installed 302 MW in 215 systems. Sodium-sulfur batteries operate at 300C, which is the reason for their lack of scalability to small systems. The heating system must operate many cells to become economical. Sodium-Beta alumina batteries are also developed at Pacific Northwest Labs (PNNL) and they use a thick solid electrolyte of β” alumina at 300C to pass sodium ions and uses a liquid polysulfide cathode. Studies and development are still underway [13]. Molten-metal batteries are being developed by MIT as a low cost alternative to sodium-sulfur under ARPA-E funding. The technology is based on Mg metal and Sb metal separated by an electrolyte. The advantage is the same as sodium sulfur in that electron transport through the melt is high, but the battery needs to be heated to about 300-350C and these batteries have poor cycling and many failure modes from electrochemical corrosion. Obviously ARPA-E has high hopes for improvements, but this technology has been under study for over 10 years and will take as long to develop [14]. 2.1.6 Zinc-Bromide Batteries: Zinc Bromide (ZnBr) batteries have carbon-plastic composite electrodes in two compartments separated by a microporous polyolefin membrane. A different electrolyte flows past each electrode to cause the electrochemical reaction. During discharge, Zn and Br combine from free Zn+2 and Br- to form ZnBr2 compound and generate 1.8 volts. During charging the compounds are decomposed and metallic zinc deposits on the composite electrode. Bromine reacts with the electrolyte (organic amines) to form a thick oil that is stored in the external electrolyte tank. Problems are with recharging due to zinc dendrite formation which is irreversible, battery drying out and redox reversibility. Zinc Bromide flow batteries are produced by Redflow (Australia) and Community Energy Storage (US) and offer a smaller footprint than lead-acid. These batteries are available in small capacity (0.25 MW and 500 kWh at $500,000) [15]. Zinc-air cells (Grid Storage Technologies, and REVOLT Technology): The battery works by diffusion of oxygen to the cathode where it reacts with KOH to release OH- ions that diffuse to

18 The Arizona Research Institute for Solar Energy (AzRISE) - APS Final Draft Report, Compressed Air Energy Storage and Photovoltaics Study, University of Arizona, August 2010
the anode and react with Zn to form Zn(OH)4-2 . This approach uses control of CO2 and moisture
to form more stable electrodes and a promise of high energy density. GST produces a fully rechargeable battery at $1,500/kW with 6 hours of storage, scalable from 1-1,000 MW. GST uses ZnCl2 in the electrolyte to stabilize degradation [16]. Current technology at REVOLT is about a few years away from reaching 100kWh capacity at $100/kWh with 1,000 cycles [17]. 2.1.7 Vanadium Redox Flow Batteries: VRB uses two redox couples of vanadium (V+2/V+3) in the negative electrode and the VOx couple (V+4/V+5) in the positive electrode, stored in mild sulfuric acid solutions to generate charge. During the redox reactions, hydrogen ions are exchanged between the two electrolytes through a proton-permeable membrane. Flow batteries use separate tanks of liquid anolyte and catholyte. These are pumped into the actual battery with a membrane separator that allows ion and electron transport. Sumitomo Electric Industries, Cellstrom, VRB Power Systems and EnerVault produce this type of battery. The redox batteries can use V+2/V+3 and VO+2 as redox couples win sulfuric acid as [art of the flow system. This type of battery performed well in field tests in Kenya [18]. Kema has developed vanadium/iron chromium redox flow batteries and vanadium/air batteries as well and testing is now underway[19].
Figure 2.3 Vanadium-redox flow battery from Cellstrom showing the separate paths for the positive and negative electrolytes [20].
19 The Arizona Research Institute for Solar Energy (AzRISE) - APS Final Draft Report, Compressed Air Energy Storage and Photovoltaics Study, University of Arizona, August 2010
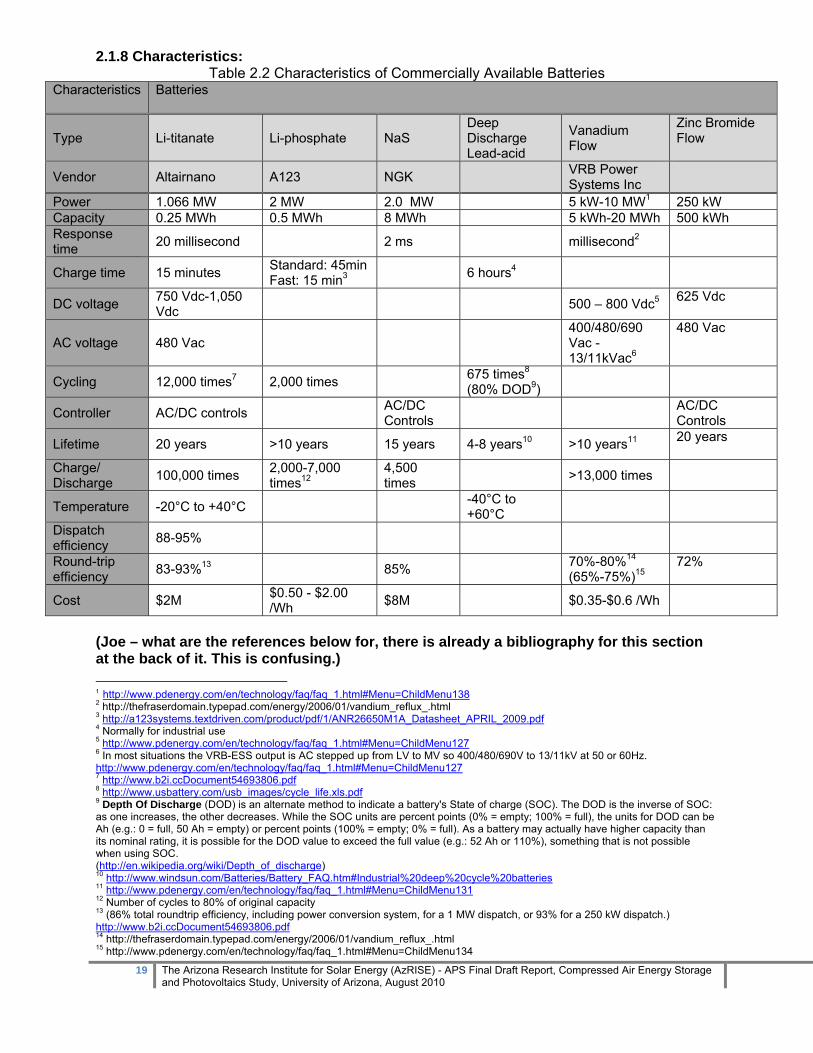
2.1.8 Characteristics: Table 2.2 Characteristics of Commercially Available Batteries
Characteristics Batteries
Type Li-titanate Li-phosphate NaS Deep Discharge Lead-acid
Vanadium Flow
Zinc Bromide Flow
Vendor Altairnano A123 NGK VRB Power Systems Inc
Power 1.066 MW 2 MW 2.0 MW 5 kW-10 MW1 250 kW Capacity 0.25 MWh 0.5 MWh 8 MWh 5 kWh-20 MWh 500 kWh Response time 20 millisecond 2 ms millisecond2
Charge time 15 minutes Standard: 45min Fast: 15 min3 6 hours4
DC voltage 750 Vdc-1,050 Vdc 500 – 800 Vdc5 625 Vdc
AC voltage 480 Vac 400/480/690 Vac -13/11kVac6
480 Vac
Cycling 12,000 times7 2,000 times 675 times8 (80% DOD9)
Controller AC/DC controls AC/DC Controls AC/DC
Controls
Lifetime 20 years >10 years 15 years 4-8 years10 >10 years11 20 years
Charge/ Discharge 100,000 times 2,000-7,000
times12 4,500 times >13,000 times
Temperature -20°C to +40°C -40°C to +60°C
Dispatch efficiency 88-95%
Round-trip efficiency 83-93%13 85% 70%-80%14
(65%-75%)15 72%
Cost $2M $0.50 - $2.00 /Wh $8M $0.35-$0.6 /Wh
(Joe – what are the references below for, there is already a bibliography for this section at the back of it. This is confusing.) 1 http://www.pdenergy.com/en/technology/faq/faq_1.html#Menu=ChildMenu138 2 http://thefraserdomain.typepad.com/energy/2006/01/vandium_reflux_.html 3 http://a123systems.textdriven.com/product/pdf/1/ANR26650M1A_Datasheet_APRIL_2009.pdf 4 Normally for industrial use 5 http://www.pdenergy.com/en/technology/faq/faq_1.html#Menu=ChildMenu127 6 In most situations the VRB-ESS output is AC stepped up from LV to MV so 400/480/690V to 13/11kV at 50 or 60Hz. http://www.pdenergy.com/en/technology/faq/faq_1.html#Menu=ChildMenu127 7 http://www.b2i.ccDocument54693806.pdf 8 http://www.usbattery.com/usb_images/cycle_life.xls.pdf 9 Depth Of Discharge (DOD) is an alternate method to indicate a battery's State of charge (SOC). The DOD is the inverse of SOC: as one increases, the other decreases. While the SOC units are percent points (0% = empty; 100% = full), the units for DOD can be Ah (e.g.: 0 = full, 50 Ah = empty) or percent points (100% = empty; 0% = full). As a battery may actually have higher capacity than its nominal rating, it is possible for the DOD value to exceed the full value (e.g.: 52 Ah or 110%), something that is not possible when using SOC. (http://en.wikipedia.org/wiki/Depth_of_discharge) 10 http://www.windsun.com/Batteries/Battery_FAQ.htm#Industrial%20deep%20cycle%20batteries 11 http://www.pdenergy.com/en/technology/faq/faq_1.html#Menu=ChildMenu131 12 Number of cycles to 80% of original capacity 13 (86% total roundtrip efficiency, including power conversion system, for a 1 MW dispatch, or 93% for a 250 kW dispatch.) http://www.b2i.ccDocument54693806.pdf 14 http://thefraserdomain.typepad.com/energy/2006/01/vandium_reflux_.html 15 http://www.pdenergy.com/en/technology/faq/faq_1.html#Menu=ChildMenu134

20 The Arizona Research Institute for Solar Energy (AzRISE) - APS Final Draft Report, Compressed Air Energy Storage and Photovoltaics Study, University of Arizona, August 2010

21 The Arizona Research Institute for Solar Energy (AzRISE) - APS Final Draft Report, Compressed Air Energy Storage and Photovoltaics Study, University of Arizona, August 2010
2.1.8 Prices Price comparisons are difficult to obtain, as prices are changing rapidly and are also adjusted to the size of the purchase. The table, from reference 6, shows reasonable estimates.
Table 2.3 Battery cost estimates by technology [6].
2.1.9 Summary of Battery review and future work There are three applications for batteries in utility level power systems: 1. Power regulation. 2. Filling in the weather related intermittency of renewable energy sources like wind and solar. 3. Peak-shaving by supplying power during peak demand or by lengthening the solar day. For power regulation, the Altairnano battery has demonstrated good capability to follow rapid ramps and to respond rapidly in a test published by KEMA. This battery needs to be tested in the field. Its high price has been a deterrent to expanded adoption so far. Sodium sulfur batteries have been used more in utility systems than the other forms of batteries mentioned in this report. For example, NGK Insulators has installed 302 MW in 215 systems for load leveling of factories and buildings [12]. The Department of Energy has funded the development of 3MW of lead-carbon battery technology by East Penn for regulation and peak shaving. The company claims peak-shaving and power regulation capabilities, however there no test data from East Penn could be analyzed. Lead-acid batteries are the most used in back-up operations, but loss of useful life with depth of cycle is a major problem. The graph below shows 1/8th the cycle life with 80% depth of discharge in deep-cycle lead acid batteries. This means that users must over-design systems with lead-acid batteries to reduce the chance of deep discharge in order to maintain longer battery life.
Figure 2.4 - Absolyte GP Performance Characteristics at 25oC [Exide Corporation Section 62.61 (2008)].
22 The Arizona Research Institute for Solar Energy (AzRISE) - APS Final Draft Report, Compressed Air Energy Storage and Photovoltaics Study, University of Arizona, August 2010
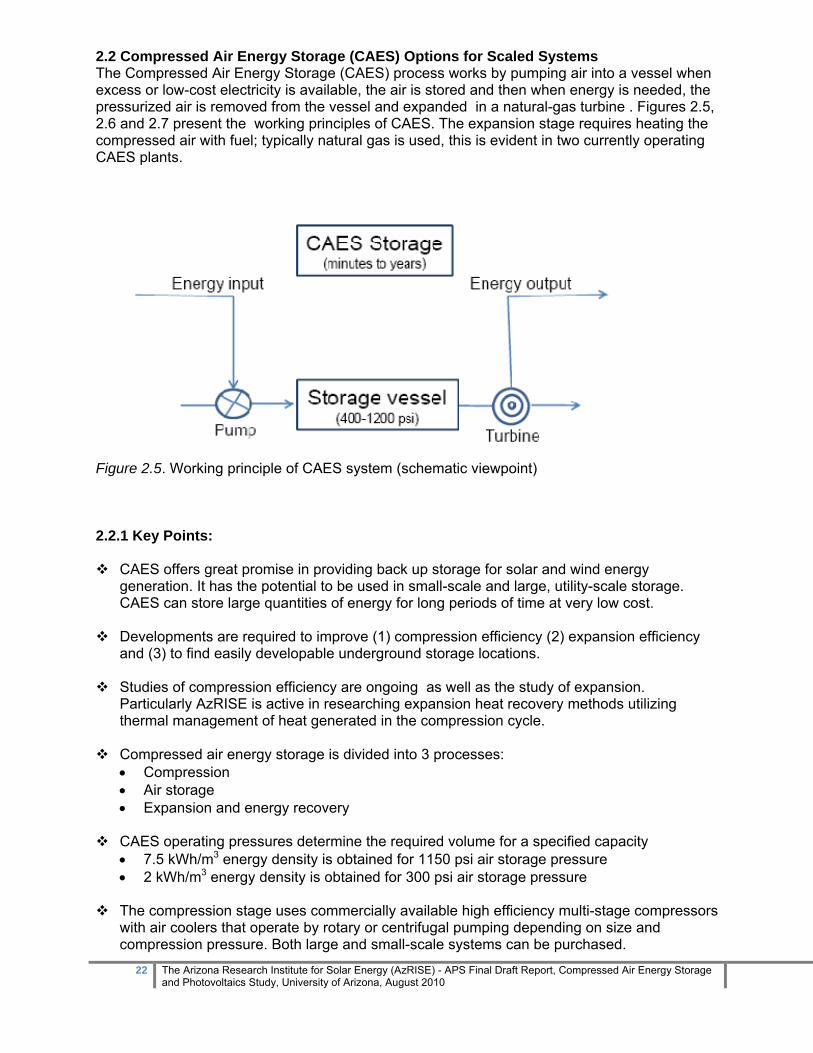
2.2 Compressed Air Energy Storage (CAES) Options for Scaled Systems The Compressed Air Energy Storage (CAES) process works by pumping air into a vessel when excess or low-cost electricity is available, the air is stored and then when energy is needed, the pressurized air is removed from the vessel and expanded in a natural-gas turbine . Figures 2.5, 2.6 and 2.7 present the working principles of CAES. The expansion stage requires heating the compressed air with fuel; typically natural gas is used, this is evident in two currently operating CAES plants.
Figure 2.5. Working principle of CAES system (schematic viewpoint) 2.2.1 Key Points:
CAES offers great promise in providing back up storage for solar and wind energy generation. It has the potential to be used in small-scale and large, utility-scale storage. CAES can store large quantities of energy for long periods of time at very low cost.
Developments are required to improve (1) compression efficiency (2) expansion efficiency and (3) to find easily developable underground storage locations.
Studies of compression efficiency are ongoing as well as the study of expansion. Particularly AzRISE is active in researching expansion heat recovery methods utilizing thermal management of heat generated in the compression cycle.
Compressed air energy storage is divided into 3 processes: • Compression • Air storage • Expansion and energy recovery
CAES operating pressures determine the required volume for a specified capacity
• 7.5 kWh/m3 energy density is obtained for 1150 psi air storage pressure • 2 kWh/m3 energy density is obtained for 300 psi air storage pressure
The compression stage uses commercially available high efficiency multi-stage compressors
with air coolers that operate by rotary or centrifugal pumping depending on size and compression pressure. Both large and small-scale systems can be purchased.
23 The Arizona Research Institute for Solar Energy (AzRISE) - APS Final Draft Report, Compressed Air Energy Storage and Photovoltaics Study, University of Arizona, August 2010
• Compression uses intercoolers and an aftercooler to keep air temperature low to minimize thermal stress on the storage chamber(s).
The air storage can be done by many methods: • Solution-mined salt caverns, • Abandoned natural-gas wells • Hard rock: abandoned limestone mine • Aquifers: storage in porous rocks below the water table is best due to the ability to
maintain constant air pressure during the full cycle, but forming a seal with a cap rock is difficult.
• Surface or buried air tanks.
The air storage method determines the capacity and cost of the CAES system.
Air expansion and energy recovery are the most critical factors in determining the efficiency and cost of the storage process. During energy recovery, air is withdrawn from storage and combusted with added fuel to operate multistage turbines.
Most CAES R&D focuses on an improvement of air expansion efficiency similar to studies of natural-gas burners or combustion turbines.
2.2.2 Technology Compared to a combustion turbine, CAES plants burn about one-third of the fuel and produces about one-third of the pollutants per kWh of plant output. CAES is not a direct energy storage system. As stated earlier CAES uses off-peak or excess electricity production to compress air that is stored under pressure in a specific vessel or appropriate geologic formation. Then during on-peak periods, the compressed air is extracted and delivered as a combustion air source for a conventional combustion turbine [21, 22]. CAES is a mature technology but it is not deployed as regularly as pumped hydro. The electricity is stored by compressing air via electrical compressors in huge storage facilities, mostly situated underground in caverns created inside appropriate salt rocks, abandoned hard-rock mines, or natural aquifers. Recovery of the compressed air takes place by expanding it through a turbine, however, the operating units worldwide incorporate combustion prior to turbine expansion in order to increase the overall efficiency of the system. Hence CAES can be regarded as a peaking gas turbine power plant, but with a higher efficiency, thanks to the decoupling of compressor and turbine, and much lower overall cost. Deployment is often dependent on the availability of suitable underground reservoirs but custom-built high-pressure storage tanks can be utilized [23]. CAES can be used for energy arbitrage by pre-compressing air using low cost electricity from the power grid at off-peak times and producing energy when prices are higher. The lower electricity/fuel ratio is an important design criterion for CAES plants. 2.2.3 CAES Operation Process CAES systems operate much in the same way as a conventional gas turbine except that compression and expansion operations occur independently and at different times (see Figures 2.5 and 2.6). Because compression energy is supplied separately, the full output of the turbine can be used to generate electricity during expansion, whereas conventional gas turbines typically use two thirds of the output power from the expansion stage to run the compressor.
24 The Arizona Research Institute for Solar Energy (AzRISE) - APS Final Draft Report, Compressed Air Energy Storage and Photovoltaics Study, University of Arizona, August 2010
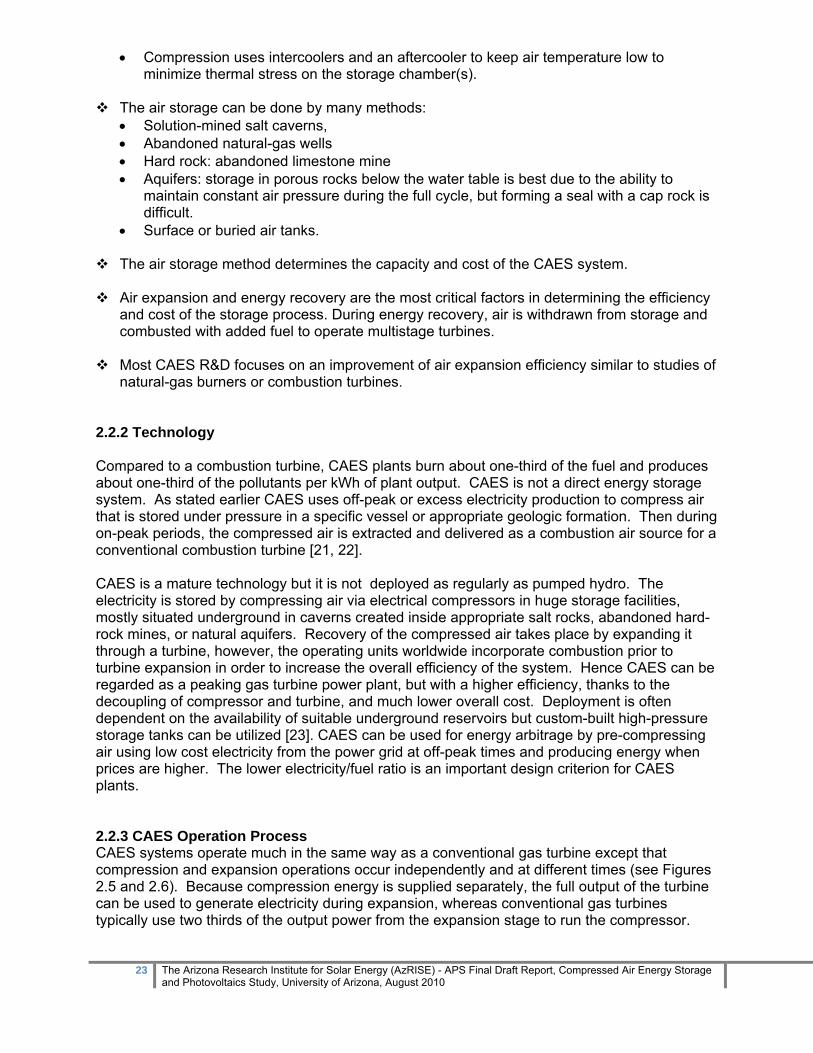
Typically, the operation of a CAES system includes three processes, 1) compression process, 2) air storage and 3) expansion/generation process.
Figure 2.6: Typical advanced CAES system configuration [22].
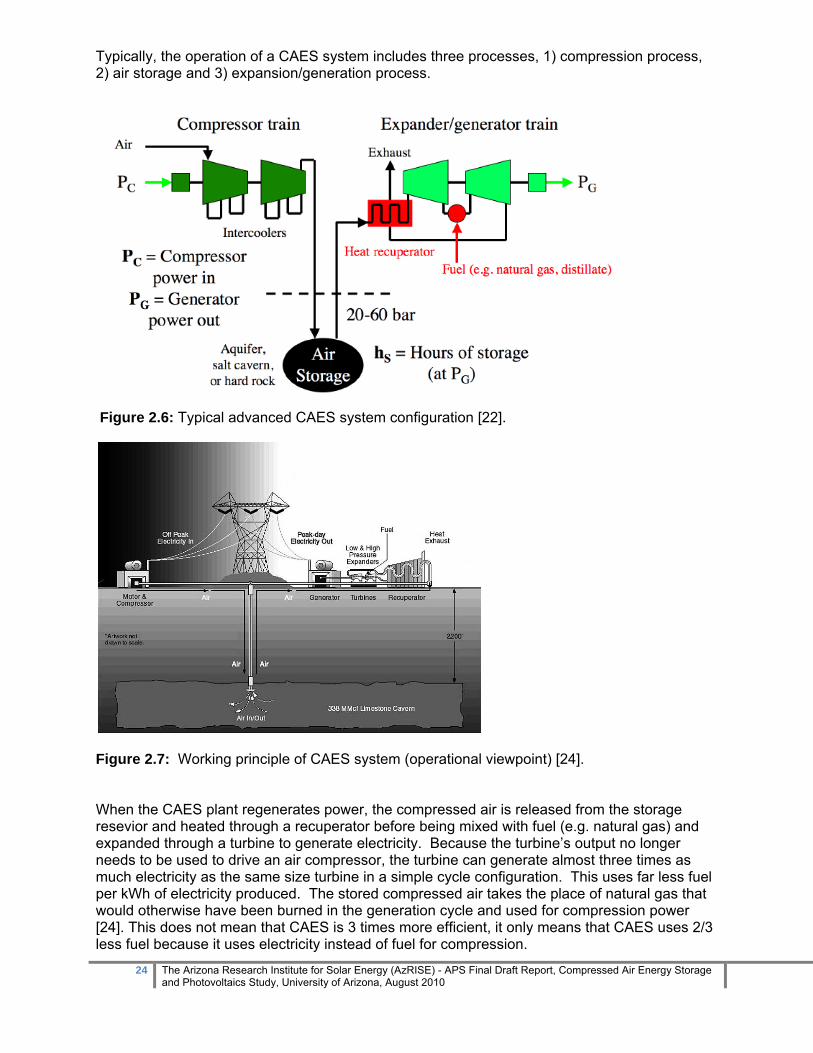
Figure 2.7: Working principle of CAES system (operational viewpoint) [24]. When the CAES plant regenerates power, the compressed air is released from the storage resevior and heated through a recuperator before being mixed with fuel (e.g. natural gas) and expanded through a turbine to generate electricity. Because the turbine’s output no longer needs to be used to drive an air compressor, the turbine can generate almost three times as much electricity as the same size turbine in a simple cycle configuration. This uses far less fuel per kWh of electricity produced. The stored compressed air takes the place of natural gas that would otherwise have been burned in the generation cycle and used for compression power [24]. This does not mean that CAES is 3 times more efficient, it only means that CAES uses 2/3 less fuel because it uses electricity instead of fuel for compression.

25 The Arizona Research Institute for Solar Energy (AzRISE) - APS Final Draft Report, Compressed Air Energy Storage and Photovoltaics Study, University of Arizona, August 2010
In the technology review presented in the subsequent sections , we will separate the 3 operations of a CAES system into compression, expansion and storage. In each case, we will examine small-scale and large-scale systems. 2.2.3.1. Compression Process During the compression mode of operation, electricity is used to run a chain of compressors that inject air into an un-insulated storage reservoir, thus storing the air at high pressure and at the temperature of the surrounding geological formation. Since all gases heat up in compression, a large heat of compression is produced [25]. The compression chain makes use of intercoolers and an aftercooler to reduce the temperature of the injected air. At each stage of compression the efficiency is higher if the air temperature is lower. Transferring the compressed air to a storage vessel near room temperature increases the overall efficiency of operation. This leads to a reduction in associated storage volume and minimizes thermal stresses on the walls of the storage reservoir. These conditions encourage cooling the air before, during and after the compression stage. Despite the loss of heat via compression chain intercoolers, the theoretical efficiency for CAES using a system with a large number of compressor stages and intercooling can approach that for a system with adiabatic compression and air storage in an insulated cavern [24]. 2.2.3.2. Expansion Process During the expansion (generation) operation mode, air is withdrawn from the storage reservoir and fuel (typically natural gas) is combusted with the pressurized air. The combustion products are then expanded (typically in two stages), thus generating electricity. Fuel is combusted during generation for capacity, efficiency and operational considerations. Expanding air at the wall temperature of the reservoir would necessitate much higher air flow in order to achieve the same turbine output – thus increasing the compressor energy input requirements to the extent that the charging energy ratio would be reduced by approximately a factor of four. Furthermore, in the absence of fuel combustion, the low temperatures at the turbine outlet would pose a significant icing risk for the blades because of the large airflow through the turbine, despite the small specific moisture content for air at high pressure. There is also the possibility that the turbine materials and seals might become brittle during low temperature operation [24]. Fuel combustion heats the air and uses the oxygen content of the air to gain additional energy beyond the hydraulic process. When combustion is added, the expansion process can increase the overall efficiency of CAES. 2.2.3.3. Air Storage There are two categories of air storage systems which are characterized by the different location of the storage reservoirs. One is the above-ground storage system, and the other is the underground system. Each type of the storage has its own specific requirements. Currently, the underground storage reservoirs are much more feasible and applicable from both technical and economical considerations for large-scale systems (100 kW and larger), while above-ground systems can work for small-scale systems (10 kW). 2.2.3.3.1. Storage Categories Above-ground or Near Surface Pipelines: The compressed air can be stored in above-ground or near-surface pressurized air pipelines (including those used to transport high-pressure natural gas), but due to cost concerns, such above ground air storage plants can only store

26 The Arizona Research Institute for Solar Energy (AzRISE) - APS Final Draft Report, Compressed Air Energy Storage and Photovoltaics Study, University of Arizona, August 2010
about 2 to 4 hours of energy. The air pressure required during storage is dictated by the expander used. Typical CAES systems use Gas Combustion Turbines that work well at about 70 atmospheres. This requires the use of more expensive stainless steel tanks or pipes for storage. Because of the expense of stainless steel tanks and pipe, only several hours worth of storage has been proposed for this use in CAES concept according to Nakhamkin [26]. If the air expander operates at or below 400psi, then typical propane tanks may be used, therefore significantly reducing the cost of the storage vessel. Smaller on-site plants may be built using aboveground man-made reservoirs, possibly posing special safety or permitting challenges. Underground: Porous rock formations, depleted natural gas/oil fields, and caverns in salt or rock formations offer the best underground storage reservoir options. When using underground geologic formations to store air, large amounts of energy can be stored cost-effectively. Approximately three-fourths of the United States has geology potentially suited for siting reliable underground air storage CAES systems [27]. (a) Salt option The map in Figure 2.8 shows some identified areas with geologic salt deposits in the U.S. Both bedded and dome salt deposits can be used for compressed air storage. Domal salt is preferred since it is formed by a homogenous deposit of salt. Caves made in domal salt deposits will most likely be free of any air leaks. Bedded slat deposits are formed in layers and their leakage potential is determined by the material in the intermediate layers. Figure 2.8 – US map showing approximate locations of bedded and domal salt deposits.
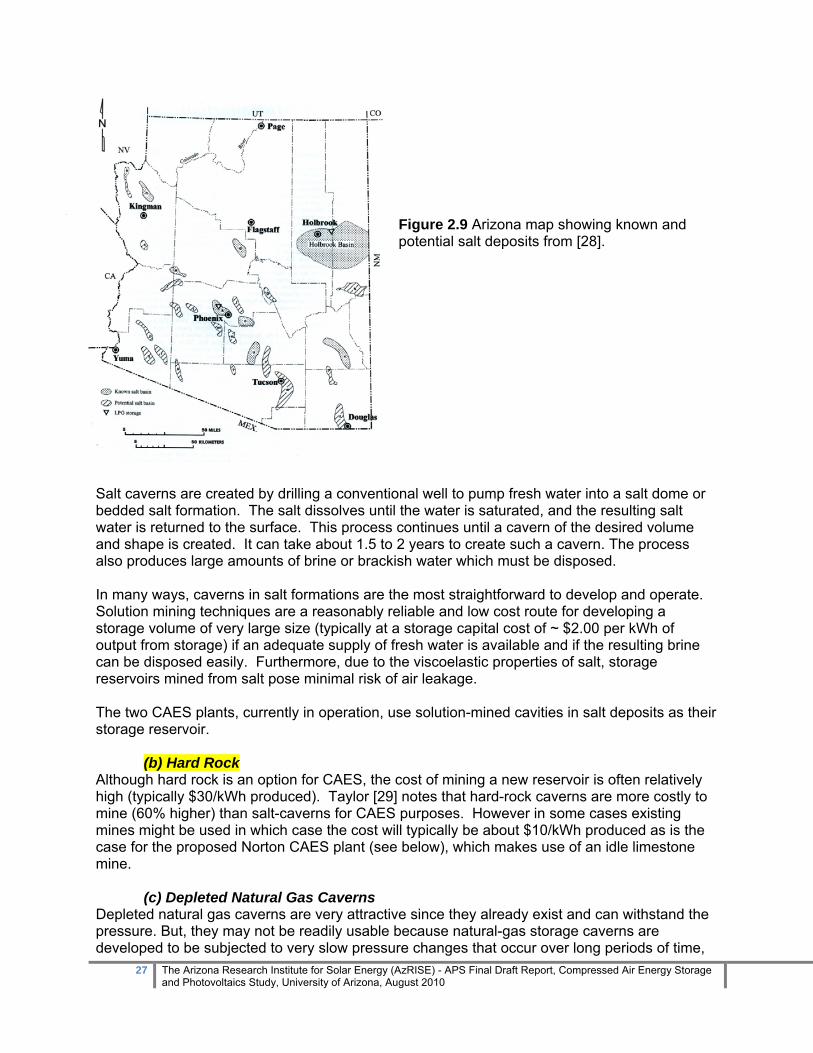
Arizona has a large domal salt deposit in the Luke Basin West of Phoenix and a very large bedded salt deposit in the Holbrook Basin, in the Northeast part of the State. Steven Rauzi from the AZ Geological Survey has published maps of potential salt deposits in the State [28]. A state map is shown in Figure 2.9.
27 The Arizona Research Institute for Solar Energy (AzRISE) - APS Final Draft Report, Compressed Air Energy Storage and Photovoltaics Study, University of Arizona, August 2010
Figure 2.9 Arizona map showing known and potential salt deposits from [28].
Salt caverns are created by drilling a conventional well to pump fresh water into a salt dome or bedded salt formation. The salt dissolves until the water is saturated, and the resulting salt water is returned to the surface. This process continues until a cavern of the desired volume and shape is created. It can take about 1.5 to 2 years to create such a cavern. The process also produces large amounts of brine or brackish water which must be disposed. In many ways, caverns in salt formations are the most straightforward to develop and operate. Solution mining techniques are a reasonably reliable and low cost route for developing a storage volume of very large size (typically at a storage capital cost of ~ $2.00 per kWh of output from storage) if an adequate supply of fresh water is available and if the resulting brine can be disposed easily. Furthermore, due to the viscoelastic properties of salt, storage reservoirs mined from salt pose minimal risk of air leakage. The two CAES plants, currently in operation, use solution-mined cavities in salt deposits as their storage reservoir. (b) Hard Rock Although hard rock is an option for CAES, the cost of mining a new reservoir is often relatively high (typically $30/kWh produced). Taylor [29] notes that hard-rock caverns are more costly to mine (60% higher) than salt-caverns for CAES purposes. However in some cases existing mines might be used in which case the cost will typically be about $10/kWh produced as is the case for the proposed Norton CAES plant (see below), which makes use of an idle limestone mine. (c) Depleted Natural Gas Caverns Depleted natural gas caverns are very attractive since they already exist and can withstand the pressure. But, they may not be readily usable because natural-gas storage caverns are developed to be subjected to very slow pressure changes that occur over long periods of time,

28 The Arizona Research Institute for Solar Energy (AzRISE) - APS Final Draft Report, Compressed Air Energy Storage and Photovoltaics Study, University of Arizona, August 2010
while CAES storage requires daily variations between minimum and maximum pressures. The associated cyclic mechanical stresses developed in the CAES storage caverns may cause cyclic fatigue in the walls. (d) Porous Rock Porous rock formations such as saline or fresh-water aquifers offer a good CAES air storage option. Porous reservoirs have the potential to be the least costly storage option for large-scale CAES with an estimated development cost of ~$0.11/kWh for incremental storage volume expansion. In addition, large, homogeneous aquifers potentially suitable for CAES operation can be found throughout many areas of the central US. Because this area coincides with areas of high quality wind, and because of the limited availability and/or cost-effectiveness of other options, aquifer CAES will be especially relevant to the discussion of energy storage for balancing wind. Despite its potential for low cost development, utilization of an aquifer for CAES requires extensive characterization of a candidate site to determine its suitability [24]. In summary, the need for geologically suitable locations for underground storage acts as a significant constraint to the deployment of CAES technology. Detailed studies of underground geology are essential before excavation and can be very expensive, potentially requiring drilling deep pilot holes. 2.2.4. Operation Assessment Since CAES uses two energy sources – natural gas and electricity – it is difficult to specify efficiency in a meaningful way. Based on the efficiency of compression and expansion, Herr [30] gives an efficiency of 64% for large systems. Size limitations are driven mostly by the size of the gas turbines available. CAES offers an alternative to PHES for the storage of a large amount of power, most usefully for load leveling. It can also provide ancillary services, including reactive power. CAES plants can ramp faster than simple-cycle gas-fired plants because they are not restrained by compression requirements. Zink [31] points to studies concluding that CAES is competitive with combustion turbines and combined-cycle units, even without attributing some of the unique benefits of energy storage. In contrast to other storage technologies CAES is dependent on supplies of primary fuel in addition to an electrical supply. Air emissions (from combustion of gas) and most safety issues are very similar to other gas turbine-based generation plants. Ridge Energy designs standard compression train blocks of 100MW each and standard generation blocks of 135MW. In generation mode, the plant can start up from 0 to 100% in less than 10 minutes. A normal ramp up from 10 to 100% load is 4 minutes, while in emergency it can be done in 2 minutes. Ramping from 50% to 100% can be accomplished in less than 15 seconds. As for the compression, the full load is reached in less than 10 minutes, and the 50% - 100% ramp in less than 10 seconds. They are capable of black start. Schoenung [32] and Gordon [33] project capital costs to range between $425 and $480/kW for advanced designs if expected commercialization occurs and expected experience is gained. Energy related costs are estimated between $3/kWh by Schoenung [32] and $10/kWh by Gordon [33]. Costs depend largely on special requirements related to geologic reservoirs. The O&M costs (excluding fuel) will also be heavily affected by the reservoir characteristics. Developers / Suppliers: CAES Development Company, Ridge Energy Storage, Dresser-Rand [34].

29 The Arizona Research Institute for Solar Energy (AzRISE) - APS Final Draft Report, Compressed Air Energy Storage and Photovoltaics Study, University of Arizona, August 2010
Figure 2.10 – Comparison of CO2 emissions from coal, simple and combined cycle and CAES power generation. 2.2.5. Potential Improvements in CAES operation One of the challenges with CAES is the heating of the air during the compression cycle and the cooling during the expansion cycle. Both are problematic from an operational standpoint and as a source of wasted energy. In the compression cycle, pump coolers must be used to dissipate the compression heat. In the expansion, the burning of natural gas reheats the air to allow operation of the expansion turbine. Thermal Management: Under standard operational procedures, the true efficiency of CAES based on total energy out divided by total energy in is about 64%. Often those calculating the efficiency will modify the natural gas energy in by its equivalent energy producing efficiency for a natural gas burner and then, the efficiency will increase to 80%. It is known, however, that if the heat from the compression is stored and reused in the expansion process, the efficiency increase can go up by 10 to 15% [25]. Thermal management can be conducted using a heat exchanger in the compression pump, molten salt heat storage and a heat exchanger in the expansion turbine and between the two expansion stages typically used. This type of thermal management can reduce the natural gas consumption to 50% of the original amount and with a special design; a reduction to only 25% is also possible. Reductions to 0% natural gas are also possible with adiabatic CAES or isothermal CAES. In the studies conducted at UA and presented below, thermal management will be considered, since its development is ready to be demonstrated in the next year in studies at AzRISE funded by Science Foundation Arizona (SFAZ). There are many variations possible on the CAES theme including approaches that promise to eliminate the need for natural gas. Of variations the two opposites are Advanced Adiabatic CAES (AACAES) and Isothermal CAES (ICAES). Then many variants exist that modify the expansion cycle. Today, high efficiency compressors are available commercially. The main developments in CAES are in the very inefficient expansion process.

30 The Arizona Research Institute for Solar Energy (AzRISE) - APS Final Draft Report, Compressed Air Energy Storage and Photovoltaics Study, University of Arizona, August 2010
Advanced-Adiabatic CAES: As noted above the heat of compression can be recovered from the aftercooler in the air compressor and stored in a molten salt bath and reused in the expansion stage. This is often called Advanced-Adiabatic CAES (AACAES). Advanced turbomachinery for Adiabatic CAES is being developed by RWE Power AG and GE Energy Infrastructure [35].
Figure 2.11 - Illustration from Del Turco [35] of a basic AACAES system. TES stands for thermal energy storage.
The plant to be tested has been designed at 200 MW (1,000-2,000 MWh) for optimized cost. The system uses multi-stage centrifugal compressors and turbine expanders. An overall efficiency of 70% is expected in large-scale storage systems. Adsorption-Enhanced CAES: The Advanced-Adiabatic CAES approach is modified using an adsorption heat pump by T. Havel (Energy Compression, Inc.) [36]. The process mixes adiabatic compression cycles with adsorption of compressed air in zeolite and adiabatic expansion to produce energy storage that can be recovered without using fuel. The process temperatures vary from -40C during expansion to 107C during compression. One problem is the need for large scale quantities of zeolite and the need to remove vast quantities of heat from the zeolite bed to adsorb the air, then return vast quantities of heat to the bed to release the air. Its advantage lies in the fact that the heat needed is at reasonably modest temperatures. This approach promises CAES without fuel and at reasonably low cost, but it is still under development. Clearly, the adiabatic CAES process and all its variants cannot eliminate the need for burning fuel unless excess energy is used in the compression cycle. On an energy balance basis, this is not a recommended approach since it uses electrical energy to create heat. However as pointed out by R. Schainker from EPRI [37], if there is a tax on carbon, then the less economical AACAES will become advantageous.
Figure 2.12 - Illustration from Shainker [37]. Note the lower cost of standard CAES without carbon tax. The reason for this difference comes from the energy balance - Standard CAES produces 1 kWh of energy from 0.75 kWh of compression and 4300 BTU of natural gas in expansion. Adiabatic CAES produces 0.67 kWh of stored energy from 1 kWh of compression energy – an efficiency of 67%.
Isothermal CAES: Another approach is to avoid changing temperature in the CAES system. Isothermal CAES is the most efficient CAES operation and requires slow pumping and expansion. For this reason it
31 The Arizona Research Institute for Solar Energy (AzRISE) - APS Final Draft Report, Compressed Air Energy Storage and Photovoltaics Study, University of Arizona, August 2010
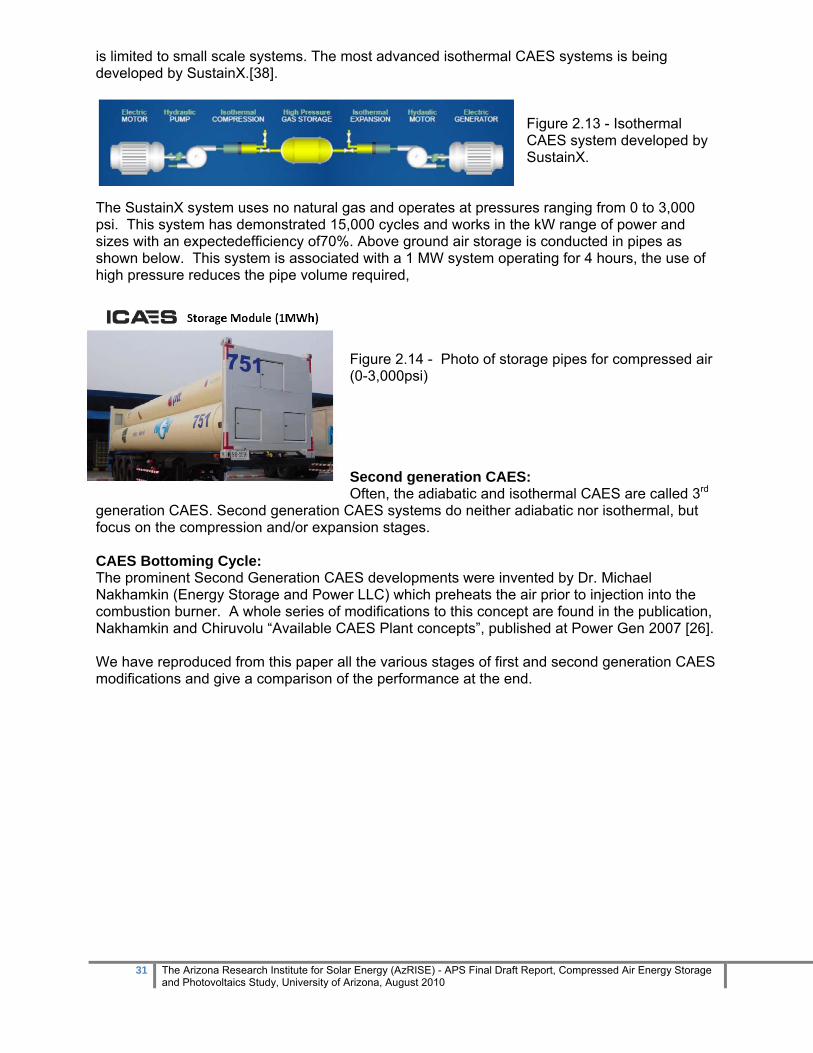
is limited to small scale systems. The most advanced isothermal CAES systems is being developed by SustainX.[38].
Figure 2.13 - Isothermal CAES system developed by SustainX.
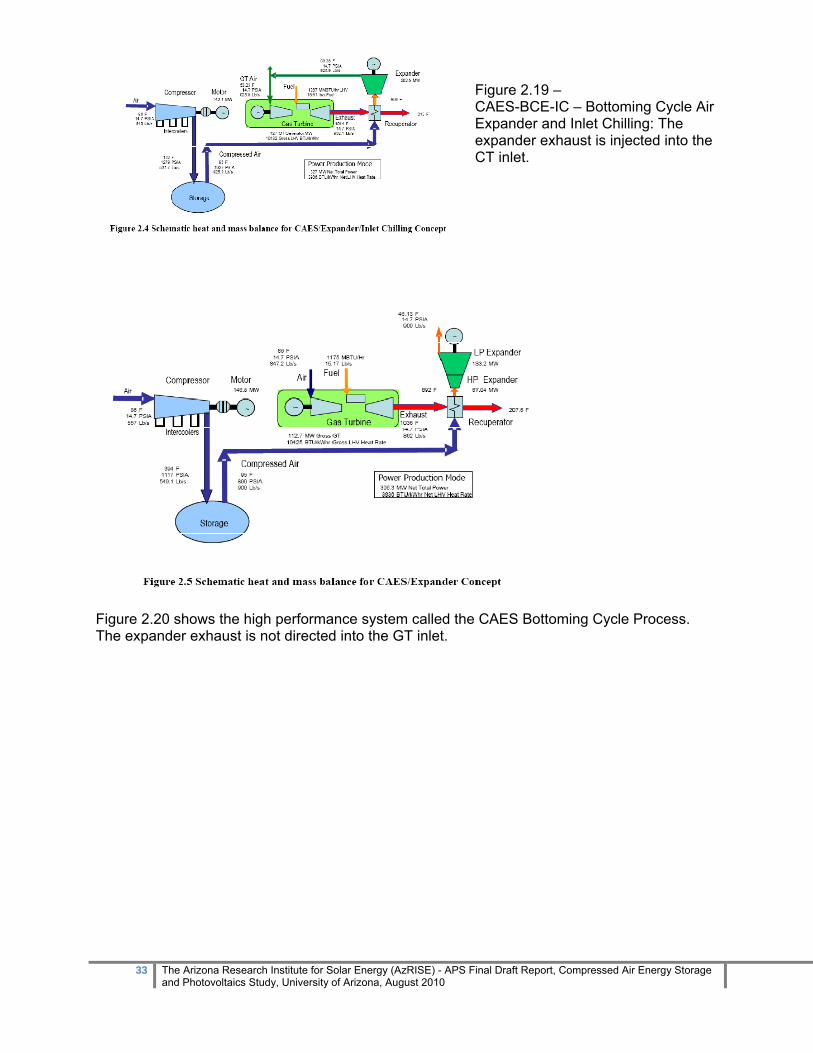
The SustainX system uses no natural gas and operates at pressures ranging from 0 to 3,000 psi. This system has demonstrated 15,000 cycles and works in the kW range of power and sizes with an expectedefficiency of70%. Above ground air storage is conducted in pipes as shown below. This system is associated with a 1 MW system operating for 4 hours, the use of high pressure reduces the pipe volume required,
Figure 2.14 - Photo of storage pipes for compressed air (0-3,000psi) Second generation CAES: Often, the adiabatic and isothermal CAES are called 3rd
generation CAES. Second generation CAES systems do neither adiabatic nor isothermal, but focus on the compression and/or expansion stages. CAES Bottoming Cycle: The prominent Second Generation CAES developments were invented by Dr. Michael Nakhamkin (Energy Storage and Power LLC) which preheats the air prior to injection into the combustion burner. A whole series of modifications to this concept are found in the publication, Nakhamkin and Chiruvolu “Available CAES Plant concepts”, published at Power Gen 2007 [26]. We have reproduced from this paper all the various stages of first and second generation CAES modifications and give a comparison of the performance at the end.

32 The Arizona Research Institute for Solar Energy (AzRISE) - APS Final Draft Report, Compressed Air Energy Storage and Photovoltaics Study, University of Arizona, August 2010
Figure 2.15 - First generation CAES - simplified schematic of the McIntosh plant. High construction costs.
Figure 2.16 - Second Generation CAES with Air Injection Concept – the stored compressed air is preheated by the combustion process before injection in the gas turbine burner. Cost reductions come from the use of a commercial Combustion Turbine burner.
Figure 2.17 – CAES-AI-HP Concept: here we add a high pressure expander that adjusts the pressure of the pre-heated compressed air to match the inlet pressure of the Gas CT burner.
Figure 2.18 – CAES-AI-BCE concept with the Bottoming Cycle Air Expander: The addition of a low pressure expander can allow control of compressed air flow to match optimize CT operation. This process allows the use of a modern gas turbine to run at higher temperatures and with lower NOx emissions than conventional CAES. The natural gas consumption is reduced from 4200 BTU/kWh in the McIntosh plant to 3800 BTU/kWh.
33 The Arizona Research Institute for Solar Energy (AzRISE) - APS Final Draft Report, Compressed Air Energy Storage and Photovoltaics Study, University of Arizona, August 2010
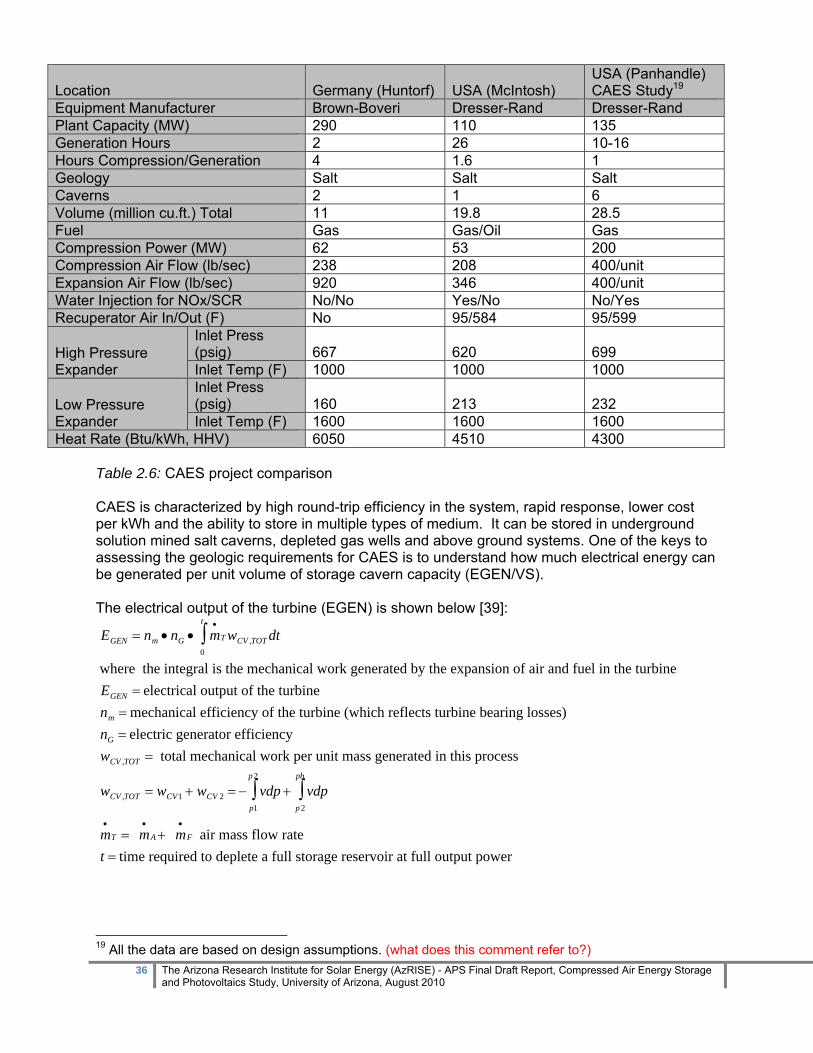
Figure 2.19 – CAES-BCE-IC – Bottoming Cycle Air Expander and Inlet Chilling: The expander exhaust is injected into the CT inlet.
Figure 2.20 shows the high performance system called the CAES Bottoming Cycle Process. The expander exhaust is not directed into the GT inlet.

34 The Arizona Research Institute for Solar Energy (AzRISE) - APS Final Draft Report, Compressed Air Energy Storage and Photovoltaics Study, University of Arizona, August 2010
Table 2.4 - Comparison of performance for all the modifications. The major difference between the proposed second generation CAES plants and the conventional Gas Turbine (GE 9171E) is the greater amount of power produced (three times for the same capital cost) and the lowered natural gas consumption (one third).

35 The Arizona Research Institute for Solar Energy (AzRISE) - APS Final Draft Report, Compressed Air Energy Storage and Photovoltaics Study, University of Arizona, August 2010
2.2.6. Analysis of CAES as resource in utility operations The following tables compare the design and operating parameters of the two existing CAES plants and the design of the proposed CAES plant in Texas. All of these three CAES plants have capacities above 100 MW (large-scale systems).
Scale Division16
Small Scale (<10MW)
Middle Scale (10MW-100MW)
Large Scale (>100MW) (see Table 3)
System Location Germany (Huntdorf)
USA (McIntosh)
USA (Panhandle, TX) CAES Study17
Equipment Manufacturer Brown-Boveri
Dresser-Rand Dresser-Rand
Plant Maximum Capacity (MW) 290 110 135 Geology Salt Salt Salt Hours Compression/Generation 4 1.6 1 Average Heat Rate18 (Btu/kWh) 6050 4510 4300 Fuel Gas Gas/oil Gas Charging Ratio, MW in/MW out 0.82 0.75 Aggregated Efficiency 64% Generation Hours at Max Capacity 2 26 10-16 Response Time (min) 14 10
Capital Cost (per MW) $647,070 (see Table 4)
Operational Cost (per MWh) $1.50 (see Table 4)
Table 2.5. Design and operating parameters of working CAES plants
16http://books.google.com/books?id=ucOUmIgQ5sQC&pg=PA214&lpg=PA214&dq=the+scale+of+CAes+system&source=bl&ots=KeP33P186o&sig=aMj8XqmqDKMGINNButTNrVhbUVs&hl=en&ei=PRPOStO1MZT8tQPIwom-Dg&sa=X&oi=book_result&ct=result&resnum=3#v=onepage&q=the%20scale%20of%20CAes%20system&f=false “Encyclopedia of energy engineering and technology, Volume 3” By Barney L. Capehart 17 All the data are based on design assumptions. 18 A measurement used in the energy industry to calculate how efficiently a generator uses heat energy. It is expressed as the number of BTUs of heat required to produce a kilowatt-hour of energy. Operators of generating facilities can make reasonably accurate estimates of the amount of heat energy a given quantity of any type of fuel, so when this is compared to the actual energy produced by the generator, the resulting figure tells how efficiently the generator converts that fuel into electrical energy. http://www.energyvortex.com/energydictionary/heat_rate.html
36 The Arizona Research Institute for Solar Energy (AzRISE) - APS Final Draft Report, Compressed Air Energy Storage and Photovoltaics Study, University of Arizona, August 2010
Location Germany (Huntorf) USA (McIntosh) USA (Panhandle) CAES Study19
Equipment Manufacturer Brown-Boveri Dresser-Rand Dresser-Rand Plant Capacity (MW) 290 110 135 Generation Hours 2 26 10-16 Hours Compression/Generation 4 1.6 1 Geology Salt Salt Salt Caverns 2 1 6 Volume (million cu.ft.) Total 11 19.8 28.5 Fuel Gas Gas/Oil Gas Compression Power (MW) 62 53 200 Compression Air Flow (lb/sec) 238 208 400/unit Expansion Air Flow (lb/sec) 920 346 400/unit Water Injection for NOx/SCR No/No Yes/No No/Yes Recuperator Air In/Out (F) No 95/584 95/599
High Pressure Expander
Inlet Press (psig) 667 620 699 Inlet Temp (F) 1000 1000 1000
Low Pressure Expander
Inlet Press (psig) 160 213 232 Inlet Temp (F) 1600 1600 1600
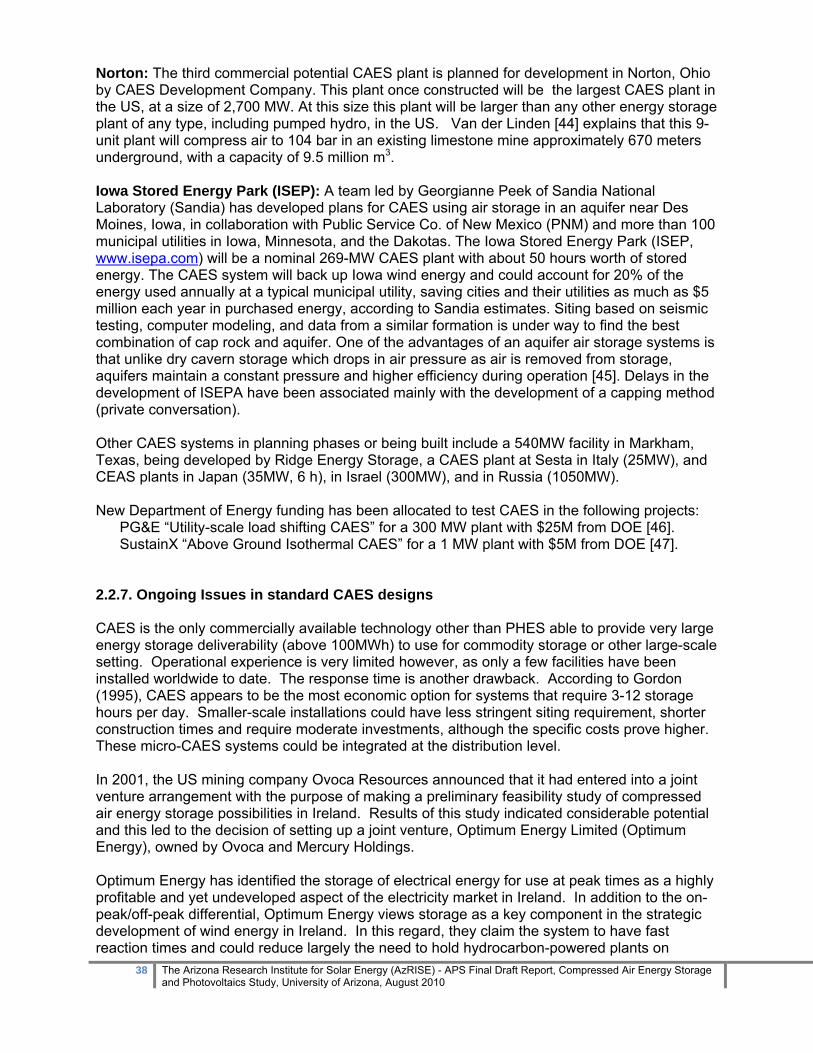
Heat Rate (Btu/kWh, HHV) 6050 4510 4300 Table 2.6: CAES project comparison CAES is characterized by high round-trip efficiency in the system, rapid response, lower cost per kWh and the ability to store in multiple types of medium. It can be stored in underground solution mined salt caverns, depleted gas wells and above ground systems. One of the keys to assessing the geologic requirements for CAES is to understand how much electrical energy can be generated per unit volume of storage cavern capacity (EGEN/VS). The electrical output of the turbine (EGEN) is shown below [39]:
19 All the data are based on design assumptions. (what does this comment refer to?)
EGEN = nm • nG • m•
T
0
t
∫ wCV ,TOT dt
where the integral is the mechanical work generated by the expansion of air and fuel in the turbineEGEN = electrical output of the turbinenm = mechanical efficiency of the turbine (which reflects turbine bearing losses)nG = electric generator efficiencywCV ,TOT = total mechanical work per unit mass generated in this process
wCV ,TOT = wCV1 + wCV 2 = − vdp + vdpp 2
pb
∫p1
p2
∫
m•
T = m•
A + m•
F air mass flow ratet = time required to deplete a full storage reservoir at full output power

37 The Arizona Research Institute for Solar Energy (AzRISE) - APS Final Draft Report, Compressed Air Energy Storage and Photovoltaics Study, University of Arizona, August 2010
2.2.7. Existing or Planned Projects Few projects have been successfully completed globally therefore CAES remains a technology of some potential but little experience. The site-specific nature, coupled with the modest demand for long-duration storage, has limited the market entry of CAES. Owing to the limited operational experience, the technical risk is considered high by many utilities according to Gordon [33]. Price [40] points out that the recently announced proposals for micro CAES using small gas turbines and pipelines as air receivers may reverse this trend. Micro CAES could be conveniently located near to load centers and become a useful distributed resource, but compressed air storage is still a critical factor. Huntorf: The first commercial CAES system was a 290MW unit built by ABB in Huntorf, Germany in 1978 (Figure 2.21). This plant was operational for 10 years with 90% availability and 99% reliability according to Breeze [41]. The storage reservoir was a 300,000 m3 underground cavity in a natural salt deposit, where air was stored at a pressure of 70 bars. The system was charged over an eight-hour period, and could deliver 300MW for 2 hours. Since 1978 the plant has delivered 465 GWh of electricity to the grid. The plant works at 41% overall efficiency and has performed more than 8,300 starts. The plant was retrofitted with new blades for the expansion turbine to increase power output by 31 MW in 2007 and is still operating [42].
Figure 2.21: 290MW CAES plant in Huntorf
McIntosh: The second commercial unit was a 110MW unit built by Dresser-Rand in McIntosh, Alabama in 1991. The construction took 30 months and cost $65M (about $591/kW). Semadeni [43] reports that the plant has since generated over 55 GWh during peak demand periods. It comes on line within 14 minutes and can supply the nominal power for 26 h according to Price [40].
EGEN
Vs=
αVs
m•
A
0
t
∫ (β +1− ( pb
p2
)k2 −1k2 )dt
α = nm • nG •cp 2T2(1+m•
F
m•
A
)
β =cp1T1
cp 2T2
1− ( pb
p2
)k2 −1k2
⎡
⎣ ⎢ ⎢
⎤
⎦ ⎥ ⎥
38 The Arizona Research Institute for Solar Energy (AzRISE) - APS Final Draft Report, Compressed Air Energy Storage and Photovoltaics Study, University of Arizona, August 2010
Norton: The third commercial potential CAES plant is planned for development in Norton, Ohio by CAES Development Company. This plant once constructed will be the largest CAES plant in the US, at a size of 2,700 MW. At this size this plant will be larger than any other energy storage plant of any type, including pumped hydro, in the US. Van der Linden [44] explains that this 9-unit plant will compress air to 104 bar in an existing limestone mine approximately 670 meters underground, with a capacity of 9.5 million m3. Iowa Stored Energy Park (ISEP): A team led by Georgianne Peek of Sandia National Laboratory (Sandia) has developed plans for CAES using air storage in an aquifer near Des Moines, Iowa, in collaboration with Public Service Co. of New Mexico (PNM) and more than 100 municipal utilities in Iowa, Minnesota, and the Dakotas. The Iowa Stored Energy Park (ISEP, www.isepa.com) will be a nominal 269-MW CAES plant with about 50 hours worth of stored energy. The CAES system will back up Iowa wind energy and could account for 20% of the energy used annually at a typical municipal utility, saving cities and their utilities as much as $5 million each year in purchased energy, according to Sandia estimates. Siting based on seismic testing, computer modeling, and data from a similar formation is under way to find the best combination of cap rock and aquifer. One of the advantages of an aquifer air storage systems is that unlike dry cavern storage which drops in air pressure as air is removed from storage, aquifers maintain a constant pressure and higher efficiency during operation [45]. Delays in the development of ISEPA have been associated mainly with the development of a capping method (private conversation). Other CAES systems in planning phases or being built include a 540MW facility in Markham, Texas, being developed by Ridge Energy Storage, a CAES plant at Sesta in Italy (25MW), and CEAS plants in Japan (35MW, 6 h), in Israel (300MW), and in Russia (1050MW). New Department of Energy funding has been allocated to test CAES in the following projects:
PG&E “Utility-scale load shifting CAES” for a 300 MW plant with $25M from DOE [46]. SustainX “Above Ground Isothermal CAES” for a 1 MW plant with $5M from DOE [47].
2.2.7. Ongoing Issues in standard CAES designs CAES is the only commercially available technology other than PHES able to provide very large energy storage deliverability (above 100MWh) to use for commodity storage or other large-scale setting. Operational experience is very limited however, as only a few facilities have been installed worldwide to date. The response time is another drawback. According to Gordon (1995), CAES appears to be the most economic option for systems that require 3-12 storage hours per day. Smaller-scale installations could have less stringent siting requirement, shorter construction times and require moderate investments, although the specific costs prove higher. These micro-CAES systems could be integrated at the distribution level. In 2001, the US mining company Ovoca Resources announced that it had entered into a joint venture arrangement with the purpose of making a preliminary feasibility study of compressed air energy storage possibilities in Ireland. Results of this study indicated considerable potential and this led to the decision of setting up a joint venture, Optimum Energy Limited (Optimum Energy), owned by Ovoca and Mercury Holdings. Optimum Energy has identified the storage of electrical energy for use at peak times as a highly profitable and yet undeveloped aspect of the electricity market in Ireland. In addition to the on-peak/off-peak differential, Optimum Energy views storage as a key component in the strategic development of wind energy in Ireland. In this regard, they claim the system to have fast reaction times and could reduce largely the need to hold hydrocarbon-powered plants on
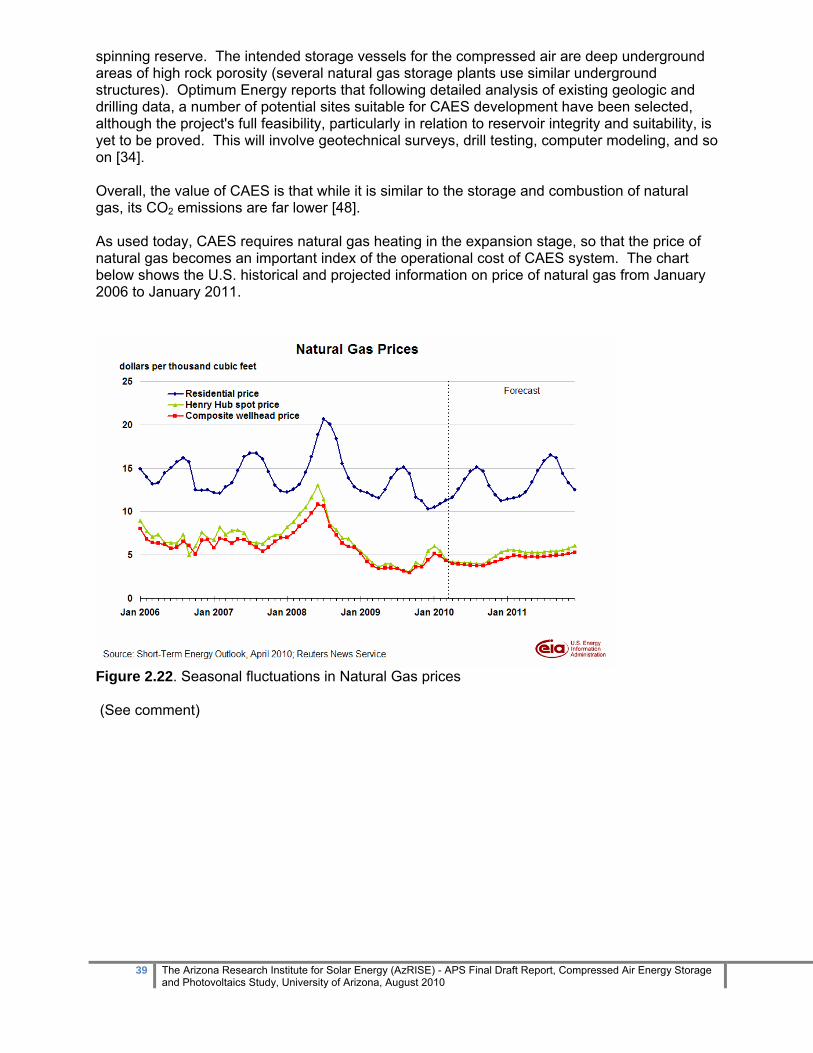
39 The Arizona Research Institute for Solar Energy (AzRISE) - APS Final Draft Report, Compressed Air Energy Storage and Photovoltaics Study, University of Arizona, August 2010
spinning reserve. The intended storage vessels for the compressed air are deep underground areas of high rock porosity (several natural gas storage plants use similar underground structures). Optimum Energy reports that following detailed analysis of existing geologic and drilling data, a number of potential sites suitable for CAES development have been selected, although the project's full feasibility, particularly in relation to reservoir integrity and suitability, is yet to be proved. This will involve geotechnical surveys, drill testing, computer modeling, and so on [34]. Overall, the value of CAES is that while it is similar to the storage and combustion of natural gas, its CO2 emissions are far lower [48]. As used today, CAES requires natural gas heating in the expansion stage, so that the price of natural gas becomes an important index of the operational cost of CAES system. The chart below shows the U.S. historical and projected information on price of natural gas from January 2006 to January 2011.
Figure 2.22. Seasonal fluctuations in Natural Gas prices (See comment)

40 The Arizona Research Institute for Solar Energy (AzRISE) - APS Final Draft Report, Compressed Air Energy Storage and Photovoltaics Study, University of Arizona, August 2010
Bibliography For Section 2 General References: (1) ESA 2010 – Electricity Storage Association, 20th Annual Meeting, Charlotte, NC, May 2010. (3) EESAT 2009 – Electrical Energy Storage Applications and Technologies, Seattle, WA, October 2009. (4) ESA 2009 – Electricity Storage Association, 19th Meeting, Washington, DC, May 2009.
1. “High Energy Zinc-Air Technology,” Trygve Burchardt, ESA 2010, paper #37 (2010). 2. “Achievements of an ABSOLYTE Valve Regulated Lead-Acid Battery Operating in a
Utility Battery Energy Storage System (BEES) for 12 Years,” George Hunt, EESAT 2009.
3. “What Storage Challenges Face the Renewable Energy Industry for Photovoltaic and Wind Power,” Masaaki Shiomi, EESAT 2009.
4. “Ancillary Services with Lead-Carbon Batteries,” Sally Miksiewicz, ESA 2010, paper 27 (2010).
5. “Ultrabattery for Utility-Scale Storage Applications,” Peter Coppin, EESAT 2009. 6. “Bipolar Lead Acid Batteries for EV’s and Grid Storage,” Steve Clark, ESA 2010, paper
19 (2010). 7. “A Combustion Chemistry Analysis of Carbonate Solvents used in Li-ion Batteries,” S, J.
Harris, A. Timmons and W. J. Pits, J. Power Sources, 193, 855-858 (2009). 8. “Advanced Technologies for Utility-Scale Storage,” Robert Misback, ESA 2010 paper 21
(2010). 9. “Lithium Iron Phosphate Batteries,” Jim Hodge, ESA 2010 paper 41 (2010). 10. “Advanced Laser Processing of Hydrous Ruthenium Oxide Supercapacitor Electrodes
for Improved performance,” J. Scholl, C. Peabody, C. B. Arnold, ECS 2010 paper 317 11. “Solid State Lithium Ion Batteries,” Ilan Gur, ESA 2010, paper 39 (2010). 12. “Grid-scale Applications of NAS Batteries Around the World,” Akimichi Okimoto, ESA
2010 paper 16 (2010). 13. “Advanced Electrochemical Storage R&D for Renewable and Utility Applications at
PNNL, Z. Gary Yang, EESAT 2009. 14. “All-Liquid-Metal Batteries,” Luis Ortiz, ESA 2010, paper 40 (2010). 15. “Reducing the Cost of Electricity Infrastructure,” Chris Winter, ESA 2010, paper 18
(2010). 16. “Zinc Air Batteries for Bulk Storage,” Ben Rogers, ESA 2010, paper 34 (2010). 17. “High-Energy Zinc-Air Technology,” Trygve Burchardt, ESA 2010, paper 37 (2010). 18. “Empirical Field Data from VRB Flow Batteries Installed in Remote Telecom
Applications, Matthew Harper, EESAT 2009. 19. “Third Generation Redox Flow Battery; a Development Update,” Mereille Schreurs,
EESAT 2009. 20. http://www.cellstrom.com/Technology.7.0.html?&L=1 21. Compressed Air Energy Storage State-of-Science,” EPRI pub # 1020444 (10/27/2009). 22. http://www.energystorageandpower.com/pdf/epri_paper.pdf 23. http://www.sei.ie/uploadedfiles/FundedProgrammes/REHC03001FinalReport.pdf 24. http://www.princeton.edu/~ssuccar/caesReport.html 25. “Investigation and optimisation of hybrid electricity storage systems based on
compressed air and supercapacitors,” Sylvain Lemoufet-Gatsi, Thesis 3628, Ecole Polytechnique Federal de Lausanne, 2006)
26. “Available CAES Plant concepts”, Nakhamkin and Chiruvolu, published at Power Gen 2007. (The paper is available at http://www.energystorageandpower.com); also “Compressed Air Inflates, Gas Turbine Outputs.” Nakhamkin, M. and Wolk, R., Power Engineering, pp. 38-40, March 1999.
27. http://www.energystorageandpower.com/pdf/epri_paper.pdf 28. “Arizona has Salt,” Steven L. Rauzi, Arizona Geological Survey Circular 30, Jan 2002.
41 The Arizona Research Institute for Solar Energy (AzRISE) - APS Final Draft Report, Compressed Air Energy Storage and Photovoltaics Study, University of Arizona, August 2010
29. “A Summary of the State of the Art in SMES, FES and CAES Systems.” Taylor, P., Johnson, L., Reichart, K., DiPietro, P., Philip, P., Butler, J. Sandia National Laboratories Report SAND99-1854 July 1999.
30. “Economics of Integrated Renewables and Hydrogen Storage Systems in Distributed Generation.” Herr, M., Imperial College of Science, Technology and Medicine, University of London, June 2002 (2002).
31. “Who Says You Can't Store Electricity?” Zink, J., Power Engineering, March 1997, pp. 21-25 (1997).
32. “Characteristics and Technologies for Long vs. Short-Term Energy Storage.” Schoenung, S., Sandia National Laboratories. Report SAND2001-0765, March 2001; “Characteristics of Energy Storage Technologies for Short- and Long-Duration Applications.” Schoenung, S., Electrical Energy Storage Systems Applications and Technologies International Conference 2002 (EESAT2002), San Francisco, April 15-17 2002 (2002).
33. “The Emerging Roles of Energy Storage in a Competitive Power Market: Summary of a DOE Workshop.” Gordon, S. and Falcone, P., Sandia Report. SAND95-8247 (1995).
34. http://www.sei.ie/uploadedfiles/FundedProgrammes/REHC03001FinalReport.pdf 35. “Turbomachinery solutions for AACAES”, Del Turco, EESAT 2009 (2009). 36. “Adsorption-Enhanced CAES” EESAT 2009 37. “No Fuel Adiabatic CAES”, R. Schainker, ESA 2010, paper 23 (2010). 38. “Above Ground Isothermal CAES,” D. Kepshire, ESA 2010, paper 32 (2010). 39. http://www.princeton.edu/~cmi/research/Capture/Papers/SuccarWilliams_PEI_CAES_20
08April8.pdf 40. “Electricity Storage, a Solution in Network Operation?” Price, A., Thijassen, G. and
Sysmons, P. Distributech Europe, October 2000; “Recent Developments in the Design and Applications of a Utility-Scale Energy Storage Plant.” Price, A., Proceedings of Proceedings of the Electrical Energy Storage Systems Applications and Technologies International Conference 2000 (EESAT2000), Orlando, September 18-20 (2000).
41. “Power Generating Technologies – Evaluating the Cost of Electricity.” Breeze. P., FT Energy Report. ISBN 1 84083 038 7, 1998.
42. P. Radgen and F. Henken-Mellies, “Large scale energy storage of fluctuating renewable energy with compressed air storage power plants using the one at Huntorf as example - Großtechnische Energiespeicherung Fluktuierender Erneuerbarer Energie mit Druckluftspeicherkraftwerken am Beispiel Huntorf,” VDI Berichte, issue 2051, pp 197-206 (2008)
43. “Energy Storage as an Essential Part of Sustainable Energy System. A Review on Applied Energy Storage Technologies.” Semadeni, M., CEPE Working Paper No. 24, Zurich, May 2003.
44. “CAES for Today's Market.” Van der Linden, S., Proceedings of the Electrical Energy Storage Systems Applications and Technologies International Conference 2002 (EESAT2002), San Francisco, April 15-17, 2002.
45. Power 152, (10) p3, Oct. 15, 2008. 46. “Utility-Scale Load Shifting with Compressed Air,” Hal La Flash, ESA 2010, paper 28
(2010). 47. “Above Ground Isothermal CAES,” Dax Kepshire, ESA 2010, paper 32 (2010). 48. “Compressed Gas Energy Storage,” Rob Webster, ESA 2010, paper 38 (2010).

42 The Arizona Research Institute for Solar Energy (AzRISE) - APS Final Draft Report, Compressed Air Energy Storage and Photovoltaics Study, University of Arizona, August 2010
Section 3 - PV and CAES Cost Benefit Analysis
3.1 Introduction The Economic Analysis team for the APS project analyzes the costs and benefits associated with solar PV generation combined with energy storage options. This analysis provides APS with estimates of the incremental value of storage technologies when they are combined with solar PV generation. As we explain below, the possibility of energy storage introduces new dimensions into decision-making. 3.2 Issues associated with Solar PV Generation Solar PV electricity generation has characteristics that present some challenges for an electric utility. The first characteristic is the intermittent nature of solar PV generation. The exact amount of generation varies hour to hour and even minute to minute depending on weather conditions. Electric system operation requires that voltage stays within a narrow range in order to continue operating. Therefore, the utility may need to provide voltage regulation services of some kind when using solar PV generation, in order to smooth out supply and continuously balance electricity supply and load. In addition, a utility may need to have backup power available to meet load for periods when solar radiation (and solar generation) is lower than expected. The second characteristic is the time pattern of solar PV generation. The average daily pattern of solar generation (for example in the summer in Arizona) starts at zero around 7 a.m., gradually rises to a peak between noon and 1 p.m., and declines back to zero around 7 p.m. Solar generation is declining as the typical daily load is rising in the afternoon, with the peak load occurring at 4 – 8 p.m. Therefore, the timing of daily peak solar PV generation does not match the timing of daily peak load. Our analysis uses hourly solar PV generation data from the National Renewable Energy Laboratory’s Solar Advisor Model (SAM) for single axis tracking PV arrays. The data is based on the Tucson airport location for the calendar year 2009.
Figure 3.1 Load Curve vs. Solar PV Generation for a Typical Household
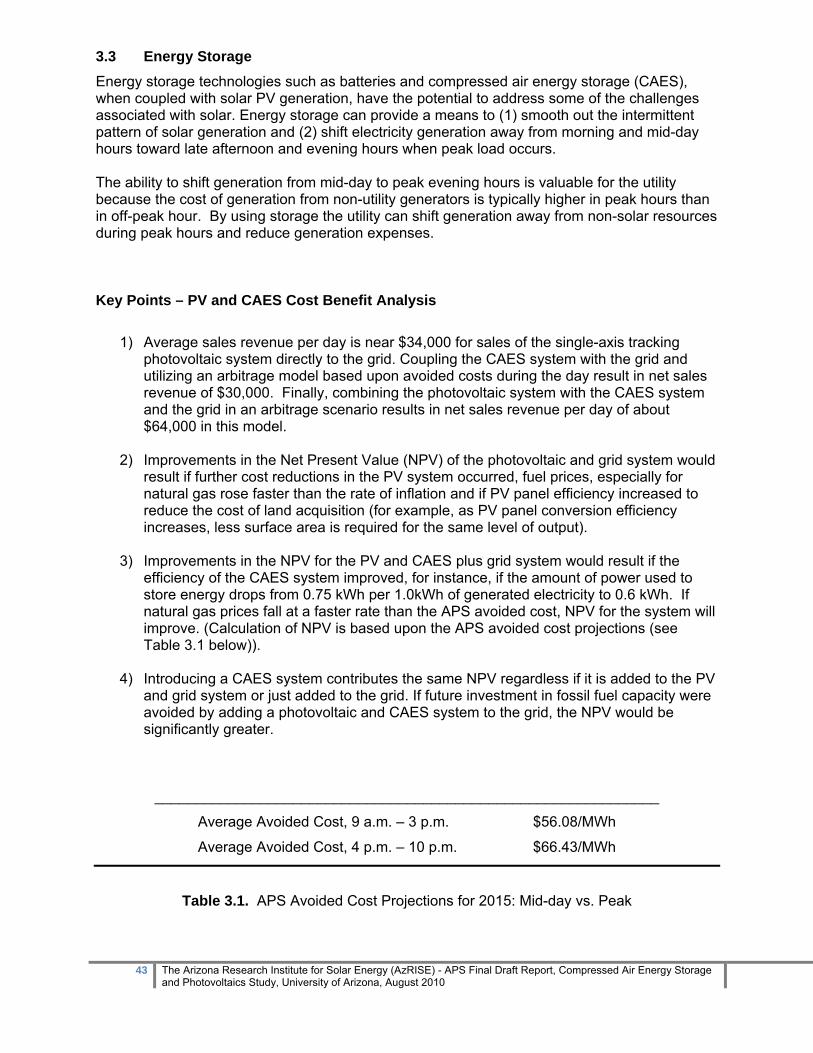
43 The Arizona Research Institute for Solar Energy (AzRISE) - APS Final Draft Report, Compressed Air Energy Storage and Photovoltaics Study, University of Arizona, August 2010
3.3 Energy Storage Energy storage technologies such as batteries and compressed air energy storage (CAES), when coupled with solar PV generation, have the potential to address some of the challenges associated with solar. Energy storage can provide a means to (1) smooth out the intermittent pattern of solar generation and (2) shift electricity generation away from morning and mid-day hours toward late afternoon and evening hours when peak load occurs. The ability to shift generation from mid-day to peak evening hours is valuable for the utility because the cost of generation from non-utility generators is typically higher in peak hours than in off-peak hour. By using storage the utility can shift generation away from non-solar resources during peak hours and reduce generation expenses.
Key Points – PV and CAES Cost Benefit Analysis
1) Average sales revenue per day is near $34,000 for sales of the single-axis tracking photovoltaic system directly to the grid. Coupling the CAES system with the grid and utilizing an arbitrage model based upon avoided costs during the day result in net sales revenue of $30,000. Finally, combining the photovoltaic system with the CAES system and the grid in an arbitrage scenario results in net sales revenue per day of about $64,000 in this model.
2) Improvements in the Net Present Value (NPV) of the photovoltaic and grid system would result if further cost reductions in the PV system occurred, fuel prices, especially for natural gas rose faster than the rate of inflation and if PV panel efficiency increased to reduce the cost of land acquisition (for example, as PV panel conversion efficiency increases, less surface area is required for the same level of output).
3) Improvements in the NPV for the PV and CAES plus grid system would result if the efficiency of the CAES system improved, for instance, if the amount of power used to store energy drops from 0.75 kWh per 1.0kWh of generated electricity to 0.6 kWh. If natural gas prices fall at a faster rate than the APS avoided cost, NPV for the system will improve. (Calculation of NPV is based upon the APS avoided cost projections (see Table 3.1 below)).
4) Introducing a CAES system contributes the same NPV regardless if it is added to the PV and grid system or just added to the grid. If future investment in fossil fuel capacity were avoided by adding a photovoltaic and CAES system to the grid, the NPV would be significantly greater.
______________________________________________________________
Average Avoided Cost, 9 a.m. – 3 p.m. $56.08/MWh
Average Avoided Cost, 4 p.m. – 10 p.m. $66.43/MWh
Table 3.1. APS Avoided Cost Projections for 2015: Mid-day vs. Peak
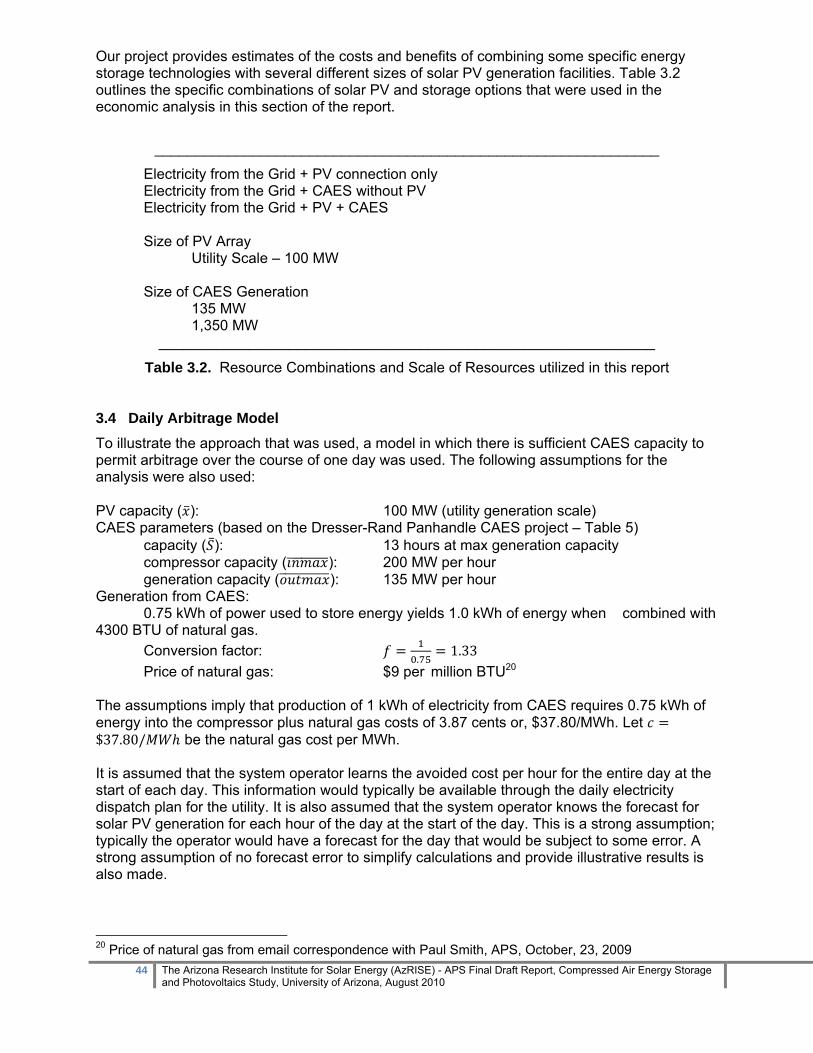
44 The Arizona Research Institute for Solar Energy (AzRISE) - APS Final Draft Report, Compressed Air Energy Storage and Photovoltaics Study, University of Arizona, August 2010
Our project provides estimates of the costs and benefits of combining some specific energy storage technologies with several different sizes of solar PV generation facilities. Table 3.2 outlines the specific combinations of solar PV and storage options that were used in the economic analysis in this section of the report.
______________________________________________________________
Electricity from the Grid + PV connection only Electricity from the Grid + CAES without PV Electricity from the Grid + PV + CAES Size of PV Array Utility Scale – 100 MW Size of CAES Generation 135 MW 1,350 MW
_____________________________________________________________
Table 3.2. Resource Combinations and Scale of Resources utilized in this report
3.4 Daily Arbitrage Model To illustrate the approach that was used, a model in which there is sufficient CAES capacity to permit arbitrage over the course of one day was used. The following assumptions for the analysis were also used: PV capacity ( ): 100 MW (utility generation scale) CAES parameters (based on the Dresser-Rand Panhandle CAES project – Table 5) capacity ( ): 13 hours at max generation capacity compressor capacity ( ): 200 MW per hour generation capacity ( ): 135 MW per hour Generation from CAES: 0.75 kWh of power used to store energy yields 1.0 kWh of energy when combined with 4300 BTU of natural gas.
Conversion factor: .
1.33 Price of natural gas: $9 per million BTU20
The assumptions imply that production of 1 kWh of electricity from CAES requires 0.75 kWh of energy into the compressor plus natural gas costs of 3.87 cents or, $37.80/MWh. Let $37.80/ be the natural gas cost per MWh. It is assumed that the system operator learns the avoided cost per hour for the entire day at the start of each day. This information would typically be available through the daily electricity dispatch plan for the utility. It is also assumed that the system operator knows the forecast for solar PV generation for each hour of the day at the start of the day. This is a strong assumption; typically the operator would have a forecast for the day that would be subject to some error. A strong assumption of no forecast error to simplify calculations and provide illustrative results is also made.
20 Price of natural gas from email correspondence with Paul Smith, APS, October, 23, 2009

45 The Arizona Research Institute for Solar Energy (AzRISE) - APS Final Draft Report, Compressed Air Energy Storage and Photovoltaics Study, University of Arizona, August 2010
The reported results below are based on an optimization model in which the system operator maximizes avoided cost savings less PV/CAES operating costs each day. Appendix A provides details of the daily arbitrage model and how the calculations for the model. Table 3.3 reports information about costs and performance for PV/CAES systems that we use in our analysis.
______________________________________________________________
UNIT Cost per Unit Capital Costs PV Modules, Inverters, Installation21 $/kW $ 5,040.00 PV Inverter Replacements $/kW $ 756.00
CAES Turbo Generator Set22 $/kW $ 190.00 CAES Compressor23 $/kW $ 175.00 CAES Balance of Plant24 $/kW $ 230.00 NG GT Plant25 $/kW $ 485.00 CAES Reservoir26 $/kWh $ 2.00
Performance Assumptions & Operational Costs
PV Fixed O&M42 $/kW $ 20.90 PV degradation rate/year42 1% CAES Plant NG Heat Rate43 btu/kWh 4,300 CAES Plant Fixed O&M43 $/kW $ 3.69 CAES Plant Variable O&M43 $/kWh $ 0.006
Financial Assumptions Real Interest Rate 6%CAES Plant Property Tax and Insurance42 1.5% of initial capital PV Plant Property Tax and Insurance42 1% of initial capital
______________________________________________________________
Table 3.3. PV/CAES Costs and Performance Assumptions
Computations
The NREL SAM solar generation data and the avoided cost (price) data were used to create a year-long data set of hourly observations of solar electric power generation and electricity
21 For single axis tracking PV system. Information from NREL. National Renewable Energy Laboratory. Solar Advisor Model v2009.10.13. Renewable Resource Data Center, NREL. Golden, CO. http://www.nrel.gov/. 22 Davis L., Schainker BR. Compressed Air Energy Storage (CAES): Alabama Electric Cooperative McIntosh Plant Overview and Operational History. Report prepared jointly by the Alabama Electric Cooperative and the Electric Power Research Institute (EPRI) 23 ibid 24 Mason, James. Coupling PV and CAES Power Plants to Transform Intermittent PV Electricity into Dispatchable Electricity Source. Progress in Photovoltaics: Research and Applications. July 2008. 25 ibid 26 ibid

46 The Arizona Research Institute for Solar Energy (AzRISE) - APS Final Draft Report, Compressed Air Energy Storage and Photovoltaics Study, University of Arizona, August 2010
prices. From this data the sales revenue (net avoided cost savings) for three alternative configurations was computed.
3.4.1. Sales of solar power directly to the grid, with no utilization of storage Sales revenue varies from day to day because of day to day and hour to hour variations in both solar irradiance and electricity prices. The average sales revenue per day is $34,031 during the initial year of operation. Solar PV generation and sales revenue per day decrease by one percent per year due to PV panel degradation over the life of the system. The sales revenue number is based on the 100 MW PV System (see Table 3.2).
3.4.2. CAES system plus grid The performance of the CAES system coupled with the grid is examined in the scenario. The idea is to use electric power from the grid to run the compressor during hours with low avoided cost, and using the stored energy to run the CAES generator during hours with high avoided cost.The assumption is made that the operator knows (or can forecast accurately) the avoided cost for the remaining hours of the day. Based on this assumption, the optimal storing/selling strategy for each day of the year for the operator is calculated. The optimal decisions for storing and selling vary from day to day because of day to day differences in hourly avoided costs. The optimal decisions are calculated by using a dynamic programming algorithm, which is programmed in MATLAB. The computational approach is explained in more detail in Appendix A. There are costs associated with storage; net revenue is reported as avoided cost savings minus operating costs for storage. The average net sales revenue per day is $30,040 for 135MW CAES System (see Table 3.2) 3.4.3. Solar power plus CAES plus grid In this scenario Compressed air is produced either by the solar PV system or from the grid. If power from the grid is used to produce compressed air for CAES then the cost is based on the avoided cost for the gird at the time of production. As noted earlier, there are costs associated with storage, net revenue is reported as avoided cost savings minus operating costs for storage. The average net sales revenue per day is $64,071 in the initial year of operation. This is almost twice as high as revenue for the PV plus grid configuration. The optimal decisions are calculated by using a dynamic programming algorithm, which is programmed in MATLAB. The computational approach is explained in more detail in Appendix A. Results are reported for project net present values (NPV) in Table 3.4. NPV’s are separated into net revenues (avoided cost savings), costs, and subsidies. For the APS utility subsidy the maximum of the three possible subsidy types is used: capital subsidy ($2.50/W), 10 year production subsidy ($.025/kWh), and 20 year production subsidy ($0.18/kWh). For this project, the 20 year subsidy yields the highest NPV of subsidy payments. For this large scale PV facility the NPV is $30.5 million. Land expenses in the calculation are not included, so land costs would have to be deducted from the project NPV. The NPV of avoided cost savings are approximately 22 percent of the NPV of costs. Federal and state investment tax credits amount to another 23 percent of the NPV of costs. The APS production subsidy amounts to 83 percent of the NPV of project costs.

47 The Arizona Research Institute for Solar Energy (AzRISE) - APS Final Draft Report, Compressed Air Energy Storage and Photovoltaics Study, University of Arizona, August 2010
There are several developments that could improve the net present value of the PV + electricity-from-the- grid scenario project.
Further reductions in the cost of acquiring and installing PV panels and inverters. Fuel prices rise (e.g., for natural gas) faster than the general rate of inflation. Our
analysis assumes that avoided costs for APS are initially at their 2015 projected level and rise at the general rate of price inflation. A 6 percent real interest is used to discount future revenues and costs.
PV panel efficiency rises prior to project start-up; this would save space and reduce the cost of land acquisition for equivalent output.
_________________________________________________________
PV + grid CAES + grid PV + CAES + grid Net Revenue Avoided cost savings $145.4 $140.3 $285.7 Costs PV capital $576.8 $576.8 PV O&M Tax & Ins $91.1 $91.1 CAES gen $25.7 $25.7 CAES comp $35.0 $35.0 CAES other $111.5 $111.5 CAES O&M Tax & Ins
$37.7 $37.7
Total Cost $667.9 $209.9 $887.8 Subsidies Fed + AZ ITC $151.3 $151.3 APS subsidy $410.7 $410.7 Total subsidies $553.0 $553.0 Total NPV $30.5 ($69.6) ($39.1)
Table 3.4. 100 MW Project NPV Results for Daily Arbitrage Model (millions of $)
The second column of figures in Table 3.4 shows that the CAES + grid project has NPV of avoided cost savings of $140.3 million and NPV of total cost of $209.9 million. There are no renewable energy subsidies to offset the costs of installing and running the CAES facility. A couple of developments could improve the CAES + grid NPV:
Suppose the efficiency of generation for the CAES system improves, via better utilization of the heat energy stored in the system. If the amount of power used to store energy drops from 0.75 kWh per 1.0 kWh of generated electricity to 0.6 kWh, then the project NPV rises to positive $22.3 million.
If natural gas prices are lower than expected, then CAES operating costs might fall by more than APS system avoided costs, improving the project NPV.
The third column of figures in Table 3.4 shows NPV for the PV + CAES + grid project. The NPV is minus $39.1 million.

48 The Arizona Research Institute for Solar Energy (AzRISE) - APS Final Draft Report, Compressed Air Energy Storage and Photovoltaics Study, University of Arizona, August 2010
Two other observations are made: The PV project can be scaled up or down with costs and benefits that are roughly
proportional to those reported in Table 14 for the 100 MW PV facility. The CAES facility may be scaled up by adding additional compressors and generators, with costs and benefits roughly in proportion to those reported in Table 14. Evidence to support the feasibility of scaling down the size of a CAES facility compared to the size used for Table 14 was not available at the time of this report.
Note that financial results for PV + CAES + grid in Table 14 are the sum of results for PV + grid and CAES + grid. In other words, based on the methodology used in Table 14, introducing a CAES system contributes that same net NPV regardless of whether it is added to a PV + grid system or just added to the grid. This would change if adding CAES to a PV system would allow the utility to forego investment in fossil fuel capacity and avoid capital expenditures for firming of the solar energy system. 3.5 Long Term Storage In this section the assumption that CAES is filled and emptied on a daily basis is relaxed. The model is modified to permit energy to be stored in CAES for an indefinite period of time. This allows other cases to be considered in which energy might be stored for several days as well as cases in which energy is stored for months at a time. The economics of a CAES system large enough to facilitate seasonal storage; e.g., energy is stored when it is plentiful relative to load (spring and early summer) and released from CAES when it is scarce relative to load (late summer) is evaluated. The modified model allows energy to be stored for as long as the decision-maker desires, during the life of the facility. The system operator is modeled as choosing how much energy to store and sell for each hour of the day, as in our daily arbitrage model. The operator does this for each hour of the day over the 25 year life of the facility. The strong assumption is made that the operator accurately forecasts the avoided cost as well as solar PV generation for each hour over the life of the plant. This strong assumption should give an estimate of the upper bound of the value of a CAES system, since in practice the operator would not be able to forecast future avoided costs and PV generation perfectly. APS avoided cost projections for the year 2015 is used as the basis for system cost savings associated with solar PV generation and generation from CAES. 2015 is treated as a representative year. The first set of calculations is based on the same size PV and CAES installations as used for Table 4. The extra flexibility of managing storage optimally over time adds $43.4 million of NPV of avoided cost savings for CAES + grid and PV + CAES + grid. The higher avoided cost savings moves PV + CAES + grid to a positive net present value. These results are summarized in Figure 3.1. The net present value for different system configurations for both the daily arbitrage model and for the flexible decision model (long term storage) is illustrated.

49 The Arizona Research Institute for Solar Energy (AzRISE) - APS Final Draft Report, Compressed Air Energy Storage and Photovoltaics Study, University of Arizona, August 2010
Figure 3.2. NPV for project system types in millions of dollars
In the next scenario a substantially larger CAES system is examined (see Table 3.2, CAES is a 1,350 MW system). A CAES system that is 10 times as large as the Dresser-Rand Panhandle CAES project is used in this model. A storage system of this size can store up to 17,550 MWh of electricity. This is approximately 3 weeks worth of solar PV generation from a 100 MW PV system. Results are reported in Table 3.5. The PV + grid column is the same as in Table 4. Capital costs for CAES rise by a factor of 10, to $2.1 billion. This large scale CAES project has a negative NPV whether it is combined with PV or not. This analysis is based only on avoided cost savings that can be achieved with CAES. It may be that the value associated with CAES would be higher if CAES was used for seasonal storage that allowed APS to avoid the capital cost of a peaker plant that would be used only during seasonal peak periods.
_________________________________________________________
PV + grid CAES + grid PV + CAES + grid Net Revenue Avoided cost savings $145.4 $1,750.6 $1,904.6 Costs PV capital $576.8 $576.8 PV O&M Tax & Ins $91.1 $91.1 CAES gen $257.0 $257.0 CAES comp $350.0 $350.0 CAES other $1,115.0 $1,115.0 CAES O&M Tax & Ins
$377.0 $377.0
Total Cost $667.9 $2,099.0 $2,766.9
‐80
‐60
‐40
‐20
0
20
40
PV + Grid CAES + Grid PV + CAES + GridDaily
Flexible
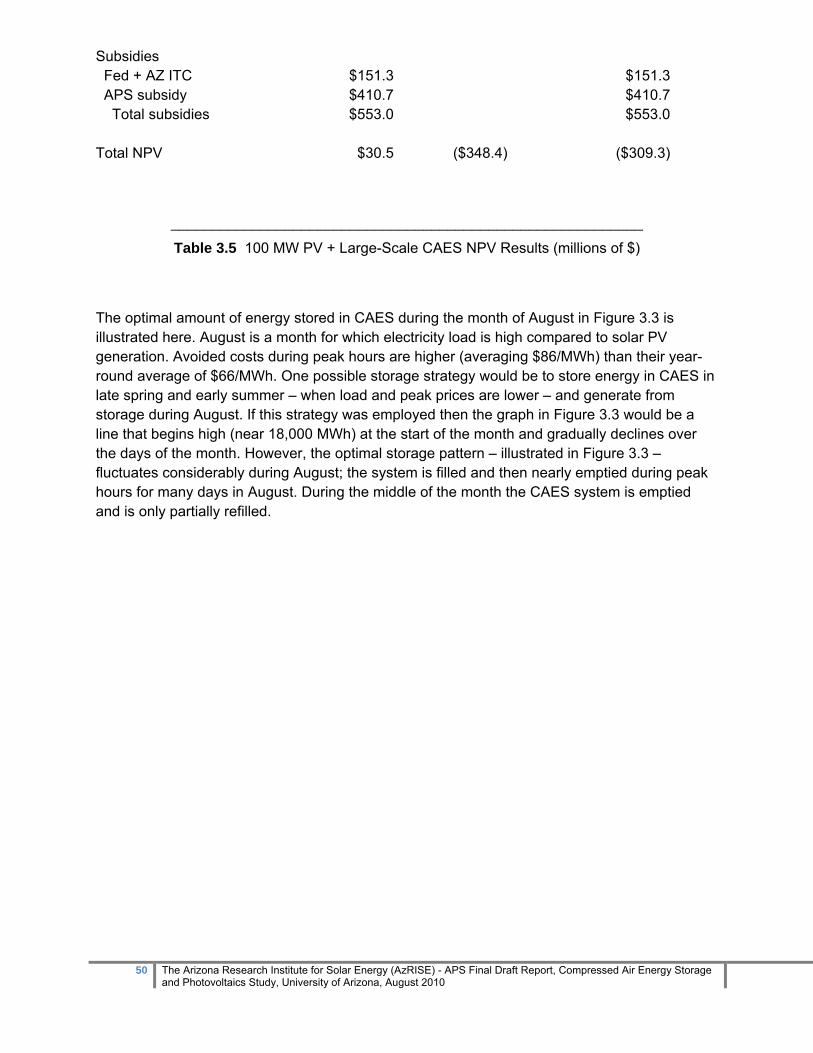
50 The Arizona Research Institute for Solar Energy (AzRISE) - APS Final Draft Report, Compressed Air Energy Storage and Photovoltaics Study, University of Arizona, August 2010
Subsidies Fed + AZ ITC $151.3 $151.3 APS subsidy $410.7 $410.7 Total subsidies $553.0 $553.0 Total NPV $30.5 ($348.4) ($309.3)
__________________________________________________________
Table 3.5 100 MW PV + Large-Scale CAES NPV Results (millions of $)
The optimal amount of energy stored in CAES during the month of August in Figure 3.3 is illustrated here. August is a month for which electricity load is high compared to solar PV generation. Avoided costs during peak hours are higher (averaging $86/MWh) than their year-round average of $66/MWh. One possible storage strategy would be to store energy in CAES in late spring and early summer – when load and peak prices are lower – and generate from storage during August. If this strategy was employed then the graph in Figure 3.3 would be a line that begins high (near 18,000 MWh) at the start of the month and gradually declines over the days of the month. However, the optimal storage pattern – illustrated in Figure 3.3 – fluctuates considerably during August; the system is filled and then nearly emptied during peak hours for many days in August. During the middle of the month the CAES system is emptied and is only partially refilled.
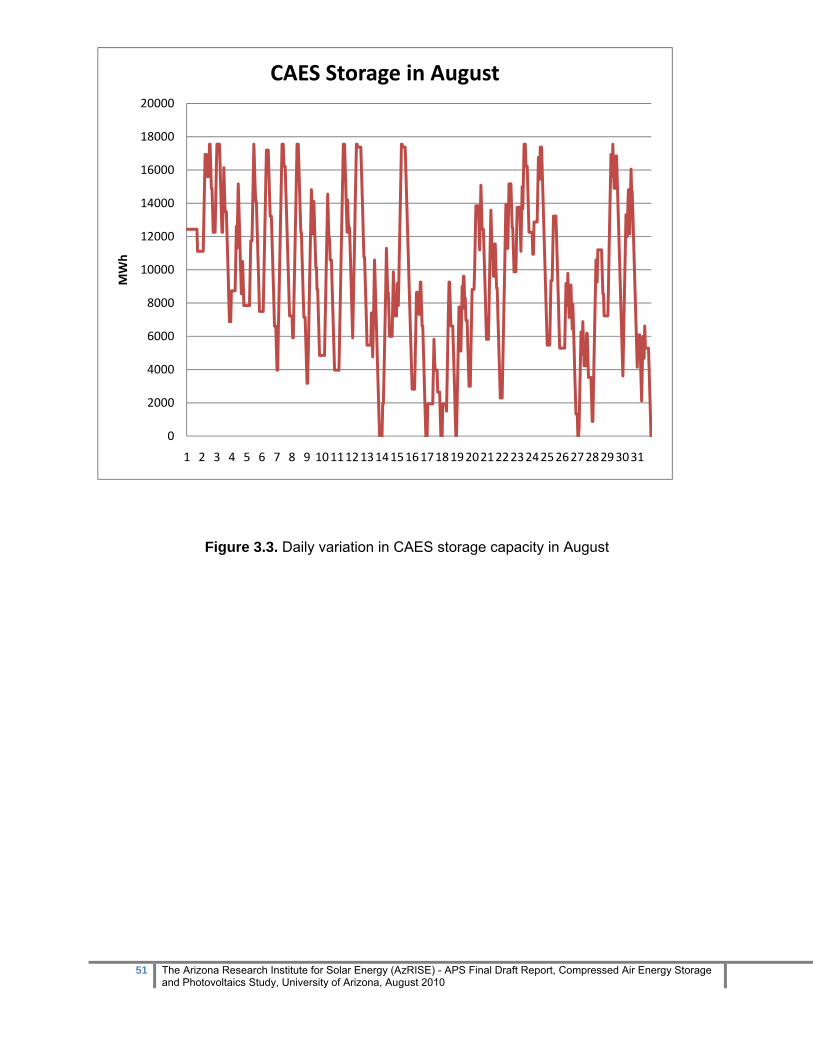
51 The Arizona Research Institute for Solar Energy (AzRISE) - APS Final Draft Report, Compressed Air Energy Storage and Photovoltaics Study, University of Arizona, August 2010
Figure 3.3. Daily variation in CAES storage capacity in August
0
2000
4000
6000
8000
10000
12000
14000
16000
18000
20000
1 2 3 4 5 6 7 8 9 10111213141516171819202122232425262728293031
MWh
CAES Storage in August

52 The Arizona Research Institute for Solar Energy (AzRISE) - APS Final Draft Report, Compressed Air Energy Storage and Photovoltaics Study, University of Arizona, August 2010
Section 4: System Cost and Optimization Analysis In the system cost and benefit analysis the requirements were refined and scenarios for developing a flexible, dynamic simulation modeling framework were developed, which allowed the evaluation of alternative designs for the scenarios listed below (with varying factors) in a data-driven and flexible manner. The studies were selected on the basis of required resource capacity at utility scale for a daily cycle chosen to be represented by August 15, 2008, based on APS system-wide demand for that day. August 15 was selected as a worst case scenario, since the demand load is still high and the PV production is at a minimum for the summer. The program plan called for different size scales (demand) and for simulations that examine durations longer than a day. This was not done because we found no differences in the existing technologies for different lengths of time. Five days were the same as five times one day. So we only include daily analyses in this report. At this time, also, there is no guide for differentiating between a full system load at many gigawatts and distributed storage at a few megawatts. New studies being started at AzRISE with kilowatt-size CAES promise to show differences in performance and efficiency at smaller scales. When these are fully worked out, cost differences may be clearly identified. However, for now, in the studies to follow, the entire APS daily load is used, with the caveat that capacity numbers and resource costs for lower load levels can be scaled linearly from the obtained numbers (ie megawatt systems will cost 1,000 times less that the modeled gigawatt system). The analysis was conducted in three areas: (1) calculation of resource capacity required for peak shaving, (2) calculation of minimum cost achievable with the selected resources for peak shaving and (3) estimation of projected cost changes in the next decade. The resource combinations that were studied included: 1) Grid and CAES storage 2) Grid and PV generation and 3) Grid, PV and CAES storage. In the following capacity and cost optimization studies, the following data was used: 1) 2008 load data from APS and 2) avoided cost information (including Natural Gas prices for 2015 estimated for APS Generators; see Table 5.1 projected for APS system in 2015). Jan. Feb. Mar. April May June July Aug. Sep. Oct. Nov. Dec. 9.48 9.35 9.10 8.03 8.28 8.48 8.77 8.67 8.52 8.25 8.55 9.27 Table 4.1: Natural Gas prices for 2015 delivered to APS Generators ($/MBtu)
53 The Arizona Research Institute for Solar Energy (AzRISE) - APS Final Draft Report, Compressed Air Energy Storage and Photovoltaics Study, University of Arizona, August 2010
4.1 Key Points • A computer program was developed for estimating required capacity and associated cost or
minimum cost for the following resources: ο Grid power ο Photovoltaic solar energy conversion ο Compressed Air Energy Storage ο Battery storage (not included in this study, but can be added in the future). A battery
storage study could simply replace CAES for peak shaving or could cover the short time intermittency of PV produced electricity. For a study of the latter, we would need to have to simulate PV production at the minute-to-minute scale, instead of the hourly scale used here.
ο Number of households or demand load size (not included but can be easily added)
• The program has an adjustable load input and length of time covered, so it can be used for daily demand cycles, or weekly or monthly demand cycles.
• User-defined parameters can be loaded in this program to evaluate changes in performance of the various resources such as PV panel efficiency or cost per kilowatt.
• The program calculates optimized numbers in any category, including optimized capacity based on demand, or optimized capacity based on reducing cost, or equivalent cost for variations in natural-gas requirements or natural-gas costs. ο This allows the program to determine what-if scenarios such as:
− What if the price of natural gas doubles, or halves? This was studied. − What if the cost of PV continues to decrease as predicted? This was studied. − What if new technology is developed that requires less natural gas for CAES than is
currently used due to better thermal management? This was studied. − Other potential scenarios like the effect of a carbon tax were not studied but can be
added easily later.
• Grid with CAES energy storage scenario for full peak-shaving on August 15, 2008: ο This is a simple required-capacity calculation. ο APS system-wide demand peaks at 6,000 MWh at 5:30pm. ο Grid power generation is kept fixed at 4,481MWh per hour. ο The daily CAES system is charged up from the excess energy drawn from the grid in the
morning. ο The CAES system provides for the entire peak load demand above the constant grid
power (4,481 MWh) to fully cover the peak demand with the following CAES system requirements: − CAES energy storage capacity: 8,000 MWh per day − Compressed air volume required: 240 million gallons at 1,150 psi − Natural gas consumed: 44.5 billion BTU per day − Required CAES power: 1,500 MW
• Grid with photovoltaic solar energy conversion, and CAES energy storage for full peak-
shaving on August 15, 2008: ο This is a simple required-capacity calculation. ο APS system-wide demand peaks at 6,000 MWh at 5:30 pm. ο Grid power is fixed at the lowest demand level in the day: 3,300 MWh/hour. This
supplies the least amount of grid power to cover the night-time demand
54 The Arizona Research Institute for Solar Energy (AzRISE) - APS Final Draft Report, Compressed Air Energy Storage and Photovoltaics Study, University of Arizona, August 2010
ο Photovoltaic solar conversion is accomplished with flat-plate PV modules mounted on a single-axis tracking system.
ο The daily CAES system is charged up from the excess PV generation during the morning hours.
ο The CAES system provides for extending the peak load past the time when the PV power is no longer available so that the peak load is now covered by PV and CAES.
ο Note that the grid power demand is now reduced from 4,481 MW to 3,300 MW. ο The following capacity characteristics are required of the PV and CAES combination:
− CAES energy storage capacity: 9,200 MWh per day − Compressed air volume required: 280 million gallons at 1,150 psi − Natural gas consumed: 51 billion BTU per day − Required CAES power: 2,300 MW − Photovoltaic array size: 4 GW power
• What-if scenario of grid and CAES energy storage for full peak-shaving on August 15,
2008 with the optimization of reduced cost through the addition of thermal management which reduces natural-gas consumption: ο The computer program allows variations in capacity to minimize cost. If the use of a
resource only adds cost, then its optimized capacity will be zero. ο Grid electricity prices follow avoided cost figures provided by APS. ο Simulations are conducted with improved CAES thermal management scenarios:
− No thermal management – natural gas consumption of 4,300 BTU/kWh − Moderate thermal management – 2,150 BTU/kWh − Optimized thermal management – 1,075 BTU/kWh
ο Variations in compression and expansion rate capacities in CAES are also examined to prevent the system from filling the CAES capacity at the lowest point cost and discharging it at the highest point cost. This forces a more realistic evaluation of the time spend charging and discharging.
ο The results show that the consumption of natural gas has a significant effect on the value of adding CAES to the resource mix and that any improvement in thermal management will give CAES cost reduction benefit for peak-shaving. − At current avoided cost prices for grid electricity, CAES without thermal management
cannot reduce cost and adds 2.7% to the price of electricity. − If the avoided cost of electricity increases by 2.7%, then CAES peak shaving without
thermal management will not increase electricity price. − At current avoided cost prices, a moderate thermal management strategy will lead to
an electricity price reduction of 1.3% for the use of CAES for peak-shaving. − At current avoided cost prices, an optimized thermal management strategy will lead
to an electricity price reduction of 3.3% for the use of CAES for peak-shaving. − A calculation with reduced compression and expansion rates shows no real effect for
halving the rates due to slow fluctuations with time in the avoided cost figures used. − The avoided cost figures used in these calculations were supplied to us by APS and
show only small changes in electricity price with demand. More realistic figures used by other utilities (TEP) show a greater benefit from CAES. The more the difference between low-demand costs and high demand-demand costs, the greater will be the financial benefit of CAES. We recommend that the avoided cost figures used in these calculations be carefully examined for accuracy. This has a great effect on financial benefit.
• What-if scenario of grid with PV and CAES energy storage for full peak-shaving on August 15, 2008 with the optimization of reduced cost through the addition of thermal management which reduces natural-gas consumption and with reduction in PV cost:
55 The Arizona Research Institute for Solar Energy (AzRISE) - APS Final Draft Report, Compressed Air Energy Storage and Photovoltaics Study, University of Arizona, August 2010
ο The results show that PV prices of 0.23$/kWh ($9,200/kW) add significantly to the price of electricity regardless of CAES thermal management
ο PV prices of 0.075$/kWh ($3,000/kW) and moderate thermal management show a combined decrease in cost of electricity of 1%.
ο Realistically, the cost of PV will decrease to this level in the next 3 years, and the development of CAES with moderate thermal management is currently in process at AzRISE and will be commercial in the same time frame.
ο It should be remembered, that the avoided cost of grid electricity used in this simulation disfavors the use of CAES and PV due to the small variation from low-demand to high-demand times, and the cost of electricity in Arizona is especially low. The PV prices, installed today are well below $9,200/kW, but only slightly above $3,000/kW. Section 6 discusses future trends.
4.2 Model Development In the model development, a series of inputs were developed for each resource to be used. These inputs include type of resource, generation characteristics and charging characteristics, costs and production rates. These numbers can be adjusted at will and can be subjected to applied limitations. For example, in the storage resources, it is necessary that no energy shortage be generated. This forces the optimization program to design a capacity large enough to meet the demand. A list of parameters needed to represent the solar energy section in the simulation model was developed, including 1) daily sunlight hours and average insolation per day in cases where we don’t have access to a historical hourly sunlight intensity database, 2) insolation history database, 3) number of PV panels, 4) capacity of each PV panel, 5) efficiency of the PV panel, 6) PV panels surface area, 7) PV panel unit cost with installation, and 8) effect of temperature on PV panel functionality in terms of efficiency. Figure 4.1 depicts a snapshot of the user interface of our simulation model, which allows the customers to select different choices for each variable (e.g. PV panel; inverter; storage units).

56 The Arizona Research Institute for Solar Energy (AzRISE) - APS Final Draft Report, Compressed Air Energy Storage and Photovoltaics Study, University of Arizona, August 2010
Figure 4.1. User Inteface of Flexible Simulation
As shown in the illustration, this program allows introducing various resources for generation and storage. Each resource has working characteristics that can be changed or adjusted for what-if scenarios or changed as the technology improves. The resources can be added or removed from any optimization simulation. Many of the optimization simulations developed in this report do not use all the parameters available in the database, depending on the function that is optimized. In future studies, this program can be developed with simple user interface operation. This will take additional support for about 6 months, not included in Year 1 funding. The deliverable will be a what-if optimization program that allows an untrained user to add and remove various resources from the generation/storage mix to evaluate capacity and cost for different peak-shaving scenarios. 4.3 Calculation for Grid – CAES peak shaving scenario – CAPACITY OPTIMIZATION As a simple test of the model, a simulation exercise based on a load data from the APS load data for August 15, 2008 to demonstrate the grid and CAES combined system for the daily cycle at a utility scale was developed. The assumptions for the model are that the grid level of electricity is constant, CAES draws its energy from the grid and CAES returns energy to cover the difference between the peak load and the constant grid level. Using the APS system load data for 2008, August 15 was selected to provide an extreme test of CAES value in peak shaving for future simulations that involve PV. Mid August presents a high
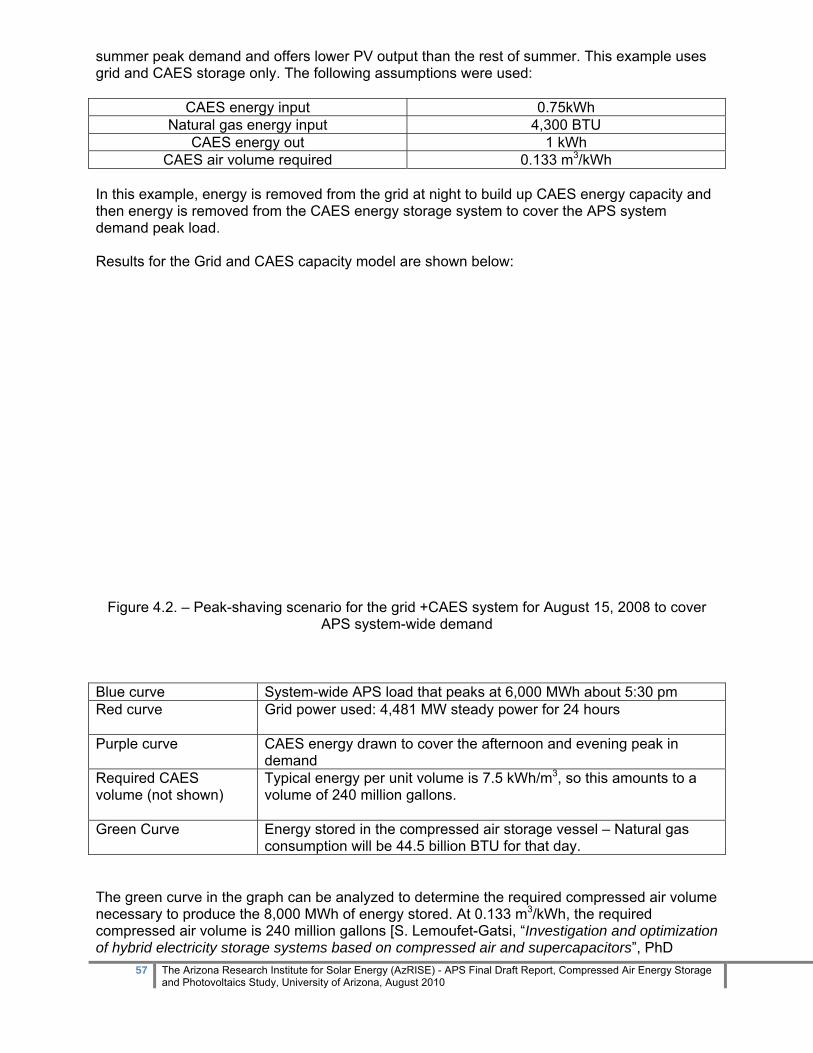
57 The Arizona Research Institute for Solar Energy (AzRISE) - APS Final Draft Report, Compressed Air Energy Storage and Photovoltaics Study, University of Arizona, August 2010
summer peak demand and offers lower PV output than the rest of summer. This example uses grid and CAES storage only. The following assumptions were used:
CAES energy input 0.75kWh Natural gas energy input 4,300 BTU
CAES energy out 1 kWh CAES air volume required 0.133 m3/kWh
In this example, energy is removed from the grid at night to build up CAES energy capacity and then energy is removed from the CAES energy storage system to cover the APS system demand peak load. Results for the Grid and CAES capacity model are shown below:
Figure 4.2. – Peak-shaving scenario for the grid +CAES system for August 15, 2008 to cover APS system-wide demand
Blue curve System-wide APS load that peaks at 6,000 MWh about 5:30 pm Red curve Grid power used: 4,481 MW steady power for 24 hours
Purple curve CAES energy drawn to cover the afternoon and evening peak in
demand Required CAES volume (not shown)
Typical energy per unit volume is 7.5 kWh/m3, so this amounts to a volume of 240 million gallons.
Green Curve Energy stored in the compressed air storage vessel – Natural gas consumption will be 44.5 billion BTU for that day.
The green curve in the graph can be analyzed to determine the required compressed air volume necessary to produce the 8,000 MWh of energy stored. At 0.133 m3/kWh, the required compressed air volume is 240 million gallons [S. Lemoufet-Gatsi, “Investigation and optimization of hybrid electricity storage systems based on compressed air and supercapacitors”, PhD

58 The Arizona Research Institute for Solar Energy (AzRISE) - APS Final Draft Report, Compressed Air Energy Storage and Photovoltaics Study, University of Arizona, August 2010
Thesis, EPFL (2006)]. The purple curve peaks at the maximum required CAES power capacity which turns out to be 1,500MW. Please note that these figures are obtained using APS system-wide demand for that day which reaches a peak demand of 6,000 MWh. For lower demand curves, the numbers scale linearly. For example a 100 MW distributed substation will require a CAES system with 25 MW power and 4 million gallons of compressed air storage capacity at 1150 psi. 4.4 Calculation for Grid – PV – CAES peak shaving scenario – CAPACITY OPTIMIZATION This study calculates the effect of adding PV energy generation to the grid + CAES system. For the Grid, PV and CAES system, the grid level was set to the lowest load level of the 24 hour period (3300 MWh per hour). This allows a PV and CAES capacity calculation designed to minimize the grid power to meet the lowest baseline (night-time) demand for the selected day. Again these numbers scale linearly for a proportionally smaller load.
PV energy production was taken from the NREL Solar Advisory Model (SAM), [https://www.nrel.gov/analysis/sam/] for single-axis tracking, flat-plate photovoltaic panels. The efficiency of the panels is not critical in this study as they only affect the area of panels required to produce the required power. Again, our simulation examines the August 15 demand in order to provide a worst-case scenario of high peak power demand and reduced PV generation capacity due to the shortened number of daylight hours and the reduced production from hot PV modules.

59 The Arizona Research Institute for Solar Energy (AzRISE) - APS Final Draft Report, Compressed Air Energy Storage and Photovoltaics Study, University of Arizona, August 2010
Figure 4.3 - Peak-shaving scenario for the grid + CAES + PV system for August 15, 2008 to cover APS system-wide demand
PV Module Capacity (single-axis tracking) 4 GW power CAES energy storage Capacity 9,200 MWh Compressed Air Capacity 280 Million Gallons Natural Gas Consumption 51 Billion BTU per day In this graph, we plot the APS system load as a blue curve, and the fixed grid level at 3,300 MW as the red curve. The energy provided by a single-axis tracking 4 GW PV system is plotted as the orange curve. The CAES storage capacity during the day is plotted as the green curve and the purple curve shows the CAES energy contributed to covering the demand. The PV capacity is 4 GW. The CAES power required is 2.3 GW and the CAES capacity is 280 million gallons of compressed air at 1150 psi of pressure. Natural gas consumed is 51 billion BTU per day. Again, if the calculation were to be held for a 100 MW feeder, then the PV capacity for this load would be 67 MW; the CAES power would be 38 MW and the compressed air volume would be 5 million gallons. 4.5 Calculation for Grid – CAES peak shaving scenario – Effect of Thermal Management in CAES In the following simulation studies, the capacity changes to the level required for minimizing the total cost of the system. This is compared to the estimated cost using grid only to see the value of the added resources. In this study, we reduce the amount of required Natural Gas used in the CAES. This simulates the effect of improved thermal management of the compression heat. Studies at UA today under sponsorship of Science Foundation Arizona are focused on thermal management and show that with reasonable modifications of CAES equipment, thermal management can easily reduce the required Natural Gas input to 50% of its standard amount. This is tested below as Case 2. We also project that an ultimate goal of reducing Natural Gas required can be as low as 25% of the standard amount. This is tested below as Case 3. In the simulations a new approach is used to determine not the required capacity, but the lowest cost possible with the new resource (CAES). For example, in the case of Grid + CAES, we must pick the lowest possible avoided cost for electricity and completely fill the CAES storage vessel then wait for the time of highest electricity avoided cost and output the entire CAES stored energy in order to reach the maximum economic benefit. The value of this energy arbitrage scenario depends on the differences between lowest and highest avoided cost. The largest difference allows the greatest economic benefit of introducing CAES to a grid-only system. The avoided cost figures were supplied by APS. It is clear that costs that show a higher difference between peak demand and night-time demand will favor energy arbitrage and will make the use of CAES more financially beneficial. The continued growth of the wind industry
has already developed negative pricing scenarios (Schainker, ESA 2010 paper 23). Figure 4.4 - Plot of market price in West Texas, March 3, 2010, showing two periods of negative pricing when wind
60 The Arizona Research Institute for Solar Energy (AzRISE) - APS Final Draft Report, Compressed Air Energy Storage and Photovoltaics Study, University of Arizona, August 2010
generation peaked in the ERCOT market. This scenario is occurring in other parts of the US [2-37]. This type of scenario if continued will make energy arbitrage using CAES very profitable. However, in order to use electricity at the lowest possible avoided cost or market price to fill the CAES reservoir, we need to use a sufficiently large compression pump or many parallel compression pumps to allow filling the entire reservoir in the period of the minimum avoided cost. Since our avoided cost figures are taken hourly, this means filling and emptying the CAES reservoir in an hour. This requires increasing CAES equipment costs to provide very fast compression pumps. Instead, we have limited the pumping and expansion rates to those specified in the technology evaluation table. Consequently, the calculated costs are closer to those that can be expected today. In this scenario, grid electricity price is assumed to follow the Avoided Cost (AC) table supplied by APS. When the AC is low, electricity is drawn from the grid to fill the CAES. When the electricity price AC is high, CAES is used to provide electricity to the grid. Constraints are added to prevent the CAES system from filling up instantaneously and we cap the maximum fill rate at 2,300 MW. This assumption influences the capital cost estimate for CAES since it determines the size of the pumping and expansion systems. The program allows the CAES system to fill to the highest capacity needed to minimize the total system cost and maximize the return from arbitrage. Maximum fill capacity in CAES also affects the price of electricity from the CAES system. Natural gas is supplied to the expansion stage as required by the currently operational CAES systems (4,300 BTU/kWh). The simulation presented here calculates the total electrical cost to match system-wide demand using only grid at the AC and grid + CAES at the price of each resource. The same simulation is conducted under 3 different conditions of varying natural gas consumption required per delivered CAES energy. This allows an estimate of the economic value of developing the thermal management technology and the results below show that thermal management can increase the economic benefit of adding CAES as a resource option. Four cases are calculated. The first corresponds to no thermal management. The second corresponds to moderate thermal management as will be available from AzRISE research in the next year. The third shows high thermal management potentially obtainable in the near future. The 4th case shows the effect of limited pumping and expansion power: Case 1: 4,300 BTU/kWh with compression and expansion rates of 2,300 MW Case 2: 2,150 BTU/kWh with compression and expansion rates of 2,300 MW Case 3: 1,075 BTU/kWh with compression and expansion rates of 2,300 MW Case 4: 4,300 BTU/kWh but compression and expansion rates decreased to 1875MW. These cases assess the value of ongoing research to manage thermal energy by transferring heat generated during air compression in CAES to heat required in the expansion stage. Case 1 assumes no thermal management. Case 2 assumes sufficient thermal management (heat transferred) to reduce natural gas demand to only 50% of the original demand. Case 3 assumes sufficient thermal management to reduce natural gas demand to 25% of the original demand. At this stage, there is no cost associated with the thermal management process.
61 The Arizona Research Institute for Solar Energy (AzRISE) - APS Final Draft Report, Compressed Air Energy Storage and Photovoltaics Study, University of Arizona, August 2010
The simulation models below have the corresponding characteristics: Graph 1 Assumed AC for the day of August 15, 2008 Graph 2 APS system demand for August 15, 2008 in blue color and the calculated optimized
draw (kWh/h) from the grid in red to incur minimum total cost for grid + CAES. The curve shows that grid draw is maximum in the early morning when AC is low.
Graph 3 Displays the cost of the grid draw shown in Graph 2 Graph 4 CAES capacity built up by drawing from the grid. When the curve increases in value,
energy is transferred to the CAES system. When the curve decreases in value, energy is drawn from the CAES system. At all times the sum of the energy drawn from or added to the CAES system and the grid add up to the blue demand curve of Graph 2. An additional constraint is added to CAES system – the capacity at the end of the day must be at least as high as at the start of the day. The graphs are in kWh.
Graph 5 The first bar corresponds to total grid AC summed over the day. The second shows the total consumed natural gas in BTU which differs between Cases 1-3.
Graph 6 Cost of natural gas associated with CAES energy production. The cost is assumed to be $5.51 per million BTU
Graph 7 Hourly comparison of total system cost (grid + CAES) with grid only cost. Graph 8 Repeats Graph 4 Graph 9 Pie chart giving the percentage of total cost in the grid + CAES system that goes to
grid, to CAES and to natural gas. Graph 10 Capital CAES cost amortized over 20 years Gray bar Total cost of delivered electricity to meet the demand curve of Graph 2 if only the grid
is used to provide the electricity Blue bar Total cost of delivered electricity to meet demand if grid + CAES is used Pink bar The difference in costs: grid only minus grid + CAES. A positive number indicates that
the CAEs system adds to the cost of electricity. A negative number indicates that the addition of CAES can reduce cost, simply through arbitrage of the electricity energy produced over the 24 hour time frame.
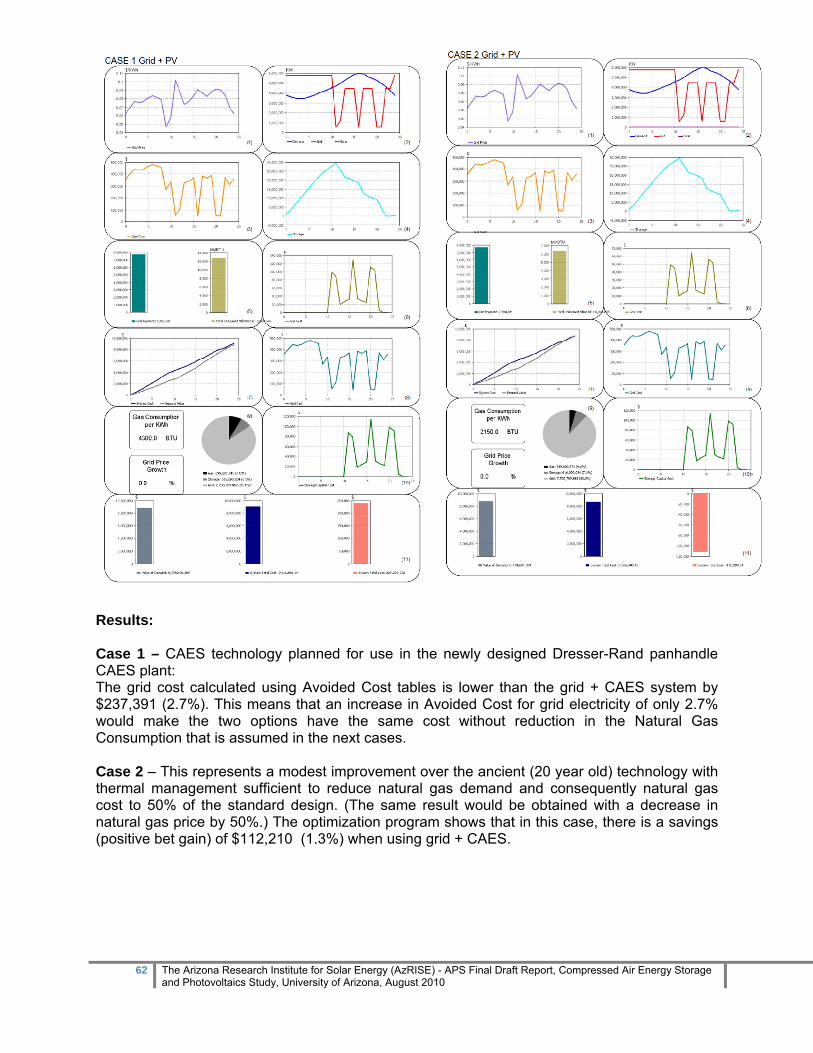
62 The Arizona Research Institute for Solar Energy (AzRISE) - APS Final Draft Report, Compressed Air Energy Storage and Photovoltaics Study, University of Arizona, August 2010
Results: Case 1 – CAES technology planned for use in the newly designed Dresser-Rand panhandle CAES plant: The grid cost calculated using Avoided Cost tables is lower than the grid + CAES system by $237,391 (2.7%). This means that an increase in Avoided Cost for grid electricity of only 2.7% would make the two options have the same cost without reduction in the Natural Gas Consumption that is assumed in the next cases. Case 2 – This represents a modest improvement over the ancient (20 year old) technology with thermal management sufficient to reduce natural gas demand and consequently natural gas cost to 50% of the standard design. (The same result would be obtained with a decrease in natural gas price by 50%.) The optimization program shows that in this case, there is a savings (positive bet gain) of $112,210 (1.3%) when using grid + CAES.
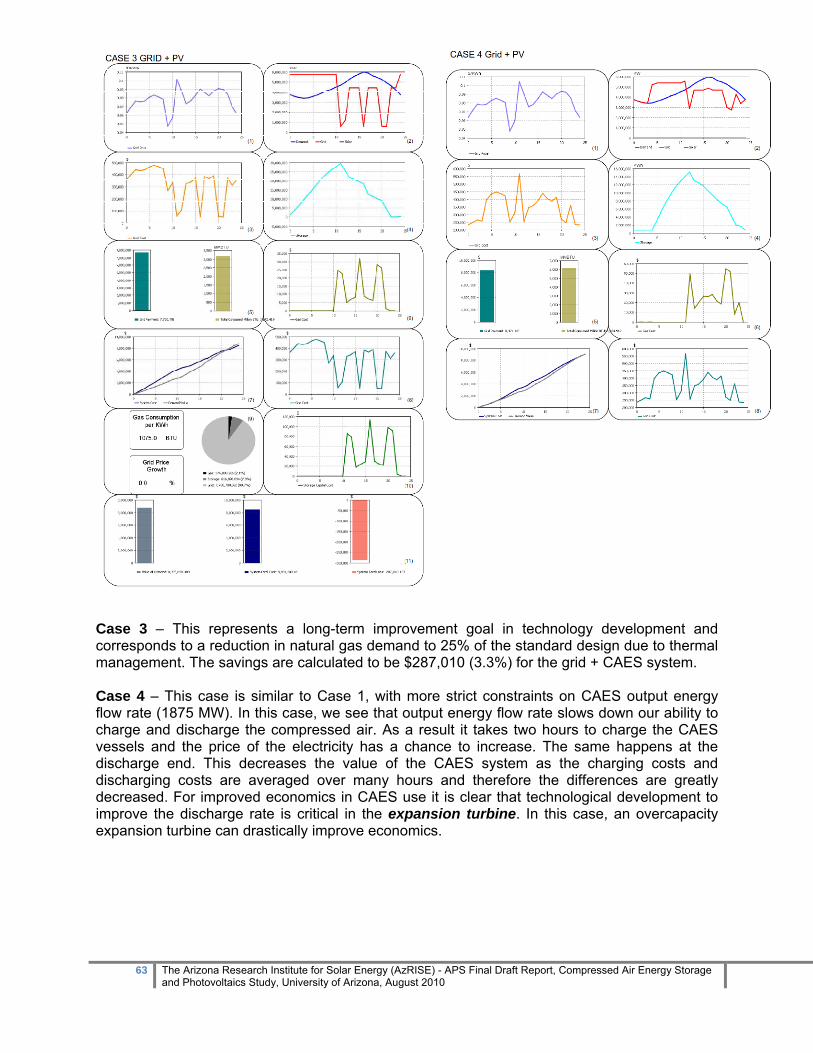
63 The Arizona Research Institute for Solar Energy (AzRISE) - APS Final Draft Report, Compressed Air Energy Storage and Photovoltaics Study, University of Arizona, August 2010
Case 3 – This represents a long-term improvement goal in technology development and corresponds to a reduction in natural gas demand to 25% of the standard design due to thermal management. The savings are calculated to be $287,010 (3.3%) for the grid + CAES system. Case 4 – This case is similar to Case 1, with more strict constraints on CAES output energy flow rate (1875 MW). In this case, we see that output energy flow rate slows down our ability to charge and discharge the compressed air. As a result it takes two hours to charge the CAES vessels and the price of the electricity has a chance to increase. The same happens at the discharge end. This decreases the value of the CAES system as the charging costs and discharging costs are averaged over many hours and therefore the differences are greatly decreased. For improved economics in CAES use it is clear that technological development to improve the discharge rate is critical in the expansion turbine. In this case, an overcapacity expansion turbine can drastically improve economics.

64 The Arizona Research Institute for Solar Energy (AzRISE) - APS Final Draft Report, Compressed Air Energy Storage and Photovoltaics Study, University of Arizona, August 2010
Summary of Results – Grid + CAES peak shaving: In all cases, the what-if scenario can demonstrated using the simulation program developed. Different costs and cost projections can be entered in the model and the results show optimization under specified constraints (compression pump power, expansion turbine power, storage volume, amount of natural gas required, etc.) with estimated cost analyses. The results show that indeed, the costs of natural gas consumption make the difference between grid parity and non-grid parity. The operation of the simple CAES system shows that at 4,300 BTU of natural gas consumption per kWh of produced energy from CAES, the CAES cost for peak shaving exceeds the grid alone cost by 2.7% when using the Avoided Cost to estimate the price of electricity sales and production. If thermal management is added to the CAES system and the natural gas consumption is reduced by 50%, then there is an economic benefit of 1.3%. This technology is being currently developed by AzRISE. The simulation program also shows that for August 15, 2008, the avoided costs did not vary much between low and high (a sharp minimum at 5 cents and a sharp maximum at 10 cents). If greater daily variations are observed, then the economic benefit of CAES can be greatly magnified. If moderate thermal management can reduce the Natural Gas cost to 50% of its standard value, then CAES always provides economic benefit. (see comment)
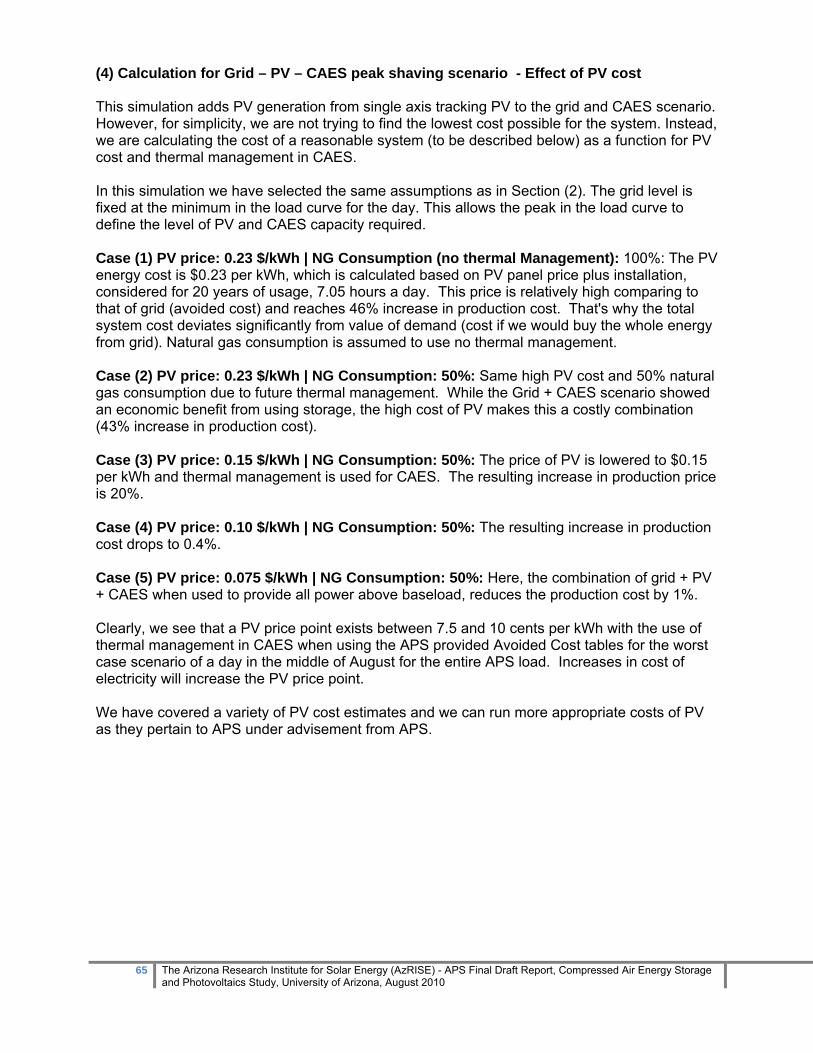
65 The Arizona Research Institute for Solar Energy (AzRISE) - APS Final Draft Report, Compressed Air Energy Storage and Photovoltaics Study, University of Arizona, August 2010
(4) Calculation for Grid – PV – CAES peak shaving scenario - Effect of PV cost This simulation adds PV generation from single axis tracking PV to the grid and CAES scenario. However, for simplicity, we are not trying to find the lowest cost possible for the system. Instead, we are calculating the cost of a reasonable system (to be described below) as a function for PV cost and thermal management in CAES. In this simulation we have selected the same assumptions as in Section (2). The grid level is fixed at the minimum in the load curve for the day. This allows the peak in the load curve to define the level of PV and CAES capacity required. Case (1) PV price: 0.23 $/kWh | NG Consumption (no thermal Management): 100%: The PV energy cost is $0.23 per kWh, which is calculated based on PV panel price plus installation, considered for 20 years of usage, 7.05 hours a day. This price is relatively high comparing to that of grid (avoided cost) and reaches 46% increase in production cost. That's why the total system cost deviates significantly from value of demand (cost if we would buy the whole energy from grid). Natural gas consumption is assumed to use no thermal management. Case (2) PV price: 0.23 $/kWh | NG Consumption: 50%: Same high PV cost and 50% natural gas consumption due to future thermal management. While the Grid + CAES scenario showed an economic benefit from using storage, the high cost of PV makes this a costly combination (43% increase in production cost). Case (3) PV price: 0.15 $/kWh | NG Consumption: 50%: The price of PV is lowered to $0.15 per kWh and thermal management is used for CAES. The resulting increase in production price is 20%. Case (4) PV price: 0.10 $/kWh | NG Consumption: 50%: The resulting increase in production cost drops to 0.4%. Case (5) PV price: 0.075 $/kWh | NG Consumption: 50%: Here, the combination of grid + PV + CAES when used to provide all power above baseload, reduces the production cost by 1%. Clearly, we see that a PV price point exists between 7.5 and 10 cents per kWh with the use of thermal management in CAES when using the APS provided Avoided Cost tables for the worst case scenario of a day in the middle of August for the entire APS load. Increases in cost of electricity will increase the PV price point. We have covered a variety of PV cost estimates and we can run more appropriate costs of PV as they pertain to APS under advisement from APS.

66 The Arizona Research Institute for Solar Energy (AzRISE) - APS Final Draft Report, Compressed Air Energy Storage and Photovoltaics Study, University of Arizona, August 2010
Case (1) PV price: 0.23 $/kWh | NG Consumption: 100%

67 The Arizona Research Institute for Solar Energy (AzRISE) - APS Final Draft Report, Compressed Air Energy Storage and Photovoltaics Study, University of Arizona, August 2010
Case (2) PV price: 0.23 $/kWh | NG Consumption: 50%

68 The Arizona Research Institute for Solar Energy (AzRISE) - APS Final Draft Report, Compressed Air Energy Storage and Photovoltaics Study, University of Arizona, August 2010
Case (3) PV price: 0.15 $/kWh | NG Consumption: 50%

69 The Arizona Research Institute for Solar Energy (AzRISE) - APS Final Draft Report, Compressed Air Energy Storage and Photovoltaics Study, University of Arizona, August 2010
Case (4) PV price: 0.10 $/kWh | NG Consumption: 50%
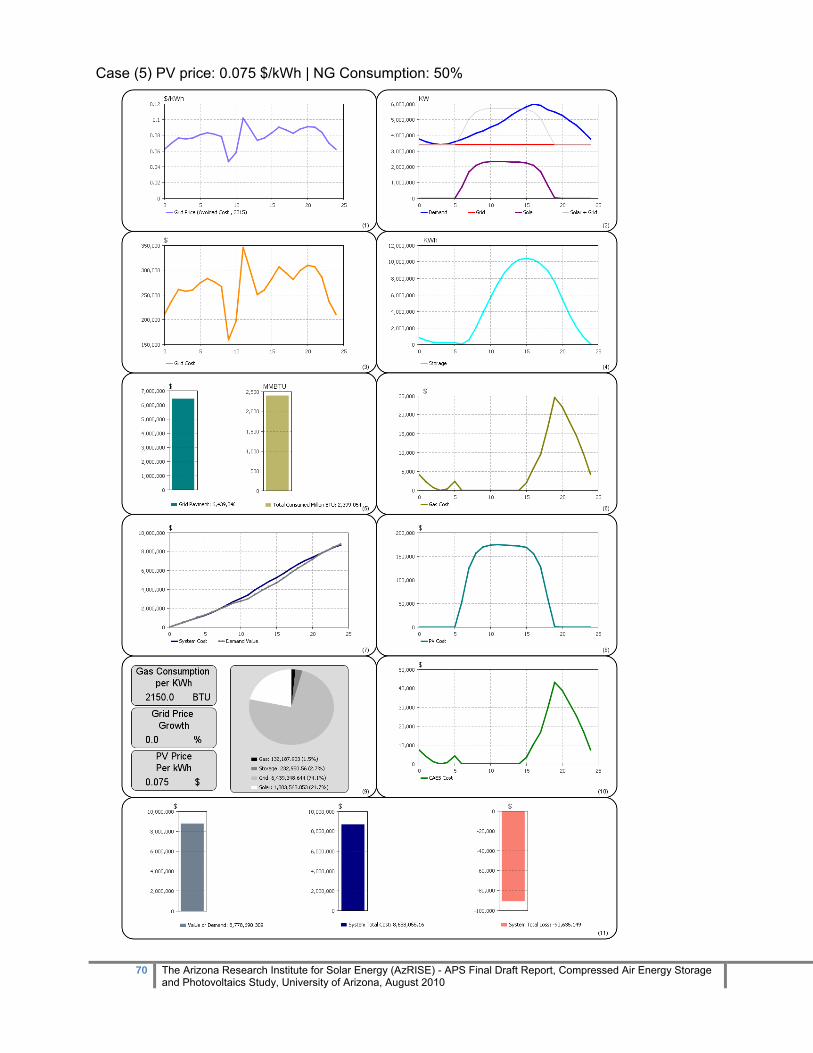
70 The Arizona Research Institute for Solar Energy (AzRISE) - APS Final Draft Report, Compressed Air Energy Storage and Photovoltaics Study, University of Arizona, August 2010
Case (5) PV price: 0.075 $/kWh | NG Consumption: 50%

71 The Arizona Research Institute for Solar Energy (AzRISE) - APS Final Draft Report, Compressed Air Energy Storage and Photovoltaics Study, University of Arizona, August 2010
Section 5 - Critical Developments for System Cost Reductions
Clearly in the PV technologies, critical improvements are expected in module efficiency which helps improve the value of tracking. As the cost of production of silicon drops, reductions in price are expected with grid parity predicted for 2012-2015. Further cost reductions are expected from modular installation systems, since the installation costs can be as high as the module cost. Thin film modules are selling below the price of crystalline silicon, but module lifetime is not well defined and claims of 20-year lifetime have not been proven or demonstrated using reliable ageing tests. In energy storage, high battery costs are expected to decrease as manufacturing capacity increases to supply the electric vehicle industry. Battery costs are higher than CAES costs, but the performances differ greatly. Batteries have the ability to respond quickly to demand and are quoted to reach full wattage in 20 milliseconds. CAES responds similarly to turbine generators and takes about 10 minutes to reach full power. An ideal system might use batteries in tandem with CAES whereby the battery responds on demand and is replaced by the CAES after 10 minutes to minimize cost. However batteries have limited energy storage capacity (15 minutes to a maximum of 1 hour at full rated power) so that a long period of weather intermittency will require either turning on a gas turbine or the more efficient CAES energy storage system. CAES cost studies show that natural gas consumption during the expansion stage of the process produces enough cost to make a difference between positive and negative revenue. Research is currently on-going at AzRISE to develop thermal management systems for CAES to reduce natural gas consumption. These technology improvements promise to make CAES storage economically beneficial as seen in the cost analysis. The question of scale is critical and variations in cost are expected between the different scales of energy delivery. However, at this time, CAES systems greater than 100 MW are the only ones in operation. Vendors tell us that a minimum in cost per watt occurs near 280 MW, but this is a result of existing hardware (pumping and expansion systems). CAES is estimated at lowest cost when compressed air storage is in underground salt caves. At this time, the compression stage of CAES is efficient (above 80%) if the heat is recovered. The expansion stage is very inefficient and greatly size-dependent. At AzRISE, we are experimenting with different expansion turbines to determine where cost can be improved while increasing efficiency.

72 The Arizona Research Institute for Solar Energy (AzRISE) - APS Final Draft Report, Compressed Air Energy Storage and Photovoltaics Study, University of Arizona, August 2010
Section 6 - Conclusion and Summary of Results The study examined two scenarios for utilizing solar photovoltaics (PV) and CAES. The first was to pick a summer day that represented the largest load for the utility and model the outcome of replacing traditional energy generation sources at peak periods of demand with 4 GW of PV, 3300MW of grid power and 9200 MWh of CAES capacity. The second was to model a 100 MW PV array with 1350 MWh CAES capacity system for daily arbitrage net revenue outcomes compared to two other system configurations; PV and Grid and Grid and CAES for peak shaving. Longest Summer Day We chose a worst-case scenario for these studies and picked August 15 for the demand load. This is a worst-case scenario because the cooling load is still very high, but the PV generation capacity is low due to shorter days and thermal heating of PV panels which reduces efficiency. Studies of CAES + Grid for peak shaving in August show that CAES provides a direct economic benefit if the Natural Gas costs can be reduced by 50%. This is feasible with thermal management that transfers the heat generated in the compression stage to the expansion stage of CAES. Studies at AzRISE will demonstrate this capability in the next year. Studies of CAES +PV +Grid for peak shaving in August show a net saving of cost if the installed PV LCOE drops below $0.10/kWh for PV. Using 2008 Avoided Costs for grid price, the increase in cost for a system-wide peak-shaving with PV and CAES with 50% thermal management per day is listed in the table below as a percentage of the grid price for various PV costs on cents per kilowatt-hour. The CAES cost is fixed at today’s prices. The Avoided Cost grid price system wide for August 15, 2008 was calculated at $8,778,690. (see comment)

73 The Arizona Research Institute for Solar Energy (AzRISE) - APS Final Draft Report, Compressed Air Energy Storage and Photovoltaics Study, University of Arizona, August 2010
PV LCOE $/kWh
Percentage increase
electricity cost ($)
23 43 12,580,76222 40 12,329,62021 37 12,078,47720 34 11,827,33519 31 11,576,19218 29 11,325,05017 26 11,073,90816 23 10,822,76515 20 10,571,62314 17 10,320,48113 14 10,069,33812 11 9,818,19611 8 9,567,05310 6 9,315,9119 3 9,064,7698 0.4 8,813,6267 ‐2.4 8,562,4846 ‐5 8,311,3415 ‐8 8,060,199
(See comment) Values in the table with negative percentage increase show cost benefits from using the PV+CAES approach to cover peak shaving when compared to grid price given by avoided costs. Here, we defer to APS for advice on the best cost comparisons. For example, a more valuable comparison would be to compare the peak-shaving costs to electricity costs from Natural Gas turbines. Daily Arbitrage Model The sales of solar PV power directly to the grid with no storage technology shows an average sales revenue per day of $34,031 based on net avoided cost savings. Performance of the CAES system coupled with the grid shows an average net sales revenue per day of $30,040. The reduced net sales revenue compared with PV and grid performance showing the balance of operating costs associated with CAES. When solar PV is combined with CAES, the average net sales revenue per day is $64,071, almost twice as high as revenue for the PV configuration alone. The net present value (NPV) for the large scale PV system is positive $30.5 million and with CAES is a negative $39.1 million. Improvements in the efficiency of the CAES system so the amount of power used to store energy drops from 0.75 kWh per 1.0 kWh to 0.6 kWh shows a positive NPV of $22.3 million. Further reductions in the cost of acquiring and installing PV
74 The Arizona Research Institute for Solar Energy (AzRISE) - APS Final Draft Report, Compressed Air Energy Storage and Photovoltaics Study, University of Arizona, August 2010
panels, fuel prices rising faster than the general rate of inflation and PV panel efficiency increases will also contribute to improving the NPV of the system. Long-Term Storage If there is flexibility in the amount of time energy can be stored and released from the system over time, it can add $43.4 million of NPV of avoided cost savings for a CAES/grid and PV/CAES/Grid system, the higher avoided cost savings moves PV coupled with CAES to a positive NPV. Examining a storage system that is 10 times larger than the model described above and can store up to 17,550 MWh of electricity with approximately 3 weeks worth of solar PV generation from a 100 MW PV system. Capital costs for CAES rise by a factor of 10, to $2.1 billion. This large scale CAES project has a negative NPV whether it is combined with PV or not. This analysis is based only on avoided cost savings that can be achieved with CAES. It may be that the value associated with CAES would be higher if CAES was used for seasonal storage that allowed APS to avoid the capital cost of a peaker plant that would be used only during seasonal peak periods.
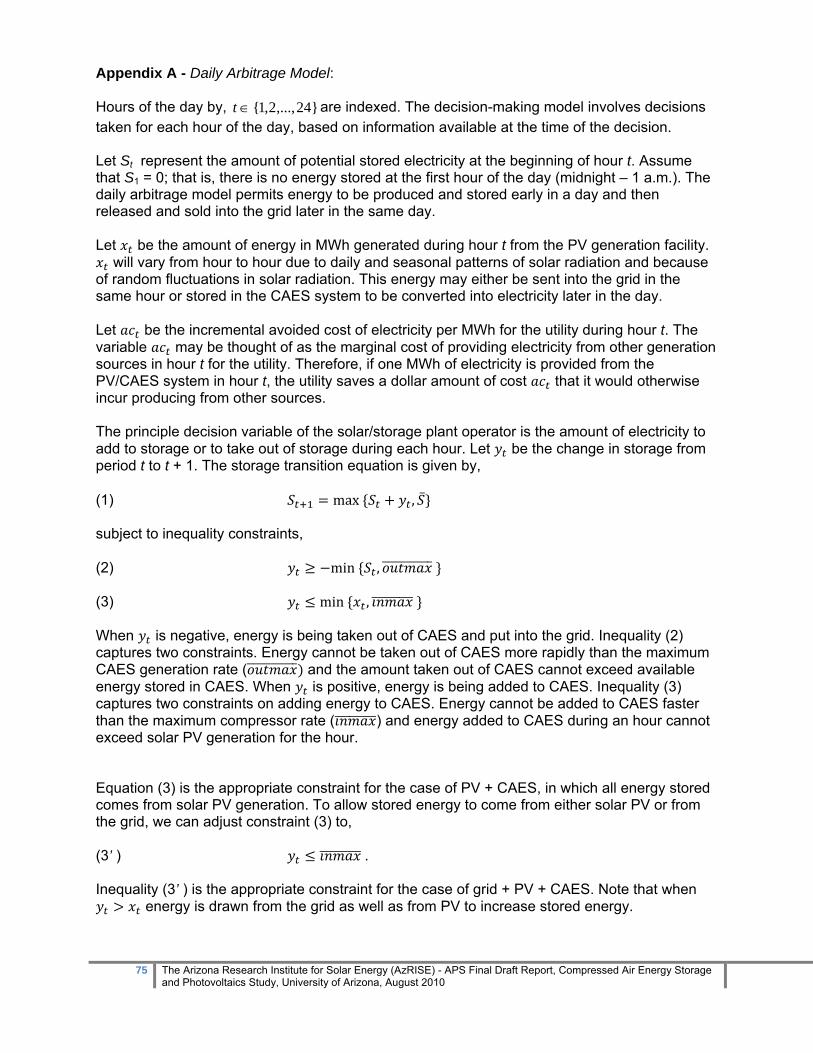
75 The Arizona Research Institute for Solar Energy (AzRISE) - APS Final Draft Report, Compressed Air Energy Storage and Photovoltaics Study, University of Arizona, August 2010
Appendix A - Daily Arbitrage Model: Hours of the day by, }24,...,2,1{∈t are indexed. The decision-making model involves decisions taken for each hour of the day, based on information available at the time of the decision. Let St represent the amount of potential stored electricity at the beginning of hour t. Assume that S1 = 0; that is, there is no energy stored at the first hour of the day (midnight – 1 a.m.). The daily arbitrage model permits energy to be produced and stored early in a day and then released and sold into the grid later in the same day. Let be the amount of energy in MWh generated during hour t from the PV generation facility.
will vary from hour to hour due to daily and seasonal patterns of solar radiation and because of random fluctuations in solar radiation. This energy may either be sent into the grid in the same hour or stored in the CAES system to be converted into electricity later in the day. Let be the incremental avoided cost of electricity per MWh for the utility during hour t. The variable may be thought of as the marginal cost of providing electricity from other generation sources in hour t for the utility. Therefore, if one MWh of electricity is provided from the PV/CAES system in hour t, the utility saves a dollar amount of cost that it would otherwise incur producing from other sources. The principle decision variable of the solar/storage plant operator is the amount of electricity to add to storage or to take out of storage during each hour. Let be the change in storage from period t to t + 1. The storage transition equation is given by, (1) max , subject to inequality constraints, (2) min , (3) min , When is negative, energy is being taken out of CAES and put into the grid. Inequality (2) captures two constraints. Energy cannot be taken out of CAES more rapidly than the maximum CAES generation rate ( and the amount taken out of CAES cannot exceed available energy stored in CAES. When is positive, energy is being added to CAES. Inequality (3) captures two constraints on adding energy to CAES. Energy cannot be added to CAES faster than the maximum compressor rate ( ) and energy added to CAES during an hour cannot exceed solar PV generation for the hour. Equation (3) is the appropriate constraint for the case of PV + CAES, in which all energy stored comes from solar PV generation. To allow stored energy to come from either solar PV or from the grid, we can adjust constraint (3) to, (3’ ) . Inequality (3’ ) is the appropriate constraint for the case of grid + PV + CAES. Note that when
energy is drawn from the grid as well as from PV to increase stored energy.
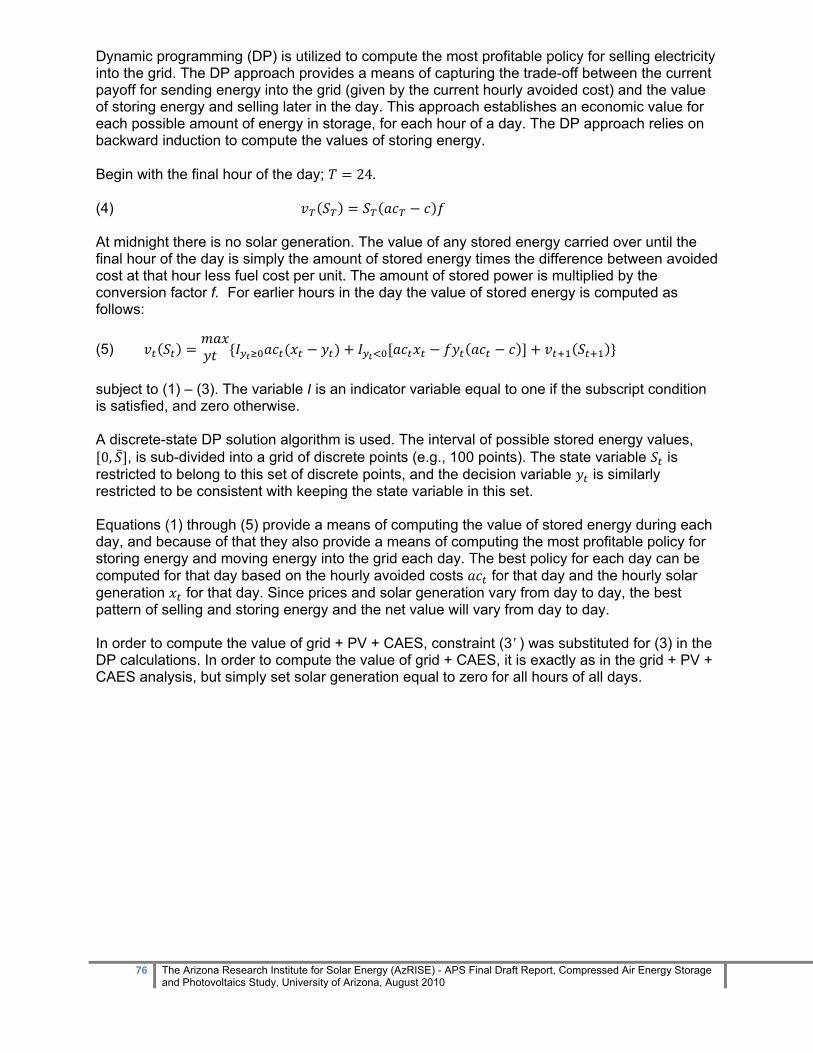
76 The Arizona Research Institute for Solar Energy (AzRISE) - APS Final Draft Report, Compressed Air Energy Storage and Photovoltaics Study, University of Arizona, August 2010
Dynamic programming (DP) is utilized to compute the most profitable policy for selling electricity into the grid. The DP approach provides a means of capturing the trade-off between the current payoff for sending energy into the grid (given by the current hourly avoided cost) and the value of storing energy and selling later in the day. This approach establishes an economic value for each possible amount of energy in storage, for each hour of a day. The DP approach relies on backward induction to compute the values of storing energy. Begin with the final hour of the day; 24. (4) At midnight there is no solar generation. The value of any stored energy carried over until the final hour of the day is simply the amount of stored energy times the difference between avoided cost at that hour less fuel cost per unit. The amount of stored power is multiplied by the conversion factor f. For earlier hours in the day the value of stored energy is computed as follows: (5) subject to (1) – (3). The variable I is an indicator variable equal to one if the subscript condition is satisfied, and zero otherwise. A discrete-state DP solution algorithm is used. The interval of possible stored energy values, 0, , is sub-divided into a grid of discrete points (e.g., 100 points). The state variable is
restricted to belong to this set of discrete points, and the decision variable is similarly restricted to be consistent with keeping the state variable in this set. Equations (1) through (5) provide a means of computing the value of stored energy during each day, and because of that they also provide a means of computing the most profitable policy for storing energy and moving energy into the grid each day. The best policy for each day can be computed for that day based on the hourly avoided costs for that day and the hourly solar generation for that day. Since prices and solar generation vary from day to day, the best pattern of selling and storing energy and the net value will vary from day to day. In order to compute the value of grid + PV + CAES, constraint (3’ ) was substituted for (3) in the DP calculations. In order to compute the value of grid + CAES, it is exactly as in the grid + PV + CAES analysis, but simply set solar generation equal to zero for all hours of all days.

77 The Arizona Research Institute for Solar Energy (AzRISE) - APS Final Draft Report, Compressed Air Energy Storage and Photovoltaics Study, University of Arizona, August 2010
Appendix B – Simulation model description The simulation model works by input of type of resource to be used in meet a given load curve. The load curve can be independently input as a file in the model. The load curve can cover any desired time period. In the studies conducted, we used a 24 hour time period, but entire years can be used as input for longer periods of study. The model adds any desired generation or storage source and conducts simulations to meet any required outcome with predefined constraints. For example, heat rate in and out can be used as constraints. Outcomes can be meeting the demand curve without loss of energy production capacity, or reduction in price, etc. Below, the diagrams show how various variables can be input and controlled by constraints in the model. The model itself is operational without the need to understand the inner workings of the program and can yield output desired output variables selected from a table.
Figure B-1: Model Structures for Flexible Simulation (Case with Grid and CAES)