prepared for cfa society of louisville april 22, 2010
Post on 21-Dec-2015
214 views
TRANSCRIPT

Prepared for
CFA Society of LouisvilleApril 22, 2010

Mary Ellen Stanek, CFA
Chief Investment OfficerBaird Advisors

Just Over a Year Ago…..
3Source: Steve Benson - The Arizona Republic

4Source: Mike Luckovich – The Atlanta Journal-Constitution

Baird Advisors Market OutlookUS Economy: Moderate Recovery with “Significant Restraints”
No “V-shaped” recovery that historically follows a severe recession
Too many “restraints” for US consumer (high unemployment, tight credit, impaired net worth)
Strong profits driving business spending-led recovery
Export-led demand driving US manufacturing output
Additional economic “headwinds” include increased regulation, higher taxes, huge Federal deficits, state/local spending cuts, rising foreclosures
Conditions still remain fragile, susceptible to “shocks” in confidence (i.e. sovereign debt)
Inflation: Modestly Higher Starting in 2011
Core Inflation, at 1-1.5%, still trending lower
Moderate economic growth and high unemployment will give Fed time to reverse policy
Housing Markets: Prices Stabilizing though Foreclosures still Rising
National Home Prices are now flat on a year-over-year basis
Current monthly data shows home prices have risen modestly for eight consecutive months
Rising foreclosures still a concern
Financial markets: Stock and Bond Prices Discounting a Sustainable Economic Recovery
Valuations generally fair with some attractive opportunities
“Easy money” has been made
5

Too Much Debt Created a Credit Bubble
Source: Bloomberg
1952
1955
1958
1961
1964
1967
1970
1973
1976
1979
1982
1985
1988
1991
1994
1997
2000
2003
2006
2009
$0
$5
$10
$15
$20
$25
$30Total Private Sector Debt versus Nominal GDP
Private Sector Debt (Household+Business)
Nominal GDP
Tri
llio
ns (
$)
6

The “Shadow Banking System” of Securitization
Source: Bianco Research
1952
1953
1954
1955
1957
1958
1959
1960
1962
1963
1964
1965
1967
1968
1969
1970
1972
1973
1974
1975
1977
1978
1979
1980
1982
1983
1984
1985
1987
1988
1989
1990
1992
1993
1994
1995
1997
1998
1999
2000
2002
2003
2004
2005
2007
2008
2009
2010
2012
$0
$1
$2
$3
$4
$5
$6
$7
$8
$9
$10
$0
$1
$2
$3
$4
$5
$6
$7
$8
$9
$10
12/31/09$6.76
12/31/09$9.03
The Growth of Securitization vs. Traditional Bank Lending
Time Period
Tri
llio
ns (
$)
Total Securitization(Agency & GSE-Backed Mortgage Pools And
ABS)
Total Banks Loans And Advances(Including Consumer Loans)
7

The Paradox of Deleveraging
If leveraged market participants all deleveraged at once by selling assets:
A negative feedback
loop results
A negative feedback
loop results
8

$0.0 $2.0 $4.0 $6.0 $8.0 $10.0 $12.0 $14.0
Total U.S. Policy Response
Federal Reserve
U.S. Treasury
FDI C & FHA
Trillions ($)
Poli
cy R
esponse
Already Spent
Maximum Commitment
Spent, Lent or Guaranteed:Massive U.S. Policy Response
Note: Data as of 12/31/09Sources: Bloomberg, WSJ, Bianco Research
Total 2009 U.S. GDP = $14.5 Trillion
9

Today’s Massive U.S. Policy Response in Historical Context
World War IIOriginal Cost: $288 BillionToday’s Cost: $3.6 Trillion
Source: United States National Archives and Records Administration 10

Today’s Massive U.S. Policy Response in Historical Context
Notes: Fiscal = The Federal Budget Deficit as a % of GDP Monetary = Cumulative Change in the Fed’s Balance SheetSource: Bianco Research
What U.S. Government Did – And Didn’t DoLast 13 Recessions
Length GDP Stimulus as a % of GDP
Peak Trough (Months) Change Monetary Fiscal Combined
Aug-’29 Mar-’33 44 -27.0% 3.4% 4.9% 8.3%
May-’37 Jun-’38 13 -3.4% 0.0% 2.2% 2.2%
Nov-’48 Oct-’49 11 -1.7% -2.2% 5.5% 3.3%
Jul-’53 May-’54 10 -2.7% 0.0% -1.4% -1.4%
Aug-’57 Apr-’58 8 -3.2% 0.0% 3.2% 3.2%
Apr-’60 Feb-’61 10 -1.0% 0.7% 1.0% 1.7%
Dec-’69 Nov-’70 11 -0.2% 0.3% 2.4% 2.7%
Nov-’73 Mar-’75 16 -3.1% 0.9% 3.1% 4.0%
Jan-’80 Jul-’80 6 -2.2% 0.4% 1.1% 1.5%
Jul-’81 Nov-’82 16 -2.6% 0.3% 3.5% 3.8%
Jul-’90 Mar-’91 8 -1.3% 1.0% 1.8% 2.8%
Mar-’01 Nov-’01 8 -0.2% 1.3% 5.9% 7.2%
Dec-’07 ??? 28 -3.8% 18.0% 11.9% 29.9%
11

Short Term Economic Stimulus "Sugar High”
Cash for Clunkers Program Just EndedFirst-time Home Buyers Credit Ending 12/1
Depleted Inventories Being RebuiltSource: Dave Granlund, RE/MAX, and Petar Jankov 12

Bailout “Traffic Jam”
Source: Steve Sack – Minneapolis Star Tribune 13
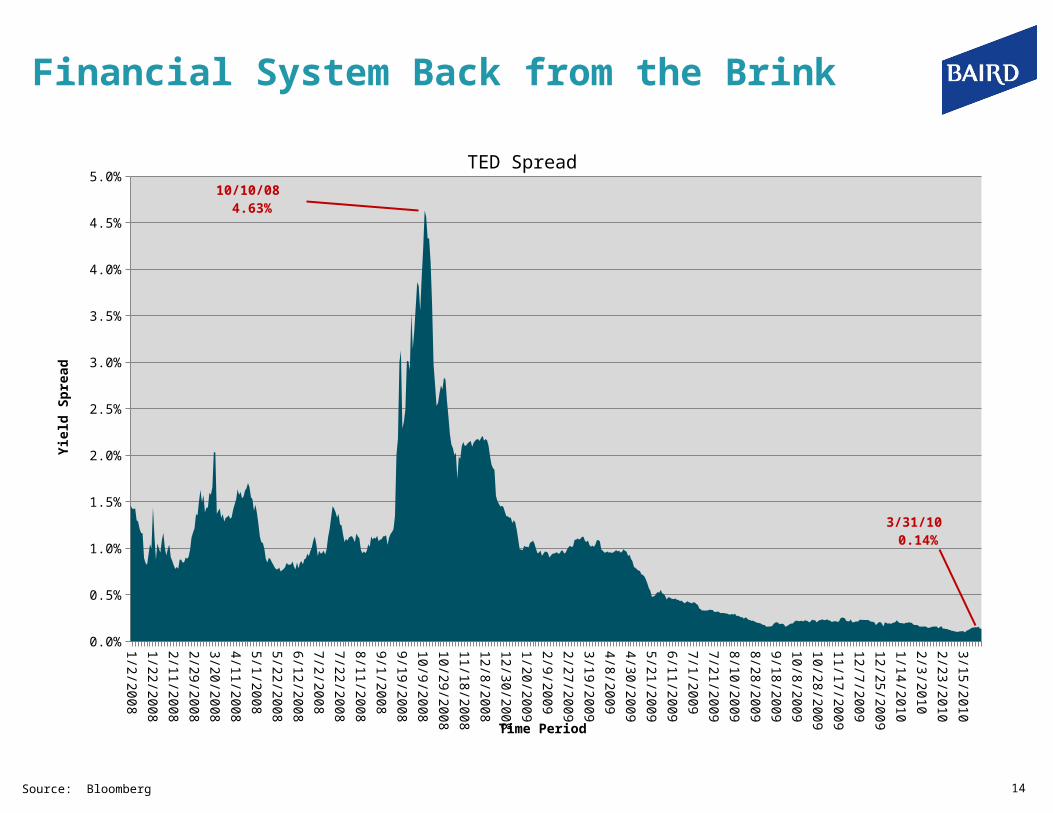
Financial System Back from the Brink
Source: Bloomberg
Dec-0
7Ja
n-0
8Ja
n-0
8Fe
b-0
8Fe
b-0
8M
ar-0
8M
ar-0
8A
pr-0
8A
pr-0
8M
ay-0
8M
ay-0
8Ju
n-0
8Ju
n-0
8Ju
l-08
Jul-0
8A
ug-0
8A
ug-0
8Sep-0
8Sep-0
8O
ct-08
Oct-0
8N
ov-0
8N
ov-0
8D
ec-0
8D
ec-0
8Ja
n-0
9Ja
n-0
9Fe
b-0
9Fe
b-0
9M
ar-0
9M
ar-0
9A
pr-0
9A
pr-0
9M
ay-0
9M
ay-0
9Ju
n-0
9Ju
n-0
9Ju
l-09
Jul-0
9A
ug-0
9A
ug-0
9Sep-0
9Sep-0
9O
ct-09
Oct-0
9N
ov-0
9N
ov-0
9D
ec-0
9D
ec-0
9Ja
n-1
0Ja
n-1
0Fe
b-1
0Fe
b-1
0M
ar-1
0M
ar-1
0
0.0%
0.5%
1.0%
1.5%
2.0%
2.5%
3.0%
3.5%
4.0%
4.5%
5.0%TED Spread
Time Period
Yie
ld S
pre
ad
10/10/08 4.63%
3/31/10 0.14%
14

Overall Leverage “Shift” from Private to Public
Source: Federal ReserveData as of: 12/31/09
1978
1979
1980
1981
1982
1983
1984
1985
1986
1987
1988
1989
1990
1991
1992
1993
1994
1995
1996
1997
1998
1999
2000
2001
2002
2003
2004
2005
2006
2007
2008
2009
0%
20%
40%
60%
80%
100%
120%
Business (Finance) Household Government
Time Period
U.S
. D
ebt
as a
Perc
enta
ge o
f G
DP
U.S. Debt as a Percentage of GDP
15

Trillion Dollar Deficits as Far as the Eye can See?
Source: Bianco Research
1968
1969
1970
1971
1972
1973
1974
1975
1976
1977
1978
1979
1980
1981
1982
1983
1984
1985
1986
1987
1988
1989
1990
1991
1992
1993
1994
1995
1996
1997
1998
1999
2000
2001
2002
2003
2004
2005
2006
2007
2008
2009
2010
2011
2012
-$1,650
-$1,500
-$1,350
-$1,200
-$1,050
-$900
-$750
-$600
-$450
-$300
-$150
$0
$150
$300
-$1,650
-$1,500
-$1,350
-$1,200
-$1,050
-$900
-$750
-$600
-$450
-$300
-$150
$0
$150
$300
1983-199.01 1992
-332.08
Apr-01$277.66
Apr-04-454.57
2007-169.65
2010 -1,479.33
Federal Budget Deficit/Surplus(Rolling 12-Month Sum)
Time Period
Billions($
)
Blue = Actual Red = CBO's March Forecast
16

Government Debt to GDP Growing Sharply
Source: Bianco Research
1791
1796
1801
1806
1811
1816
1821
1826
1831
1836
1841
1846
1851
1856
1861
1866
1871
1876
1881
1886
1891
1896
1901
1906
1911
1916
1921
1926
1931
1936
1941
17167
18993
20820
22646
24472
26298
28125
29951
31777
33603
35430
37164
38990
40816
42643
44469
0%
10%
20%
30%
40%
50%
60%
70%
80%
90%
100%
110%
120%
130%
0%
10%
20%
30%
40%
50%
60%
70%
80%
90%
100%
110%
120%
130%Total Federal Debt To GNP/GDP
Time Period
Civil WarWW1
WW2116%
1791 to 1928 = GNP1929 to 2010 = GDP
2010 - 2020 Pro-jections
17

Nominal GDP: Today versus Great Depression
2006 2007 2008 2009 201013000
13200
13400
13600
13800
14000
14200
14400
14600
14800
1927 1929 1931 1933 1935 1937 1939 194150
60
70
80
90
100
110
120
130
Source: ISI
2 Years to Recover
12 Years to Recover
Nom
inal
GD
P (
$)
18

It’s All About Confidence
Source: Walt Handelsman - Newsday 19

Consumers Saving More, Spending Less
Source: BEA, Federal ReserveData as of: 3/31/10
19
80
19
82
19
84
19
86
19
88
19
90
19
92
19
94
19
96
19
98
20
00
20
02
20
04
20
06
20
08
20
10
-10%
-5%
0%
5%
10%
15%
20%
US Personal Savings Rate Consumer Credit Outstanding
Time Period
Year-
over-
Year
% C
hange
20

A Very Weak Employment Picture
Source: BLSData as of: 3/31/10
1984 1989 1994 1999 2004 200933.0
33.5
34.0
34.5
35.0
35.5
36.0
2.0%
4.0%
6.0%
8.0%
10.0%
12.0%
14.0%
16.0%
18.0%
US Average Weekly Hours (LHS) US Unemployment Rate (RHS) US Underemployment Rate (RHS)
Time Period
Hours
Perc
enta
ge (%
)
21

Household Net Worth Still 40% Below 2006-2007 Peak
Source: Bianco ResearchData as of: 12/31/09
1952
1953
1954
1955
1957
1958
1959
1960
1962
1963
1964
1965
1967
1968
1969
1970
1972
1973
1974
1975
1977
1978
1979
1980
1982
1983
1984
1985
1987
1988
1989
1990
1992
1993
1994
1995
1997
1998
1999
2000
2002
2003
2004
2005
2007
2008
2009
2010
$0
$1
$2
$3
$4
$5
$6
$7
$8
$9
$10
$11
$12
$13
$14
$0
$1
$2
$3
$4
$5
$6
$7
$8
$9
$10
$11
$12
$13
$14
Equity in Household Real Estate Versus Direct Stock Ownership
Time Period
Tri
llio
ns (
$)
Equity in Household Real Estate Direct Stock Ownership
22

Home Prices Fall for the First Time Since 1932
Note: Data as of 1/31/10Source: Bianco Research
1891
1894
1897
1900
1903
1906
1909
1912
1915
1918
1921
1924
1927
1930
1933
1936
1939
1942
1945
1948
1951
1954
1957
1960
1963
1966
1969
1972
1975
1978
1981
1984
1987
1990
1993
1996
1999
2002
2005
2008
-25%
-20%
-15%
-10%
-5%
0%
5%
10%
15%
20%
25%
30%
35%
40%
-25%
-20%
-15%
-10%
-5%
0%
5%
10%
15%
20%
25%
30%
35%
40%
1900-9.79% 1914
-12.78%
1921-19.81%
1932-22.02%
194719.47%
200414.60%
Case-Shiller Nominal Home Price IndexAnnual Change
Time Period
Annual C
hange
-0.7% Year-over-year-29.63% since 7/06 peak
23

National Home Prices May Have Bottomed
Source: Bloomberg
U.S. House Price Index (Case-Shiller) M/M% Seasonally Adjusted
2000
2001
2002
2003
2004
2005
2006
2007
2008
2009
-2.5
-2.0
-1.5
-1.0
-0.5
0.0
0.5
1.0
1.5
2.0
Time Period
24

Mortgage Payments Relative to Income Near Record Low
Source: ISI
78 80 82 84 86 88 90 92 94 96 98 00 02 04 06 0810
15
20
25
30
35
40
45
Time Period
Month
ly M
ort
gage P
aym
ents
as a
% o
f M
onth
ly M
edia
n I
ncom
e
12/31/0916.6%
25

Source: ISI
Strong Profits Drive Business Spending-Led Recovery
26
1992
1993
1994
1995
1996
1997
1998
1999
2000
2001
2002
2003
2004
2005
2006
2007
2008
2009
-30
-20
-10
0
10
20
30
40
Time Period
U.S. Corporate Profits
12/31/093.6%

Source: ISI
Exports-Led U.S. Recovery
27
2000
2001
2002
2003
2004
2005
2006
2007
2008
2009
2010
-50
-40
-30
-20
-10
0
10
20
30
40
Time Period
U.S
. R
eal G
oods E
xport
s 3
Mo.
Annual R
ate
2/28/1019.52%
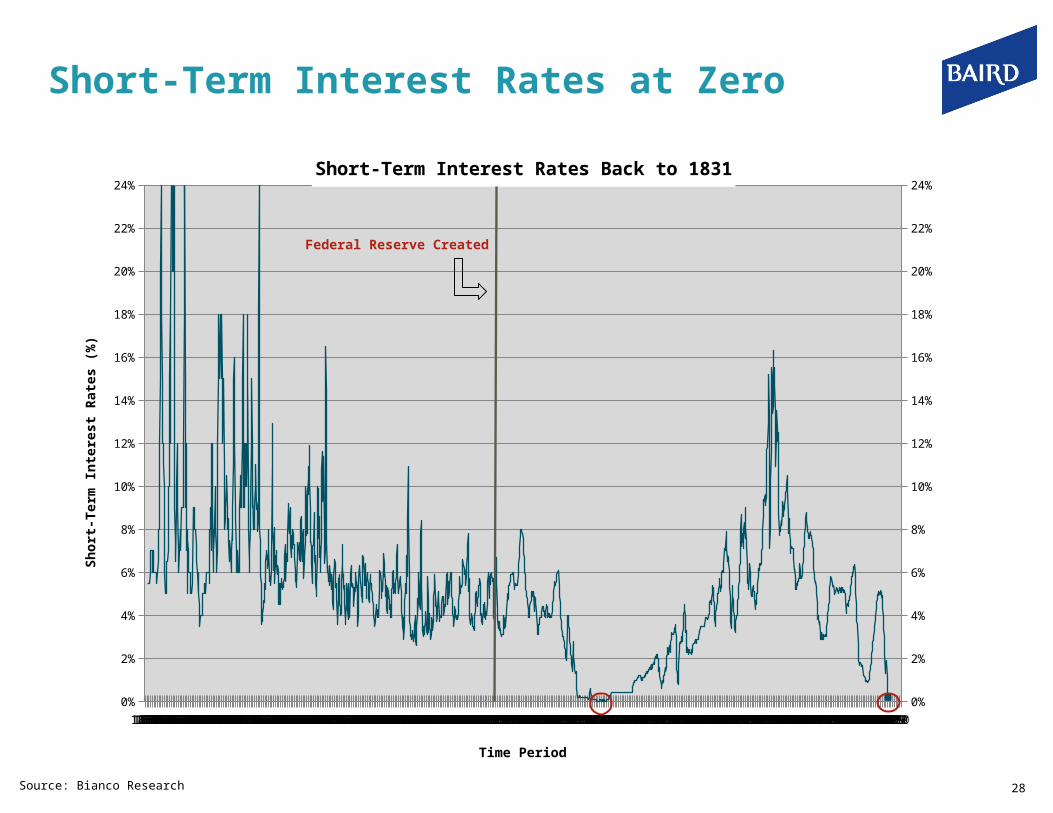
Short-Term Interest Rates at Zero
Source: Bianco Research
183018301831183118311832183218331833183318341834183518351836183618361837183718381838183818391839184018401841184118411842184218431843184318441844184518451846184618461847184718481848184818491849185018501851185118511852185218531853185318541854185518551856185618561857185718581858185818591859186018601861186118611862186218631863186318641864186518651866186618661867186718681868186818691869187018701871187118711872187218731873187318741874187518751876187618761877187718781878187818791879188018801881188118811882188218831883188318841884188518851886188618861887188718881888188818891889189018901891189118911892189218931893189318941894189518951896189618961897189718981898189818991899190019001901190119011902190219031903190319041904190519051906190619061907190719081908190819091909191019101911191119111912191219131913191319141914191519151916191619161917191719181918191819191919192019201921192119211922192219231923192319241924192519251926192619261927192719281928192819291929193019301931193119311932193219331933193319341934193519351936193619361937193719381938193819391939194019401941194119411942194219431943194319441944194519451946194619461947194719481948194819491949195019501951195119511952195219531953195319541954195519551956195619561957195719581958195819591959196019601961196119611962196219631963196319641964196519651966196619661967196719681968196819691969197019701971197119711972197219731973197319741974197519751976197619761977197719781978197819791979198019801981198119811982198219831983198319841984198519851986198619861987198719881988198819891989199019901991199119911992199219931993199319941994199519951996199619961997199719981998199819991999200020002001200120012002200220032003200320042004200520052006200620062007200720082008200820092009201020100%
2%
4%
6%
8%
10%
12%
14%
16%
18%
20%
22%
24%
0%
2%
4%
6%
8%
10%
12%
14%
16%
18%
20%
22%
24%Short-Term Interest Rates Back to 1831
Time Period
Short
-Term
Inte
rest
Rate
s (
%)
Federal Reserve Created
28

Corporate Spreads have Narrowed Sharply
Source: Barclays Capital
Investment Grade
High Yield
1989
1990
1991
1992
1993
1994
1995
1996
1997
1998
1999
2000
2001
2002
2003
2004
2005
2006
2007
2008
2009
0
100
200
300
400
500
600
700
Basis
Poin
ts (
bps)
1994
1995
1996
1997
1998
1999
2000
2001
2002
2003
2004
2005
2006
2007
2008
2009
200
500
800
1100
1400
1700
2000
Basis
Poin
ts (
bps)
29

Source: Bloomberg
Very Steep Treasury Yield Curve
1 3 5 7 10 15 20 25 300%
1%
2%
3%
4%
5%
Mar 31, 2010Dec 31, 2009Dec 31, 2008
Maturity
Yie
ld
Maturity Dec 31, 2008 Dec 31, 2009 Mar 31, 2010 Q1 Change
1 0.34% 0.44% 0.38% -0.06
2 0.76% 1.14% 1.02% -0.12
3 0.97% 1.68% 1.58% -0.10
5 1.55% 2.68% 2.56% -0.12
7 1.73% 3.38% 3.28% -0.10
10 2.21% 3.84% 3.83% -0.01
30 2.68% 4.64% 4.72% 0.08 30

How Steep? An Historical Context
Source: BloombergData as of: 3/31/10
1985
1987
1989
1991
1993
1995
1997
1999
2001
2003
2005
2007
2009
-100
0
100
200
300
400
Time Period
U.S
. 10-Y
ear
Tre
asury
Yie
ld m
inus U
.S.
3 M
onth
T-B
ill Yie
ld
31
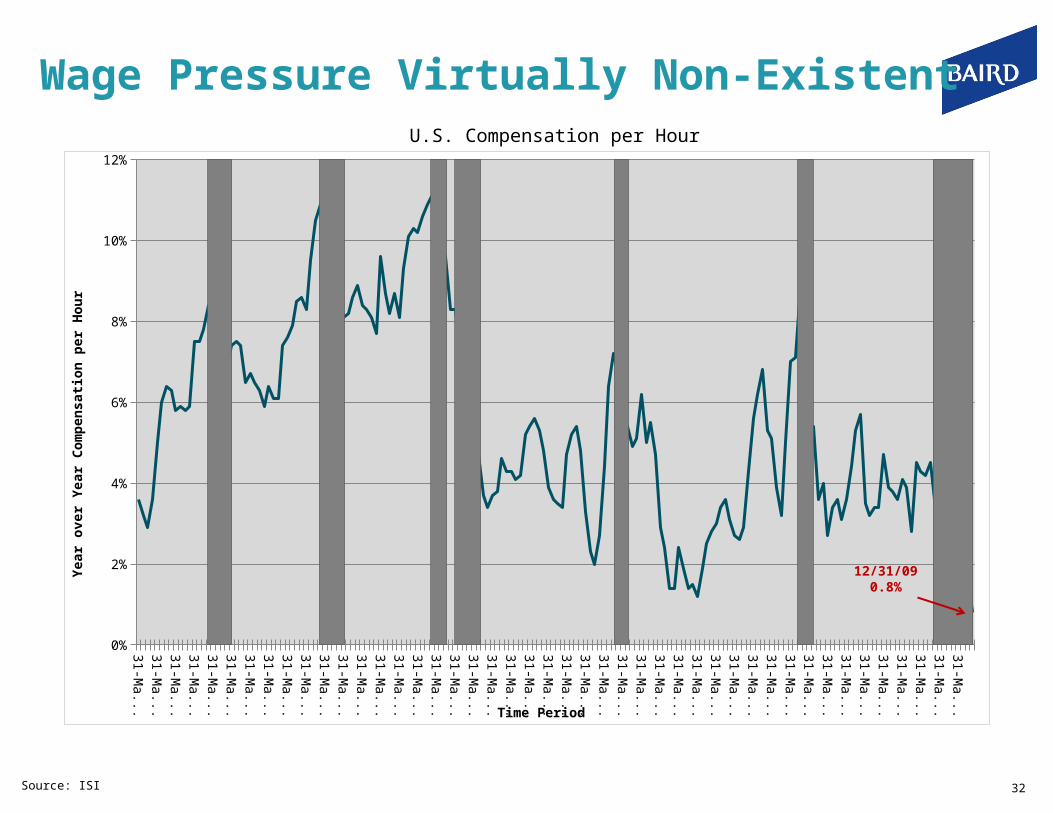
Wage Pressure Virtually Non-Existent
Source: ISI
1965
1970
1975
1980
1985
1990
1995
2000
2005
0%
2%
4%
6%
8%
10%
12%
Time Period
Year
over
Year
Com
pensati
on p
er
Hour
12/31/090.8%
U.S. Compensation per Hour
32

Not Business as UsualSpread Volatility Goes to Extremes
Source: Barclays Capital
Option-Adjusted Spreads (bps)Excess Returns v.s. U.S. Treasuries (bps)
12/31/2007 12/31/2008 12/31/2009 3/31/201010 yr Avg
OAS 2008 2009YTD2010
U.S. Aggregate Index 91 213 61 51 75 -710 746 78
U.S. Agency (non-mortgage) Sector 43 93 30 24 43 -110 238 25
Mortgage and ABS Sectors
U.S. Agency Pass-Throughs 87 145 18 20 39 -232 495 69
Asset-Backed Securities 242 955 100 68 158 -2223 2496 133
CMBS 170 1010 473 323 208 -3274 2960 795
Corporate Sectors
U.S. Investment Grade 198 555 172 150 175 -1988 2276 114
Industrial 181 500 138 126 172 -1756 2312 80
Utility 189 537 161 144 178 -2039 2780 93
Financial Institutions 220 629 226 186 179 -2209 2141 171
U.S. High Yield 569 1669 617 570 617 -3832 5955 350
33

Too Many Treasuries/Too Little Foreign Demand
Source: Bianco Research
2002
2002
2003
2003
2003
2003
2004
2004
2004
2004
2005
2005
2005
2005
2006
2006
2006
2006
2007
2007
2007
2007
2008
2008
2008
2008
2009
2009
2009
2009
2010
-50%
0%
50%
100%
150%
200%
250%
300%
-50%
0%
50%
100%
150%
200%
250%
300%
2007260%
109%
41%
24%21%
30%
200727%
23%
6%
Percentage of Treasury Issuance Bought by Non-U.S. Investors
Time Period
Tre
asury
Issuance (
%)
Blue = All ForeignersRed = China
34

Positive Supply/Demand Market Conditions
Strong demand: Investors increasing bond allocations after crisis Higher tax rates universally expected Money market yields near 0% driving investors out the yield curve
Limited Supply: Tax-exempt supply has been significantly reduced because of the taxable
“Build America” bonds program
Negative Credit Fundamentals
Tax revenue collections experiencing sharp declines Huge structural budget deficits difficult to close Rating agency downgrade risk high for many municipal issuers
Municipal Market Outlook
35

U.S. state governments
40% of revenues for US states come from personal income taxes
Personal income tax revenues dropped by more than 25% compared to the prior year in early 2009
33% of revenues for US states come from sales taxes
Sales tax revenue fell by up to 10% during certain quarters of 2009
Federal aid paid directly to states for operations through 2010 equate to roughly 6% of state monthly spending.
In aggregate, state budget shortfalls for 2010 and 2011, represent an estimated 15% of state general fund operation budgets.
Local governments
On average, property taxes account for 72% of local tax revenue.
State aid, which is particularly vulnerable for local govt’s in: CA, MI, NJ, OH, MN, NY and VA
Source: Moody’s
Municipal Tax Revenues Soften
26
Bloomberg: “U.S. state and local government tax revenues fell 6.7% as of September from a year earlier, marking the fourth consecutive quarter of decline.” 36

Treasury/Muni Yield Curves
*Assumes 30% Federal Income Tax RateSource: BloombergData as of: 3/31/2010
1 2 3 5 7 10 15 20 25 300.0%
1.0%
2.0%
3.0%
4.0%
5.0%
Treasury
AAA Municipal
Maturity
Yie
ld
Maturity TreasuryAAA
Municipal Ratio %Tax-Adjusted
Municipal Yield*
1 0.38% 0.32% 84 0.46%
2 1.02% 0.79% 77 1.13%
3 1.58% 1.10% 70 1.57%
5 2.56% 1.77% 69 2.53%
7 3.28% 2.52% 77 3.60%
10 3.83% 3.09% 81 4.41%
30 4.72% 4.17% 88 5.96%
37

Changing Landscape in Municipal Credit
Source: Walt Handelsman - Newsday 38

Baird Advisors Investment Outlook:
Patience was rewarded in 2009 with additional outperformance expected in 2010
“Super Sale” over though finding selective opportunities
Portfolio yield advantage over benchmark still historically wide
Current prices on select securities are still below fundamental fair value
Unprecedented market volatility and dislocation subsiding
Attractive value in financials and selective mortgage-backed and asset-backed securities
Improved liquidity profile, less leverage and a very steep yield curve benefit financials
Selective opportunities in senior classes of asset-backed and mortgage-backed securities
Risk control discipline critical in a higher risk environment
Experienced investment team and risk controlled process key to strategy’slong-term success
39