prepared for difficult market - 2008 preliminary results – - 2009 budget -
TRANSCRIPT

Prepared for Difficult Market
- 2008 Preliminary Results –- 2009 Budget -

• Market Overview
• Network Evolution
• 2008 Preliminary Financial Results
• 2009 Budget
Table of Content
- 3 -
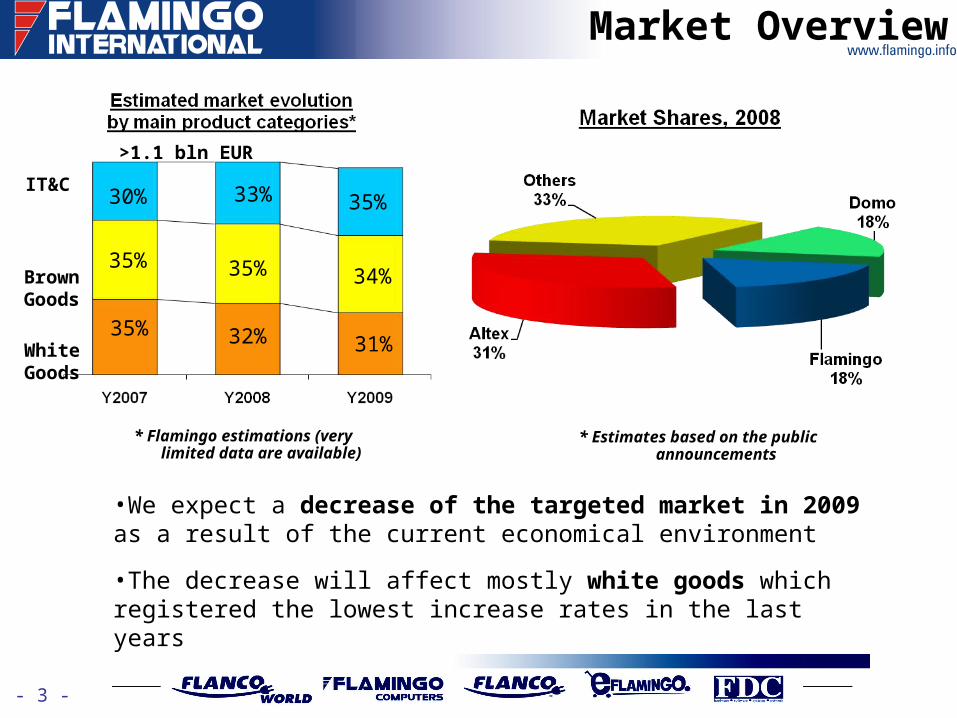
Market Overview
* Flamingo estimations (very limited data are available)
>1.1 bln EUR
30%
35%
35%
33% 35%
35% 34%
32% 31%
IT&C
Brown Goods
White Goods
•We expect a decrease of the targeted market in 2009 as a result of the current economical environment
•The decrease will affect mostly white goods which registered the lowest increase rates in the last years
* Estimates based on the public announcements

Network Evolution
- 4 -
•Constant strategy in the last 3 years to focus on large surface concept
•Simplified retail model (higher surface but lower number of stores)
•Optimized costs per sqm resulting from larger surfaces opened
NSA – net selling area

- 5 -
2008 Preliminary Financial Results

- 6 -
Flamingo in 2008
SalesSales
• In 2008 we reached the sales budget - the retail activity (which generates the higher margins) being at -13% vs. budget (annual base) mainly as a result of Q4 evolution when retail sales decreased with 25% but compensated by wholesale over performance
• Sales on credit were strongly influenced by the new regulations implemented by the National Bank starting from September ’08
• Some openings were postponed or even canceled causing a gap between actual and budgeted NSA counting ~ 10,000 sqm
Gross ProfitGross Profit
• Lower margins as wholesale share increased on group level (33% from group’s turnover vs. 23% budgeted)
• Decreased retail margin mainly in Q4 as a result of focusing on the stock rotation improvement and decreasing old inventory share, as well as tough competition in a fast decreasing targeted market
• Increased marketing expenses in Q4 2008

- 7 -
Flamingo in 2008
Other IncomesOther Incomes
• Lower sales brought lower acquisitions and lower suppliers’ and marketing contributions
• Exchange rates volatility generated an increased financial cost vs. budgeted and influenced negatively the rents level
• Special campaigns for sales on credit (including DAE 0%) together with lower sales on credit brought discounted levels in consumer credit fees
Net ImpactNet Impact
• Preliminary consolidated results show an operational break even plus to be registered in 2008
• The increased financial expenses resulting from F/X volatility led to a negative net result in 2008
- 8 -
Actions taken
2008 Measures
• Immediate cost cuttingImmediate cost cutting where possible
• Tight cost controlTight cost control under direct CFO supervising
• Strong and fast product acquisition controlStrong and fast product acquisition control with direct supervising of Operations Director, Sales Director Retail and CFO
• Tight inventory controlTight inventory control to deliver improved inventory rotation with yearend inventory below 2007 with +20% higher NSA
• Closer and proactive work with our banks
• Cash-flow is the strong driver of all activitiesCash-flow is the strong driver of all activities

- 9 -
+69%
Sales Evolution ‘08
+4% -4% -13%
-25%
-13%
+81% +51% -22%
+36%
% = actual vs. budget
+23% +15% +5%
-24%
-1.5%
• impact on Retail started in Q3• strong impact on both, Retail and
Wholesale in Q4

P&L Indicators
- 10 -
INDICATOR (k RON) 2008 Preliminary 2008 Budget Diff 2007 Actual Diff
Total Sales 748,008 758,000 -1.3% 585,266 27.8%Retail 501,805 578,000 -13.2% 413,158 21.5%Wholesale 246,202 180,000 36.8% 172,108 43.1%
Cost of Sales -670,314 -666,710 0.5% -511,716 31.0%
Gross Profit 77,694 91,290 -14.9% 73,550 5.6%
Operating Expenses incl. HQ -111,058 -110,120 0.9% -90,237 23.1%Other incomes 33,487 45,920 -27.1% 39,530 -15.3%
EBITDA 123 27,090 -99.5% 22,843 N/M
Depreciation -10,665 -10,780 -1.1% -10,078 5.8%
EBIT -10,541 16,310 N/M 12,765 N/M
NET RESULT -37,646 9,350 N/M 2,808 N/M
The results are still to be audited

- 11 -
2009 Budget

- 12 -
2009 Budget
Assumptions:Assumptions:
• Targeted Market - we prepared the budget considering a low market in 2009 (decreasing in comparison with 2008)
• Stores evolution – we will keep almost a constant level in terms of sqm
• Wholesale Activity – focus on developing direct sales using also web support
• Operational Costs – optimized to the current market situation
Our Goals:Our Goals:
Group Sales 2009 ~ 600 mil RON
Operational costs decrease with at least 20% vs. 2008
Positive EBITDA
Positive break even in terms of net result

2009 Consolidated Budget
- 13 -
INDICATOR (k RON) Q1 Q2 Q3 Q4 Y 2009 % totalY 2008
Preliminary% total
Variance YoY
Total Sales 97,200 102,900 128,600 277,400 606,100 100.0% 748,008 100.0% -141,908Retail 67,900 87,300 114,600 231,900 501,700 82.8% 501,805 67.1% -105Wholesale 29,300 15,600 14,000 45,500 104,400 17.2% 246,202 32.9% -141,802
Cost of Sales -86,400 -86,800 -107,100 -230,800 -511,100 -84.3% -670,314 -89.6% -159,214
Gross Profit 10,800 16,100 21,500 46,600 95,000 15.7% 77,694 10.4% 17,306
Operating Expenses incl. HQ -24,600 -16,200 -14,200 -17,900 -72,900 -12.0% -111,058 -14.8% -38,158Other incomes 3,200 5,000 8,000 9,100 25,300 4.2% 33,487 4.5% -8,187
EBITDA -10,600 4,900 15,300 37,800 47,400 7.8% 123 0.0% 47,277
Depreciation -2,700 -2,700 -2,700 -2,800 -10,900 -1.8% -10,665 -1.4% 235
EBIT -13,300 2,200 12,600 35,000 36,500 6.0% -10,541 -1.4% 47,041
NET RESULT -23,000 -4,200 7,400 29,800 10,000 1.6% -37,646 -5.0% 47,646

- 14 -
Strategy 2009 - 2010
Our strategy remains the same, we only postpone its execution Our strategy remains the same, we only postpone its execution about 1-2 years because of current global environment. about 1-2 years because of current global environment.
Priorities:
• Improve margins across all categoriesImprove margins across all categories
• Decrease range of products, stock level and rotation daysDecrease range of products, stock level and rotation days
• Reduce number of suppliers and prioritize those offering us better Reduce number of suppliers and prioritize those offering us better conditions conditions
• Freeze new openings except selected opportunitiesFreeze new openings except selected opportunities
• Tight cost control in all activitiesTight cost control in all activities
• Speed up e-commerce in order to cover fast growing market segmentSpeed up e-commerce in order to cover fast growing market segment
• All activities driven by cash-flowAll activities driven by cash-flow

- 15 -
Q&AQ&A